Let's chat! When’s a good time?

Thank you! Your submission has been received!
Oops! Something went wrong while submitting the form.


.webp)

There’s no doubt that B2B sales is increasingly being conducted in a methodical, scientific manner. Using a wide range of metrics and KPIs, this data-driven sales process ensures minimal revenue leakage and optimized pipeline performance. You may have heard of a few common sales metrics: customer acquisition cost, customer lifetime value, average revenue per user, etc.
This article focuses on a lesser known, yet enormously important metric to monitor & improve the overall health of sales: pipeline velocity. Let’s explore everything you need to know about pipeline velocity; what it is, how to calculate it, and most importantly, how to improve it.
In short, pipeline velocity is the speed at which qualified opportunities move through the sales pipeline.
In other words, pipeline velocity is used to measure how quickly leads are being converted into paying customers. This helps understand the efficiency of the sales process and identify areas of improvement.
Think of a literal pipeline: if it’s chock-full of debris and leaks, the flow of water will be limited and inefficient. On the other hand, if it’s squeaky clean, a large volume of water can flow uninterrupted at maximum speed.

Similarly, a high-velocity sales pipeline results in a consistent, voluminous flow of leads and ultimately, revenue. You can see why it’s so important to keep track of this metric.
Pipeline velocity is calculated using 4 other metrics:
Here’s the most commonly accepted pipeline velocity formula:
Pipeline velocity = (Opportunities x average deal size x average win rate) ÷ length of average sales cycle (in days)

Let’s take an example. Say we have 60 qualified opportunities at various stages along the pipeline. The average deal size of these opportunities is $5000. Historically, we’ve observed a win rate of 20% and sales cycles of around 30 days. Accordingly, our pipeline velocity may be calculated as follows:
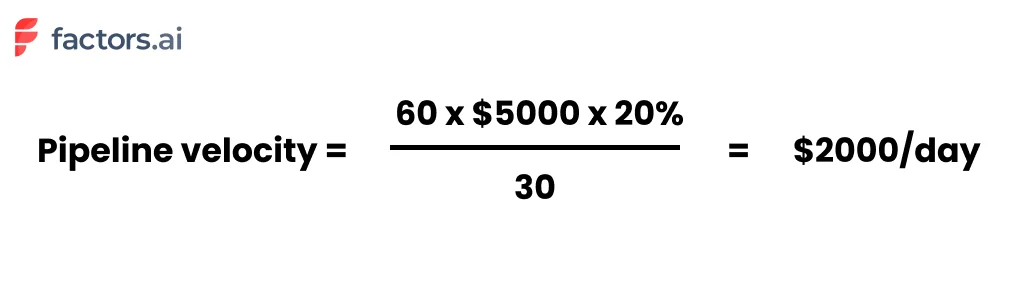
Extrapolating this, we arrive at a figure of $2000/day x 30 days for $60,000 per month.
You may notice from the pipeline velocity formula that there are a few ways to improve pipeline velocity:
Each variable is a lever that may be pulled to ramp up pipeline velocity. Of course, the most obvious way is to increase the number of opportunities/leads and deal size (easier said than done!). That being said, improving the buyer experience is a low-hanging fruit that results in dramatic improvements in win rates and quicker sales cycles.
But what makes improving the pipeline velocity so important anyway? Here are a few benefits of tracking and optimizing pipeline velocity:
As HubSpot’s director of sales, Dan Tyre, puts it:
“Sales managers live in fear that their pipeline is a bunch of fluff. In today’s world of instant gratification, uncovering a sense of urgency and establishing sales pipeline velocity is important because it uncovers a slow-moving, or worse, stagnant pipeline”.
Understanding your pipeline velocity helps keep tabs on the overall health of your sales pipeline. By knowing what works and what needs improvement, you can bring iterative, targeted changes to the sales engine. More revenue, less costs — win, win!
Measuring your pipeline velocity on a regular basis helps with accurate sales forecasting. For instance, taking the previous example, we have a pipeline velocity of $2000 per day, which can be expanded to $60,000 per month or $180,000 for the quarter. Using pipeline velocity is accurate as it’s based on real-time sales data, not estimates.
A powerful use-case is realized when pipeline velocity is used in tandem with attribution modeling. Picture this: each of your pipeline sources, broken down by qualified opportunities, deal size, win rate, and of course, pipeline velocity:
In combination with attribution, pipeline velocity can provide valuable insight into the most effective channels — which in turn can help guide marketing decisions and resource allocation. In this case, we see that even though paid social brings in more opportunities, it’s paid search that results in the most ROI given its larger deal size and better win rate.
Pipeline velocity itself varies significantly based on the nature and size of the company in question. Instead, here’s a breakdown of the benchmark of length of sales cycles in SaaS
Length of sales cycle:
Depending on the nature of your business, your win rate should be anywhere from 5-20%. Of course, the number of opportunities and deal size is specific to your product, marketing & sales efforts. It wouldn’t make sense to maintain or refer to benchmarks in this case.
In short, improving pipeline velocity involves eliminating points of friction along the customer journey and aligning workflows and stakeholders to ensure smooth sailing. Here are a few tactics and strategies to do so:
Your website is a goldmine of hidden opportunities in the form of yet-to-be-converted accounts. Use an IP-based account intelligence tool (like Factors) to reveal anonymous accounts already engaging with your website, review pages, and ad campaigns.
Given that these accounts are already familiar with your brand, they’re far more likely to convert: thereby increasing your “number of opportunities” and “win-rate”.
As companies increasingly move towards product-led growth, it’s becoming all the more important to show, not tell. While not all products (especially those at early stages) can adopt PLG models, it’s really quite simple and effective to put up an interactive product tour on your website. This gives visitors a chance to know a little more about your work before choosing to book a demo, rather than having to go in blind.
{{CTA_BANNER}}
Again, this likely increases the number of opportunities, reduces average sales cycle length, and improves your win rate.
There’s no doubt that sales demos and discovery calls are important. But more often than not, buyers don’t have the time to sit through another 30-min. Make life easier for your sales reps, CS team, and of course, the customers themselves by introducing comprehensive documentation on everything they might need to know.
Use-cases, How-tos, Implementation, etc, etc, etc should be easily accessible to anyone interested in your work — to mitigate the risk of unnecessary back-and-forth friction. This will certainly help reduce the length of the sales cycle.
A vital, yet often overlooked step is ensuring alignment across marketing, sales, CS, and the customers. This involves timely handoffs, relevant communication, straightforward pricing and product details, and clear PoCs across every stage of the customer journey. This helps both the customer and internal departments streamline the sales process end-to-end.
The accuracy of your pipeline velocity metrics (and any other metric, really) relies heavily on the quality of your data. Ensure you’re regularly maintaining numbers on qualified opportunities, deal size, and length of sales cycle in your CRM so the same may be leverage for pipeline velocity measurement.
As important as it is, it can be a tedious, unintuitive chore to measure pipeline velocity — unless you have the right analytics solution, of course :)
Factors is an AI-fuelled intelligence & analytics platform that helps teams identify, score, and track accounts across the customer journey. We’re talking about automated sales velocity calculations, flexible conversion funnels, IP-based account identification, multi-touch attribution, and more — everything you need to kickstart and refine your ABM process and…pipeline velocity!

Get the latest best practices in Marketing Analytics
delivered to your inbox. You don't want to miss this!!