
Heading 2
LinkedIn Ads Analytics & Reporting for B2B
Learn LinkedIn Ads analytics for B2B teams. Track pipeline, attribution, ROI, dashboards, and reporting templates with Factors.ai.
Written by
.avif)
Vrushti Oza
Content Marketer


.svg)


TL;DR
- LinkedIn ads analytics for B2B teams should go well beyond CTR and CPL to track account engagement, pipeline sourced, and revenue influenced.
- Campaign Manager gives you surface-level campaign data, but connecting ad spend to closed revenue requires CRM integration and multi-touch attribution.
- A solid LinkedIn ads report template covers spend pacing, audience performance, creative health, conversion trends, pipeline influence, and strategic recommendations.
- Attribution in long B2B sales cycles demands models that credit awareness touchpoints, not just the last click before a demo request.
- Tools like Factors.ai help users see LinkedIn ad data with CRM and web analytics to help marketing and revenue teams see what actually drove pipeline.
Every B2B marketer knows the monthly ritual… you export the LinkedIn Campaign Manager report, drop it into a slide deck, and suddenly everyone is discussing CTR like it's the stock market. Click-through rate is up, CPC is down, leads look decent-ish. A few noddy-nods happen around the room, and then sales joins the call and asks whether any of those leads were real buying accounts, and the color on everyone’s face changes immediately.
Because this is where most LinkedIn reporting starts to wobble like a rich caramel custard… but the thing is, that wobble only looks good on the custard.
Look, LinkedIn is très excellente at showing what happened inside the ad platform. But when you want to see what happened in the actual buying journey afterward, you need a little more data from other sources. These sources could include your CRM, website analytics, attribution tool, and one very stressed RevOps person can help you answer questions such as: Did the right companies visit your site? Did target accounts come back later through search or direct traffic? Did multiple stakeholders engage before an opportunity was created? That part usually lives somewhere between your
That’s why LinkedIn ads analytics for B2B needs to be viewed through a different lens. You're not really measuring impulse purchases or one-click conversions (because hello… this is B2B, and we don’t do that here?!)... you're measuring influence across a longer, more Bermuda-triangle-type sales cycle involving multiple people, multiple touchpoints, and decisions made weeks later. If you're only looking at impressions, clicks, and form fills, you're reading chapter one and assuming you know the ending.
This blog breaks down the metrics B2B teams should actually care about, how to report on LinkedIn ads in a way leadership respects, and the common analytics mistakes that make expensive campaigns look either better or worse than they really are.
Why do LinkedIn Ads analytics matter for B2B?
LinkedIn takes up a strange but powerful place in B2B marketing. It's the one platform where you can target by job title, company size, industry, and seniority with genuinely useful precision. But the way buyers interact with LinkedIn ads doesn't follow the neat, linear patterns that ad platforms were designed to measure.
On Meta or Google, the path from impression to conversion is often short. Someone sees a product ad, clicks, and buys within the same session or perhaps a day later. B2B buying journeys on LinkedIn look nothing like that. A VP of Marketing might see your sponsored post in March, visit your website in April through a branded search, attend a webinar in May, and finally book a demo in June after a sales email. LinkedIn created the initial awareness, but it never gets credit in a last-click model.
This is exactly why measuring only cost per lead gives misleading conclusions. A campaign generating $25 leads might look brilliant in a spreadsheet, but if those leads never convert to opportunities, the campaign is actually burning budget. Meanwhile, your thought leadership campaign with a $90 CPL might be warming up accounts that close at 3x the rate. Without company-level engagement data and pipeline attribution, you genuinely can't tell the difference.
What’s more, CFOs and revenue leaders now expect pipeline visibility from marketing, not vanity metrics. Reporting that stops at "we generated 200 leads" without showing what happened to those leads in the CRM doesn't survive a serious budget conversation. The teams that keep their LinkedIn budgets growing are the ones who can draw a clear line from ad spend to influenced revenue.
B2B buying committees make this even more complex. You're rarely persuading a single decision-maker. You need to reach the economic buyer, the technical evaluator, the champion, and sometimes the procurement team. A single lead form fill doesn't capture how many people from that account engaged with your content. Company-level analytics, which show how entire accounts interact with your ads across multiple touchpoints, are what separate sophisticated LinkedIn measurement from basic reporting.
View-through impact adds another layer that most teams undercount. Many B2B buyers see your ads repeatedly, absorb the messaging, and then convert through an entirely different channel. They type your brand name into Google, or they respond to a sales outreach because your company name already feels familiar. If your analytics only count clicks, you're systematically undervaluing the campaigns that build this kind of latent demand.
What metrics should you track in LinkedIn Campaign Manager?
Campaign Manager gives you a solid foundation of metrics, but the trick is knowing which ones matter at each stage of the funnel. Not every campaign objective needs the same KPIs, and treating all campaigns the same way in reporting is a quick path to bad decisions.
- Awareness metrics
At the top of the funnel, you're trying to understand whether your ads are reaching the right people at a useful frequency. The metrics that matter here are:
- Impressions tell you the raw volume of ad exposures. They're a blunt instrument on their own, but they provide useful context when paired with reach and frequency.
- Reach shows how many unique members saw your ad. High impressions with low reach means you're hitting the same people repeatedly, which may or may not be intentional.
- Frequency tracks how many times each person saw your ad on average. In B2B, a frequency of 3 to 5 is often healthy for awareness campaigns. Below that, you're probably not making an impression. Above 8 or 9, you're likely wasting spend on ad fatigue.
- Video completion rate reveals whether your video content is holding attention. A 25% completion rate on a 60-second video is decent. Below 15%, your creative probably needs reworking.
- Engagement rate captures likes, comments, shares, and clicks as a proportion of impressions. It signals whether your content resonates with the audience you're targeting.
- Consideration metrics
Once you've built some awareness, the next layer of metrics tells you whether people are actually engaging with your message and moving closer to your website or offer.
- Click-through rate (CTR) measures how often people click after seeing your ad. The B2B LinkedIn average tends to hover around 0.4% to 0.6%, so anything consistently above 0.7% is performing well.
- Landing page views are more reliable than clicks because they filter out accidental taps and bounces. If there's a big gap between clicks and landing page views, your page load speed might be an issue.
- Cost per click (CPC) varies wildly depending on your audience and geography. A $6 CPC targeting senior decision-makers in the UK is perfectly normal, even if it would seem high on Google Display.
- Follower growth matters if you're running brand-building plays alongside your demand campaigns. A growing follower base gives your organic content more reach over time.
- Conversion metrics
This is where most teams focus their reporting, and for good reason. But even conversion metrics need context to be useful.
- Leads captured through lead gen forms or website conversions are the most common conversion metric. The number alone doesn't tell you much without a quality layer.
- Lead form completion rate shows what percentage of people who opened your form actually submitted it. If this rate is below 10%, your form might be too long or your offer isn't compelling enough.
- Cost per lead (CPL) is probably the most watched metric in B2B LinkedIn reporting. Just remember that a low CPL is only valuable if the leads are actually qualified.
- Conversion rate from click to lead tells you how well your landing page and offer convert interested visitors.
- Revenue metrics
These are the metrics that actually answer the CFO's question from my opening story. They're also the hardest to track inside Campaign Manager alone.
- Influenced opportunities count how many open deals had at least one touchpoint with your LinkedIn ads. This requires CRM integration to measure properly.
- Pipeline sourced tracks the total value of opportunities where LinkedIn was the first meaningful touchpoint.
- Closed-won influenced shows the revenue from deals where LinkedIn ads played a role at any stage of the journey.
- Return on ad spend (ROAS) divides closed revenue influenced by total ad spend. It's the ultimate accountability metric, and it's almost impossible to calculate without connecting your ad data to your CRM.
The key insight here is that different campaign objectives demand different KPIs. Measuring your awareness campaign by CPL is like judging a first date by whether it ended in a proposal. Each funnel stage has its own success criteria.
Beyond CTR: the metrics LinkedIn ads analytics metrics B2B teams care about
CTR gets a disproportionate amount of attention in LinkedIn reporting, partly because it's easy to measure and partly because it feels actionable. But here's the thing about CTR: it rewards curiosity, not intent. A provocative headline can generate clicks from people who will never buy your product. Pipeline rewards intent, and the metrics that predict pipeline look quite different from the ones Campaign Manager puts front and center.
The smartest B2B teams I've seen track metrics that sit further downstream and closer to revenue. These aren't always available natively. They require CRM data, account-matching logic, and sometimes dedicated tooling. But they're the metrics that actually inform budget decisions.
- Cost per qualified account reached measures how much you're spending to get in front of accounts that match your ideal customer profile. It's different from CPL because it focuses on accounts, not individual leads, and it only counts accounts that meet your qualification criteria.
- Target account engagement rate tracks what percentage of your named target accounts have interacted with your ads in a given period. If you're running an ABM play and only 12% of your target list has engaged, you know you need to adjust your audience targeting or increase frequency.
- Buying committee penetration is one of the most underrated metrics in B2B. It measures how many individuals within a target account have engaged with your ads. Reaching one person at an account is a start. Reaching four or five people across different roles, that's how you actually influence a buying decision.
- Meetings booked ties ad engagement to a concrete sales outcome. When a target account engages with your ads and then books a meeting within a defined window, you can reasonably attribute that meeting to your LinkedIn activity.
- Opportunity creation rate measures how often engaged accounts convert into active sales opportunities. It's the bridge between marketing engagement and pipeline creation.
Pipeline per pound spent is the metric that makes budget conversations productive. If you can show that every $1,000 spent on LinkedIn created $15,000 in pipeline, you have a compelling case for increased investment. If you can't calculate this number, you're always going to be on the defensive in budget reviews.
Revenue influenced captures the total closed-won revenue from deals where LinkedIn played any role. It's the most comprehensive measure of LinkedIn's contribution to the business.
Here's a quick comparison of what surface metrics tell you versus what these deeper metrics reveal:
The gap between these two columns is where most B2B reporting falls short. Closing that gap requires integrating your LinkedIn data with your CRM and using attribution logic that credits the right touchpoints.
How do you build a LinkedIn ads report template?
A good report isn't just a collection of metrics. It's a story about what happened, what it means, and what should change. The best LinkedIn ads report template I've seen follow a consistent structure that makes it easy for stakeholders to find what they care about without wading through data they don't.
Here's a monthly template structure that works well for most B2B teams:
- Executive summary
Start with a half-page overview that answers three questions: What did we spend? What did we get? What are we changing? This section is for the CMO and CFO who won't read the rest of the report. Keep it tight, use bullet points, and lead with the most important number, usually pipeline influenced or ROAS.
- Spend and pacing
Show total spend against budget, broken down by campaign type or objective. Include a pacing chart that shows whether you're on track to hit your monthly or quarterly budget. If you're underspending, explain why. If you're overspending, explain what's driving the overage and whether it's justified by performance.
- Campaign performance
Break down each active campaign by its primary KPI. Awareness campaigns get measured on reach, frequency, and engagement rate. Demand gen campaigns get measured on CTR, CPL, and conversion rate. Don't force every campaign into the same metrics grid.
- Audience performance
Show how different audience segments are performing relative to each other. This is where you spot that your "Directors of IT" segment converts at twice the rate of your "VP of Operations" segment, or that your EMEA targeting is significantly more expensive than APAC for similar results.
- Creative performance
Compare ad creatives within each campaign. Identify which headlines, images, and formats are driving the best engagement and conversions. Flag any creatives showing signs of fatigue, such as declining CTR over time despite consistent impressions.
- Conversion trends
Plot conversions over time, not just as a monthly total. Weekly or bi-weekly trends help you spot seasonality, the impact of creative refreshes, or external events that affected performance. A flat monthly number hides the story beneath it.
- Pipeline influence
This is the section that earns trust with revenue leaders. Show how many opportunities were influenced by LinkedIn ads, the total pipeline value, and the conversion rate from LinkedIn-engaged accounts to opportunities. If you can include average deal size and sales cycle length for LinkedIn-influenced deals versus non-influenced deals, that's even more powerful.
- Recommendations
End with three to five specific recommendations based on the data. "Pause the underperforming creative in Campaign B" is useful. "Continue optimizing" is not. Every recommendation should be tied to a specific data point from the report.
For tools, most teams build these reports in Looker Studio, Google Sheets, Power BI, or their preferred BI platform. Each has trade-offs. Sheets is flexible but manual. Looker Studio connects nicely to Google data but requires workarounds for LinkedIn. Power BI is powerful, but can feel heavy for a simple monthly report.
If you'd rather skip the manual assembly, Factors.ai generates automated LinkedIn ads report templates that pull data from your CRM and LinkedIn together, which saves the hours most teams spend stitching spreadsheets together every month.
Native LinkedIn reporting vs third-party tools
Campaign Manager's built-in reporting has improved significantly over the past few years. It handles the basics well, and for teams just getting started with LinkedIn ads, it's a perfectly reasonable place to begin. But there's a ceiling to what native reporting can tell you, and most B2B teams hit that ceiling faster than they expect.
Here's how they compare across the dimensions that matter most:
My honest take is that native reporting works well for day-to-day campaign management. If you need to check which creative is getting the best CTR, or whether your CPC is trending up, Campaign Manager handles that fine. Where it falls short is in connecting ad data to business outcomes. It can tell you that 50 people filled out a lead form, but it can't tell you that 12 of those leads became opportunities worth $400,000 in pipeline.
Growth teams that need to justify LinkedIn spend in revenue terms almost always end up needing a LinkedIn reporting tool that connects ad performance to CRM data. The question isn't really whether you need third-party tooling. It's when you'll need it, and the answer is usually the first time a revenue leader asks what LinkedIn actually contributed to pipeline.
How should you think about attribution for LinkedIn ads in long sales cycles?
Attribution is where LinkedIn ads analytics gets genuinely complicated, and where most reporting setups quietly give LinkedIn less credit than it deserves. The core issue is straightforward: last-click attribution systematically underreports LinkedIn's impact because LinkedIn's strongest contribution often happens early in the buying journey, long before anyone fills out a form.
Here's a scenario that plays out constantly in B2B. A CFO at a mid-market SaaS company sees your LinkedIn thought leadership ad in January. She doesn't click. She sees another ad in February featuring a customer case study. She clicks, reads half the page, and leaves. In March, her VP of Sales mentions your company in a conversation because he saw a separate ad targeting his role. In April, the CFO googles your brand name directly, visits your pricing page, and books a demo.
In a last-click model, branded search gets full credit for that demo. LinkedIn gets zero. But LinkedIn created the demand that made everything else possible. Without those early touchpoints, the CFO would never have searched for your brand, and the VP of Sales would never have mentioned your name in that hallway conversation.
This is why multi-touch attribution matters so much for LinkedIn. Here's how the most common models distribute credit and what each is best suited for:
No attribution model answers every question perfectly, and anyone who tells you otherwise is probably selling one. The practical approach for most B2B teams is to use two or three models in parallel and compare the stories they tell. If LinkedIn looks strong in first-touch but weak in last-touch, that's a signal that it's doing awareness work. If it shows up in U-shaped models, it's contributing to both awareness and conversion.
View-through conversions deserve special attention in this context. LinkedIn offers a view-through window that credits conversions to people who saw your ad but didn't click. In B2B, where buyers often research privately before engaging publicly, view-through data captures influence that click-based models miss entirely. A buyer who saw your ad three times and then converted through a different channel was still influenced by your campaign.
The practical takeaway is this: if you're only using last-click attribution for LinkedIn, you're almost certainly undervaluing your campaigns. Switching to a multi-touch model, even a simple linear one, usually reveals that LinkedIn is contributing significantly more to pipeline than your current reports suggest.
What dashboard views do marketing teams need?
Marketing teams live in their dashboards, and the best ones are designed around the questions they need to answer daily and weekly, not just monthly. A single "LinkedIn performance" dashboard usually tries to do too much and ends up answering nothing clearly. Breaking it into focused views makes the data actionable.
- Campaign health dashboard
This is your daily check-in view. It shows each active campaign's spend, delivery pace, CTR, CPL, and conversion rate against targets. Think of it as your campaign vital signs monitor. If something is off, you spot it here first. Colour-coding or simple threshold indicators help you scan quickly without reading every number.
- Creative fatigue dashboard
Creative fatigue is one of the biggest silent budget wasters in LinkedIn advertising. This dashboard tracks CTR and engagement rate trends for each creative over time. When a creative's CTR drops by 20% or more from its peak while frequency increases, that's a clear fatigue signal. Most teams should refresh creatives every four to six weeks on high-frequency campaigns, but this dashboard tells you exactly when instead of guessing.
- Audience saturation dashboard
This view shows reach and frequency by audience segment. If your "CMOs at companies with 500+ employees" segment has a frequency of 12, you're well past the point of diminishing returns. You either need to expand that audience, reduce budget allocation to it, or rotate in completely different messaging. Saturation data also helps you decide when to exclude already-converted accounts from your targeting.
- Budget pacing dashboard
Budget pacing sounds simple until you're managing eight campaigns across three regions with different start dates and objectives. This dashboard shows daily spend rate against the plan, projected end-of-month spend, and any campaigns at risk of overspending or underspending. The goal is to avoid the awkward scramble in the last week of the month when you realise you have 40% of your budget left.
- Lead quality dashboard
Raw lead counts are meaningless without quality signals. This dashboard connects LinkedIn lead data to your CRM qualification stages. It shows what percentage of LinkedIn leads became MQLs, SQLs, and opportunities. When a campaign generates lots of leads but almost none of them qualify, this dashboard catches that pattern early so you can adjust targeting before wasting another month of spend.
Frequency pacing and spend waste are the two themes that tie all these dashboards together. Every marketing team I've worked with has discovered at least one significant source of wasted spend the first time they built proper pacing and saturation views. The data was always available. It just wasn't visible in the right format.
What dashboard views do revenue teams need?
Revenue teams and marketing teams look at the same LinkedIn campaigns through completely different lenses. Marketing dashboards explain activity: what ran, how it performed, and what to change. Revenue dashboards explain outcomes: which accounts engaged, how much pipeline was created, and what revenue was influenced. Both perspectives are essential, but they need different views.
- Accounts engaged from LinkedIn ads
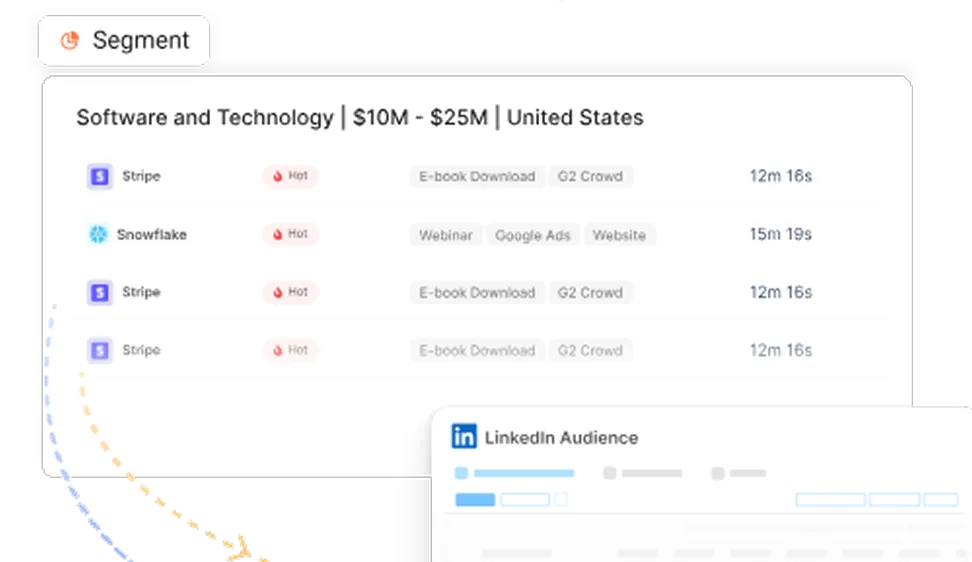
This is the foundation of revenue-side LinkedIn reporting. It shows which specific accounts have interacted with your ads, how many individuals from each account engaged, and what types of content they interacted with. For sales teams running account-based plays, this view is gold. It tells them which target accounts are warming up before any inbound signal arrives.
- CRM overlap with engaged accounts
This view maps LinkedIn-engaged accounts against your CRM pipeline stages. It answers questions like: How many accounts in our active pipeline have also engaged with LinkedIn ads? Are there engaged accounts that sales hasn't contacted yet? The overlap analysis often reveals opportunities that would otherwise slip through the cracks, accounts showing strong intent signals that nobody on the sales team knows about.
- Meetings booked by campaign
Attribution debates sometimes resemble group projects where everyone claims credit for the final result. This dashboard cuts through the noise by connecting LinkedIn campaigns directly to meetings booked within a defined attribution window. If your "Decision-Maker Thought Leadership" campaign influenced 15 meetings last month while your "Product Feature" campaign influenced 3, that tells you where to invest.
- Pipeline created by audience segment
Breaking pipeline down by audience segment reveals which personas are most responsive to your LinkedIn investment. You might discover that your campaigns targeting Directors generate more pipeline volume, while your VP-targeted campaigns generate fewer but larger opportunities. Both insights are useful for budget allocation and audience strategy.
- Revenue influenced by ad type
This dashboard shows closed-won revenue broken down by the type of LinkedIn ad that influenced the deal. Sponsored content, conversation ads, document ads, and lead gen forms each play different roles. Seeing which ad types correlate with the highest revenue influence helps you design a better mix for the next quarter.
The broader principle is that marketing dashboards are for optimization, and revenue dashboards are for accountability. When both teams have the views they need, the conversation shifts from "did marketing spend well?" to "here's how marketing contributed to this quarter's number." That's a much more productive conversation for everyone involved.
Common reporting mistakes to avoid
Most LinkedIn ads reporting isn't bad because teams don't care. It's bad because the default tools and habits push you toward metrics that feel productive but don't actually drive better decisions. Many dashboards end up as crowded museums of numbers, full of data points that nobody acts on.
Here are the mistakes I see most often:
- Reporting leads without quality scoring
A report that says "we generated 340 leads this month" without any quality breakdown is almost useless for decision-making. Were those leads from target accounts? Did they match your ICP? How many progressed past initial qualification? Lead volume without quality scoring encourages campaigns that optimize for form fills rather than pipeline. Always layer in MQL and SQL conversion rates alongside raw lead counts.
- Using one attribution model only
Single-model attribution gives you a single version of reality, and that version always has blind spots. Last-click undervalues awareness. First-click undervalues conversion. Running at least two models side by side gives you a more honest picture of what's working. The discrepancies between models are often where the most valuable insights hide.
- Ignoring non-click influence
If your reporting only counts people who clicked an ad, you're missing a huge portion of LinkedIn's impact. In B2B, many buyers see ads, absorb the message, and convert later through a different channel. View-through conversions and impression-based engagement data capture this influence. Ignoring it means you're making budget decisions based on incomplete data.
- No CRM integration
This might be the single most damaging gap in B2B LinkedIn reporting. Without connecting your ad data to your CRM, you literally can't answer the question that matters most: did these ads contribute to revenue? Setting up CRM integration takes effort, but every week you delay is a week of decisions made without the most important data.
- Reporting monthly without showing trends
A monthly snapshot tells you what happened. A trend over six months tells you what's changing. Reporting CPL as $42 this month means very little in isolation. Reporting that CPL has risen from $28 to $42 over three months while lead quality has improved tells a much richer story. Always include trend lines alongside point-in-time metrics.
- Too many metrics without any story
The temptation to include every available metric in a dashboard is strong, especially when you're trying to demonstrate thoroughness. But a report with 40 metrics and no narrative forces every stakeholder to draw their own conclusions, which means they'll often draw the wrong ones. Choose eight to twelve metrics that tell a coherent story, and save the rest for deep-dive analysis when needed.
- Not segmenting by audience or geography
Aggregate numbers hide the variation that matters most. Your overall CPL might be $35, but that average could mask a $22 CPL in your best-performing segment and a $58 CPL in a segment that's not converting at all. Always break performance down by audience segment and geography so you can allocate budget to what's actually working.
Each of these mistakes is fixable, and fixing any one of them usually improves reporting quality more than adding a new tool or a fancier dashboard. Start with whichever gap is costing you the most clarity right now.
How Factors.ai improves LinkedIn ads reporting
If Campaign Manager tells you what happened, Factors.ai helps explain what actually mattered. That distinction is the core of what the platform offers for B2B teams who've outgrown native reporting.
Factors.ai connects your LinkedIn ad data with CRM and website analytics in a single view. Instead of switching between Campaign Manager for ad metrics, your CRM for pipeline data, and Google Analytics for website behavior, everything comes together in one place.
Here's what that looks like:
LinkedIn AdPilot reporting gives you a unified view of campaign performance that goes beyond standard Campaign Manager metrics. It layers in pipeline and revenue data so you can see which campaigns actually contributed to business outcomes, not just which ones got the most clicks.
Company-level engagement visibility shows you which accounts are interacting with your ads, how many people from each account have engaged, and what content they've seen. This is essential for ABM teams who need to know whether their target accounts are paying attention.
CRM plus ad plus web unification stitches together three data sources that most teams keep separate. When a prospect sees a LinkedIn ad, visits your website a week later, and then shows up as an opportunity in your CRM, Factors.ai connects those events into a single journey.
- Multi-touch attribution distributes credit across all the touchpoints that influenced a deal. You can compare first-touch, linear, U-shaped, and W-shaped models side by side to understand how LinkedIn contributes at different stages of the buying journey.
- Pipeline reporting shows sourced and influenced pipeline by campaign, audience segment, and ad type. It answers the budget question directly: here's how much pipeline your LinkedIn investment created.
- View-through insights capture the impact of ad impressions that didn't result in clicks. For B2B campaigns where brand exposure often precedes conversion by weeks, this fills a critical measurement gap.
- Frequency pacing controls help you manage how often target accounts see your ads. Instead of blasting the same audience until fatigue sets in, intelligent pacing keeps your frequency in the productive range.
- Executive-ready dashboards present all of this in a format that works for leadership reviews. Clean, focused views that answer strategic questions without requiring stakeholders to interpret raw data.
Teams using Factors.ai spend less time assembling reports and more time acting on what the data reveals. When your reporting infrastructure connects ad spend to pipeline automatically, campaign reviews become conversations about strategy rather than debates about data accuracy.
In a nutshell…
LinkedIn ads analytics for B2B teams needs to go further than Campaign Manager's default metrics. CTR, CPL, and lead volume give you a starting point, but they don't tell you whether your ad spend is creating pipeline or just generating form fills that go nowhere.
The strongest reporting setups share a few things in common. They track metrics at the account level, not just the individual level. They use multi-touch attribution to capture LinkedIn's full influence across long sales cycles. They connect ad data to CRM data so pipeline and revenue are part of every campaign review. And they build separate dashboard views for marketing teams and revenue teams, because those groups need different answers from the same data.
A well-structured LinkedIn ads report template covers spend pacing, campaign and audience performance, creative health, conversion trends, pipeline influence, and concrete recommendations. It tells a story that leads to action, not just a collection of numbers that looks impressive.
If your current reporting can't answer the question "how much pipeline did LinkedIn create this quarter?" then closing that gap should be your next priority. Start by integrating your CRM with your ad data, adopt at least two attribution models, and build focused dashboards that separate campaign optimization metrics from revenue accountability metrics. That combination gives you the foundation for LinkedIn reporting that actually earns budget.
Frequently asked questions about LinkedIn ads analytics and reporting
Q1. What is LinkedIn Ads analytics?
LinkedIn Ads analytics is the measurement and analysis of campaign performance across spend, engagement, leads, pipeline, and ROI. It starts with the metrics available in Campaign Manager, like impressions, CTR, and CPL, but for B2B teams, it extends into account-level engagement, multi-touch attribution, and revenue influence. The goal is to understand not just how your ads performed, but whether they contributed to business outcomes like qualified pipeline and closed deals.
Q2. What is the best LinkedIn reporting tool for B2B?
For basic campaign metrics like CTR, CPC, and lead volume, LinkedIn Campaign Manager works well and costs nothing extra. When you need pipeline attribution, CRM integration, company-level engagement visibility, and multi-touch reporting, dedicated tools become necessary. Factors.ai is particularly strong for B2B teams because it unifies LinkedIn ad data with CRM and website analytics, which lets you see how campaigns contribute to pipeline and revenue rather than just surface engagement.
Q3. How do I measure ROI on LinkedIn Ads?
Measuring true ROI requires connecting your LinkedIn ad data to your CRM. Track influenced opportunities, which are deals where at least one contact engaged with your ads, as well as pipeline sourced directly from LinkedIn touchpoints and closed-won revenue from those deals. Use multi-touch attribution to distribute credit fairly across all the touchpoints in long B2B sales cycles. Divide closed revenue influenced by your total LinkedIn spend to calculate ROAS.
Q4. Does LinkedIn underreport impact in last-click models?
Often, yes. LinkedIn's strongest contribution frequently happens at the awareness stage, weeks or months before a buyer converts. When that buyer eventually books a demo through branded search or a direct visit, last-click attribution gives full credit to the final channel and none to LinkedIn. Multi-touch models, especially U-shaped or W-shaped, capture LinkedIn's early influence more accurately. View-through conversion data also helps quantify the impact of impressions that didn't generate clicks.
Q5. What should a LinkedIn ads report template include?
A comprehensive monthly template should cover eight sections: an executive summary with key highlights, spend and budget pacing, campaign performance broken down by objective, audience segment analysis, creative performance with fatigue indicators, conversion trends over time, pipeline influence tied to CRM data, and actionable recommendations for the next period. Each section should serve a specific stakeholder need, from the CMO who wants a quick summary to the campaign manager who needs tactical detail.

See how Factors can 2x your ROI
Boost your LinkedIn ROI in no time using data-driven insights
Try AdPilot Today


.avif)

See Factors in action.
Schedule a personalized demo or sign up to get started for free
LinkedIn Marketing Partner
GDPR & SOC2 Type II

.svg)


.avif)

.avif)