
Heading 2
Attribution Reporting for B2B Marketers: The Conversion Reporting Guide
Everything B2B marketers need to know about attribution reporting: models, KPI dashboards, conversion reporting, dark funnel challenges, and how to connect it all to revenue.
Written by
.avif)
Vrushti Oza
Content Marketer
Summarize this article


.svg)


TL;DR
- Attribution reporting is the process of assigning credit to the marketing touchpoints that contributed to a conversion or closed deal. Conversion reporting is how you track what happened and when. They're different, and you need both.
- B2B attribution is structurally harder than B2C: longer cycles, 6-12 stakeholders, and 75%+ of the buyer journey happening somewhere attribution tools can't see.
- There are eight common attribution models. W-shaped is the most recommended for B2B SaaS teams with 6+ month cycles. Data-driven models only outperform rule-based ones when you have clean data and sufficient volume.
- Your marketing KPIs dashboard should show conversion rates at every funnel stage, cost per opportunity, marketing-sourced pipeline, pipeline velocity, and LTV:CAC. Not impressions. Not followers.
- The three-layer attribution stack that actually works: software attribution + self-reported attribution + incrementality testing.
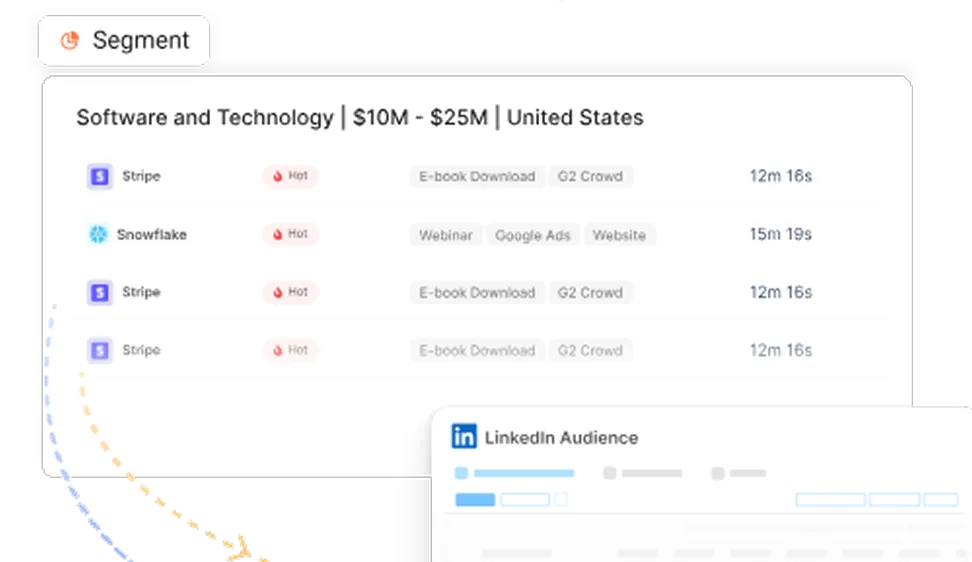
- Platforms like Factors.ai approach this differently because they work at the account level, integrate LinkedIn and Google ad data with CRM pipeline stages, and surface attribution, including view-through and organic LinkedIn engagement that most tools miss entirely.
At some point in every B2B marketer's life, a CFO walks into a meeting, squints at the slide deck, and asks: "So what did marketing actually produce this quarter?"
And you either have a clean answer, or you spend the next 12 minutes explaining why you can't really connect LinkedIn impressions to closed revenue because the sales cycle is long and the buyer journey is nonlinear, and there were six stakeholders, AND also the SDRs didn't update the CRM...
I've been in that meeting, and to say the least, it’s at least 45% worse than what this man in the stock image feels:

This does NOT happen because marketing didn't do good work (am I being biased ‘cause I’m in marketing? NO, marketing actually DID do good work, Jim).
It's because attribution reporting is genuinely hard, and most teams are either doing it wrong, doing it partially, or running a model that was built for a completely different kind of buying journey.
This guide is for B2B marketers who are past the basics, know attribution matters, and want to finally build something that actually reflects how buyers buy, tells a coherent revenue story, and can survive a CFO walkthrough without emotional damage.
We're covering attribution models, conversion reporting, what belongs on a marketing KPIs dashboard, and the tricky stuff everyone glosses over: the dark funnel, model selection, and how to connect all of it to pipeline.
Lesssgo!
What is attribution reporting? (and why are most teams confusing it with something else)
Attribution reporting is the practice of identifying which marketing touchpoints contributed to a conversion and assigning them appropriate credit. That's the clean definition.
In practice, it's the answer to: “If we hadn’t run that LinkedIn campaign, would this deal have happened?” It's a causal question dressed up as a measurement question, and that distinction matters a lot.
Conversion reporting is the companion piece… while attribution reporting explains why and who gets credit, conversion reporting tracks what happened and how much. It counts conversions, measures rates between funnel stages, and shows trends. Think: your MQL-to-SQL conversion rate dropping 12% week-over-week. That's conversion reporting. Finding out it dropped because your Facebook campaign was driving unqualified volume? That's where attribution analysis comes in.
The two are deeply connected, here’s how: Every attribution model needs clearly defined conversion events as anchors. Without them, attribution is distributing credit across a journey that doesn't have a clear destination.
Most teams confuse attribution with credit-claiming. Attribution exists to help you allocate budget better. When it turns into a political exercise where marketing argues with sales about who 'owned' a deal, the whole thing breaks down. The right frame is: contribution estimation, not ownership proof.
Why is B2B attribution a completely different animal?
B2C attribution is relatively manageable. A consumer sees a Meta ad, clicks, buys a $40 product, and is done. The journey fits inside a browser session. Attribution is mostly a question of which ad got clicked.
B2B attribution looks nothing like this.
HockeyStack Labs data shows that the average B2B deal involves around 266 touchpoints across roughly 211 days. For deals above $100K ACV, that number climbs to approximately 417 touchpoints and 5,500 ad impressions before close. The average buying committee includes 6 to 12 stakeholders, each following their own parallel path through your content, ads, events, and outreach.
This is the Modern Family of buyer journeys. It's not one protagonist making a decision. It's an ensemble cast, multiple storylines, everyone technically working toward the same outcome but doing completely different things at any given moment.
A VP of Marketing might see your LinkedIn video ad while scrolling during a flight. The Head of RevOps downloads your benchmark report three weeks later. The CTO attends a webinar. An SDR runs outbound on the champion contact. The champion demo request comes in as 'direct' traffic in your analytics. None of these people ever filled in the same form. Your CRM has maybe two of them.
This is why last-touch attribution systematically misleads B2B teams. That demo request form looks like a direct conversion. The 18 months of brand-building that produced the confidence to request a demo is invisible.
The average B2B sales cycle now runs 10-11 months. Enterprise deals can take 12-18 months. Any attribution model that doesn't account for this timeline is telling an incomplete story from the start.
There's also the platform fragmentation problem. Most B2B marketing teams use six or more tools to collect performance data, and 59% of them identify data centralization as their biggest attribution obstacle. CRM in Salesforce. Marketing automation in HubSpot. Ad data in LinkedIn Campaign Manager and Google Ads. Website analytics in GA4.
None of these speak the same language by default… each one has a different definition of a conversion, a different attribution model, and a different opinion about what it contributed.
Add cookie deprecation, ITP (Safari's Intelligent Tracking Prevention deletes cookies after 7 days), GDPR and CCPA consent requirements, and you've got a measurement environment that makes tracking feel like trying to follow someone through Hogwarts using only a paper map.
The eight attribution models explained (minus the jargon
There are eight types of attribution models you'll encounter in B2B attribution. Here's what each one actually does, when it makes sense, and where it will mislead you.
- First-Touch Attribution
100% of revenue credit goes to the very first interaction. If a prospect first found you through a Google search and later converted through a LinkedIn retargeting ad, organic search gets all the credit. Useful for understanding what creates initial awareness. Actively harmful if you use it to make budget decisions, because it tells you nothing about what closed the deal.
- Last-Touch Attribution
100% credit to the final touchpoint before conversion. Google Ads retargeting, webinar sign-up pages, and demo request forms look incredible under last-touch. Everything that built the relationship, created the intent, and produced the pipeline? Invisible. 41% of marketers still use last-touch as their primary model. This is the attribution equivalent of giving the last player in a relay race full credit for winning the whole event.
- Linear Attribution
This distributes equal credit across every touchpoint. With five touchpoints, each gets 20%. It's balanced and unbiased, which makes it useful as a starting baseline. It cannot differentiate a pricing page visit from a casual blog scroll, so it won't help you identify which activities are genuinely moving the needle.
- Time-Decay Attribution
All touchpoints get credit, but interactions closer to the conversion get more weight. Google uses a 7-day half-life. Research suggests touchpoints in the final 30 days before purchase carry roughly 3x the impact of earlier interactions. This is logical for deal-closing analysis, but the time-decay attribution model systematically undervalues the brand-building and awareness investments that created the opportunity in the first place.
- U-Shaped (Position-Based) Attribution
40% credit to the first touch, 40% to the lead-creation touch, and 20% distributed across everything in between. Respects both awareness and conversion. Works well for teams focused on lead generation with 3-6 month cycles. Stops measuring at lead creation, which means it misses the majority of a B2B buying journey.
- W-Shaped Attribution
30% credit each to three milestones: first touch, lead creation, and opportunity creation. 10% distributed across all remaining touches. This is the model most B2B attribution experts recommend for SaaS companies with 6+ month cycles because it maps directly to the three moments that actually matter for business outcomes: when you created awareness, when you generated a qualified lead, and when that lead became a sales opportunity.
The requirement: clean CRM data with reliable timestamps for each milestone. If your team doesn't consistently log opportunity creation dates or your MQL definitions have shifted three times in 18 months, this model will reflect those inconsistencies exactly.
- Full-Path (Z-Shaped) Attribution
Extends W-shaped to four milestones: first touch, lead creation, opportunity creation, and deal close. 22.5% to each, 10% distributed across everything else. This is the most comprehensive rule-based model and makes sense when marketing actively influences deals post-opportunity. It's the most data-intensive to maintain properly.
- Data-Driven (Algorithmic) Attribution
Machine learning analyzes both converting and non-converting paths to identify each touchpoint's actual contribution to conversion probability. Markov chains, Shapley values, counterfactual modeling. It's now Google Ads' default model for conversion actions, and 29.8% of Dreamdata users have shifted to it as their primary choice.
The requirements are significant: Google Ads needs at least 15,000 clicks and 600 conversions per 30-day period. Attribution quality is directly proportional to data cleanliness. A well-validated W-shaped model running on clean CRM data will outperform an algorithmic model running on messy pipeline fields and undefined lifecycle stages every single time.
Here's the full comparison at a glance:
Attribution model selection is not a sophistication competition. The right model is the one that matches your sales cycle length, data maturity, and the questions your team actually needs to answer.
What does good marketing attribution analysis look like?
Attribution analysis is not a report you pull once a quarter and present in the budget meeting. It's an ongoing process of asking better questions with better data.
The questions a solid attribution analysis should answer:
- Which channels generate the most qualified pipeline, not just leads?
- What is the cost per opportunity by channel?
- Which channels produce the fastest closes and highest deal values?
- Which early-stage activities correlate most strongly with eventual closed-won deals?
- Where are qualified accounts dropping out of the funnel?
- Which campaigns influence deals that were already in pipeline?
To run proper attribution analysis, you need data inputs across six categories:
1. CRM data: clean opportunity fields, standardized lead sources, consistent campaign association
2. Marketing automation: email engagement, form submissions, campaign membership records
3. Web analytics: UTM-tagged sessions, key conversion events, scroll depth and engagement
4. Ad platform data: impressions, clicks, spend broken down by campaign and audience
5. Offline event data: conference attendance, sales call logs, partner event participation
6. Self-reported data: the open-text 'How did you hear about us?' field on high-intent forms
That last one, self-reported attribution, is more important than most teams realize. One study across 314 leads over 12 months found that 43% attributed their discovery to referrals that software attribution never captured, and 36% to search engines that GA4 had lumped into 'direct.' Your attribution software is making assumptions about touchpoints it can't see. Asking people directly fills the gap.
The three-layer attribution stack
Best practice involves running three measurement layers simultaneously.
Layer 1: Software attribution. CRM, GA4, and your attribution platform sequencing touchpoints and showing channel paths. This is the foundation. It tells you the 'trackable' story.
Layer 2: Self-reported attribution. An open-text field on demo, pricing, and high-intent forms. Captures what software misses: word-of-mouth, podcast mentions, dark social, executive referrals, and AI-assisted research.
Layer 3: Incrementality testing. Geo tests or holdout experiments that prove actual causal impact. Run this within 90 days of establishing the first two layers. The gap between your attributed lift and your actual measured lift is exactly how much to trust your model.
Running all three simultaneously and comparing the outputs is how you stop optimizing for what's measurable and start optimizing for what's actually working.
What should your marketing KPIs dashboard look like for conversion reporting?
The marketing KPIs dashboard question has one very clean answer and one complicated one.
The clean answer: your dashboard should show whether marketing is producing qualified pipeline efficiently and at an improving rate. If every metric on your dashboard is pointing toward that answer, you're doing it right.
The complicated answer: most dashboards are filled with metrics that feel meaningful but don't. Traffic. Impressions. MQL volume without any quality context. Email open rates. Follower counts. These are the metrics that fill slides and impress nobody.
Here's what actually belongs on a B2B conversion reporting dashboard:
For account-based teams running ABM alongside demand gen, add these four metrics:
- Account coverage: percentage of target accounts with at least one engaged contact
- Buying committee penetration: average number of active contacts per target account
- Target account win rate vs. non-target: proves ABM is actually working
- Engaged account progression: how quickly target accounts move through pipeline stages
Two dashboards, not one
The executive dashboard and the operational dashboard are different products for different audiences.
- Weekly execution dashboard (for marketing managers): campaign performance, lead quality and volume by source, MQL acceptance rate, anomaly detection. Detailed enough to act on Monday morning.
- Monthly leadership dashboard (for CMO and executives): 5-7 North Star KPIs maximum. Pipeline value, marketing-sourced revenue, CAC, ROMI, win rate, pipeline coverage, funnel conversion rates. If a metric doesn't answer a business question, it doesn't belong here.
PS: The fastest way to lose credibility with a CFO is to show 23 metrics on a slide. It signals you don't know which ones matter. Pick 5-7. Know them, and update them in real time.
The dark funnel problem (and why attribution will never capture everything)
Here's the thing, no attribution vendor will put in their homepage hero section: most of your buyer journey is invisible to any software that exists today.
The dark funnel covers buyer activities that traditional analytics cannot capture. Private Slack communities, LinkedIn DMs. WhatsApp threads, podcast recommendations, word-of-mouth at conferences, peer reviews read on G2 at 11 pm. And increasingly: AI-assisted research.
94% of B2B buyers now use LLMs during their buying journey, according to 6sense. A buyer asks Claude or ChatGPT 'what are the best marketing attribution platforms?' and gets a recommendation. They go directly to your website. GA4 marks it as direct traffic. Your attribution model gives credit to 'direct.' The actual influence? Invisible.
SparkToro's tracking experiments found that 100% of referral clicks from TikTok, Slack, Discord, WhatsApp, and Mastodon are misattributed as direct in standard analytics setups. Meanwhile, 58.5% of all searches now end without a click, meaning a growing share of buyer research produces zero attributable signal whatsoever.
What to actually do about it
You can't track what you can't see. But you can:
• Ask. 'How did you first hear about us?' as a required text field on all high-intent forms. Not a dropdown. A text box. The answers will surprise you.
• Look for proxy signals. Spikes in branded search, direct traffic increases following conference season, and surges in G2 profile views are downstream effects of dark funnel activity you can measure indirectly.
• Use third-party intent data. Platforms like Bombora track content consumption across thousands of B2B sites. When accounts start researching attribution and GTM analytics topics you cover, that's a signal worth acting on even without a direct form fill.
• Calibrate your model against reality. Run incrementality tests quarterly on your highest-spend channels. If your model says LinkedIn drove $400K in pipeline but a 30-day holdout experiment shows $380K of that would have happened anyway, your model is overcounting. That's critical information for budget allocation.
The honest position on the dark funnel: measurability and importance are not the same thing. The podcast your champion heard you on, the Slack community conversation where someone vouched for your platform, the CEO's LinkedIn post that a CFO screenshot and forwarded to their team - these things work. They just won't show up in your attribution report. The solution is a measurement approach humble enough to acknowledge the gap, not a dashboard confident enough to hide it.
The attribution mistakes that (silently) blow up marketing programs
- Over-investing in measurable channels at the expense of effective ones
This is the single most damaging attribution failure pattern in B2B. Supermetrics documented a common sequence: LinkedIn video ads driving brand awareness get replaced by static 'Get Demo' ads because ROI is easier to track. The non-trackable activity driving pipeline gets cut. The trackable activity that doesn't actually drive pipeline gets scaled.
Three to six months later, pipeline dries up and no one can figure out why. The attribution model looked great the whole time.
- Last-touch bias masquerading as data-driven decision-making
41% of B2B teams are still running last-touch as their primary model. One documented case showed that pausing Facebook ads (which claimed 60% of conversions under last-touch analysis) only dropped revenue by 12%. The remaining 88% would have converted through other channels regardless. Last-touch isn't wrong. It's dangerously incomplete for budget decisions.
- Choosing model sophistication over data quality
A W-shaped model running on six months of clean, consistently defined CRM data will produce more useful attribution insights than a machine-learning algorithm running on three years of mismatched lead source fields and undefined opportunity stages. Data quality is the foundation. Model complexity is the finish. Most teams get this backwards.
- Not aligning definitions with sales before you build anything
If your MQL definition changed twice in the last year, if sales and marketing have different ideas about what constitutes an opportunity, or if pipeline stage entries are manually updated inconsistently by reps, your attribution model is built on sand. The alignment conversation with sales has to happen before the tool conversation. Not after.
- Using attribution as credit-claiming instead of investment optimization
Attribution reports become politically toxic when marketing uses them to argue ownership of deals that sales sourced and closed. The CFO is in that meeting too. When she sees the attribution report claiming marketing influenced 94% of pipeline, she doesn't believe it. She stops trusting the report entirely. Present attribution as a tool for optimizing future investment, not as a scorecard for who deserves the most recognition.
How to connect attribution data to pipeline and revenue
This is the conversation that actually matters. Everything else is operational. This is strategic.
CFOs and CEOs do not care about MQLs. They care about revenue. The attribution report that survives a finance team review connects marketing spend to closed revenue through a clear, defensible chain.
The metrics that belong in the revenue conversation
• Marketing-sourced pipeline: dollar value of opportunities where the first meaningful touch came from a marketing channel
• Marketing-influenced pipeline: dollar value of opportunities where marketing had at least one touchpoint before close (define 'at least one' precisely and use it consistently)
• Cost per opportunity: total campaign spend divided by opportunities created, by channel
• Marketing-contributed closed revenue: actual ARR from deals where marketing sourced the opportunity
• CAC payback period: how many months of revenue it takes to recover customer acquisition cost
• Win rate comparison: marketing-influenced accounts vs. non-influenced accounts
• Pipeline velocity: (qualified opportunities x avg deal size x win rate) / avg sales cycle in days
How to frame it for executives
Lead with the number you can defend: 'Marketing directly contributed to $X in closed-won ARR this quarter, sourcing Y opportunities across these channels.'
Add the influence layer: 'An additional $Z in closed pipeline had at least one marketing touchpoint before close. Win rates on those accounts were 34% higher than accounts with no marketing engagement.'
Then connect investment to outcomes: cost per opportunity by channel, LTV:CAC by segment, CAC payback period trend.
Frame marketing spend as capital allocation. 'We invested $250K in demand generation this quarter. That produced $1.2M in pipeline and $380K in closed-won ARR at a 3.2x ROMI.' That's a conversation a CFO can work with.
One important rule: your attribution numbers must reconcile with finance's actual closed-won figures. If marketing reports $500K attributed but finance shows $320K closed, credibility collapses instantly. Always reconcile before presenting.
How Factors.ai approaches attribution differently
Most platforms approach the problem by stitching together CRM and web data at the lead level. Factors.ai approaches it at the account level, which is how B2B buying actually works.
A few things that make the approach worth understanding:
- Account-level multi-touch attribution
Factors rolls up all touchpoints from all contacts at an account into a single attribution view. That means the VP who clicked a LinkedIn ad, the champion who attended a webinar, and the champion's manager who opened a nurture email all show up in the same account journey. You can run first-touch through W-shaped and full-path models, swap between them, and compare outputs in the same interface. Ad spend from LinkedIn, Google, Meta, and Bing connects directly to pipeline stages and closed revenue.
- LinkedIn AdPilot and the view-through attribution gap
LinkedIn CPCs run $4-6. Around 0.5% of your audience clicks. The other 99.5% see your ad, are influenced by it, and never click. And standard attribution gives them zero credit.
LinkedIn True ROI within our LinkedIn AdPilot captures view-through attribution alongside click-through. One documented Factors campaign showed 1 opportunity via click-through at $4,338 cost per opportunity and 11 opportunities via view-through at $395 per opportunity. Without view-through attribution, the analysis would have shown that the campaign was barely working, but with it, the picture looks completely different.
AdPilot's Smart Reach feature also implements account-level frequency capping. A Factors audit of 100+ LinkedIn ad accounts found that 80% of impressions were consumed by just 10% of accounts. In fact, one of our customers, Descope, saved approximately 140,000 impressions (25% reduction) while reaching more unique accounts per dollar spent.
- Google AdPilot and signal quality
Most B2B companies send incomplete conversion signals to Google Ads, which causes Google's optimization algorithm to chase volume rather than quality. AdPilot sends differential conversion weights based on ICP fit, deal stage, and account quality via Google's Enhanced Conversions API. One of our customers found that nearly 50% of their Google Ads spend was going to non-ICP accounts before implementing the account-level audience sync.
- LinkedIn Company Intelligence
Factors.ai integrates with LinkedIn's Company Intelligence API, which surfaces company-level engagement across both paid and organic LinkedIn touchpoints. Organic LinkedIn engagement was previously invisible to every attribution tool. Early results from beta users showed up to 3.6x more companies reached in attribution reporting, 75% more MQLs influenced when organic LinkedIn is included, and 43% lower cost per acquisition.
The practical significance here is that B2B marketing teams invest heavily in LinkedIn organic content. Without this integration, all of that work was contributing to pipeline without ever receiving attribution credit.
And that’s…

In a nutshell...
Attribution reporting in B2B is not a dashboard you set up once and forget. It's a capability you build over time, calibrate against real-time events, and use to make better investment decisions.
The most important things to take away from this:
- Conversion reporting and attribution reporting solve different problems. You need both. Define your conversion events clearly before picking any model.
- W-shaped attribution is the most reliable rule-based model for B2B SaaS companies with 6+ month cycles. Data-driven models require volume and data maturity to outperform.
- The dark funnel is real and growing. 94% of buyers use LLMs during research. Self-reported attribution + incrementality testing fills the gaps that software attribution can't.
- Your marketing KPIs dashboard should answer one question: is marketing producing qualified pipeline efficiently? Everything else is supporting detail.
- Connect attribution to revenue by showing marketing-sourced ARR, cost per opportunity, win rate comparisons, and CAC payback. Skip the MQL count. It doesn't translate.
- Attribution is contribution estimation. When it becomes credit-claiming, it loses credibility with everyone whose budget decision actually matters.
The teams that get attribution right are the ones that use it to improve, not to impress. Build something your CFO trusts, your VP of Sales finds useful, and your demand gen team can actually act on. That's the whole game.
FAQs for attribution reporting for marketers
Q1. What is attribution reporting in marketing?
Attribution reporting is the process of identifying which marketing touchpoints contributed to a conversion or revenue outcome and assigning them appropriate credit.
In B2B marketing, that means mapping out the full path an account took, from first awareness through closed deal, and determining which ads, content pieces, events, emails, and other interactions influenced the outcome. Attribution reporting answers 'which activities produced this result?' while conversion reporting answers 'what happened at each stage of the funnel?' The two work together: conversion events (form fills, demo requests, opportunity creation, closed-won) serve as the anchors that attribution models use to assign credit. Without clearly defined conversions, attribution has no destination to attribute toward.
Q2. What is the difference between attribution reporting and conversion reporting?
Conversion reporting tracks what happened, how much, and when.
It measures volumes and rates at each funnel stage: visitor-to-lead conversion rate, MQL-to-SQL conversion rate, opportunity-to-close rate, and overall funnel velocity. It tells you where the numbers are strong or weak. Attribution reporting explains why those numbers look the way they do and which marketing activities are responsible for them. If your MQL-to-SQL conversion rate drops 15% in a single month, conversion reporting surfaces the problem. Attribution analysis helps identify whether the issue is a specific channel generating unqualified volume, a campaign targeting the wrong ICP, or a messaging shift that attracted the wrong audience. Both are necessary for a complete marketing analytics practice.
Q3. Which attribution model is best for B2B SaaS?
W-shaped attribution is most widely recommended for B2B SaaS companies with sales cycles of 6 months or longer. It distributes 30% credit each to three key milestones: first touch (awareness and discovery), lead creation (qualification signal), and opportunity creation (confirmed pipeline).
The remaining 10% is distributed across all other touches in between. This maps directly to the three commercial outcomes B2B revenue teams care about most. For teams with shorter cycles (under 3-6 months), U-shaped or time-decay models may be more appropriate.
Data-driven attribution is technically the most accurate when you have sufficient volume (600+ conversions per 30-day period) and clean data, but rule-based models like W-shaped consistently outperform algorithmic models when data quality is uneven. The best attribution model is ultimately the one that matches your sales cycle length, your team's data maturity, and the specific questions you're trying to answer.
Q4. What should be on a marketing KPIs dashboard for B2B?
A B2B marketing KPIs dashboard should connect marketing activity to revenue, not just activity volume.
The core metrics: visitor-to-lead conversion rate (benchmark around 2.5%), MQL-to-SQL conversion rate (10-30%), SQL-to-opportunity conversion rate, opportunity-to-close win rate (SaaS average around 22%), cost per opportunity by channel, marketing-sourced pipeline value, LTV-to-CAC ratio (target 3:1 or higher), pipeline velocity, and ROMI. For ABM-focused teams, add account coverage, buying committee penetration, and target account win rate. At the executive level, limit the dashboard to 5-7 metrics maximum. A slide with 23 marketing metrics signals that you don't know which ones matter. Separate an operational weekly dashboard (campaign performance, lead volume, anomalies) from a monthly executive dashboard (pipeline, revenue contribution, unit economics) for different audiences.
Q5. What is multi-touch attribution and why does it matter for B2B?
Multi-touch attribution is any attribution model that assigns credit to more than one touchpoint in the buyer journey.
The alternatives, first-touch and last-touch attribution, assign 100% credit to a single interaction, which systematically misrepresents how B2B deals actually form. Because B2B buying involves multiple stakeholders, extended timelines, and dozens to hundreds of interactions across channels, single-touch models create severe bias. Under last-touch attribution, retargeting ads and demo request pages look highly productive because they appear at the end of the journey. Brand awareness campaigns, intent-driven content, and top-of-funnel LinkedIn advertising that actually created the demand look like they contributed nothing. Multi-touch models, whether linear, W-shaped, or data-driven, distribute credit across the full journey, giving marketers a more accurate picture of which investments are working and at which stages.
Q6. How do you build an attribution report from scratch?
Building an attribution report from scratch follows a structured process.
First, align marketing, sales, and finance on shared definitions: what constitutes an MQL, SQL, opportunity, and closed-won deal must be consistent across teams. Second, audit every data source touching the customer journey and assess CRM data quality. Clean, consistent pipeline stage data is the prerequisite. Third, implement tracking: UTM parameters on all campaigns, lead source fields in CRM, self-reported attribution on high-intent forms, and conversion events in GA4. Fourth, choose your attribution model based on sales cycle length and data maturity (W-shaped is the default recommendation for B2B SaaS). Fifth, build reporting views for three audiences: marketing operations (weekly execution detail), marketing leadership (monthly funnel performance), and executive/finance (quarterly revenue contribution). Sixth, validate the model by running a parallel tracking period and comparing self-reported attribution against software attribution to identify gaps. Finally, run an incrementality test on your highest-spend channel within 90 days to calibrate model accuracy.
Q7. What is the dark funnel and how does it affect attribution?
The dark funnel refers to the portion of the B2B buyer journey that happens outside the visibility of standard analytics tools.
This includes private Slack communities, LinkedIn DMs, WhatsApp conversations, word-of-mouth referrals, podcast recommendations, closed G2 review browsing, and increasingly, research conducted through AI tools like ChatGPT, Claude, and Perplexity. Research suggests the dark funnel covers 75% or more of the path to purchase. SparkToro tracking experiments found that 100% of referral clicks from TikTok, Slack, Discord, WhatsApp, and Mastodon are misattributed as direct traffic in standard analytics. The dark funnel affects attribution by creating systematic underreporting of brand-building, word-of-mouth, and community-driven demand generation.
Practical responses include adding self-reported attribution fields to high-intent forms, monitoring proxy signals like branded search spikes and direct traffic trends, using third-party intent data to detect research activity before a contact appears in your CRM, and running incrementality tests to measure actual causal impact rather than relying solely on attribution software.
Q8. What is the difference between marketing-sourced pipeline and marketing-influenced pipeline?
Marketing-sourced pipeline refers to opportunities where the first substantive touchpoint originated from a marketing channel: an inbound lead from organic search, a content download that triggered nurture, a paid campaign that produced a form fill. Marketing was responsible for creating the contact in the pipeline. Marketing-influenced pipeline includes a broader set: any opportunity where marketing had at least one touchpoint before the deal closed, even if sales or SDRs initiated the outreach. This distinction matters significantly for reporting.
Marketing-sourced pipeline is a direct accountability metric. Marketing-influenced pipeline shows the broader contribution marketing makes to deals it didn't initiate. Both numbers are useful, but they answer different questions. The key is defining both consistently, using the same definition across quarters, and being transparent with sales and finance about which metric you're presenting in any given report.
Q9. How does Factors.ai handle attribution for B2B marketing?
Factors.ai operates at the account level rather than the individual lead level, which reflects how B2B buying actually works.
Multiple stakeholders at a single account are grouped together, so all their interactions, across LinkedIn ads, Google ads, website visits, webinar attendance, and email engagement, are aggregated into a single account-level journey. The platform supports six built-in attribution models from first-touch through W-shaped and custom configurations, and includes view-through attribution as standard. View-through attribution captures the influence of ad impressions that never generated a click but contributed to conversion, which is particularly significant for LinkedIn where click-through rates are low by nature.
The Company Intelligence integration, launched in late 2025, adds organic LinkedIn engagement to attribution for the first time, giving B2B teams visibility into a channel that was previously entirely uncredited. Factors also offers LinkedIn AdPilot (account-level frequency capping and audience optimization) and Google AdPilot (signal-quality improvement via the Enhanced Conversions API), connecting attribution data directly to campaign optimization rather than treating measurement and activation as separate workflows.
Q10. What is the LTV:CAC ratio, and why does it matter for attribution?
LTV:CAC is the ratio of a customer's lifetime value to the cost of acquiring them. If a customer generates $30,000 in revenue over their lifetime and it cost $10,000 in sales and marketing investment to acquire them, the LTV:CAC ratio is 3:1.
The benchmark for healthy B2B SaaS is 3:1 or higher. Attribution reporting connects directly to this metric because the accuracy of your CAC calculation depends on correctly attributing acquisition costs to closed customers. If last-touch attribution is your primary model, you may severely undercredit awareness channels that contributed to acquisition and overweight conversion-point channels. This makes CAC look artificially low for demand-gen investment and artificially high for brand-building investment, leading to incorrect budget allocation decisions.
Multi-touch attribution distributes acquisition costs across all contributing channels, producing a more accurate CAC figure by channel and segment, which makes LTV:CAC analysis actionable rather than directional.
Q11. How do you prove marketing ROI to a CFO using attribution data?
Proving marketing ROI to a CFO requires connecting marketing spend to closed revenue through a chain the finance team considers credible.
Start with a number that reconciles with finance's actual closed-won figures. If marketing reports $600K in attributed pipeline but finance shows $420K closed, you need to reconcile that gap before any presentation.
Lead with marketing-sourced closed revenue: the ARR directly traceable to marketing-initiated opportunities. Add the influence layer: win rate comparison between marketing-influenced and non-influenced accounts (well-run attribution programs typically show 30-40% higher win rates for influenced accounts). Then present the unit economics: cost per opportunity by channel, CAC payback period, and ROMI. Frame the conversation around capital allocation, not activity volume. 'We invested $300K in demand generation. That produced $1.4M in pipeline and $480K in closed-won ARR, with a CAC payback of 7 months, ‘lands differently than 'we generated 2,400 MQLs this quarter.' The CFO needs to see a defensible connection between investment and revenue.
Attribution reporting, done properly and reconciled to actuals, is how you build that connection.

See how Factors can 2x your ROI
Boost your LinkedIn ROI in no time using data-driven insights
Try AdPilot Today


.avif)

See Factors in action.
Schedule a personalized demo or sign up to get started for free
LinkedIn Marketing Partner
GDPR & SOC2 Type II

.svg)


.png)