
Heading 2
LinkedIn vs Google: A Four-Metric ROI Comparison Every CMO Must See
New data from 100+ B2B teams reveals LinkedIn outperforms Google on ROAS, cost per ICP account, and ACV. Use this comparison to optimize your 2026 ad budget.
Written by

Paula Simpson
CEO, NeonTrumpet
Edited by
.avif)
Vrushti Oza
Content Marketer


.svg)


TL;DR
- LinkedIn delivers stronger ROI. With a 1.8x ROAS vs Google’s 1.25x, LinkedIn ads are driving 44% more revenue per dollar spent.
- It costs less to reach your ideal buyers. LinkedIn’s cost per ICP account engaged is $257, less than half of Google’s $560.
- Meetings are better and cheaper. LinkedIn generates qualified meetings at a 1.3x cost advantage, and with higher decision-maker quality.
- Deals close bigger on LinkedIn. LinkedIn-sourced opportunities produce 28.6% higher average contract values than Google.
You're sitting in a budget planning meeting. Your CFO is asking why you need more money for LinkedIn Ads when "Google has always worked." Your VP of Sales wants to know which channel is actually delivering pipeline. Your CEO is wondering if this whole "social selling" thing is just marketing buzzword bingo.
You need answers. Real ones. With actual numbers attached.
We analyzed performance data from 100+ B2B marketing teams spanning Q3 2024 to Q3 2025. And the results are about to make your next budget conversation a whole lot easier.
The Stakes: A Massive Budget Shift Is Already Happening
Before we dive into the four-metric-takedown, let's talk about what B2B CMOs are actually doing with their money.
Our report showed that over the past year, LinkedIn's share of digital marketing budgets jumped from 31.3% to 37.6%. Google's share dropped from 68.7% to 62.4%. We're witnessing a 6.3 percentage-point shift in market share, which in absolute dollar terms represents a fundamental reallocation of B2B marketing spend.
CMOs don't make these kinds of moves on a whim. They make them when the ROI data becomes impossible to ignore.
So, what does that data actually say?
Metric #1: Return on Ad Spend (ROAS)
Let's start with the metric that makes your CFO's cold, money-loving heart sing: raw return on ad spend.
- LinkedIn median ROAS: 1.8x
- Google Ads median ROAS: 1.25x
LinkedIn delivers a 44% advantage in revenue return per dollar spent, compared to Google Ads.
Read that again. For every dollar you invest in LinkedIn Ads, you're getting $1.80 back in revenue. For Google Ads? $1.25.
A 1.25x ROAS isn't bad. It's positive ROI. You're making money.
But when you're allocating budget between channels, 44% matters. A lot.
If you have $100K to spend and you're trying to hit pipeline targets, that 44% ROAS advantage translates to real money. We're talking about the difference between hitting your number and explaining to your board why you came up short.
Why the ROAS Gap Exists
LinkedIn's ROAS advantage stems from something fundamental: targeting precision.
Google Ads operates on intent signals. Someone searches for "marketing automation software," and boom, your ad appears. That's powerful. But it's also a blunt instrument.
You're catching people at the moment of search, but you have no idea if they're:
- A qualified buyer or a student doing research
- At a company that fits your ICP or a 10-person startup
- A decision-maker or an intern gathering information
- Actually in-market or just browsing
LinkedIn flips this equation. You're targeting based on professional identity: job title, company size, industry, and seniority level. You know you're reaching the VP of Marketing at a 500-person SaaS company, not some rando who typed marketing-related words into a search bar.
This precision means every ad impression has a higher probability of reaching someone who could actually buy. And that precision compounds into higher ROAS.
{{INLINE_BOFU}}
Metric #2: Cost Per ICP Account Engaged
ROAS tells you about revenue efficiency. But what about pipeline efficiency? How much does it cost to get your ideal customer profile accounts into your funnel?
- LinkedIn: $257 per ICP account engaged
- Google: $560 per ICP account engaged
LinkedIn costs less than half of what Google costs to engage an ICP account.
Half. The. Cost.
You can reach and engage more than twice as many high-fit accounts on LinkedIn for the same budget.
This metric is where the account-based marketing rubber meets the road. B2B isn't about reaching everyone. It's about reaching the right ones. The accounts that fit your ICP. The companies that have the budget, the need, and the authority to buy.
When you're running an ABM motion (and if you're not, what are you even doing?), cost per ICP account engaged might be the most important metric on this list.
The Math That Changes Everything
Say you have $50K to spend on paid media this quarter. Your ICP is mid-market tech companies with 200-1000 employees.
On Google: $50,000 ÷ $560 = 89 ICP accounts engaged
On LinkedIn: $50,000 ÷ $257 = 194 ICP accounts engaged
With the same budget, LinkedIn gets you 109 more ICP accounts into your pipeline. That's not incremental improvement. That's game-changing coverage of your total addressable market.
LinkedIn was historically underappreciated because advertisers couldn’t adequately measure their performance. But recently, LinkedIn has really stepped up its game in the measurement department. Advertisers can see the impact of their LinkedIn ads and their true value. Now, more B2B advertisers are pulling from their Google/Meta budgets in favor of LinkedIn.
Metric #3: Cost Per Qualified Meeting
Pipeline velocity matters. How much does it cost to get a qualified meeting on someone's calendar?
Qualified meetings from Google cost 1.3X more than meetings from LinkedIn.
This metric directly impacts sales productivity and customer acquisition cost. Meetings are where marketing hands off to sales. It's the critical moment where opportunity becomes reality.
When meetings cost 1.3X more from one channel versus another, that inefficiency cascades through your entire go-to-market motion. Your SDRs are spending time on meetings that cost more to generate. Your AEs are working on deals that have higher acquisition costs baked in from the start.
The Quality Question
Here's where the LinkedIn data gets really interesting. It's not just that meetings cost less. It's that the meetings are with better prospects.
Survey data from 125+ marketing leaders reveals:
- 71.9% agree that leads from LinkedIn Ads align more closely with their ideal customer profile
- 52.3% say leads from LinkedIn Ads are more likely to be senior-level decision-makers
You're not just getting cheaper meetings. You're getting meetings with the actual people who can sign contracts.
Compare that to Google, where you're often catching mid-level managers doing research, or consultants gathering information for a client who may or may not be in-market.
Metric #4: Average Contract Value (ACV)
This is LinkedIn’s real flex. Deals sourced from LinkedIn don't just close more efficiently. They close bigger.
LinkedIn-sourced deals close with 28.6% higher average contract value compared to Google-sourced deals.
If your typical Google-sourced deal is $50K, your typical LinkedIn-sourced deal is $64,300. That's an extra $14,300 per deal. On a hundred deals, that's $1.43 million in additional revenue. From the same number of customers.
Why LinkedIn Deals Are Bigger
This isn't some random quirk. LinkedIn's account-based targeting enables you to focus your spend on high-value prospects. You can direct budget toward enterprise accounts capable of larger contracts, rather than Google's broader reach that captures intent regardless of account quality.
When you target the VP of Sales at a 1,000-person company versus catching whoever searches for your product category, the ACV difference is inevitable.
The platform enables relationship building at scale. Video ads. Document ads. Thought Leader ads. These formats let you demonstrate expertise and build trust before a prospect ever fills out a form. That trust translates to bigger deals.
The Synthesis: LinkedIn Wins on Revenue, Google Maintains Pipeline Volume
Let's put all four metrics in one place:
| Metric | Google Ads | |
|---|---|---|
| Median ROAS | 1.8x | 1.25x |
| Cost per ICP Account | $257 | $560 |
| Cost per Meeting | Lower (1.3x advantage) | Higher |
| Average ACV | 28.6% higher | Baseline |
LinkedIn wins decisively on three of four metrics. But there is still nuance: Google drives significant pipeline volume. Its broader reach means you'll capture more total leads, even if cost efficiency is lower.
The strategic insight isn't "LinkedIn good, Google bad." It's understanding where each channel delivers maximum value.
Use LinkedIn for:
- High-value account targeting
- Building relationships with buying committees
- Brand awareness among your ICP
- Generating high-ACV opportunities
Use Google for:
- Capturing bottom-funnel intent
- Reaching buyers actively searching
- Geographic or niche targeting
- Volume pipeline generation
The smartest CMOs aren't choosing between LinkedIn and Google. They're allocating budget based on which metric matters most for their business model and growth stage.
The Multiplier Effect: Why This Isn't Either/ Or
LinkedIn doesn't just win on its own metrics. It also improves your Google performance.
Analysis shows that ICP accounts exposed to LinkedIn Ads demonstrate:
- 46% higher paid search conversion rates
- 14.3% of paid search leads actually started their journey on LinkedIn
LinkedIn creates brand awareness and trust, making every subsequent touchpoint more effective. When someone sees your thought leadership on LinkedIn, then later searches for your product category on Google, they convert at nearly 50% higher rates.
This multiplier effect is why the budget shift is accelerating. CMOs are realizing LinkedIn isn't competing with Google for budget. It's making Google perform better.
What This Means for Your 2026 Planning
If you're building your 2026 marketing plan right now, these four metrics should fundamentally reshape your thinking.
The days of defaulting 70-80% of the paid budget to Google because "that's what we've always done" are over. The data doesn't support it anymore.
Survey results show 56.4% of B2B marketers plan to increase their LinkedIn budgets by more than 10% in 2026. These aren't wild experiments. These are calculated bets based on measurable ROI.
Your move: Stop treating LinkedIn as a "brand awareness" line item with fuzzy attribution. Start measuring it on the same hard revenue metrics you use for Google. When you do, the four-metric comparison becomes impossible to argue with.
1.8x ROAS. $257 cost per ICP account. 23% cost advantage on meetings. 28.6% higher ACV.
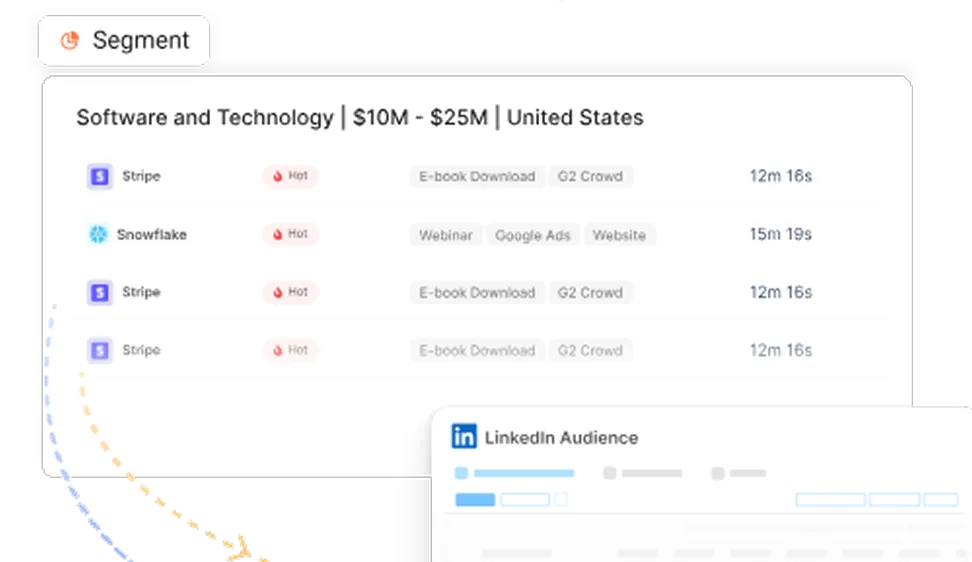
Factors.ai provides unified visibility across LinkedIn, your website, CRM, and G2 so you can prove ROI with the metrics that actually matter. Your CFO doesn't need more convincing than that.
FAQs for LinkedIn Ads vs Google Ads
Q. Is LinkedIn really more cost-effective than Google for B2B?
Yes. LinkedIn ads engage ICP accounts at less than half the cost of Google Ads and produce significantly higher average deal sizes.
Q. Does LinkedIn generate pipeline volume, or just better-quality leads?
LinkedIn excels at quality, better-fit accounts, and senior buyers, but still delivers competitive volume when used strategically.
Q. Why are CMOs shifting budget to LinkedIn?
Because the ROI data is undeniable. LinkedIn outperforms on ROAS, cost per meeting, and ACV, and also improves Google Ads performance.
Q. Should I replace Google Ads with LinkedIn Ads?
Not necessarily. Use Google to capture active demand and LinkedIn to influence high-value buyers. The best results come from combining both strategically.
Q. What’s the biggest ROI difference between the platforms?
Average contract value. LinkedIn deals are 28.6% larger on average, making it a key driver of revenue growth.

See how Factors can 2x your ROI
Boost your LinkedIn ROI in no time using data-driven insights
Try AdPilot Today


.avif)

See Factors in action.
Schedule a personalized demo or sign up to get started for free
LinkedIn Marketing Partner
GDPR & SOC2 Type II

.svg)


.avif)