
Heading 2
What is Lift Analysis?
Learn how B2B marketers use lift analysis to track true campaign performance. Go beyond clicks, measure incremental pipeline, revenue, and buyer progression.
Written by
.avif)
Vrushti Oza
Content Marketer
Edited by

Protim Bhaumik
Chief Marketing Officer
Summarize this article


.svg)


TL;DR
- Lift analysis isolates real campaign impact by comparing performance between those who saw your ads and those who didn’t.
- It’s ideal for B2B, where decision cycles are long, involve multiple stakeholders, and attribution often misfires.
- Key metrics include conversion lift, incremental leads, and pipeline impact (not just clicks or CTRs.)
- Platforms like Factors’ AdPilot help automate testing, prevent data contamination, and visualize which campaigns are worth scaling.
You know that moment when you launch a campaign, open the dashboard, stare at the numbers, and immediately question every life choice that got you here? Yeah… same.
Fifteen form fills are cute and all. But were they driven by your ads, or were they just bored interns downloading stuff for sport?
Meanwhile, your traffic report is yodeling its heart out… and your pipeline is weeping in silence.
ALL this because in B2B, buyers don’t convert… they wander 🧑🦯 They lurk, bookmark, discuss with teammates, revisit your pricing page at 2 am… and maybe three fiscal quarters later, they finally ask for a demo.
So if all you’re tracking is clicks, you’re basically reading newspaper horoscopes and calling it ✨analytics✨.
But then comes lift analysis… it measures impact… it doesn’t ask, “did this campaign run?” but “did this campaign matter?”
Whether you're running ads on LinkedIn or Google, lift analysis helps you identify which campaigns actually drive pipeline and which ones just burn budget.
In this blog, we’re breaking down how B2B lift analysis works, how to set it up without summoning your entire RevOps team into a mess, and why high-performing GTM teams treat it like a mandatory filter before they scale anything.
Ufff… that’s a lot, so let’s get started.
What is lift analysis? (and why you should care)
Lift analysis helps you understand the actual impact of your marketing campaigns by comparing behavior between two groups of people:
- One group sees your ads (test group)
- The other does not (control group)
This comparison shows the extent of change resulting from the campaign. In other words, it gives you the true incremental effect of your marketing.
In B2B, this becomes even more crucial because your buyer journey isn’t linear, and surface-level metrics like clicks and impressions often reveal veryyy little… basically, it’s a group project where only 2 out of 6 people are actually doing any work.
Lift analysis allows you to answer questions like:
- “How many opportunities did we gain because of this campaign?”
- “Are leads from this channel more likely to move to the next stage?”
- “What portion of the pipeline was influenced directly by ad exposure?”
Side-note: You can FINALLY stop asking “Did people click or not???”
The idea is simple… find out what effect your campaigns have on business outcomes.
How does lift analysis differ from traditional attribution?
Most attribution models assign credit to marketing touchpoints based on timing or position in the journey. For example, first-touch attribution assigns full credit to the first interaction, while multi-touch attribution allocates credit across multiple interactions.
This approach doesn’t always reveal whether a campaign was truly useful. Some interactions would have happened even without a campaign running in the background.
But lift analysis shifts the focus.
It asks a more fundamental question: what would the results look like if no one saw the campaign? You get a clear benchmark by comparing the test and control groups.
For example:
- If the control group generated 100 leads
- And your test group generated 140 leads
Then 40 leads were added because of your campaign. That’s a 40% ‘lift’.
Again… this method works particularly well in B2B, where customers see ads, get outbound emails, and visit your site over extended periods. Attribution often struggles to connect the dots correctly, especially when interactions span days or weeks.
Lift analysis doesn’t try to split credit among channels; instead, it zeroes in on what changed because you spent money and ran the campaign. It simplifies measurement and keeps your focus on impact (instead of touchpoint tracking errors).
Also read: AI marketing automation pricing comparison: what B2B teams should actually pay for
Traditional Attribution vs. Lift Analysis
| Category | Traditional Attribution | Lift Analysis |
|---|---|---|
| What it measures | Assigns credit to touchpoints based on when/where they occurred | Measures the incremental impact of a campaign |
| Core question | “Which touchpoint should get credit?” | “What would have happened if no one saw the campaign?” |
| How it works | Distributes credit across first-touch, last-touch, or multi-touch models | Compares performance between exposed and control groups |
| Key limitation | Can over-credit interactions that would’ve happened anyway | Requires clean test/control setup but gives clearer causality |
| Best for | Understanding the journey and mapping interactions | Understanding true lift, what changed because money was spent |
| Common issues in B2B | Long journeys, multiple stakeholders, and delayed conversions make attribution messy and inaccurate | Works well even with long cycles because it measures difference, not touchpoints |
| Output example | “This campaign influenced 140 leads” (even if some were already likely to convert) | “This campaign created 40 incremental leads” (40% lift) |
| Decision-making value | Helps visualize journeys but doesn’t confirm impact | Helps reallocate budget based on what actually drove outcomes |
{{INLINE_TOFU}}
How to run a lift analysis?
1. Start with a clear hypothesis
Before spending a single dollar, define:
- What you want to lift (demos, SQLs, trials…)
- Where you expect to see the lift (top/mid/bottom funnel)
- What success looks like
Example:
“Accounts exposed to our LinkedIn retargeting should generate 20% more SQLs within 30 days.”
A simple hypothesis upfront saves you from running a test you can’t use later.
2. Setting up a valid test and control design for B2B campaigns
Your lift analysis is only as good as your test design. Without a solid design, it becomes difficult to trust the results.
Start by defining two groups:
- Test - sees ads
- Control - absolutely does NOT
These groups should be similar in all ways except for exposure to your campaign. They should share characteristics like company size, industry, or region. This often means creating audience lists at the account or firm level.
For example:
If you are targeting 1,000 accounts on LinkedIn, you might expose 500 to your campaign and keep 500 as a control group
Note: Avoid overlap. If someone in your control group is accidentally served one of your ads, the data becomes blurry. This is especially important when running campaigns across multiple platforms like Google and LinkedIn.
Note 2.0: Ensure your sample size is large enough to show meaningful differences
With a properly designed test-and-control framework, you can validate that the lift is meaningful and actionable rather than just random fluctuation.
3. Run your campaign long enough (B2B ≠ D2C)
B2B conversions take time (A LOT of it). People don’t click today and book a demo tomorrow.
Use this as your guide:
- Top funnel: 2–4 weeks
- Mid funnel: 4–6 weeks
- Bottom funnel: your full sales cycle
A short test might feel efficient, but it won’t tell the real story.
4. Measure beyond vanity metrics
Look deeper than CTR.
Track things like:
- Faster opportunity progression
- Higher-quality SQLs
- Better ACVs
- More buying-committee engagement
- Dormant accounts waking up
If all you measure is clicks, your lift test won’t have much to say.
5. Tie lift to real business outcomes
Your exposed vs. control comparison should map directly to revenue movement:
- Pipeline created
- Demo requests
- SQLs
- Opportunity creation
- Win rates
- Revenue
For example:
“Exposed group generated 31% more opportunities and moved to SQL 22% faster.”
That’s the kind of data that will make your CMO smile like this… 😀
6. Reallocate budgets based on lift
This is the part most teams say they’ll do and then… don’t. But it’s where lift analysis actually pays off.
Use your lift results to make cleaner, bolder decisions:
Also read: Generative AI marketing use cases: what actually works for B2B teams
- High spend + low lift:- cut, pause, or rethink your offer. Something isn’t landing.
- Low spend + high lift:- scale confidently. You’ve found a pocket of efficiency.
- Moderate lift:- experiment with creative, sequencing, or audience refinement to unlock more impact.
The goal is NOT to optimize for cheaper clicks or prettier dashboards. It’s to shift money toward the campaigns that move accounts closer to revenue… and away from the ones that only look busy.
7. Use lift to fix funnels and messaging
Lift results don’t just show what worked… they show why.
Examples:
- Strong demo lift? → messaging is landing, scale it.
- Strong mid-funnel lift but no SQLs? → check your hand-off to sales.
- No lift at all? → revisit audience, creative, offer, or channel-stage fit.
Lift tells you exactly where the blockage is.
8. Build lift analysis into quarterly planning
This is what separates mature GTM teams from the rest.
Use lift insights to:
- Decide which channels belong at ToFu/MoFu/BoFu
- Build better sequencing (awareness → engagement → intent)
- Forecast expected outcomes
- Set better budgets
- Refresh messaging
Over time, lift tests create your team’s version of “GTM instinct,” but backed by data.
9. Use automation tools (like AdPilot) to turn insights into action
Instead of manually stitching exposed vs. control data:
- Auto-create test groups
- Track exposure across channels
- Isolate audiences
- Measure incremental conversions
- Suggest budget shifts
- Visualise lift clearly
With this, you’ll spend less time wrestling spreadsheets and more time optimising (you can thank me later… or get me Vietnamese iced coffee NOW).
10. Rinse, repeat, refine
Lift analysis isn’t a “run it once and forget about it” thing. Your market shifts, your messaging evolves, your product matures, and all of that affects how your campaigns perform.
So your lift will change too.
The teams that win are the ones that treat lift analysis like an ongoing habit, not a quarterly chore. Run it consistently, compare results over time, and use those patterns to make sharper, faster decisions.
That’s where the compounding returns kick in.
Key metrics and calculations
Once your test and control groups are set up, you can begin calculating how much value your campaign truly added. Again, the idea is to isolate incremental performance as results that wouldn’t have happened without the campaign.
- Conversion Rate Lift
Shows the difference in conversion performance between test and control groups. It gives you a baseline sense of effectiveness.
Formula:
Lift % = (Test Conversion Rate - Control Conversion Rate) / Control Conversion Rate × 100
Quick Example:
- Test group: 6% conversion
- Control group: 4% conversion
- Conversion lift: 50%
This difference reflects actual influence and is beneficial when conversions lead to revenue-generating conversations like demos or consultations.
- Incremental Conversions
This metric shows the number of leads, sign-ups, or actions that happened due to the campaign itself.
Example:
- Test group: 120 leads
- Control group: 80 leads
- Incremental leads: 40
Incremental conversions help you understand volume impact and how it affects upper/mid-funnel goals.
- Pipeline Impact
For most teams, success is defined by pipeline impact, especially how it grows with different campaigns.
Example:
- 40 incremental leads
- 25% lead-to-opportunity conversion rate
- $10,000 average opportunity value
Pipeline lift:
40×0.25×$10,000 = $100,000 added to pipeline
Tracking this metric over time helps justify campaign budgets and shape future experiments.
Common pitfalls in lift analysis (and how you can avoid them)
Even well-constructed lift studies can go wrong if certain issues are overlooked.
- Small sample size
Tiny samples create fake confidence. A 30% lift means nothing if it came from five accounts. Always check whether your exposed and control groups are big enough to reflect real buying behavior. If not, your results are just telling stories that might never come true.
- Contamination between groups
If your control group accidentally sees your ads (via retargeting, broad targeting, or overlapping campaigns), the whole test collapses. Map out every channel touching your audience and tighten exclusions so your control group stays truly untouched.
- Missing context
Lift (and life) doesn’t exist in a vacuum. A new competitor entered the market? Quarter-end discounts running? Major product launch? All of these can inflate or suppress lift. Annotate your test window with surrounding activity so you don’t over- or under-credit your campaigns.
- Short test windows
B2B buying cycles are slow and dramatic. If your usual lead-to-demo cycle is 30–45 days, a 10-day test will only capture… nothing. Set your test duration based on your actual CRM conversion timelines to measure the full journey from exposure to opportunity.
- Focusing only on top-level metrics
Also, lift doesn’t always show up at the top of the funnel. Sometimes it shows up as cleaner SQLs, faster deal velocity, or higher win rates. Track mid- and bottom-funnel behaviors as well, because that’s where the real revenue impact lies.
Using lift analysis to optimize your campaigns and budget
The real work begins once you’ve run your first test and have clear lift results. Think of those results as directional signals… they tell you where to invest more, where to cut back, and where to experiment next.
Here’s how to turn those signals into action:
1. Double down where lift is strongest
If a segment, channel, or creative theme shows meaningful lift (demo requests, SQLs, pipeline velocity), increase investment there. This is how you scale efficiently, not emotionally.
2. Fix what’s underperforming
Low lift doesn’t always mean “kill the campaign.” It usually tells you what to fix:
- Wrong audience
- Weak offer
- Creative not resonating
- Mismatch between channel and funnel stage
Lift results show you where the leak is, not just that a leak exists.
3. Compare channels using the same lens
Raw metrics (CTR, CPC, impressions) won’t tell you which platform is working. But lift will.
Example:
- LinkedIn → higher incremental demo lift
- Google → higher incremental pipeline value
This helps you plan channel roles and sequencing instead of treating all channels the same.
4. Build smarter sequencing
If awareness campaigns show strong top-funnel lift but weak SQL lift, don’t scrap them… pair them with stronger mid-funnel nurture. Lift helps you see what stage each campaign actually impacts.
5. Use lift to improve hand-offs
If your exposed group engages heavily but doesn’t progress to SQL, your issue isn’t ads. It’s the sales follow-up or qualification process. Lift highlights operational gaps you’d never catch through attribution alone.
6. Inform quarterly planning
Lift results help you:
- Predict which channels will drive next quarter’s pipeline
- Set realistic targets
- Decide budget splits
- Update ICP or audience logic
- Refresh messaging based on what actually converts
This is how revenue teams get out of “random acts of marketing.”
7. Turn lift into a continuous loop
Teams that optimise regularly outperform teams that optimise reactively. Run lift tests across new segments, new creatives, and new funnel stages. Over time, you build your own internal ‘GTM playbook’ based on real data from your brand, not generic marketing wisdom.
Applying lift analysis to LinkedIn Ads
LinkedIn helps you speak directly to people in specific roles, industries, or companies, and decision makers.
Here's how you can use lift analysis for LinkedIn Ads:
- Start with a segmented audience, based on intent, demographics, industry, interest groups, etc.
- Split those accounts into test and control groups
- Run sponsored content, lead gen forms, or other ad formats to the test group only
- Track outcomes such as form fills, demo requests, or high-intent page visits, and ad views that led to pipeline.
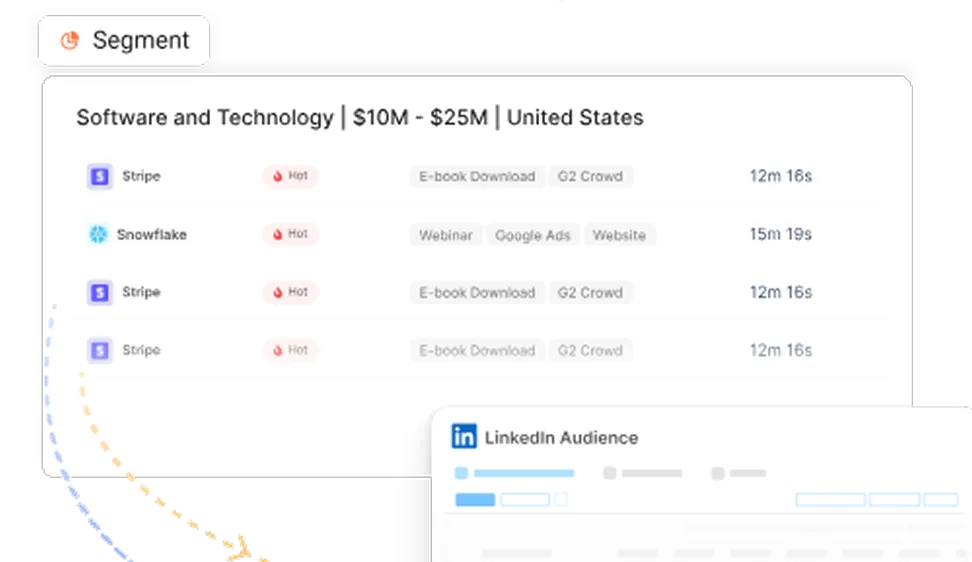
You can use LinkedIn’s built-in reporting and your CRM and website data together to track lifts in performance. For example, compare how many opportunities came from companies that saw ads versus those that didn’t.
Don’t launch another LinkedIn campaign without keeping these in mind:
- LinkedIn can be expensive, so measure what your spending actually does from the get-go
- Ensure your CRM connects campaign exposure with pipeline actions
- Watch out for people who see LinkedIn ads and later visit your site without clicking. Then, use the LinkedIn Insight tag to capture that view-through behavior
Wait, our LinkedIn AdPilot can help scale your ads, here’s how…
LinkedIn AdPilot helps you:
- Build dynamic, real-time ICP audiences
- Control impression pacing and creative reach
- Understand true pipeline influence, even for view-through conversions
“With Factors, our LinkedIn Ads went from a guessing game to a laser-focused strategy.”
- Riley Timmins, Director of Marketing at Cacheflow
Applying lift analysis to Google Ads
Whether you’re running Display, Search, or YouTube ads, you can use lift analysis to measure effectiveness.
Here’s how you can use lift analysis for Google Ads:
- Use conversion lift testing (where available) or geo-based experiments
- Pick a region and audience segment to serve ads to
- Hold back ads from a similar segment to serve as your control
Google lets you compare conversion results between exposed and non-exposed groups.
A few tips for your Google Ad campaigns:
- Ensure your tracking catches form fills or calls from higher-level interactions, not just easy-to-attribute clicks
- Use a consistent conversion window that matches your normal sales cycle
- Build segments based on firmographics if possible, not just generic remarketing groups
Once the test is complete, compare your performance metrics. This shows exactly how much of your conversion or pipeline growth came from advertising with Google platforms. You can then make smarter decisions about where to allocate budgets and which types of campaigns drive real value for B2B buyers.
Wait, our Google AdPilot can also help scale your Google Ads, here’s how…
Google AdPilot ensures:
- Search and display budgets are better directed toward ICP-fit accounts
- Google algorithms are trained with more conversion and account-level data
- Funnel-level metrics track what really matters: revenue from the right accounts
Both platforms were built for revenue-focused marketers who want no guesswork and no wasted spend.
“Before AdPilot, nearly 50% of our Google Ads spend went to non-ICP accounts. That meant wasted budget and poor conversion signals back to Google. With AdPilot, we can focus only on our ICP accounts, the ones most likely to convert, and feed Google the right data to optimize for high-value deals."
- Mansi Peswani, Demand Generation Lead at Factors.ai
👉 Explore how marketing teams use Factors AdPilot to strengthen their channel ROI and prove real impact: Book a demo →
In a nutshell
Lift analysis helps you go beyond surface-level metrics and uncover the actual business impact of your B2B campaigns. For companies running LinkedIn Ads or Google campaigns, it’s a smarter way to know whether what you’re doing is creating real pipeline, or just clicks.
If you're looking to:
- Validate your spend across different platforms,
- Connect your campaigns to meaningful revenue outcomes, and
- Fine-tune your channel mix with real incremental data,
... it’s time to add lift analysis to your stack.
But tracking and optimizing multi-channel results is only half the story. The right platform can take that insight and turn it into action, automatically.
FAQs for lift analysis
Q. What is lift analysis in marketing?
Lift analysis measures the incremental impact of a marketing campaign by comparing performance between two groups: those exposed to the campaign (test group) and those who weren’t (control group). This helps you understand the true effect of your efforts beyond what would have happened anyway.
Q. How is lift analysis different from traditional attribution?
Traditional attribution models credit conversions based on touchpoints, like last-click or multi-touch. Lift analysis goes further by comparing outcomes between exposed and non-exposed audiences, giving you a clearer picture of what the campaign actually drove.
Q. Can you use lift analysis for B2B marketing?
Yes. Despite longer sales cycles and complex buying teams, lift analysis works well in B2B. It helps isolate the real impact of campaigns across stages like engagement, lead generation, and pipeline outcomes.
Q. How do I apply lift analysis to LinkedIn Ads or Google AdPilot?
For LinkedIn: build test and control groups using matched audiences and measure outcomes like conversions or qualified leads. For Google AdPilot: use conversion lift testing or account-based geo-experiments to run similar comparisons.
Q. What metrics should I track in a lift analysis?
Focus on conversion rate lift, incremental conversions, average deal value, and even pipeline impact. In B2B, metrics like ROAS uplift, deal velocity, and pipeline growth matter most.
Q. What are common mistakes in lift analysis?
The most common ones include poorly matched control groups, too few data points, cross-channel contamination, and stopping the test too early, especially if your sales cycle spans weeks or months.

See how Factors can 2x your ROI
Boost your LinkedIn ROI in no time using data-driven insights
Try AdPilot Today


.avif)

See Factors in action.
Schedule a personalized demo or sign up to get started for free
LinkedIn Marketing Partner
GDPR & SOC2 Type II

.svg)


.png)