.svg)


Translucent Touchpoints: How to go about attributing your Audio/Video content
Podcasts are bigger than ever. The number of series worldwide have shot up from an already sizeable 500,000 in 2018 to a whopping 2 million in 2021. Unsurprisingly, podcast consumption has also been rising steadily over the past 15 years. In fact, nearly 60% of all American adults report that they’ve listened to at least one episode this year.
And Videos? They're bigger still. A third of all online sessions are spent consuming videos — everything from sleep talking cats to educational/explainer videos. To sit down and watch every single one published over the past month alone would require approximately 5 million years. And the best part? Nearly all of this is available on the internet for free. As a result, audio/visual content is more accessible, and hence, more popular than ever before.
The opportunistic folk that we are, B2B marketers have taken little time to capitalize on this wave. I can’t remember the last time I scrolled through my Linkedin feed without stumbling across a post for a friend’s friend’s colleague’s boss’s brand new B2B SaaS RevOps podcast. In fact, upwards of 85% of businesses today produce audio/video content as part of their marketing efforts. They are by far the fastest growing marketing channels out there.
And why not?
Just like any other marketing channel, podcasts and videos can be effective mediums to communicate a specific message to a specific set of people. They are relatively easy to ideate, produce, and distribute. They require little investment from either the supplier or the consumer. And they’re far more palatable than a 20-page white paper.
Yet, while audio/video content can be valuable assets, marketers face one glaring issue when it comes to identifying and measuring their ROI in terms of conversions — trackability. As is the case with any marketing activity, marketers are keen to understand how their content is performing. However, since anyone can listen to a podcast, or watch a YouTube video anonymously through any device, it becomes nearly impossible to accurately track how your content is contributing to pipeline and revenue.
How then must a marketer go about gauging their content's performance?
While there is no perfect solution to this quandary yet, here are a few tips to indirectly optimize your attribution process:
1. Unique URLs
Create a unique URL for every podcast/video you produce. Drive all your marketing efforts (social media posts, emails, etc) towards that URL. And use that URL as a proxy to track detailed information on who’s landing on your page. Once this data is consolidated, it can be stitched onto the remainder of your customer journey (ads, website, CRM, etc) using Factors.AI. Ultimately, this will indirectly provide insights into your content's pipeline contribution.
2. Distinct promo codes
Along similar lines as the previous point, it might be worth employing distinct promo codes for each piece of content you release. The logic behind this is that when a prospect enters a specific code, it provides an immediate signal as to where they’re coming from. This information can then be accounted for in your CRM for further analyses. That being said, a few issues may occur if listeners/viewers refer the promo codes to their networks. As there’s no automated method to verify the same, one may run the risk of corrupting their datasets and insights.
3. Don’t forget your Guests
Speaking of recording contact data into your CRM, always ensure you do the same with your guests as well. More often than not, guests are invited to marketing podcasts for two of two reasons — one; they’re experienced professionals with vast knowledge on the topic of discussion. And two; they themselves fit the Ideal Client Profile (ICP) that the host company is going after. Inviting a guest onto a podcast is often simply a wind-about route to securing a demo call. With this in mind, it’s important to account for your guests. This way, if they do eventually close a deal with you, the podcast is present as a definite touchpoint.
4. Just ask!
Audio/Visual content attribution is a real challenge. There are only so many behind-the-scenes steps you can take to optimize for an accurate customer journey. That being said, one sure shot approach to tackling this evasive phenomenon is to simply ask your customer about their journey to purchase. Maybe a friend told them about it, maybe they read a positive review on ProductHunt, or maybe, just maybe; they loved that one demo video you released last week! Either way, it doesn’t hurt to ask.
And there we have it!
Though they’re far from perfect, we’ve covered a few simple tricks to track customers who become customers as a result of a degree of influence by your AV content. Listen/View counts and geographical metrics are decent metrics to gauge content performance. But drilling down into who is sliding down the funnel as a result of your content is pivotal. Using unique URLs and Promo codes, and making a habit of accounting for your guests are great ways to grasp a high-level understanding of your content's contribution to revenue and pipeline. And if it comes down to it, just asking your customer about their journey will also be fruitful .

A Step-by-Step Guide to Implementing a Conversational ABM Strategy
Human beings are social animals. Over thousands of years, we’ve developed gestures, languages, and tools to express ourselves to those around us. Our exceptional ability for communication has empowered us to exchange ideas like no other species on the planet. Given that this dialogue is at the heart of the human experience, it’s of little surprise that Conversational ABM is becoming an increasingly effective engagement technique for the modern-day marketer.
TL;DR:
- Conversational ABM is a marketing strategy that uses chatbots or live chats to actively engage with target accounts.
- It is crucial to identify and segment your prospects since the demography of each prospect could vary.
- Set proper boundaries when assigning SDRs and ensure that the visitors are routed to appropriate SDRs.
- Ensure you’re running personalized ads to each prospect and provide relevant and consistent messaging throughout.
- One of the best platforms to converse with your prospects is LinkedIn.
- Be ready for your prospect at any time by using AI-powered chatbots.
What is conversational ABM?
Conversational ABM is a marketing strategy that uses chatbots or live chat to engage actively with target accounts.
With real-time conversations, businesses can build strong relationships with their target audience and address specific needs. In addition, it creates a more human connection with prospects, leading to a higher likelihood of closing a deal.
And because 90% of prospects identify live messaging as their most favored channel of business communication, conversational ABM is a strategy worth considering.
How to implement a Conversational ABM strategy?
1. Identify your target accounts
As is the case with any ABM strategy, your first step should be to align marketing and sales through a collaborative identification of accounts.
The target list is usually determined by a few specific firmographic characteristics such as industry, revenue, and geography. Once generated, this list will dictate the tone and language of your messaging, content, and campaigns. So getting it right is pretty important.
2. Identifying and segmenting prospects
Once you’ve created a fresh list of target accounts, the next step is to identify individual users at these target accounts to reach out to within this list. Maybe you want to target CXOs, or maybe managers, or maybe engineers, or maybe a combination of a variety of such roles.

Regardless, the optimal approach for each demographic will undoubtedly vary. Hence, it would make sense to segment this list of prospects further by customer life cycle, sales stage, pain points, and, most importantly, intent. Then the person in charge allocates this segmented list among Sales Development Representatives, who can work out distinct marketing strategies for their targets.
3. Building boundaries
In an ABM approach, it is important to assign individual Sales Development Representatives to build a strong relationship with each prospect.
When assigning SDRs, always keep in mind to set strict ownership boundaries. It helps route the visitors to appropriate SDRs and eliminate any engagement overlaps.
4. Personalizing ads
Okay, now you know whom you’re contacting and why. Now it’s time to think about the approach for each prospect. This stage involves an intricate balancing act between personalization and scale.
Of course, every individual in every role across every company you’re targeting has their own unique preferences — but personalizing ads at that level isn’t feasible. Instead, customizing ads on a higher level — say, by role or industry, is the way to go. This entails running campaigns based on prospect-specific pain points, and value adds.
A CMO may care about marketing’s influence on revenue, while a marketing manager may be interested in improving workflow and automation. Your campaigns should resonate appropriately with all such use cases.
5. Sentry Surveillance
Your target list is ready, and your personalized ads are running. Now, the second a prospect from your list is on your website, your marketing + sales teams need to be conversation-ready.
The first step here is to make sure everyone has access to all the information they’ll need. It means all your CRM data, marketing automation data, and intent data should be consolidated, organized, and easily accessible. Once equipped with all relevant information about the visitor and their company, your SDR team is all set to engage with the prospect.
6. Complete consistency
Personalization is the most important aspect of conversational ABM when a prospect is currently on your website.
Assuming your prospects love your ads and visit your website, they should be landing on a homepage that’s relevant to them. Any decent content management system (CMS) will be able to identify a contact when they land on your homepage and cater to the web flow in a manner that ensures a personalized experience.
7. Chit-Chat
A relevant landing page will definitely help direct prospects toward your product. But a lot of the time, this won’t be sufficient.
A target will stay on your website only for a few precious minutes, and it’s important to make the most of it. Sure, you could wait until they make their way to the demo form and submit their details — but Conversational ABM encourages marketers and SDRs to proactively reach out through a relevant live-chat message.
References to the contact’s role, the company’s signals, or a prominent pain point are all great ways to get the conversation going. This is the meat and potatoes of the Conversational ABM process. SDRs utilize target data to provide a genuine, relevant, and personal dialogue with their prospects to confirm a demo and push accounts through the funnel
8. Conversational ABM - Around the clock
Conversational ABM involves interacting and connecting with prospects around the clock. While thorough research and proactive interactions are valuable tactics, you may want to employ AI-powered bots to render the process air-tight. So when you do happen to get that one inbound demo at 4 in the morning, you can trust that your chatbots will be up to schedule that demo for you.
Oh, and another thing — conversational ABM doesn’t top conversations on your website. Linkedin is your friend when it comes to interacting with your target’s content posts. Feel free to leave likes, comments, and, if appropriate, connection requests with prospects.
Conclusion
And there we have it. When executed well, conversational ABM can be a valuable strategy to bolster your marketing efforts and improve conversions. Though it’s definitely a lot more effort than traditional marketing techniques, conversational ABM pays its dividends in the long run. Prospects form stronger associations with the product and are almost certainly more likely to convert from a distant target to a tight-knit customer.
Factors.ai enables easy integration with CRM platforms like HubSpot and Salesforce. This can help you generate a more effective ABM campaign. Signup for free or book a demo to start your Conversational ABM campaign today.
.webp)
A (non-exhaustive) list of limitations with GA4 [2022]
With GA4 here to stay, here’s why you might want to leave
[July 5th 2023 Update] As of this month, GA4 has been sunsetted. What's more? Sweden has recently announced a comprehensive ban of Google Analytics due to security concerns. The Swedish Authority for Privacy Protection has cautioned users against the use of GA as a result of privacy risks posed by the U.S. government. This makes Sweden one of several European nations to have elected to ban Google Analytics in recent months.
It’s official — on July 1st, 2023, GA4 will permanently replace Universal Analytics (GA3) as Google’s primary marketing analytics platform. While ga4 vs universal analytics (ua) is still hotly debated, the general verdict emerging within the marketing community is that ga4 falls short in several, fundamental aspects. Criticism ranges from ga4’s exceptionally unintuitive UI to limitations around ga4 events, event parameters, and reporting mechanisms. The following article lists out a few of these major drawbacks to highlight why it may be time for B2B marketers to consider ga4 alternatives.
I usually can find my way round any piece of software quickly. But Google Analytics 4 is making me cry...
I've never seen a tool upgrade that made simple things sooo complicated :face_palm: Non-tech business owners were already struggling to use it. But now they have NO chance.
Gill Andrews (@StoriesWithGill)
GA4 migration challenges
The most pressing issue with migrating to GA4 is that the platform is not ready for independent use as of yet. Several bugs continue to persist, third-party integrations are scarce, and many features, including core ones like internal filtering, continue to remain under development. To be fair, ga4 is likely to squash these issues by the time it's standardized in 2023. But at the moment, ga4 is a half baked product.
How to set-up GA4? Well, the logistics of migrating to ga4 isn’t all that straightforward either. While former universal analytics users have the option to upgrade for free, this facility is not available for all ua properties. Depending on your Google Tag Manager implementation, setting-up GA4 can take significant time and effort (depending on developer bandwidth) — in some cases, as long as a month!
Marketing analytics on GA4
Missing metrics and reports on GA4
A big change from UA to ga4 is the shift away from sessions and pageviews. Hit types like page views, social, transaction, use-timing, and more have been consolidated into a single measurement property on ga4 — events. Familiar metrics like average session duration and bounce rate have been stripped as well. The latter is an especially jaring loss because it’s a valuable metric for marketers to understand and compare landing page performance.
Standard reports have also taken a hit in google analytics update from UA to ga4. For instance, acquisition reporting on UA had as many as 30 standard reporting techniques. This included useful features such as traffic acquisition reports and source/medium reports. Unfortunately, ga4 has adopted only 10% (just 3) of its predecessors standard reports! One explanation for this is that ga4 is transitioning from a full fledged marketing analytics platform to a solution that enables you to capture and transport data elsewhere for further analysis.
Conversion tracking on GA4
Universal analytics offered 4 types of goals — session duration, page/sessions, destination, and event. Conversion goals could easily be configured, for example, a “thank you” page could be tagged as the destination to measure form-fill conversions, in a matter of seconds. Because ga4 misses out on this “destination” goal type, ga4 requires tedious, manual GTM configurations to set-up “form-fills” as a conversion goal. In fact, Zack Duncan from the Root and Branch Group found that it takes around 16 minutes (along with adequate knowledge of GTM) to configure submission tracking on GA4 (as compared to a minute on UA). This is a major limitation for B2B SaaS websites and marketers as a significant proportion of leads come through demo form fills.
Event collection on GA4
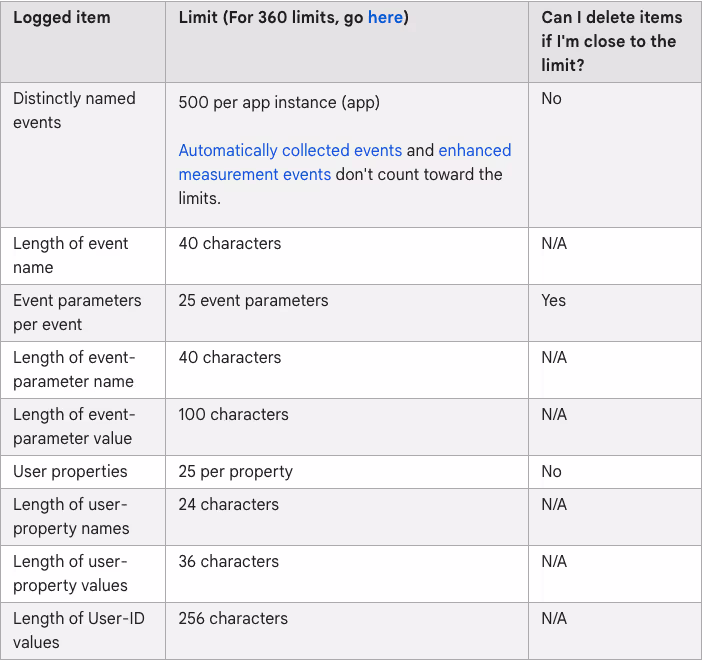
Other Ga4 mechanisms have also faced significant backlash for a couple of reasons. Let’s start with event collection limits. As a rule, ga4 will not log events, event parameters, and user properties that exceed these limits:
- Distinctly named events: 500 per app instance
- Event parameters per event: 25 event parameters only
- User properties: 25 properties only
While these limits may suffice for early-stage teams, event collection on ga4 will almost certainly become an issue once the organizations starts to scale and garner complex events on relatively high-traffic websites.
Character limits on GA4
What’s especially concerning is that on ga4, distinctly named events and user properties can not be deleted/updated if you’re close to hitting their limits. In addition, ga4 heavily restricts character length on event and user names and values. For example, ga4 will truncate page names to a maximum of 300 characters. So, if your landing page has a url longer than 300 characters (which is far from uncommon), it will consider only the first 300 characters and perform attribution and analytics based on that. This could also mean that the entirety of the UTM may not be sent to google analytics servers, which in turn means a significant loss in data.
Data sampling and Processing time on GA4
Credit where credit is due — ga4 has taken a big step in the right direction by eliminating data sampling for standard reports. The keyword here, however, is standard. Advanced reporting (explore, advertising, configure) on ga4 continues to sample data under certain conditions. These advanced reports include core techniques like funnel exploration, path exploration, user explorer and more.
A drawback of unsampled data analytics on ga4 is the processing time. Standard ga4 claims up to 24 hours of processing time for intraday reporting and as much as 48 hours for complex features like multi-channels funnels and attribution modeling. To put this in perspective, Factors.ai delivers standard reports near instantly and will require at most 24 hours (half that of ga4!) for multi-touch attribution reporting.
While on the topic of data, it’s worth mentioning that ga4 offers data-retention for up to 14 months only. What’s more? XL properties are limited to a measly 2 months! This can be of great hindrance to B2B SaaS marketing analytics — wherein customer journeys can easily stretch across a couple of years.
Custom events, properties, and dimensions on GA4
As of today, GA4 supports only 2 scopes for custom dimensions: event scopes and user scopes. This is two less than UA’s custom scopes which covered session and product dimensions as well. What’s worse is that the pair of custom dimensions offered on GA4 are heavily limited (even with GA360!). Here’s how the limits break down for standard GA4:
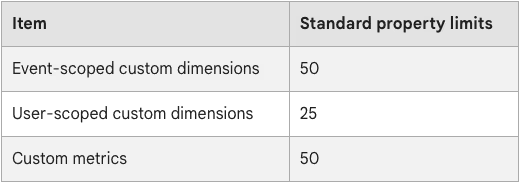
- Event-scoped custom dimensions: Max 50
- User-scoped custom dimensions: Max 25
- Custom metrics: Max 50
If you reach the ceiling on these custom dimensions, unfortunately your only option on ga4 is to archive infrequently used dimensions and hope for the best.
And there you have it…
This article explicitly covers a non-exhaustive list of shortcomings with GA4. Other concerns include useability, privacy-risks, lack of third-party integrations, and challenges at scale. While Google Analytics has dominated the marketing and web analytics space for years now (mostly because it’s a free tool), its limitations are starting to catch up with it. With dozens of robust Google Analytics alternatives emerging from the market, now is the time to replace ga.
Factors is an end-to-end marketing analytics and revenue attribution platform that goes above and beyond the likes of Google Analytics to help you make sense of (and optimize) your marketing efforts. Here’s how Factors compare to Google Analytics.
Interested in learning more? Book a personalized demo here!
9 SaaS Marketing Metrics You Should Be Tracking
Not all SaaS marketing metrics are made equal
Between traffic, conversion rates, MQLs, CAC, churn, and more, there’s no shortage of key marketing metrics for SaaS companies to track.
Each of these metrics allows teams to capture the pulse of marketing health, which in turn helps make iterative improvements to marketing performance and ROI.
No doubt, SaaS marketing metrics are important.
But it can also be overwhelming for teams to know which metrics matter more than others. Given that monitoring marketing metrics can be an investment in and of itself, it’s vital to prioritize a few key ones to begin with.
This blog explores 9 of the most important SaaS metrics that every marketing team should regularly keep tabs on. But first, let’s briefly discuss what marketing metrics are and why they’re important.
Related reading: 9 ABM metrics to track campaign success
What are SaaS marketing metrics?
SaaS marketing metrics are standards of measurement used to monitor the efficacy of SaaS marketing campaigns and assets.
These metrics provide a frame of reference to compare past and present performance in order to continue to make iterative improvements to desired objectives.
For instance, observing that the signups have dramatically increased by 40% after a landing page design overhaul is clear evidence of improvement in performance. At a deeper level, SaaS marketing metrics like return on investment helps marketers prove the impact of their campaigns on pipeline.
In summary, marketing metrics help SaaS companies track performance, improve ROI, and quantify bottom line impact.
9 key marketing metrics for SaaS companies
1. Website traffic
Definition: Website traffic refers to the total number of web sessions or website visitors over a certain period of time.

Especially in SaaS, the website is at the heart of business. It acts as a hub for prospects to learn more about your work and reach out for a demo call or free trial. Needless to say, not all traffic is from high-intent prospects. In fact, only a fraction of traffic is likely to be relevant to your business. That being said, when used in tandem with other metrics, website traffic can help SaaS companies asses how the number of visitors interested in your brand and product.
Several tools including Google Analytics and Factors.ai measure website traffic. It’s a helpful metric to understand high-level website health as well as the immediate impact of marketing campaigns and content. While traffic in and of itself may not provide granular insights, growing traffic is generally a positive sign as it means more visitors are likely to eventually convert to paying customers.
2. Conversion rate
Definition: Conversion rate measures the proportion of users who complete a certain event or action.
Conversion rate % = total conversions ÷ total visitors x 100
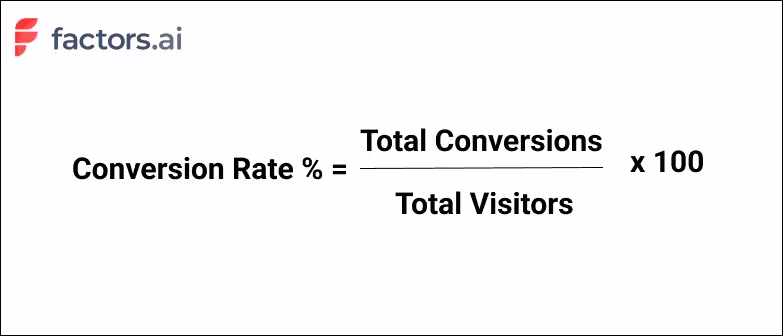
Conversion rate is a broad SaaS marketing metric that can apply to a wide range of scenarios such as webinar registrations, demo form submissions, or trial sign-ups.
One of the most common uses of conversion rate is in landing pages.
For example, say 50 people click on a search ad and arrive at a landing page with a demo form. 2 people actually submit the demo form and schedule time to speak with a sales rep. In this case, the conversion rate is 2/50 x 100 = 4%. Maybe improving headline relevancy and page design could increase conversions even further.
The average benchmark landing page conversion rate is 9.7%

3. Bounce rate
Bounce rate is defined as the percentage of website visitors who click away from a website without viewing or interacting with any other page apart from the one they initially landed on.
As much fun as it sounds, bounce rate is a serious marketing metric that reflects the quality of your web pages. A high bounce rate indicates that your web page design/content does not resonate with the visitor, causing them to leave without exploring any further.
Bounce rate = total one-page visits ÷ total visitors x 100

Note that a landing page with a high-bounce rate isn’t necessarily a cause for concern given that the purpose of the landing page is almost always to bring in a visitor, have them submit a form, and leave.
Instead, bounce rate is more relevant for the homepage, feature page, pricing page, or blogs. High bounce rates in such pages indicate that the content or design isn’t relevant or captivating enough for the visitor to continue exploring the website.
Bounce rate benchmarks:
- 0-40% bounce rate: excellent performance
- 40-55% bounce rate: decent performance
- 55% - 70%: mediocre performance
- 70%+ bounce rate: poor performance
Average bounce rates by channel:
- Display ads: 56%
- Social: 54%
- Direct: 49%
- Paid search: 44%
- Organic: 43%

In addition to tracking traditional bounce rates, Factors.ai shows granular insight into exit and engagement rates as well. This provides complete insight into where visitors are dropping off and what content resonates most with the audience.
4. Marketing Qualified Leads (MQLs)
It’s all well and good to improve website traffic but real marketing impact involves driving qualified visitors who show explicit potential to eventually become paying customers. Marketing qualified leads is a metric that captures the number of leads early along the customer journey — but nonetheless on the path to becoming customers.
Marketing qualified lead (MQL) measures the number of top-of-the-funnel leads that exhibit explicit interest in what a company has to offer based on their interactions across paid campaigns, social media, website, and other touchpoints.

For example, a visitor downloading an eBook on “customer journey mapping” is likely interested in addressing this use-case and is at the very least open to learning more about Factors. Generally speaking, this lead can be considered an MQL.
Factors.ai connects the dots between campaigns, website, and CRM to showcase which marketing efforts and assets are contributing to MQLs, SQLs, deals, and other lifecycle stages.

5. Sales velocity
Sales velocity is defined as the rate at which leads and prospects move through the sales funnel and generate pipeline.
Sales velocity = (opportunities x deal value x % win rate) ÷ length of sales cycles

Sales velocity indicates the health and performance of sales and marketing teams to herd buyers towards becoming paying customers.
Go-to-market teams can improve sales velocity by:
- Increasing number of opportunities by scaling marketing initiatives and sales outreach
- Increasing deal values by targeting larger customers
- Increasing % win rate by improving sales pitches and enablement material
- Decreasing the length of the sales cycle with incentives like free trials or limited time deals

Funnel analytics on Factors.ai allows users to calibrate custom sales cycles to identify the velocity between one stage to the next. With this, users can understand how long it takes for visitors to progress from ad campaigns to web sessions to button submissions to deal won. In turn, this helps identify points of weaknesses or friction to eliminate across the journey.
6. Customer Acquisition Cost
Most marketing teams invest significant resources in paid campaigns, social, SEO, and offline events with the hopes that these initiatives attract further customers to cover their costs several times over.
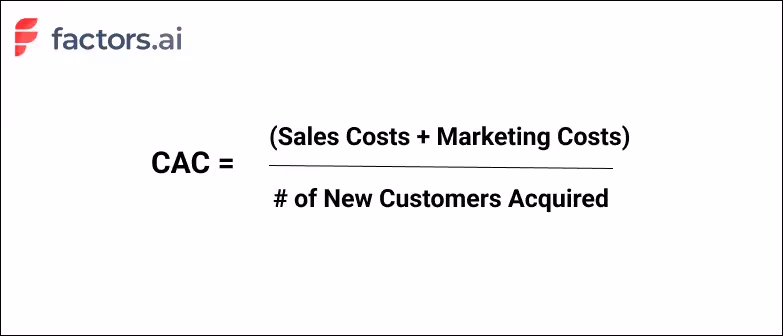
Customer acquisition cost (CAC) or cost per acquisition (CPA) is a metric that measures the amount of money spent to acquire a single new customer.
In theory, this includes employee compensation, overheads, and, of course, marketing expenses. In practice, most teams only consider the latter.
For example, if a marketing team spends $70 on ads and $30 a website redesign to acquire 20 new customers, the CAC works out to be: ($70 + $30) ÷ 20 = $5 per customer.
7. Customer lifetime value
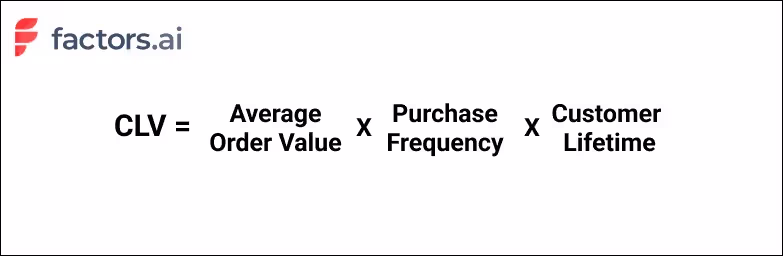
Customer lifetime value (CLV) is the total expected revenue from a customer during the entire relationship with a business.
For instance, long-term, enterprise customers with large contract values are bound to have greater CLV than mid-market customers with short-term contracts.
While it certainly helps to know the cost of acquiring a single customer, it’s crucial to measure the lifetime value of each of these customers to truly understand if acquisition initiatives are worth it.
For example, if it costs $300 to acquire a single customer with a customer lifetime value of $250, it’s actually a loss of $50 to the business. Alternatively, if CAC is $500 but CLV is $5000, the customer pays back the CAC several times over. Hence, it’s important to look at CAC and CLV in conjunction.
8. Return on marketing investment (RoMI)
Now more than ever, SaaS marketing teams are urged to prove their impact on bottom line metrics like pipeline and revenue. This is where RoMI comes in.
Return on marketing investment (RoMI) measures the revenue won from marketing campaigns against the cost of that campaign.
RoMI = revenue earned from campaign ÷ cost of campaign x 100

In theory, the RoMI is a straightforward concept. But in practice, calculating RoMI without the right multi-touch attribution tools can be an unintuitive, time-consuming chore. Given that SaaS sales cycles involve several touch-points across several campaigns and stakeholders, it’s hard to pin-point exactly which campaign contributed to revenue.

Factors.ai solves for this challenge with a wide range of powerful revenue attribution models to quantify marketing ROI. In turn, this helps allocate budgets towards campaigns that drive results and prove marketing’s impact on revenue.
9. Retention & Churn
We’ve combined retention & churn together as they’re two sides of the same coin.
Customer retention measures the number of customers that a business retains over time through repeated purchases or contract renewals.
Customer retention is an important SaaS metric as retaining existing customers works out to 5-10 times cheaper than acquiring new ones. Hence, businesses should always look to improve retention rates.
On the flip side, Churn refers to the number of customers who discontinue their relationships as buyers with a business.
A high rate of churn indicates that customers are not receiving the value or service they expect from the business. It’s a strong signal of dissatisfaction. Hence, businesses should always look to limit churn rates.
And there you have it. While there are several other important SaaS marketing metrics out there, the 9 metrics we’ve covered in this blog should give any SaaS marketing team an idea of their top and bottom line performance.
Want to learn more about how Factors.ai can help ll the metrics that matter to you under one roof? Request a personalized demo today!

The Principles Of Modern B2B Marketing I: Brand Building Vs. Sales Activation
B2B marketing strategies that maximize growth
B2B marketing may be in trouble. Research suggests that B2B organizations are inadvertently transforming marketing into a supporting tool for the sales function. In reality, however, marketing is at the very core of a business. With the right principles securely in place, B2B marketing may well transform into the growth engine of B2B organizations.
It’s about time we rethink the principles of marketing
Linkedin’s B2B institute recently conducted wonderful research using B2B effectiveness data in collaboration with Peter Field, Les Binet and the IPA. The primary motivator of this research was to identify the best marketing principles that correlated with growth. Keep in mind that in this case, growth does not mean improving CTR, impressions, engagements or other traditional digital marketing metrics. Instead, we’re referring to growth in terms of market share, revenue, profitability, and other bottom line business metrics.
What makes this research especially special is the fact that it's never been done before through the lens of B2B marketing. That is, of course, until now. The following series will delve into each of these principles one article at a time with hopes of providing an intuitive, straightforward explanation of cutting-edge B2B marketing research.
If you had to take away one thing from this series, it’s this:
Extensive research and anecdotal evidence point to one thing — The key to marketing-sourced growth is balance. While this may seem obvious, the truth is that modern B2B marketing is almost always unbalanced. They tend to involve solely short-term, volume-based endeavors that play to logic and reasoning as opposed to a balanced view of short AND long term strategies that consider volume AND price, logic AND emotion, awareness AND fame.
With that out of the way, let’s finally move on to the first principle of B2B marketing strategies that maximize growth.
Brand Building Vs. Sales Activation
A. Have Your Cake & Eat It Too: Brand Building and Sales Activation I
In their research, Binet and Field identify two types of marketing:
1. Sales activation: Sales activation definitely provides short-term growth. But while sales activation captures existing demand, it does not create it. Results with sales activation often produce results that decay just as fast they appear – which isn’t necessarily a bad thing, just something to keep in mind for the long term.
2. Brand building: Brand building provides long-term growth. In a sense, this creates and captures demand together. Note that when executed well, brand building delivers short-term growth as well. So the big takeaway is that you don’t have to pick between one or the other. In a sense, brand building contributes to future demand to ensure a durable pipeline of future sales and profits.
Ideally, a combination of both types of marketing will yield the best results. If you had to pick one, however, the choice is easy. Brand building is the only strategy that delivers both short-term and long-term growth.
B. The 60/40 Rule: Brand Building & Sales Activation II
In B2C marketing, organizations with the most short-term and long-term growth spend most of their budget towards branding (60%) as opposed to sales activation (40%). In most B2B orgs, this marketing investment is skewed in the opposite direction; with most spend being allocated towards activation (54%).

What might explain this variation? Put simply, B2B sales is harder. It involves several touch points across several stakeholders over several months. It also necessitates far more exposition around the product, use-cases, functional benefits, and more. There’s no doubt that in B2B, sales activation, especially in early-stages, has an important (albeit expensive) role to play. But as the novelty and needs of a new business fades, marketing needs to mature towards a brand-focused distribution to ensure sustainable growth.

C. Flip The Funnel: From ToFu/BoFu To In/Out Market
The funnel is a well-known construct in B2B marketing. The conventional B2B funnel depicts a voluminous top-of-the-funnel that wittles down along each step of the funnel towards the bottom of the funnel. Interestingly, Binet and Field suggest flipping the funnel. Rather than ToFu and BoFu, they recommend thinking of the funnel as “in market” buyers and “out market” buyers. In this case, activation spend is mostly for limited market buyers while branding spend is for the much larger, out market buyers.

This approach tends to be more customer-centric because:
- Customers don’t think of themselves as being in the “brand building” phase or “sales activation phase”. Instead, customers think of themselves as being “in-market” to buy a product or “out-market” to not buy a product at this moment.
- Marketers have two customers: Your external customers and your internal finance team. Thinking about the funnel as current cash flow customers and future cash flow customers will help align marketing with the CFO or finance team as well.
D. Different Stroke For Different Folks:
Of course, in-market buyers are inherently very different from out-market buyers. This necessitates different approaches for creative, distribution, and measurement.
For in-market approach:
- Rational Messaging - for immediate ROI and value
- Narrower targeting - for a narrower market
- Sales metrics - revenue and pipeline are the most relevant KPI for in-market
For out-market approach:
- Emotional Messaging - for long term brand retention
- Broder targeting - for a larger market
- Memory metrics - brand sense is an example of a relevant memory metric
And there you have it. The first principles delved deep into the pros and cons of Sales Activation and Brand Building. While employing both approaches in unison are crucial to long-term success, the verdict is that, at the end of the day, the goal should be to prioritize brand building. We also highlight an unconventional perspective of the good old sales funnel. Join us next week to go over the second principle: Awareness vs Fame.

HubSpot Analytics Vs. Factors.ai – Features, Limitations, Integrations & More
All our homies LOVE HubSpot. No doubt, it's a reliable CRM and marketing automation platform. In fact, Factors.ai integrates seamlessly with HubSpot to deliver full-path analytics and attribution across campaigns, website, and CRM. That being said, HubSpot’s own in-platform analytics and attribution engine, is fraught with serious limitations. The following article highlights these issues with HubSpot — and how you can overcome them with Factors.ai. Ultimately, we find Factors.ai to be a far better fit for data-driven B2B marketers.
Before we jump into the limitations of HubSpot analytics and attribution, it’s only fair to address a couple of positives. Although premium reporting (advanced analytics, revenue attribution, etc) is only available on HubSpot’s enterprise plans, it delivers a robust range of multi-touch attribution models in a simple, user-friendly framework. Additionally, if your company uses HubSpot CRM, MAP, and life cycles stages religiously, HubSpot could possibly be an effective all-in-one solution for reporting. As we shall now see, however, most teams do not use HubSpot in the dedicated manner that’s required for it to function well.

Limitation #1: Rigidity & Inaccuracy
1.1. Fixed Lifecycle Stages
One glaring limitation with HubSpot’s in-platform analytics solution is its rigidity around the sales funnel — and especially its life cycle stages. HubSpot analytics only offers fixed definitions for events and stages along the customer journey — Subscriber, Lead, MQL, SQL, Opportunity, Customer, and Evangelist. Now, this set of stages may fit in perfectly with your organization’s funnel structure; but in reality, most B2B teams follow unique customer stages based on the nuance and particulars of their business model. B2B SaaS firms for example, may care about including a “Demo Done” stage to flag high intent leads. HubSpot’s analytics engine does not provide the flexibility to include, or even edit lifecycle stages to match this preferences.
If your team does not adhere to HubSpot’s predetermined structure, Factors.ai may be the right fit for you. On Factors, users have limitless flexibility to set, track, and analyze their own internal life-cycle stages.

1.2 Inaccurate Lifecycle Stage Tracking
In continuation with the previous point — not only is HubSpot’s lifecycle stage tracking rigid, it’s also blatantly inaccurate. Rather than considering the leads in lifecycle stage “B” to be a subset of the previous lifecycle stage “A”, HubSpot only counts the contacts in a particular stage at that point in time. Here’s an example to illustrate:
Say you have 50 leads tagged MQLs. 20 of them become SQLs. This, of course, does not mean that you now only have 30 MQLs. Rather, it means that the set of 20 SQLs are a subset of the total set of 50 MQLs.
This is a major issue with HubSpot analytics — leading to inaccurate readings, insights, and ultimately; marketing decisions. Rest assured, Factors.ai ensures no such fallacies in logic. You can also guarantee a far wider range of filters, breakdowns, and visualization techniques on Factors.ai as compared to HubSpot analytics.

Limitation #2: Attribution Troubles
2.1 Campaign Attribution
It’s impossible to create attribution reports on HubSpot at a keyword level across campaigns and ad groups. If you want to look at keyword level attribution reports on HubSpot, you’ll need to examine keywords within a specific ad group from a specific campaign. Why is this an issue? Well because a specific keyword can (and usually does) belong to multiple campaigns
On Factors, you can do what HubSpot attribution does AND look at keyword attribution reports across campaigns and ad groups for granular, and more importantly, accurate insights.

2.2 Attributing Offline Events
Offline touchpoints are those touchpoints along the customer journey that cannot be tracked digitally. These include outbound emails, webinars, in-person events, corporate gifts, etc. While HubSpot does enable you to document these “events”, it is not possible to analyze or visualize them within HubSpot analytics. As a company scales, it’s likely to have a good combination of digital and offline touchpoints, making it imperative to account and analyze for both in union.
Factors.ai makes it possible to track, analyze, and attribute offline touchpoints by fetching contact tags and UTMs. These touchpoints are also completely customizable with no-code. Needless to say, unlike Factors.ai, HubSpot does not enable users to attribute custom properties, events, or KPIs.

2.3 Comparing Attribution Models
Factors.ai is one of the few attribution solutions that allows users to compare attribution models against each other. B2B sales cycles can be complex, and the ability to compare results across first-touch and multi-touch models gives marketers an unequivocal advantage in identifying trends accurately. Unlike Factors.ai, HubSpot does not offer the ability to compare attribution models.
Limitation #3: Lack of Granularity
Another major drawback with HubSpot analytics & attribution is that it considers lead source only at a channel level. That is, lead sources may be viewed as “Organic”, “Paid ads”, “Social” and so on. We all know that the devil’s in the details — and channel level data simply will not cut it in this day and age. How is one to know which campaigns or content to scale, if they are unable to view performance data for the same? Factors.ai is all about granularity. We ensure detailed analytics at a channel, campaign, ad group and keyword level to help you make the best possible marketing decisions. Our extensive line of no-code integrations across the most popular ad platforms guarantees a proper data-driven marketing experience.

Limitation #4: Data Integration Woes
So here’s the thing: you can integrate HubSpot with third-party data-sources, including other CRMs like Salesforce — but it’s no easy task. It requires tedious onboarding, strict vigilance, and developer dependency. You need to make sure all your sales data is either on or linked to HubSpot. If you use a combination of HubSpot and Salesforce or LeadSquared or Marketo, a platform like Factors.ai would make your life a lot easier. IF, however, you religiously use HubSpot exclusive products — CRM, MAP, Website, etc, then HubSpot may be a more convenient option for you.
Limitation #5: It’s The Little Things…
By design, Factors.ai is a robust, intuitive marketing analytics, attribution, and journey mapping platform. Above all, we pride ourselves on delivering the best possible experience to our users. This entails end-to-end onboarding support, sustained customer success management, and smooth, reliable performance. The same, unfortunately, cannot be said about HubSpot analytics.


Here’s why Factors.ai has the edge over HubSpot when it comes to user experience:
- HubSpot imposes limited users or seats per hub. Factors grants unlimited seats, free of charge.
- HubSpot requires tedious, developer dependent onboarding and training over several weeks, if not months. You can get started with Factors.ai in 30 minutes.
- HubSpot charges an independent fee for tech support. Factors.ai is an extension of your team — with dedicated customer success management guaranteed.
- HubSpot aggressively up-sells its features to nickel and dime existing customers. Factors.ai recommends tailor-made plans based on the scale and growth of your team.
And there you have it. Still curious to learn why Factors.ai would be better suited for your B2B team over HubSpot Marketing Hub? Book a personalized demo here to see our work in action.

