
Measure Your Campaign Success with These 9 ABM Metrics
Learn which ABM metrics matter most and how to use them to understand whether your campaigns are actually working.




.svg)


From aligning the sales and marketing team to providing personalized campaigns to increasing the likelihood of converting a potential customer, ABM has become a key marketing strategy for B2B marketers. In fact, B2B companies now invest about a third of their marketing budget in ABM.
There is no doubt that ABM has proven to be effective in increasing conversion rates and ROI.
But how do you measure the effectiveness of an ABM campaign? Which metric should be considered for the purpose?
Don’t worry, we are here to help you. Let’s dive into the 9 ABM metrics you should measure to understand the campaign’s performance.
9 ABM Metrics to Measure Campaign Performance
1. Total Addressable Market
TAM (Total Addressable Market) refers to the total revenue opportunity available for a product or service within a specific market.
A common approach for calculating TAM is as follows.
TAM = (Total no. of potential customers) * (Annual contract value )

If a company offers a product that costs $9600 annually and its target customers are all SMBs in the US, which is 10,000, then the TAM will be 96 million dollars per annum.
TAM= 10,000*9600
TAM= 96,000,000
TAM is more useful as a planning metric than a campaign-performance metric. In ABM, it helps you understand the size of the account universe you can realistically pursue and whether the potential revenue justifies the level of investment.
2. Pipeline Generated
This refers to the total amount of potential revenue that is currently in the sales pipeline.
By tracking the pipeline generated, teams can learn the following.
- How many new opportunities have been created?
- How are these opportunities progressing through the pipeline?
- How much potential revenue can the business generate?
If you consistently generate more pipelines, it means the ABM campaigns are resonating with your target accounts and driving meaningful businesses.
Keep in mind that this metric may vary over time as opportunities progress through the pipeline. So, it’s important to track it regularly and adjust your ABM campaigns accordingly.
3. Close Rate (Conversion Rate)
Close rate measures the percentage of sales opportunities that end in a closed-won deal. In ABM, it helps you understand whether the target accounts that enter your pipeline are turning into customers.
The formula is:
Close Rate = (Closed-won opportunities / Total closed opportunities) × 100
If 20 out of 100 closed opportunities are won, the close rate is 20%.
By tracking the close rate over time, one can identify which aspects of the ABM campaigns are working and which are not. Furthermore, businesses can calculate the close rate at each stage of the sales funnel and identify inefficiencies in the sales process. This can help businesses refine their ABM strategy and maximize results.
The following are some best practices to optimize close rates and yield better results.
- Select accounts that align with your ICP criteria.
- Personalize the marketing and sales strategies to provide the target account’s needs and address their pain points.
- Align your marketing and Sales team to ensure that the messaging and offers are consistent through the sales funnel.
- Develop a multi-channel engagement strategy to maximize the chance of conversions.
- Regularly track and analyze the metrics and optimize the ABM campaigns as needed.
4. Pipeline Velocity
Pipeline velocity estimates the rate at which qualified pipeline turns into revenue. The calculation combines opportunity volume and win rate with average deal size, then adjusts for sales-cycle length.
You can calculate pipeline velocity using the following formula.
PV= (S *W *D)/ L
PV - pipeline velocity,
S - number of SQLs in the pipeline
W - win rate (%)
D - average deal size
L - length of the sales cycle.
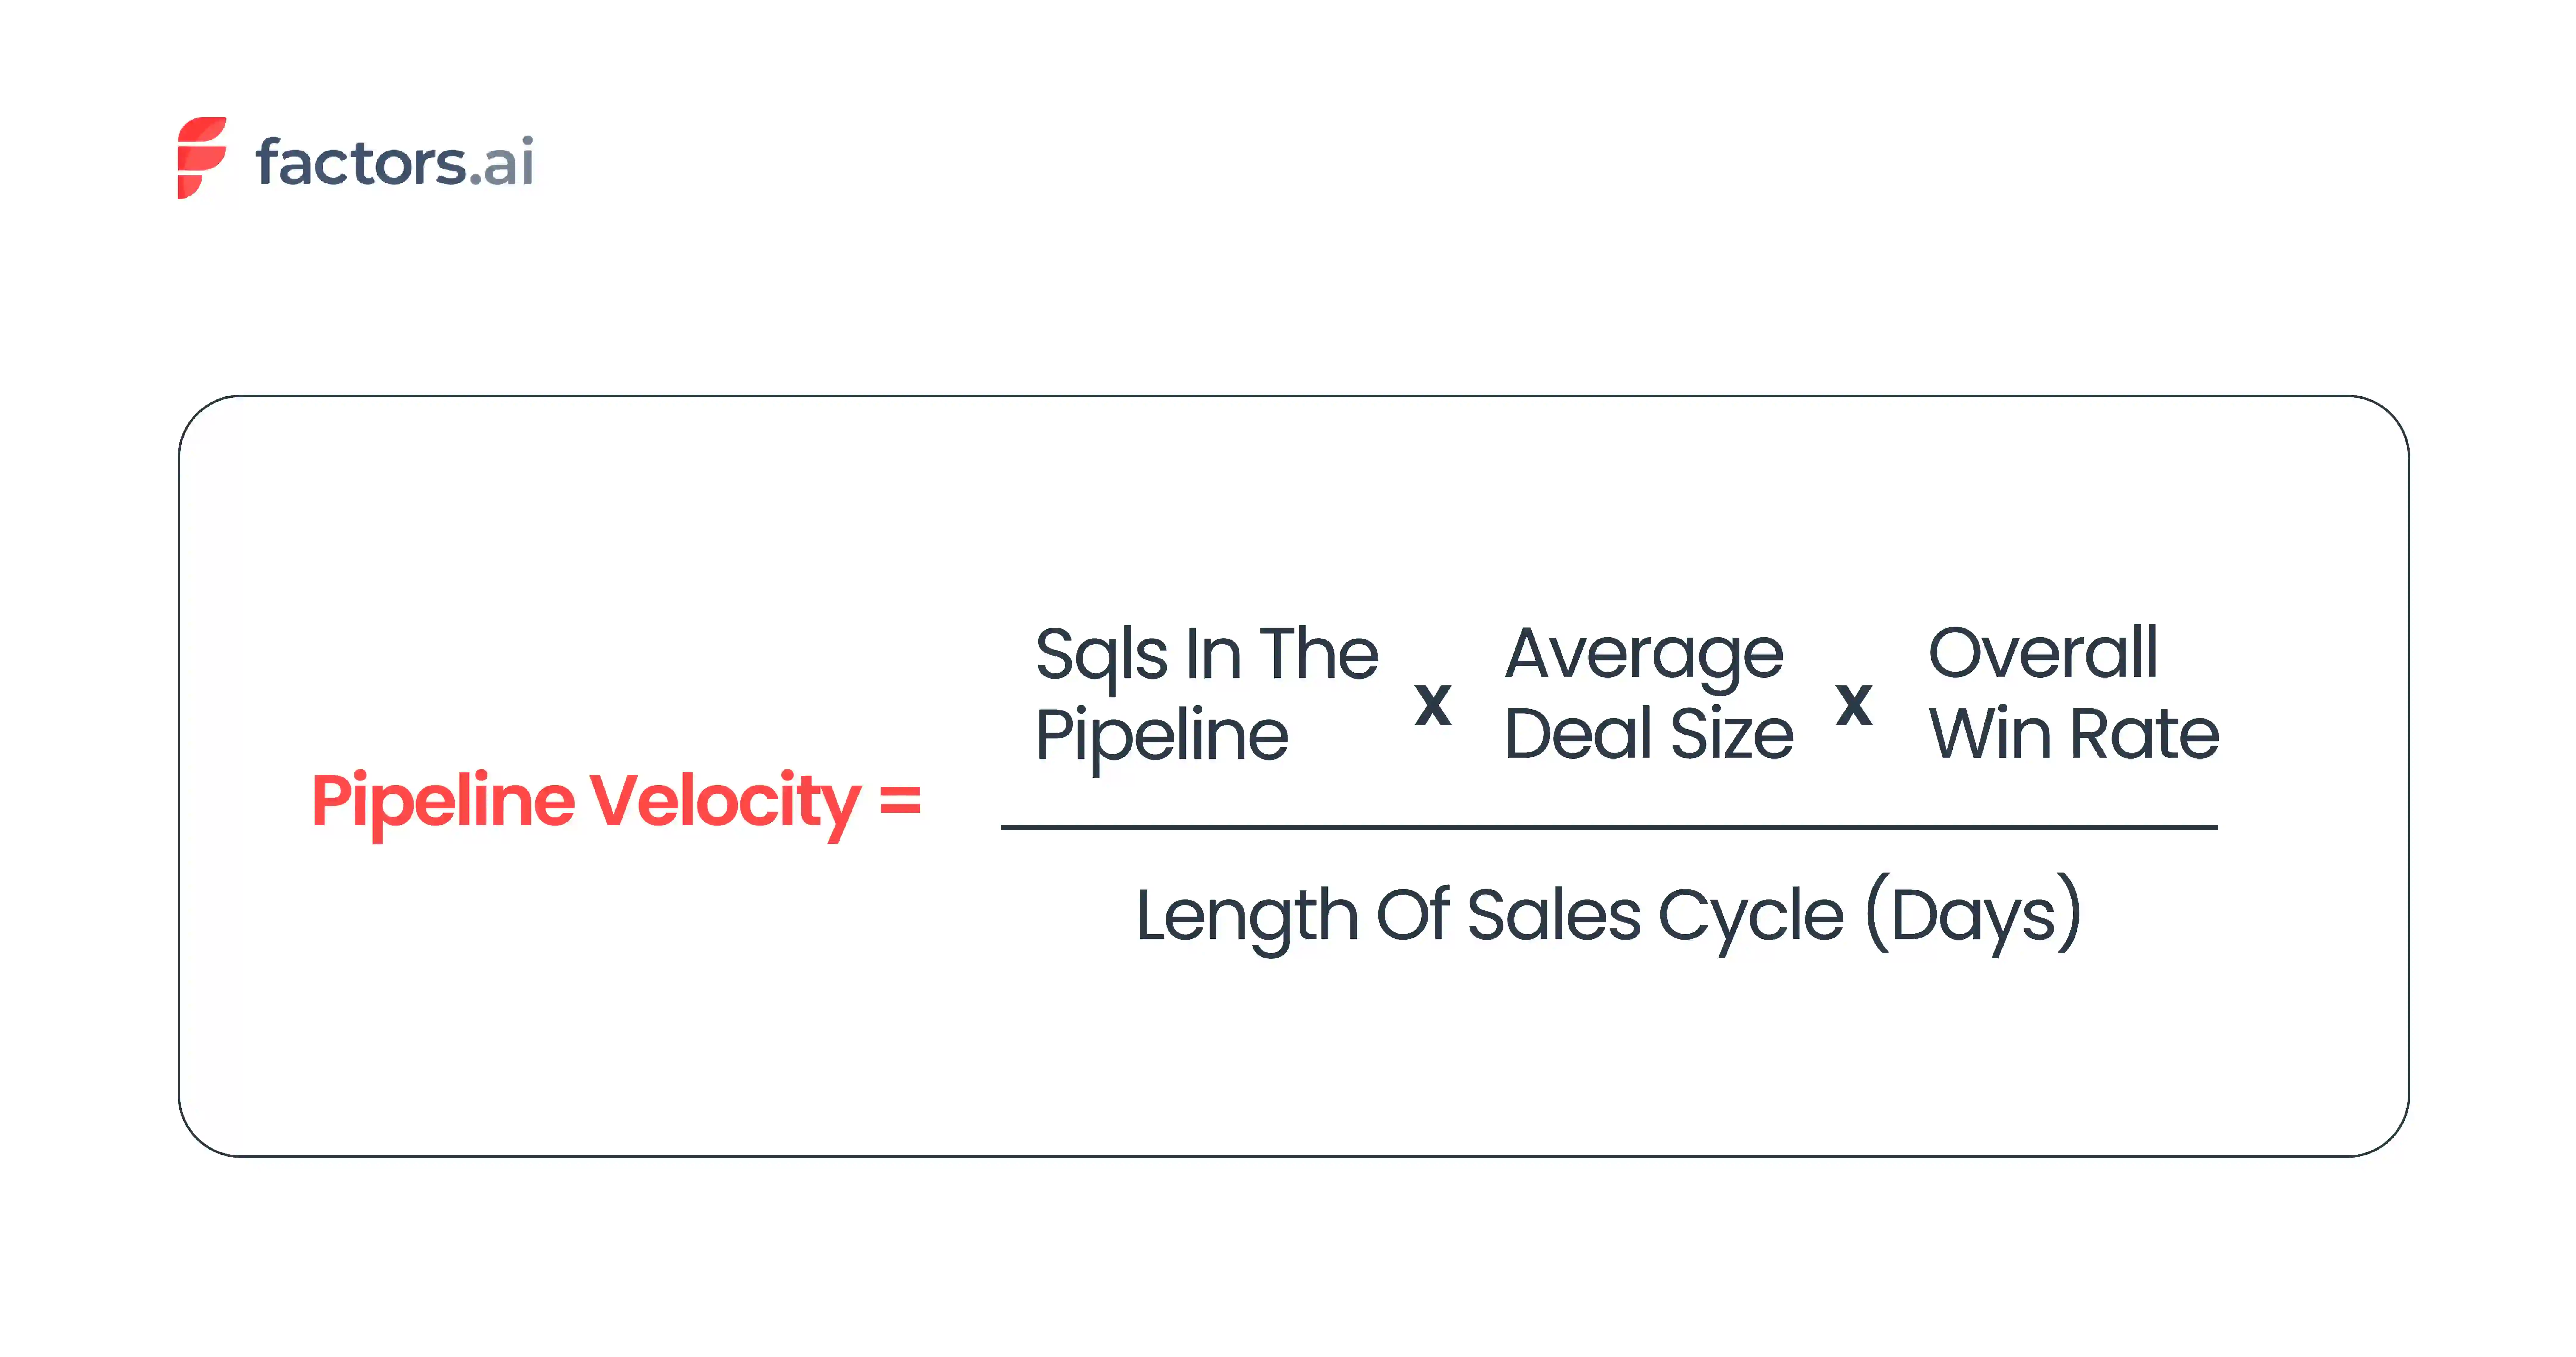
So, if a company has 60 SQLs in their pipeline, with a win rate of 20% and an average deal size of $10,000, and the length of the sales cycle is 90 days. Then the Pipeline velocity will be $1333 per day.
Pipeline Velocity = 60*10,000*20/(100*90)
Pipeline Velocity = $1333.33 per day
To increase the pipeline velocity, focus on the following.
- Increase your lead quality and ensure that the visitors fall in your ICP criteria by tracking qualified traffic.
- If you are losing customers from the pipeline, determine what prompted it. Accordingly, make necessary changes to ensure they stay put and increase the win rate.
- Align the marketing and sales team to make the messaging consistent and relevant for the prospects. Also, make the sales process more streamlined and remove any unnecessary steps. Both these can help improve sales efficiency and subsequently shorten the sales cycle.
5. Churn rate
From a B2B perspective, it is the rate at which a company loses its clients or customers.
It is a crucial ABM metric as it helps businesses understand the health of their customer base and their ability to retain them. A business can calculate the churn rate by dividing the number of customers a company lost during a specific period of time by the total number of customers the business had at the beginning of that period.

So, if a company starts the quarter with 100 customers and loses 20 customers by the end of that quarter, then the churn rate will be 20%.
Churn Rate= 20 100 100
Churn Rate= 20%
A high churn rate is detrimental to a B2B company. It will result in revenue loss and increased expenditure to acquire new customers to replace lost ones. Following are a few ways to reduce the churn rate.
- Build strong relationships with the customers
- Provide excellent customer service
- Offer personalized solutions
- And deliver on the promise you advertise
6. Customer Lifetime Value
Customer lifetime value estimates the value a customer contributes over the course of the relationship. It can be calculated on a revenue or profit basis, which means the formula should match what you want to measure.
For a simple revenue-based estimate, multiply average monthly recurring revenue by the average customer lifetime.
CLV = Average Monthly Recurring Revenue × Average Customer Lifetime in Months
A higher CLV can give you more room to spend on acquiring a customer, provided the margin and payback period still make sense.

So if a company’s average MRR (Monthly Recurring Revenue) is $1000 and the average time period a customer chooses to stay with the company is 8 months, then the CLV will be $8000.
CLV= $1000*8
CLV= $8000

7. Customer Acquisition Cost
CAC, or Customer Acquisition Cost, refers to the total cost spent by a company to attract new customers.
The metric is calculated in a set period of time, and the formula for calculating it is as follows.
CAC= (Cost of sales and marketing/ New customers acquired)
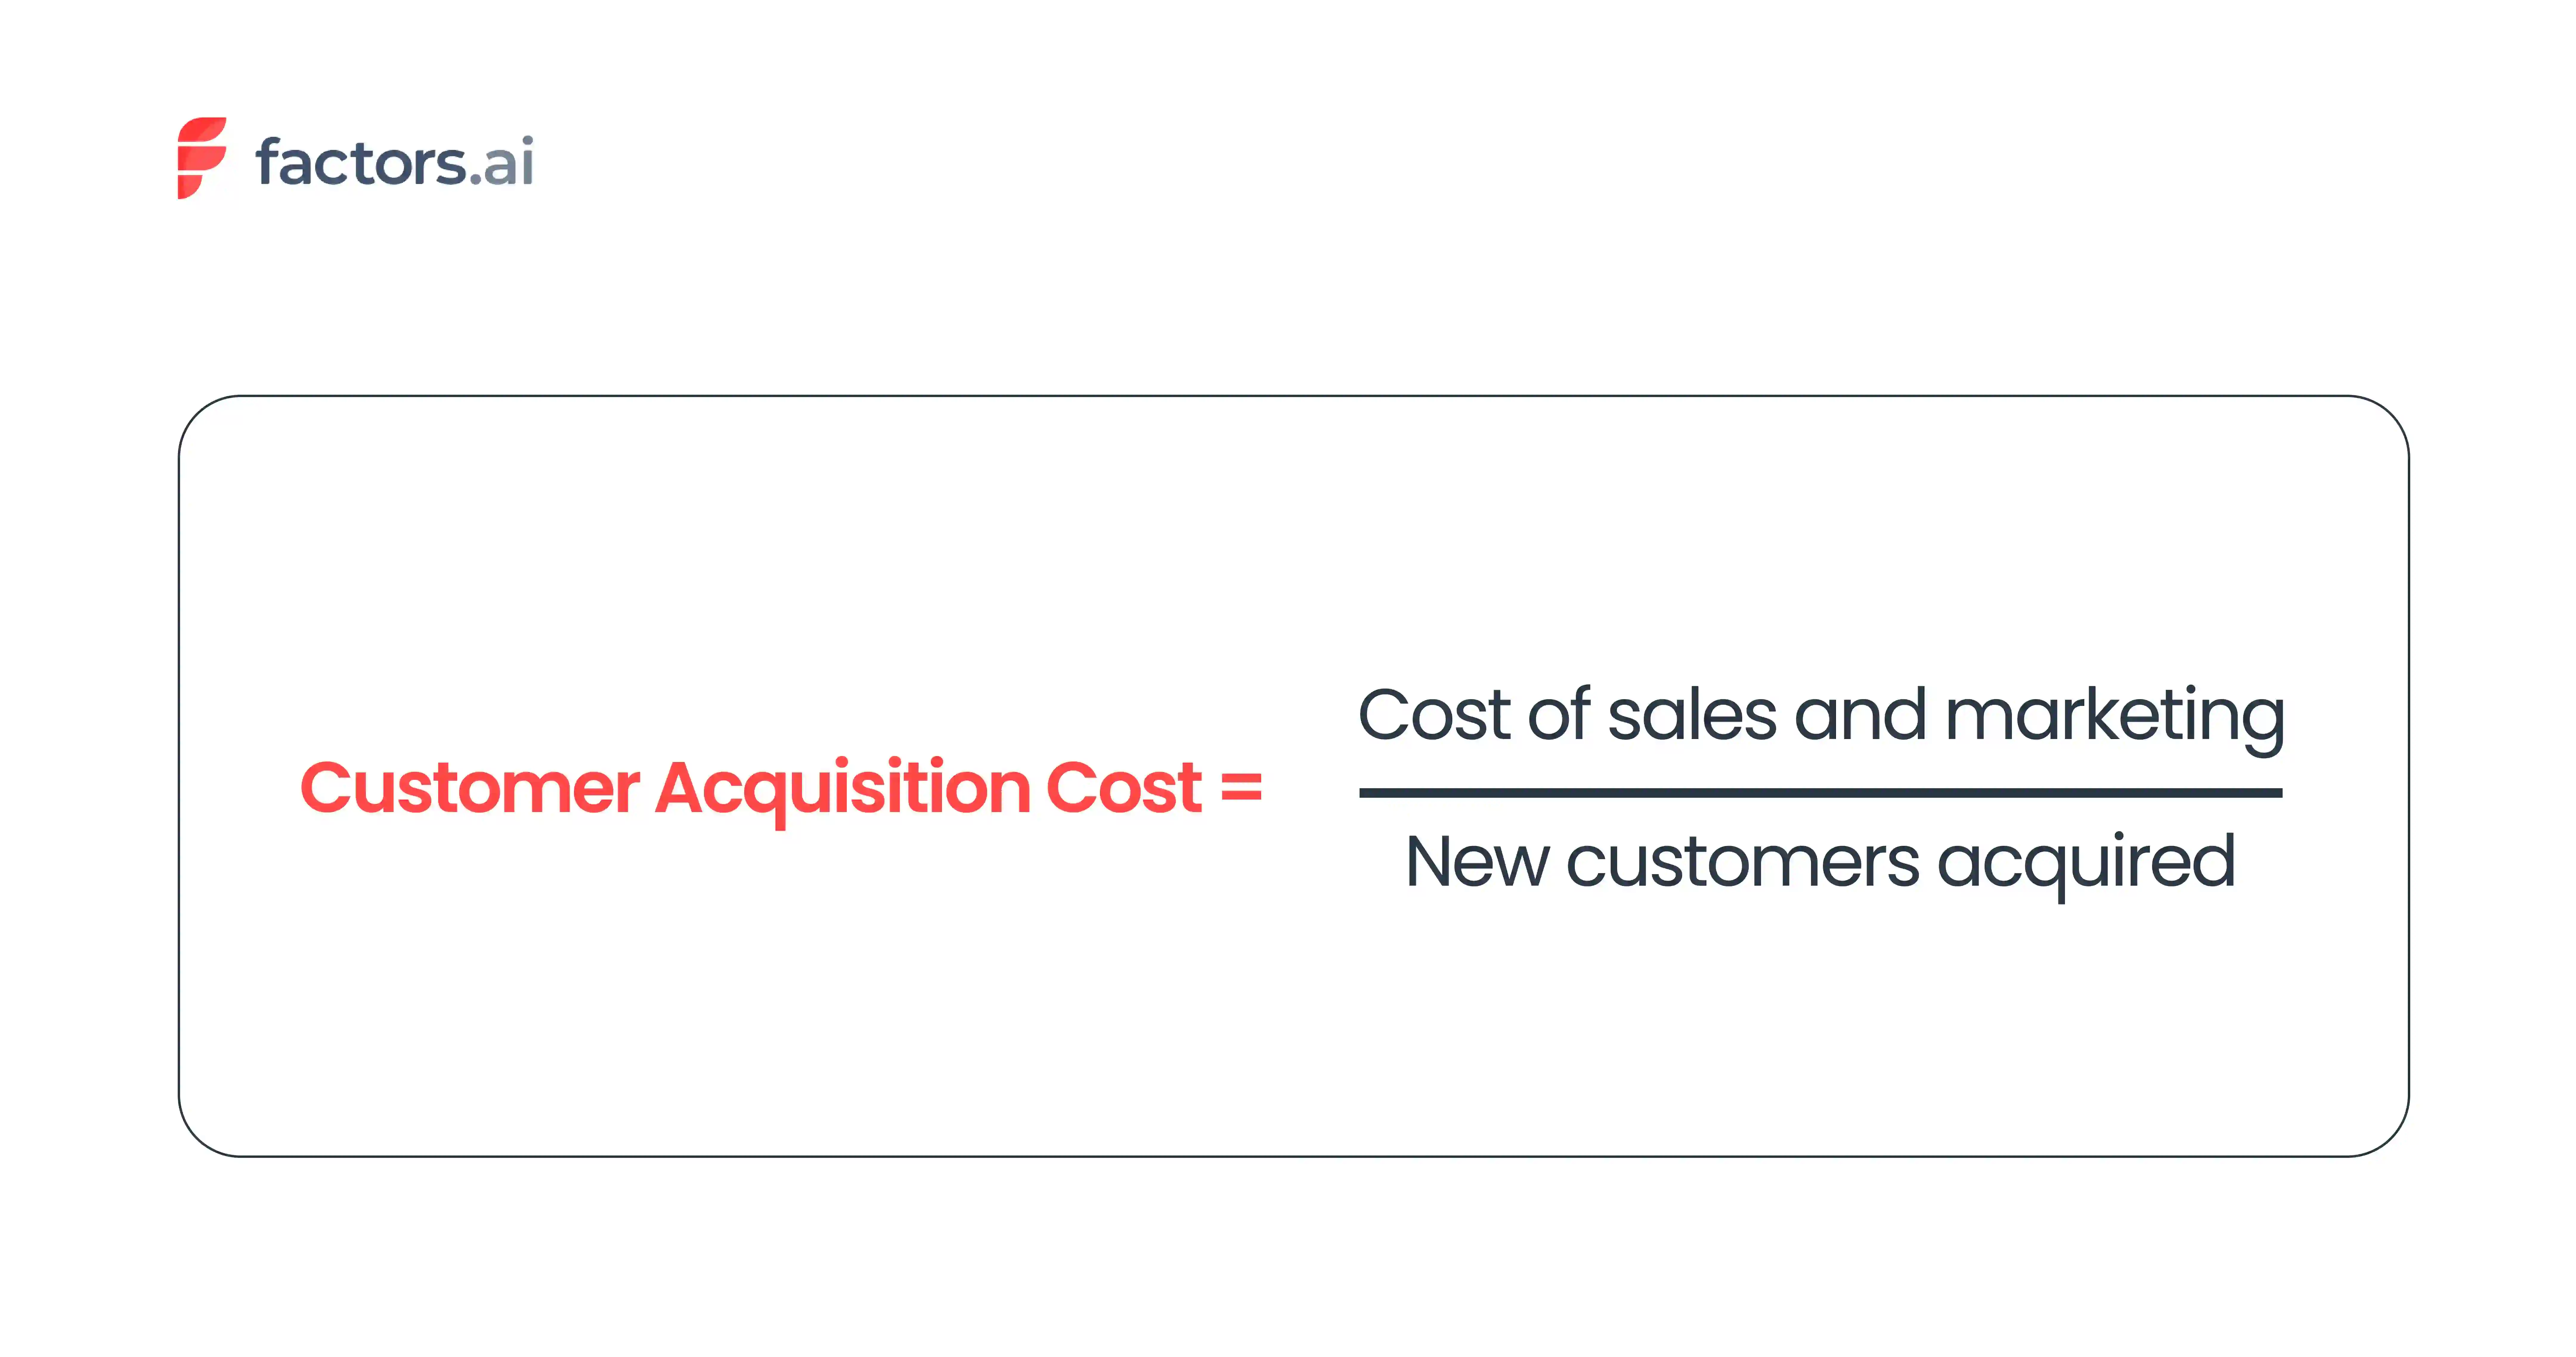
So, if a company spends $400K on sales and $300K on marketing and generates about 700 customers by the end of the fiscal year, then CAC will $1K per customer.
CAC= $400K +$300K 700
CAC=$700K 700
CAC= $1K
Compare the Acquisition cost with the Customer Lifetime Value (CLV) to understand the business’s profitability. If the cost of acquiring a customer is higher than the revenue generated from that customer over their lifetime, then the business is likely to lose money. In this case, it’s time to reevaluate the marketing strategies or consider investing in alternative approaches to lower the acquisition cost.

8. Average Deal Size (ADS)
This is a metric used to measure the average value of each sale made by a company.
By tracking the average deal size, a business can understand how much the customers are willing to pay/invest in their products/services.
ADS is often calculated monthly or on a quarterly basis and can be calculated by dividing the total value of all deals closed by the total number of deals closed during a given period.
ADS= (Total value of the deals won / Total no. of deals won)

So, if a company closes 10 deals in a given month, and the total value of the deals is $200,000, then Average Deal Size is $20,000.
ADS= $200,000/10
ADS= $20,000
9. Length of Sales Cycle
Sales cycle length is the total time a company takes to complete a sale, from the customer’s initial contact with the company to the final closing of the deal.
The sales cycle length differs from industry to industry. For example, according to Klipfolio, the average B2B SaaS sales cycle length is 83 days, whereas, for a B2C company, it will be a week or less.
It is an important metric for businesses as it can impact the revenue, profitability, and overall success of the company. For example, if the length of a sales cycle is higher for a company than its competitors, it indicates that there are inefficiencies in the sales process that need to be addressed.
If you want to calculate the sales cycle length, simply divide the total number of days taken to close each deal by the total deals won.
Sales Cycle Length= (Total no.of days taken to close each deal / Total no. of deals won)

So, if a company closed three deals, each taking 35, 55, and 90 days, then the average sales cycle length will be 60 days.
Sales Cycle Length= (35+55+90)/3
Sales Cycle Length= 60 days
Longer sales cycles also change how you measure ABM performance. If a strategic account may take months to convert, waiting for pipeline or revenue alone can leave you with very little information about whether the campaign is making progress.
Fingerprint runs into this with its highest-value accounts. Alexander Goodwin, Director of Demand Generation at Fingerprint, says the team uses both “input and output-based measurements.” Before a deal closes, its AE scorecard looks at signals such as account engagement and whether sales is successfully multi-threading across the buying committee.
Watch 36:06–37:53 to hear Alex explain how Fingerprint measures progress during longer ABM sales cycles.
Measure the Success of Your ABM Campaigns with Factors.ai
ABM measurement is ultimately about understanding whether the accounts you care about are actually moving. Revenue and pipeline matter, but they only tell part of the story. For longer sales cycles, you also need visibility into how target accounts are engaging before an opportunity is created, and whether that engagement is turning into meaningful progress.
This gets difficult when account activity is spread across your website, CRM, ad platforms, campaigns, and sales touchpoints. Factors.ai brings those signals together at the account level, helping GTM teams see how target accounts are engaging and connect that activity to pipeline and revenue.
You can:
- Identify the companies engaging with your website and connect that activity with other first-party and intent signals.
- Follow account journeys across marketing and sales to understand which accounts are becoming more active and where they are in the buying process.
- Connect campaigns and account engagement to pipeline with attribution and reporting built around revenue outcomes.
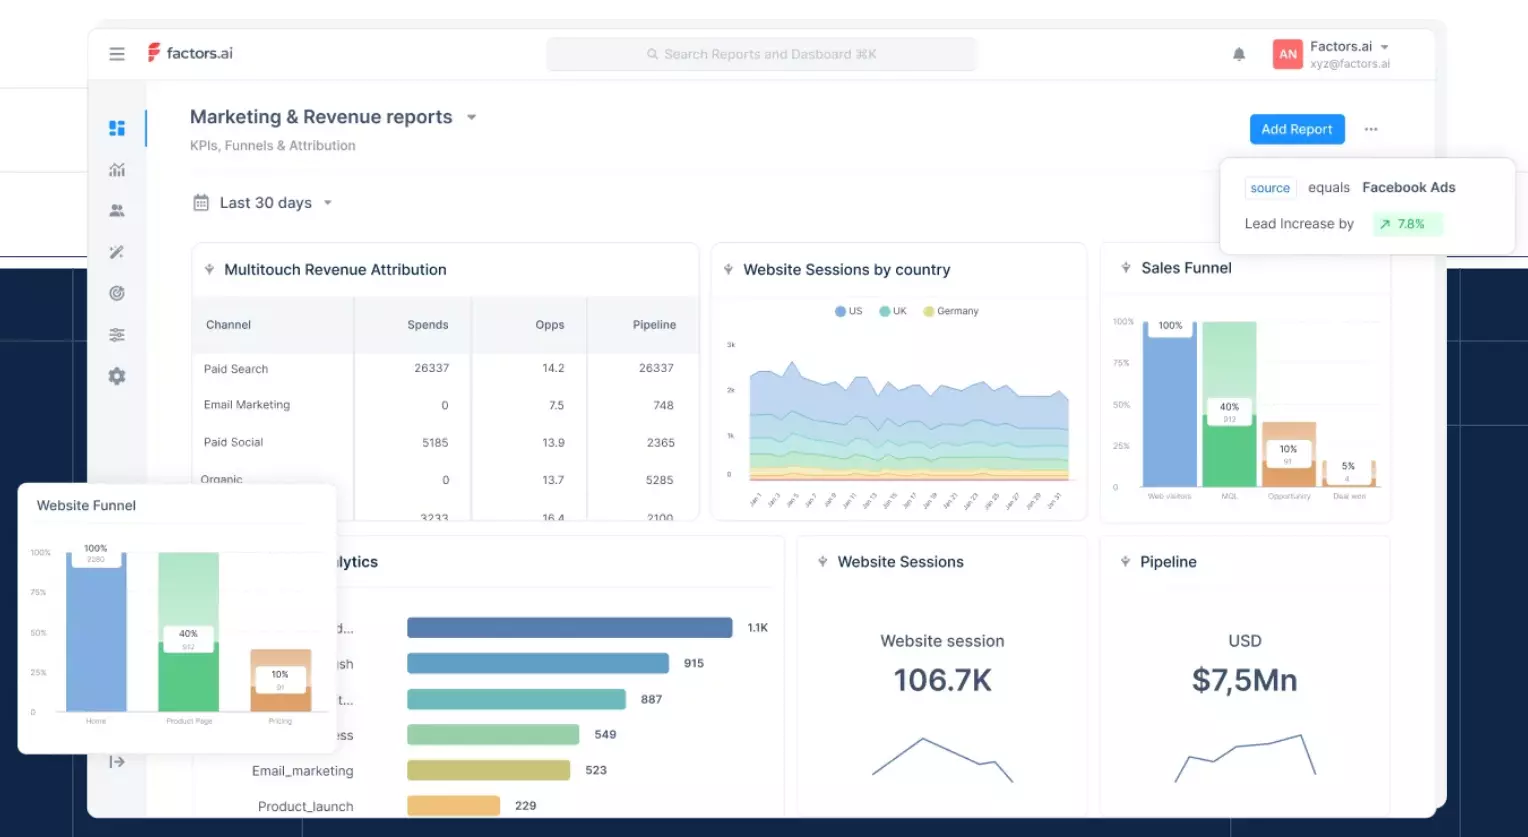
Book a demo to understand how Factors.ai can help you get the most out of your ABM campaigns. Or sign up here to try the platform for free!

See how Factors can 2x your ROI
Boost your LinkedIn ROI in no time using data-driven insights


.avif)

.avif)
See Factors in action.
Schedule a personalized demo or sign up to get started for free
LinkedIn Marketing Partner
GDPR & SOC2 Type II





.svg)



.avif)

