

Heading 2
9 SaaS Marketing Metrics You Should Be Tracking
Discover Top 9 essential SaaS marketing metrics that you should be tracking for success. Learn how to measure your performance and optimize your strategies
Written by


.svg)


Not all SaaS marketing metrics are made equal
Between traffic, conversion rates, MQLs, CAC, churn, and more, there’s no shortage of key marketing metrics for SaaS companies to track.
Each of these metrics allows teams to capture the pulse of marketing health, which in turn helps make iterative improvements to marketing performance and ROI.
No doubt, SaaS marketing metrics are important.
But it can also be overwhelming for teams to know which metrics matter more than others. Given that monitoring marketing metrics can be an investment in and of itself, it’s vital to prioritize a few key ones to begin with.
This blog explores 9 of the most important SaaS metrics that every marketing team should regularly keep tabs on. But first, let’s briefly discuss what marketing metrics are and why they’re important.
Related reading: 9 ABM metrics to track campaign success
What are SaaS marketing metrics?
SaaS marketing metrics are standards of measurement used to monitor the efficacy of SaaS marketing campaigns and assets.
These metrics provide a frame of reference to compare past and present performance in order to continue to make iterative improvements to desired objectives.
For instance, observing that the signups have dramatically increased by 40% after a landing page design overhaul is clear evidence of improvement in performance. At a deeper level, SaaS marketing metrics like return on investment helps marketers prove the impact of their campaigns on pipeline.
In summary, marketing metrics help SaaS companies track performance, improve ROI, and quantify bottom line impact.
{{INLINE_TOFU}}
9 key marketing metrics for SaaS companies
1. Website traffic
Definition: Website traffic refers to the total number of web sessions or website visitors over a certain period of time.
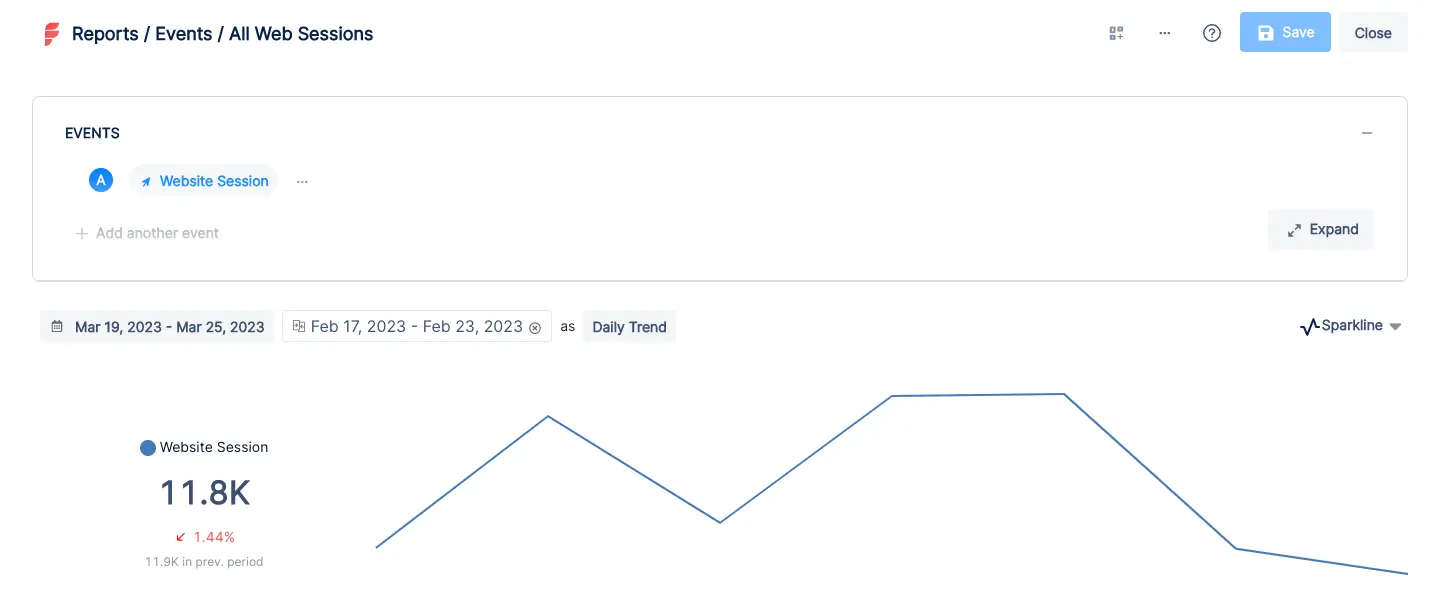
Especially in SaaS, the website is at the heart of business. It acts as a hub for prospects to learn more about your work and reach out for a demo call or free trial. Needless to say, not all traffic is from high-intent prospects. In fact, only a fraction of traffic is likely to be relevant to your business. That being said, when used in tandem with other metrics, website traffic can help SaaS companies asses how the number of visitors interested in your brand and product.
Several tools including Google Analytics and Factors.ai measure website traffic. It’s a helpful metric to understand high-level website health as well as the immediate impact of marketing campaigns and content. While traffic in and of itself may not provide granular insights, growing traffic is generally a positive sign as it means more visitors are likely to eventually convert to paying customers.
2. Conversion rate
Definition: Conversion rate measures the proportion of users who complete a certain event or action.
Conversion rate % = total conversions ÷ total visitors x 100
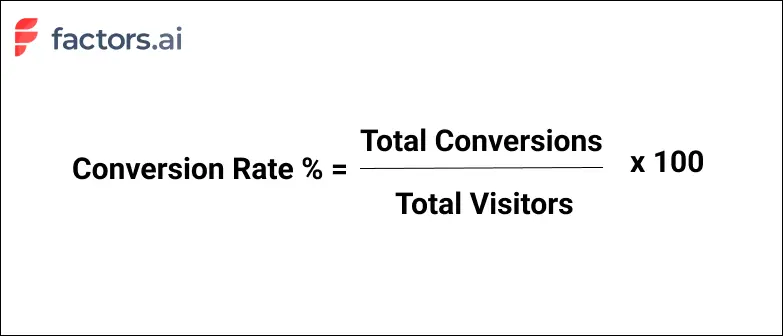
Conversion rate is a broad SaaS marketing metric that can apply to a wide range of scenarios such as webinar registrations, demo form submissions, or trial sign-ups.
One of the most common uses of conversion rate is in landing pages.
For example, say 50 people click on a search ad and arrive at a landing page with a demo form. 2 people actually submit the demo form and schedule time to speak with a sales rep. In this case, the conversion rate is 2/50 x 100 = 4%. Maybe improving headline relevancy and page design could increase conversions even further.
The average benchmark landing page conversion rate is 9.7%
3. Bounce rate
Bounce rate is defined as the percentage of website visitors who click away from a website without viewing or interacting with any other page apart from the one they initially landed on.
As much fun as it sounds, bounce rate is a serious marketing metric that reflects the quality of your web pages. A high bounce rate indicates that your web page design/content does not resonate with the visitor, causing them to leave without exploring any further.
Bounce rate = total one-page visits ÷ total visitors x 100

Note that a landing page with a high-bounce rate isn’t necessarily a cause for concern given that the purpose of the landing page is almost always to bring in a visitor, have them submit a form, and leave.
Instead, bounce rate is more relevant for the homepage, feature page, pricing page, or blogs. High bounce rates in such pages indicate that the content or design isn’t relevant or captivating enough for the visitor to continue exploring the website.
Bounce rate benchmarks:
- 0-40% bounce rate: excellent performance
- 40-55% bounce rate: decent performance
- 55% - 70%: mediocre performance
- 70%+ bounce rate: poor performance
Average bounce rates by channel:
- Display ads: 56%
- Social: 54%
- Direct: 49%
- Paid search: 44%
- Organic: 43%
In addition to tracking traditional bounce rates, Factors.ai shows granular insight into exit and engagement rates as well. This provides complete insight into where visitors are dropping off and what content resonates most with the audience.
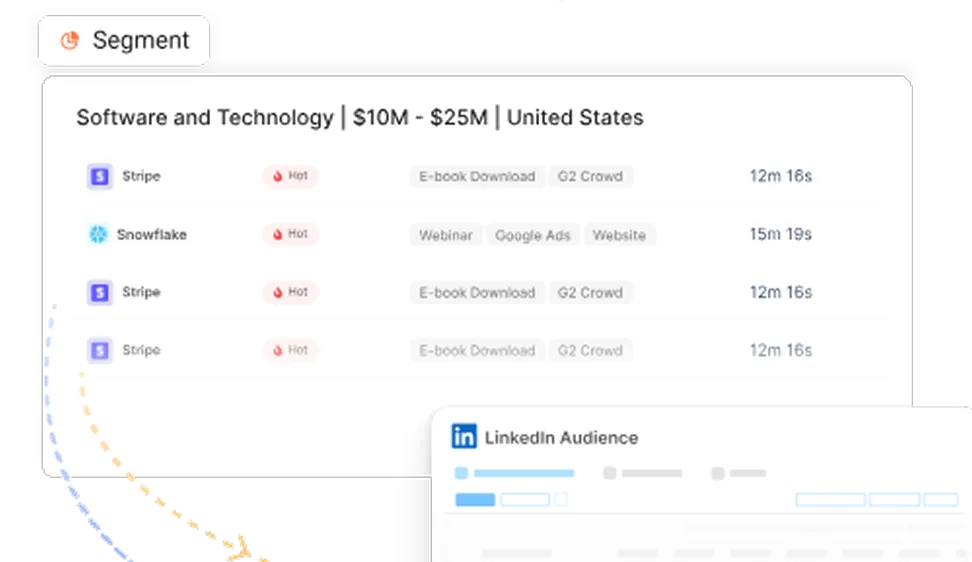
4. Marketing Qualified Leads (MQLs)
It’s all well and good to improve website traffic but real marketing impact involves driving qualified visitors who show explicit potential to eventually become paying customers. Marketing qualified leads is a metric that captures the number of leads early along the customer journey — but nonetheless on the path to becoming customers.
Marketing qualified lead (MQL) measures the number of top-of-the-funnel leads that exhibit explicit interest in what a company has to offer based on their interactions across paid campaigns, social media, website, and other touchpoints.
For example, a visitor downloading an eBook on “customer journey mapping” is likely interested in addressing this use-case and is at the very least open to learning more about Factors. Generally speaking, this lead can be considered an MQL.
Factors.ai connects the dots between campaigns, website, and CRM to showcase which marketing efforts and assets are contributing to MQLs, SQLs, deals, and other lifecycle stages.
5. Sales velocity
Sales velocity is defined as the rate at which leads and prospects move through the sales funnel and generate pipeline.
Sales velocity = (opportunities x deal value x % win rate) ÷ length of sales cycles
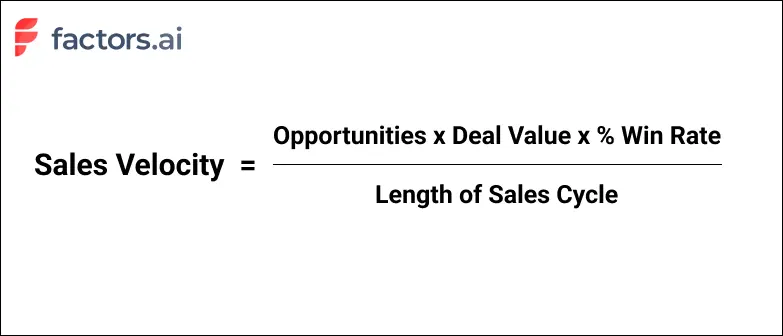
Sales velocity indicates the health and performance of sales and marketing teams to herd buyers towards becoming paying customers.
Go-to-market teams can improve sales velocity by:
- Increasing number of opportunities by scaling marketing initiatives and sales outreach
- Increasing deal values by targeting larger customers
- Increasing % win rate by improving sales pitches and enablement material
- Decreasing the length of the sales cycle with incentives like free trials or limited time deals

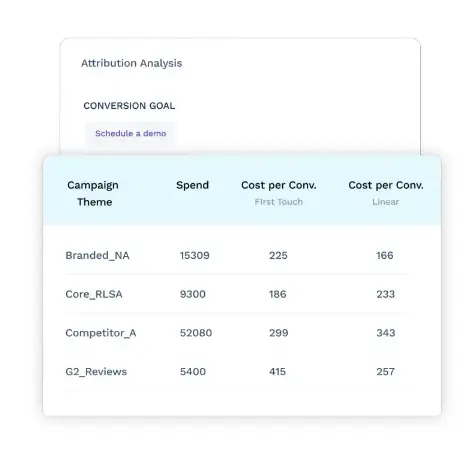
Funnel analytics on Factors.ai allows users to calibrate custom sales cycles to identify the velocity between one stage to the next. With this, users can understand how long it takes for visitors to progress from ad campaigns to web sessions to button submissions to deal won. In turn, this helps identify points of weaknesses or friction to eliminate across the journey.
6. Customer Acquisition Cost
Most marketing teams invest significant resources in paid campaigns, social, SEO, and offline events with the hopes that these initiatives attract further customers to cover their costs several times over.
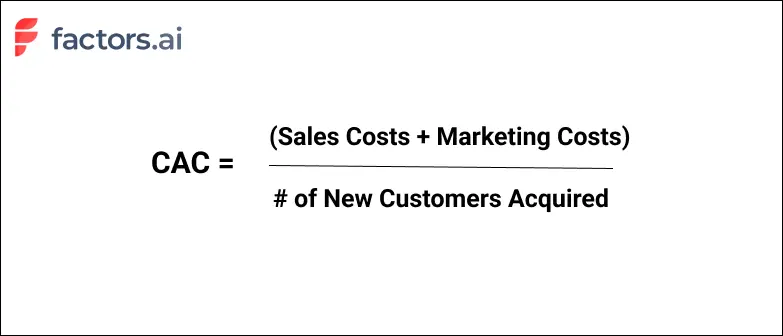
Customer acquisition cost (CAC) or cost per acquisition (CPA) is a metric that measures the amount of money spent to acquire a single new customer.
In theory, this includes employee compensation, overheads, and, of course, marketing expenses. In practice, most teams only consider the latter.
For example, if a marketing team spends $70 on ads and $30 a website redesign to acquire 20 new customers, the CAC works out to be: ($70 + $30) ÷ 20 = $5 per customer.
7. Customer lifetime value
Customer lifetime value (CLV) is the total expected revenue from a customer during the entire relationship with a business.
For instance, long-term, enterprise customers with large contract values are bound to have greater CLV than mid-market customers with short-term contracts.
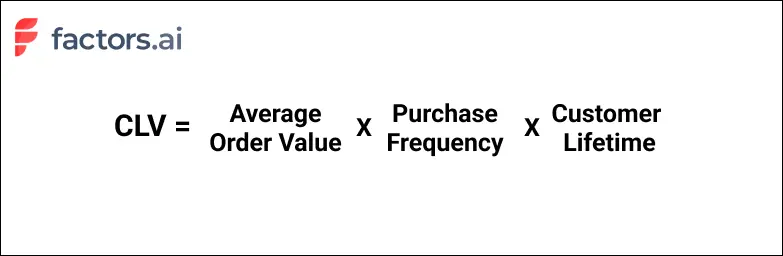
While it certainly helps to know the cost of acquiring a single customer, it’s crucial to measure the lifetime value of each of these customers to truly understand if acquisition initiatives are worth it.
For example, if it costs $300 to acquire a single customer with a customer lifetime value of $250, it’s actually a loss of $50 to the business. Alternatively, if CAC is $500 but CLV is $5000, the customer pays back the CAC several times over. Hence, it’s important to look at CAC and CLV in conjunction.
8. Return on marketing investment (RoMI)
Now more than ever, SaaS marketing teams are urged to prove their impact on bottom line metrics like pipeline and revenue. This is where RoMI comes in.
Return on marketing investment (RoMI) measures the revenue won from marketing campaigns against the cost of that campaign.
RoMI = revenue earned from campaign ÷ cost of campaign x 100
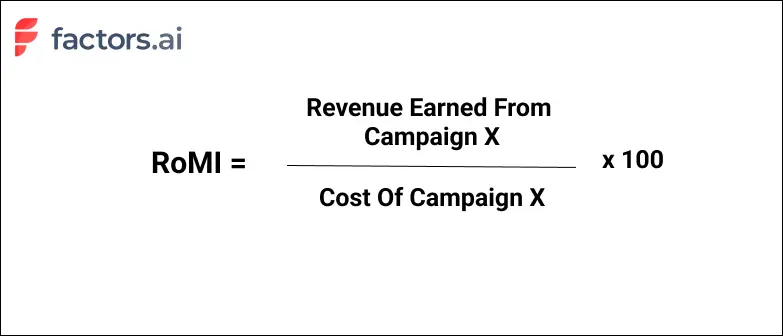
In theory, the RoMI is a straightforward concept. But in practice, calculating RoMI without the right multi-touch attribution tools can be an unintuitive, time-consuming chore. Given that SaaS sales cycles involve several touch-points across several campaigns and stakeholders, it’s hard to pin-point exactly which campaign contributed to revenue.
Factors.ai solves for this challenge with a wide range of powerful revenue attribution models to quantify marketing ROI. In turn, this helps allocate budgets towards campaigns that drive results and prove marketing’s impact on revenue.
9. Retention & Churn
We’ve combined retention & churn together as they’re two sides of the same coin.
Customer retention measures the number of customers that a business retains over time through repeated purchases or contract renewals.
Customer retention is an important SaaS metric as retaining existing customers works out to 5-10 times cheaper than acquiring new ones. Hence, businesses should always look to improve retention rates.
On the flip side, Churn refers to the number of customers who discontinue their relationships as buyers with a business.
A high rate of churn indicates that customers are not receiving the value or service they expect from the business. It’s a strong signal of dissatisfaction. Hence, businesses should always look to limit churn rates.
And there you have it. While there are several other important SaaS marketing metrics out there, the 9 metrics we’ve covered in this blog should give any SaaS marketing team an idea of their top and bottom line performance.
Want to learn more about how Factors.ai can help ll the metrics that matter to you under one roof? Request a personalized demo today!

See how Factors can 2x your ROI
Boost your LinkedIn ROI in no time using data-driven insights
Try AdPilot Today


.avif)

.avif)
See Factors in action.
Schedule a personalized demo or sign up to get started for free
LinkedIn Marketing Partner
GDPR & SOC2 Type II

.svg)


.avif)


.avif)