

Heading 2
Customer Acquisition Cost (CAC): Formula, Benchmarks & Tips [2026]
CAC, or Customer Acquisition Cost is the value of Total Sales & Marketing Costs ÷ New Customers. Learn how to calculate CAC, get industry benchmarks, CLV:CAC ratios, and find 6 proven ways to reduce your CAC.
Written by
Edited by

Janhavi Nagarhalli
Content Marketer
Summarize this article


.svg)


TL;DR
- Customer acquisition cost (CAC) is the total amount spent on sales and marketing to acquire a new customer.
- CAC Formula: CAC = (Total Sales + Marketing Costs) ÷ Number of New Customers Acquired.
- A good CLV:CAC ratio is at least 3:1 — meaning you earn $3 for every $1 spent acquiring a customer.
- SaaS CAC benchmarks: CAC ranges widely — from $50–$200 for self-serve PLG to $600–$1,200+ for mid-market B2B SaaS. Enterprise deals can exceed $5,000. Target a payback period of 12–18 months.
- To reduce CAC, focus on improving conversion rates, investing in content marketing, leveraging referrals, and optimizing channel-level spend.
Customer acquisition cost (CAC) is the total amount a business spends on sales and marketing to acquire one new paying customer. The standard formula is: CAC = (Total Sales + Marketing Costs) ÷ Number of New Customers Acquired.
CAC plays a critical role in determining the sustainability and scalability of SaaS businesses — it's the lens through which teams evaluate whether their go-to-market strategy is profitable.
This guide covers the CAC formula, real-world examples, industry benchmarks, the CLV:CAC ratio, and proven strategies to reduce your acquisition cost.
What is Customer Acquisition Cost (CAC) in SaaS?
Customer Acquisition Cost (CAC) is a business metric that measures the average total cost of acquiring one new paying customer, including all sales and marketing expenses over a given period.
The formula to calculate CAC is:
CAC = (Total Sales Costs + Total Marketing Costs) ÷ Number of New Customers Acquired
For example, if a company spends $50,000 on sales and marketing in a quarter and acquires 100 new customers, the CAC is $500.
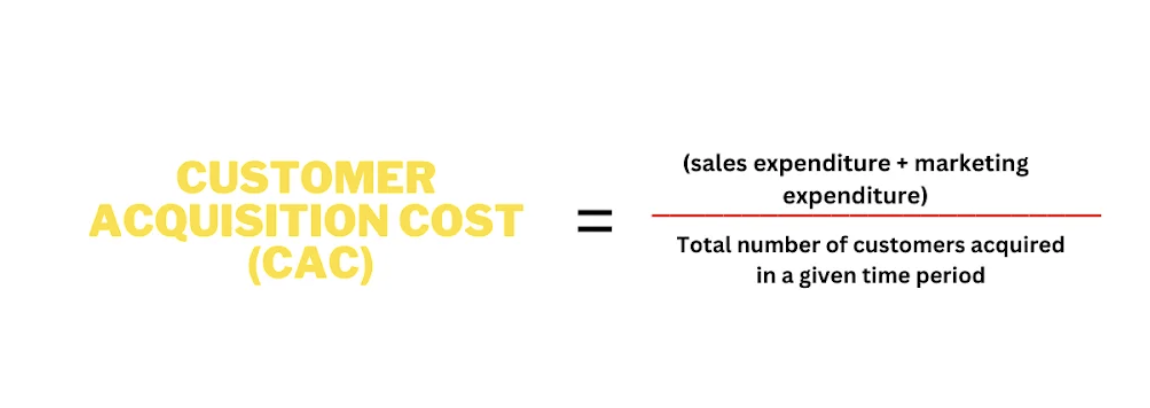
Here, sales expenditures include employee salaries, sales tools and tech, and the like etc. Marketing expenditures include ad spend, content production costs, event expenses, etc.
Note that CAC excludes repeat customers. It only accounts for new customers, not new orders from existing accounts.
A lower CAC indicates that a company is acquiring customers more cost-effectively. This generally implies solid product-market fit and successful marketing and sales efforts. A higher CAC, however, suggests that the company might need to re-evaluate its GTM strategy.
CAC vs CPA: What's the Difference?
CAC and CPA are often used interchangeably, but they measure different things:
| Metric | CAC (Customer Acquisition Cost) | CPA (Cost Per Acquisition) |
|---|---|---|
| What it measures | Total cost to acquire a paying customer | Cost to acquire a specific action (lead, sign-up, download) |
| Scope | Full funnel — all sales + marketing costs | Often channel-specific or campaign-specific |
| Includes | Salaries, tools, ads, content, events | Usually just ad spend or campaign cost |
| Use case | Business-level profitability analysis | Campaign optimization and media buying |
In short: every CAC includes CPAs, but not every CPA is a CAC. A CPA might measure the cost of getting a demo request ($50), while the CAC accounts for everything it takes to convert that demo into a paying customer ($500).
Why is Customer Acquisition Cost Important In SaaS?
Here are some ways CAC is a powerful barometer for profitability, product-market fit, and overall strategic direction.
1. Gauge Profitability
CAC helps SaaS companies assess the balance between acquisition costs and revenue generated. A low (or lowering) CAC-to-CLV ratio helps galvanize the brand by signaling efficient, sustainable growth.
2. Evaluate Product-market Fit
A high CAC often indicates misaligned PMF or inefficient GTM efforts. This signal can then prompt course-correcting adjustments. Say a company with a tiered pricing structure spends $1000 to acquire a new customer. However, 90% of its customers end up subscribing to the most basic plan, which is priced at only $150 per annum. At this rate, the company will need more than 6 years to recover the acquisition cost.
In this instance, it may help to re-evaluate the product offerings and customer requirements and make adjustments that make the company more profitable.
3. Optimize Resource Allocation
Insights from measuring CAC can help inform efficient resource allocation. By analyzing how each channel contributes to customer acquisition, teams can optimize marketing and sales budgets to maximize return on investment.
Say a company uses the following channels for customer acquisition:
| Channel | Content Marketing | Events | Social Media Advertising |
|---|---|---|---|
| Spend | 500 | 10000 | 2000 |
| No. of Acquisitions | 4 | 50 | 5 |
| CAC | 125 | 200 | 400 |
In this case, although events bring in the maximum number of acquisitions, content marketing provides the lowest acquisition costs. Hence, the company may want to consider investing more in content marketing efforts going forward.
{{INLINE_TOFU}}
Should you view CAC in isolation?
You should not view CAC in isolation. SaaS businesses need to strike a balance between CAC, Customer Lifetime Value (CLV), and the CAC payback period.
You can justify a high CAC with a high CLV or a short payback period.
Say a company spends $5000 to acquire a new customer. If the lifetime value of this customer is $18,000, or it takes only about a month to recover the $5,000 through subscription or in-app purchases, the CAC is justified compared to a company that spends $100 to acquire a customer but has an average CLV of $50.
In other words, a company experiencing higher churn rates is bound to rely on low customer acquisition costs to become profitable.
Additionally, CAC also varies widely based on industry standards, such as:
- Purchase Frequency
- Purchase Value
- Customer Lifespan
- Company Maturity
- Length of Sales Cycle
- Research and development
How Customer Retention Impacts CAC
Retention and acquisition are two sides of the same coin. Here's how improving retention directly lowers your effective CAC:
- Higher CLV offsets higher CAC: When customers stay longer, they generate more revenue, making it easier to justify (and recover) higher acquisition costs.
- Referral flywheel: Satisfied, long-term customers are more likely to refer others — creating a low-cost acquisition channel.
- Reduced replacement pressure: High churn forces you to constantly acquire new customers just to maintain revenue. A 5% improvement in retention can reduce the number of new customers you need to acquire by 20–30%.
- Better unit economics: When retention improves, your CAC payback period shortens because you're not losing customers before they've paid back the acquisition cost.
Step-by-Step Guide to Calculating CAC for SaaS
Calculating CAC can be a nuanced task. Here is a step-by-step guide to help you through the process:

1. Identify all costs related to customer acquisition
Make sure only to include expenses that directly contribute to customer acquisition.
Advertising Expenses: This includes the total ad spend across search ads, paid social, sponsored events, etc.
Technological Investments: Technological costs include spend on marketing and sales technology that supports go-to-market initiatives. This consists of automation platforms, intelligence solutions, outreach tools, etc.
You should also consider infrastructure costs, such as those for data storage platforms like SingleStore, Google Cloud, Azure, etc. The CAC is relatively higher than the costs for other SaaS platforms.
Note: This category should not include software or technology that does not directly affect the sales funnel, such as your internal collaboration or task management tools, such as Slack, Asana, Notion, etc.
Employee Salaries: If you have a dedicated sales team working on outreach, their salaries should be considered when calculating CAC.
💡TIP: Most companies exclude the salaries of the entire marketing team when calculating CAC. This is not the right approach, as marketing costs can add up quickly. The right approach is to include the salaries of employees who come in direct contact with customers or directly impact sales. For example, a PPC or SEM expert should be factored into the calculations. Still, SEO experts or website developers who do not contact customers directly should not be included.
Content Marketing Costs
Content marketing costs encompass all expenses associated with creating new content assets across blogs, media, and more. For example, when producing a video, this includes the cost of purchasing equipment, setting up a studio, acquiring backdrops, obtaining editing software, and other related expenses. Remember: these costs should be considered even if you hire a third-party content producer.
Research and Development
PLG companies invest in R&D as part of their customer acquisition mix (free sidecar products, freemium, growth teams, self-service purchasing, etc.). Atlassian, for instance, spends $2.43 on R&D for every $1 on sales and marketing.
However, R&D investment is usually not factored into the CAC payback period calculation, blurring the picture of the growth model.
If you're investing in PLG, plan to stay below the "normal" CAC payback benchmarks.
2. Decide on a tracking period
The tracking period is the timeframe over which you'll calculate your CAC. It's essential to choose a period that aligns with your sales cycle. This could be monthly, quarterly, or annually for SaaS businesses, depending on how long it typically takes to convert a lead into a paying customer.
3. Calculate the number of customers acquired in your tracking period
Count the number of new customers you've acquired during the chosen tracking period. This should include all paying customers during that time frame.
Note: The more accurate way to analyze customer acquisition cost is to track the costs and acquisitions over the length of an industry's sales cycle. For example, if enterprise sales in the healthcare sector take about 10 months to close a deal and get a paying customer, then the CAC should be tracked for that period.
4. Divide your acquisition costs by the number of customers
Calculating CAC is straightforward: CAC = Total Acquisition Costs / Number of Customers Acquired. Plug in the numbers: Divide the total acquisition costs (step 3) by the number of customers acquired during the tracking period (step 2).
Here's an example to illustrate these steps:
Suppose a SaaS company spends $50,000 on marketing and sales efforts in a quarter. During the same quarter, they acquired 500 new customers.
CAC = $50,000 / 500 = $100 per customer.
Determine your total marketing and sales expenditure within a specific time frame. This time frame can be a month, quarter, year, or any other relevant period. Next, calculate the number of new customers acquired during that same time frame.
Utilize the customer acquisition cost formula to ascertain the average cost per customer. This will provide insight into your gross margin and how much you potentially earn per new customer.
New CAC vs Blended CAC
When calculating CAC, it's important to distinguish between two variations:
- New CAC measures only the cost of acquiring net-new customers — first-time buyers who have never purchased from you before. This is the standard CAC formula.
- Blended CAC includes the cost of acquiring both new customers and reactivating or converting returning leads. This gives a fuller picture of total acquisition spend but can mask how efficiently you're reaching new markets.
For most SaaS companies, New CAC is the more actionable metric — it tells you the true cost of growing your customer base. Blended CAC is useful for companies with significant reactivation or win-back campaigns.
Customer Acquisition Cost Examples
Let's walk through a few real-world CAC scenarios to illustrate how the formula works across different business types:
Example 1: B2B SaaS Company
A mid-market SaaS company spends $120,000 on marketing (content, paid ads, events) and $180,000 on sales (SDR/AE salaries, tools, outreach) in Q1. They close 60 new customers during the quarter.
CAC = ($120,000 + $180,000) ÷ 60 = $5,000 per customer
If their average contract value is $18,000/year with 3-year average retention, their CLV is $54,000 — giving a healthy CLV:CAC ratio of 10.8:1.
Example 2: E-commerce DTC Brand
An online skincare brand spends $25,000 on Instagram and Facebook ads and $5,000 on influencer partnerships in a month. They acquire 400 new customers.
CAC = ($25,000 + $5,000) ÷ 400 = $75 per customer
With an average order value of $45 and 2.5 average purchases per customer, their CLV is ~$112 — a CLV:CAC ratio of 1.5:1, suggesting they need to either reduce spend or increase repeat purchases.
Example 3: PLG SaaS Startup
A product-led growth company spends $15,000 on content marketing and SEO, and $10,000 on self-serve onboarding infrastructure monthly. They convert 200 free users to paid in that month.
CAC = ($15,000 + $10,000) ÷ 200 = $125 per customer
Note: PLG companies often have lower sales costs but higher R&D investment. If R&D is included, the effective CAC could be significantly higher.
CAC benchmark: "What's a good customer acquisition cost?"
There isn't a one-size-fits-all benchmark for CAC, as it can vary significantly depending on factors like your industry, target market, business model, and growth stage. That said, here are key benchmarks to use as reference:
General SaaS CAC ranges:
- Self-serve / PLG SaaS: $50 – $200 per customer
- SMB SaaS: $200 – $600 per customer
- Mid-market B2B SaaS: $600 – $1,200 per customer
- Enterprise SaaS: $1,200 – $5,000+ per customer
These ranges scale with deal complexity, sales cycle length, and the level of human touch required in the sales process.
CAC Payback Period
OpenView's report on SaaS Benchmarks shows CAC Payback periods based on company size or annual revenue, with a focus on different customer segments:

Source: SaaS benchmark report 2023 by Openview
As you can see, the payback period has gotten worse as companies grow in revenue. This holds especially true for companies that grow upward of $20M ARR. There could be 3 main mistakes here:
- Not focusing on Net Dollar Retention (NDR)
- Believing that sales and marketing are the sole costs of acquisition
- Looking at CAC payback on a revenue basis instead of a cash basis
Andrew Allsop, Senior Demand Gen Manager at Bryter put it best when he said that marketers must focus on new sources of acquisition instead of over-optimizing an existing channel:
"If you're able to acquire customers that fit within your financial model then do so until you can anymore, and then find other ways to do the same thing.
New sources of acquisition = greater growth potential than spending 100s of hours squeezing an extra few cents out of an existing channel."
CLV: CAC Ratio
The CLV: CAC ratio is a more reliable metric when at least 1-2 agreement renewal cycles have occurred to establish a more consistent churn rate across renewal periods. It helps gauge the return on investment regarding customer acquisition.
According to a report by Benchmarkit, over the last three years, the benchmark for the CLV: CAC ratio has varied between 2.1 and 6, regardless of the company's size, ARR, or any other revenue metrics.
The report implies that for every $1 spent on customer acquisition, the business should ideally generate revenue of $2.1 or $6.
NOTE: Both metrics should not be viewed in isolation. A company can have a high CLV: CAC ratio, but if the CAC payback period is much longer, say 24 months, the business does recover its initial cost of acquisition, but it takes them two years just to break even.
Average Customer Acquisition Cost by Industry
CAC varies significantly across industries. Here are typical ranges based on industry data:
| Industry | Average CAC |
|---|---|
| B2B SaaS | $200 – $1,200 |
| E-commerce (B2C) | $50 – $150 |
| E-commerce (B2B) | $80 – $200 |
| Financial Services | $175 – $500 |
| Healthcare / Biotech | $300 – $900 |
| Real Estate | $200 – $600 |
| Education / EdTech | $100 – $400 |
| Travel & Hospitality | $50 – $200 |
| Telecommunications | $300 – $500 |
| Insurance | $300 – $900 |
Note: These ranges are directional estimates. Your actual CAC depends on deal size, sales cycle length, and go-to-market motion.
Challenges with calculating CAC
Calculating customer acquisition costs is simple in theory but can get complicated really quickly. There are several nuances to account for, and businesses typically face these challenges in calculating CAC:
1. Inconsistent tracking period
"Days to close" can significantly impact Customer Acquisition Cost (CAC). Typically, businesses opt to provide reports on a weekly and monthly basis. However, a challenge arises when attempting to make monthly reports, especially when the "days to close" metric stands at just 14 days. This situation implies that any new visitor acquired during the latter half of a month will only become a customer in the first half of the subsequent month.
In such a situation, you'll be incorporating the costs incurred in Month 1 and revenue generated in Month 2, which can throw you off track. The best way to tackle this situation is detailed user journey mapping. Tracking a customer's interactions from the very first touchpoint to the final is a great way to understand the sales cycle and determine the tracking period for CAC calculations.
2. Unreliable attribution
What campaigns and content actually contribute to conversions and pipeline? Without understanding the impact of marketing and sales touchpoints on bottom-line metrics, it's difficult to attribute CAC accurately.
The main challenge with revenue attribution is the nonlinear nature of customer journeys. When a visitor becomes a paying customer, it's rarely because of a single touchpoint. It's likely a result of many touchpoints: channels, campaigns, content, and people — working together to convince the buyer.
Without the right attribution tools, it's difficult to understand and appreciate how each channel contributes to revenue generation.
3. Fragmentary data and analytics
Another challenge when calculating CAC is siloed data across various sales and marketing channels. Manually monitoring KPIs and staying on top of channel-level performance is tedious and time-consuming. Again, without the right tools, the team's focus may be redirected towards operational tasks such as reporting and away from strategic decision-making.
4. Confusing CAC with CPL or CPA
A surprisingly common mistake is treating Cost Per Lead (CPL) as CAC. CPL only measures the cost of acquiring a lead — not the full cost of converting that lead into a paying customer. Your true CAC includes every touchpoint from first impression to closed deal, including sales salaries, tools, and nurturing costs.
5. Excluding salaries and overhead
Many teams calculate CAC using only ad spend and campaign costs, ignoring employee salaries, software subscriptions, and overhead. This results in an artificially low CAC that doesn't reflect reality. If your SDRs and AEs spend time converting leads, their compensation should be factored into the equation.
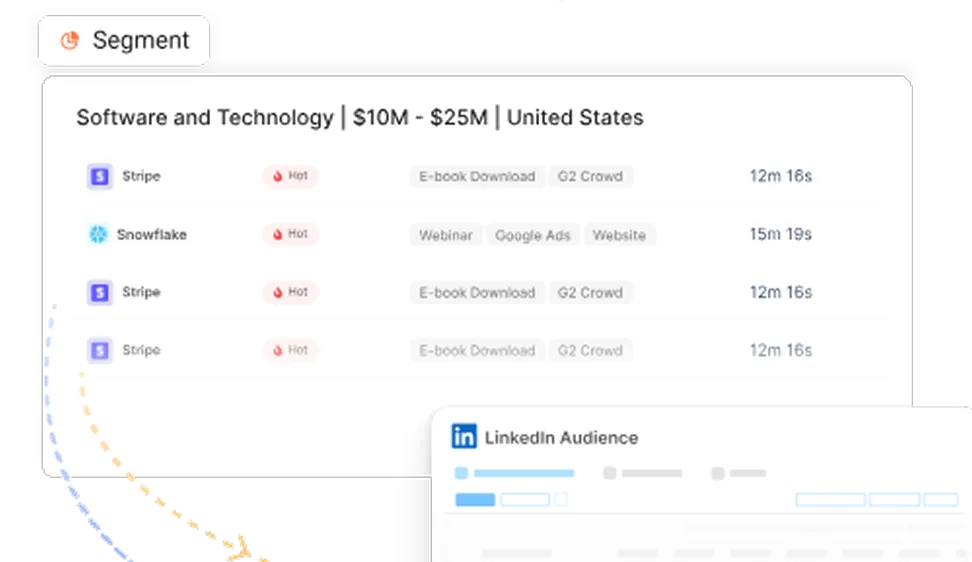
6. Not segmenting CAC by customer type
A single average CAC across all customer segments can be misleading. An enterprise customer that requires 6 months of sales engagement has a very different acquisition cost than an SMB customer that self-serves through a free trial. Segment your CAC by customer type, deal size, or channel to get actionable insights.
How to Reduce Customer Acquisition Cost
Lowering CAC is essential for sustainable growth. Here are proven strategies to bring down your acquisition costs:
1. Invest in Content Marketing and SEO
Content marketing consistently delivers one of the lowest CACs across channels. By creating high-value blog posts, guides, and videos that rank organically, you attract prospects without paying per click. Over time, this compounds — unlike paid ads, content continues generating leads long after it's published.
2. Improve Conversion Rates
You don't always need more traffic — you need better conversion rates. A/B test your landing pages, simplify sign-up flows, and optimize CTAs. Even a small improvement in conversion rate (say, from 2% to 3%) can reduce your CAC by 33% without increasing spend.
3. Leverage Referral Programs
Referred customers typically have a lower CAC and higher lifetime value. Build a referral program that incentivizes existing customers to bring in new ones. Dropbox famously reduced CAC by 60% through its referral program.
4. Optimize Channel-Level Spend
Not all channels deliver equal ROI. Break down CAC by channel (paid search, social ads, events, content, outbound) and reallocate budget from high-CAC channels to low-CAC ones. Use attribution tools to understand which channels actually drive conversions.
5. Shorten the Sales Cycle
The longer your sales cycle, the higher your CAC. Equip your sales team with better enablement materials, automate follow-ups, and use intent signals to prioritize high-fit prospects. Tools like Factors help identify accounts showing buying intent, so your team spends time on prospects most likely to convert.
6. Focus on Customer Retention
Retention indirectly reduces CAC. When customers stay longer, their lifetime value increases, improving your CLV:CAC ratio. Invest in onboarding, customer success, and product improvements to reduce churn — every retained customer is one fewer you need to acquire.
What Real Users Say About CAC
Beyond the formulas and benchmarks, here's what founders and operators actually experience with customer acquisition costs:
Early-stage startups often see wildly different CACs. On r/ycombinator, one founder reported a CAC of $46 with just 3 conversions — highlighting that early CAC numbers can be misleading with small sample sizes. The consensus: don't optimize CAC too early. Focus on finding product-market fit first.
Industry-specific CAC can be eye-opening. In the MSP (managed service provider) space, one operator shared that after 18 months, their average CAC was about $12,000 per customer — or roughly $900 per seat. This reinforces why benchmarking against your specific industry matters more than generic SaaS averages.
Blended vs. Channel CAC is a common challenge. Business owners on r/smallbusiness frequently struggle with calculating CAC when they use both physical and digital channels. The recommended approach: track Blended CAC (total spend ÷ total customers) alongside Channel CAC (channel spend ÷ channel customers) to understand which channels deliver the best ROI.
The biggest frustration? Lack of clear, industry-specific benchmarks — which is why we included the benchmarks table above.
Frequently Asked Questions About Customer Acquisition Cost
Q1. What is an example of a customer acquisition cost?
If a SaaS company spends $10,000 on Google Ads and $5,000 on sales salaries in a month, and acquires 30 new customers, the CAC is ($10,000 + $5,000) ÷ 30 = $500 per customer. Other examples include the cost of trade show booths, referral incentives, free trial infrastructure, and content production.
Q2. How is CPA different from CAC?
CPA (Cost Per Acquisition) typically refers to the cost of acquiring a conversion action — like a sign-up, download, or lead — and is often channel-specific. CAC (Customer Acquisition Cost) is broader: it measures the total cost of converting someone into a paying customer, including all sales and marketing expenses across the full funnel.
Q3. What is a good customer acquisition cost?
There's no universal "good" CAC — it depends on your industry, business model, and customer lifetime value. The key benchmark is the CLV:CAC ratio, which should ideally be 3:1 or higher. For SaaS companies, typical CAC ranges from $200 to $400, with CAC payback periods of 12–18 months.
Q4. Is CAC calculated monthly or yearly?
CAC can be calculated over any time period — monthly, quarterly, or annually. The best practice is to align your tracking period with your average sales cycle length. If your typical deal takes 3 months to close, quarterly CAC calculations will be most accurate.
Q5. Is customer acquisition cost a KPI?
Yes. CAC is one of the most important SaaS KPIs. It's tracked alongside metrics like CLV, churn rate, MRR, and CAC payback period to assess the efficiency and sustainability of your go-to-market strategy.
Q6. What is the 3:1 CLV to CAC ratio?
The 3:1 ratio means your average customer generates 3x the revenue compared to what you spent to acquire them. If your CAC is $500, your CLV should be at least $1,500. A ratio below 1:1 means you're losing money on every customer acquired.
Q7. What is a reasonable customer acquisition cost?
A "reasonable" CAC depends entirely on your industry, average deal size, and customer lifetime value. As a rule of thumb: your CLV should be at least 3x your CAC. For B2B SaaS, a CAC between $200 and $1,200 is typical. For e-commerce, $50–$150 is more common. The real test isn't the absolute number — it's whether your CAC payback period is under 12–18 months and your CLV:CAC ratio is 3:1 or higher.
Q8. What are common CAC mistakes?
The most common CAC mistakes include: (1) Only counting ad spend and ignoring salaries, tools, and overhead — which artificially deflates your CAC. (2) Treating Cost Per Lead (CPL) as CAC — CPL measures lead cost, not the full cost to close a paying customer. (3) Not segmenting CAC by channel or customer type — a single average hides which channels are efficient and which are burning cash. (4) Calculating CAC monthly when your sales cycle is 6+ months — this creates a timing mismatch between spend and conversions. (5) Viewing CAC in isolation without CLV or payback period context.
Q9. How do I figure out my customer acquisition cost?
To calculate your CAC: (1) Pick a time period (monthly, quarterly, or matching your sales cycle). (2) Add up all sales and marketing costs in that period — including ad spend, salaries, tools, content creation, and events. (3) Count the number of new paying customers acquired in that same period. (4) Divide total costs by new customers. For example, $50,000 in costs ÷ 100 new customers = $500 CAC. For more accurate results, align your tracking period with your average sales cycle length.
The Bottom Line on Customer Acquisition Cost
Customer acquisition cost (CAC) measures how much you spend to acquire each new paying customer. A healthy SaaS business targets a CLV:CAC ratio of at least 3:1, with a CAC payback period under 18 months. Typical B2B SaaS CAC ranges from $200 to $1,200 depending on deal size and sales cycle (source: Benchmarkit 2024 SaaS Benchmarks).
Here's what to remember:
- Don't view CAC in isolation. Always pair it with CLV, CAC payback period, and Net Dollar Retention for a complete picture.
- Segment your CAC by channel, customer type, and deal size to find actionable optimization opportunities.
- Focus on reducing CAC sustainably — through content marketing, referrals, better conversion rates, and retention — rather than just cutting spend.
- Benchmark against your industry, not generic averages. A $500 CAC is excellent for enterprise SaaS but unsustainable for a consumer app.
Looking to lower your CAC by identifying high-intent accounts before your competitors do? Factors helps B2B teams prioritize the right accounts using intent signals, so your sales and marketing spend goes further.

See how Factors can 2x your ROI
Boost your LinkedIn ROI in no time using data-driven insights
Try AdPilot Today


.avif)

.avif)
See Factors in action.
Schedule a personalized demo or sign up to get started for free
LinkedIn Marketing Partner
GDPR & SOC2 Type II

.svg)


.png)