

Heading 2
Revenue Forecasting Models: 7 Methods for 2026
Compare 7 revenue forecasting models with examples, formulas, and a model-selection framework for B2B SaaS and enterprise teams. Learn when to use pipeline, time series, scenario, and AI forecasting in 2026.
Written by
Edited by

Subiksha Gopalakrishnan
Growth Marketer


.svg)


TL;DR
- Revenue forecasting is the data-backed prediction of a company's future income. It combines historical performance, pipeline math, and external market signals to dictate your hiring, budgeting, and scaling roadmaps.
- No single framework works alone. While B2B SaaS requires a hybrid mix of Time Series (for recurring revenue loops) and Pipeline-Based Models (for active deals), larger enterprises thrive by balancing Bottom-Up operational metrics with Top-Down strategic goals.
- For modern forecasting models to hold weight, your customer acquisition data must be precise. Investing in high-intent channels like Google Paid Search yields an average ROI of $2 to $8 for every $1 spent in 2026, serving as a predictable pipeline driver, if you have the right multi-touch attribution model
- The biggest threats to your forecast accuracy are stale data, siloed tracking, and unchecked ad spend leaks. Tools like Factors.ai solve this by unifying your CRM, marketing channels, and first-party data into a singular, auditable source of truth.
Revenue forecasting models help finance, RevOps, and GTM leaders answer one practical question: which method should we trust for next quarter's revenue plan? In B2B SaaS, the right answer is rarely one model in isolation. Teams usually need a mix of historical trend analysis, pipeline forecasting, churn and expansion inputs, and scenario planning to build a forecast they can actually use for budgeting, hiring, and board reporting.
In this guide, you'll learn the 7 most useful revenue forecasting models, when each works best, and how to choose the right mix based on your business type, data quality, and forecast horizon.
Note: moving average is included in this article as a time-series technique rather than a separate standalone model.
What is Revenue Forecasting?
Revenue forecasting is the process of predicting future revenue for a company using historical performance data, predictive modeling, and qualitative insights. Revenue forecasts provide an estimated projection of the total revenues expected in a future period.
Forecast time horizons can range from next month to next quarter to five years from now. Short-term forecasts may focus on immediate sales pipeline conversion, while long-range forecasts take a broader market-based approach.
With revenue forecasting, the goal is to provide the most accurate prediction of future revenue based on current insights. These reports can also be improved by leveraging attribution data so you know exactly what functions of marketing or sales bring in real revenue.
Revenue forecasting helps answer questions like:
- How much revenue can we expect to generate in the next quarter/year?
- How will seasonality trends and new product launches impact revenue?
- How quickly are we expected to grow over the next 5 years?
When done right, revenue forecasting can power key business functions:
- Financial planning: Building P&L statements, budgets, valuation
- Sales planning: Setting quotas, territory mapping, compensation
- Marketing planning: Demand generation budgeting, growth modeling
- HR planning: Hiring goals, resource allocation across teams
- Manufacturing planning: Inventory needs, capacity expansion
- Executive planning: Strategy setting, investment decisions
While revenue forecasting attempts to predict future revenues, it differs from a revenue projection which is typically more aspirational. Let's understand the differences.
Revenue Forecasting vs. Revenue Projections vs. Sales Forecasts
These three terms are used quite often when it comes to budgeting and strategic planning but they mean different things.
- Revenue Forecasts model the actual monetary revenue expected based on sales forecasts, historic performance, market conditions and statistical modeling. It provides the most likely, evidence-based scenario.
- Revenue Projections are what leadership desires to happen—an optimistic target rather than a data-driven expectation. Projections represent an aspirational revenue goal.
- Sales Forecasts predict expected sales bookings and pipelines based on leading indicators like open opportunities. They are an input into revenue forecasts.
| Metric | What It Actually Means | Best Used For |
|---|---|---|
| Revenue Forecast | An evidence-based calculation of expected monetary revenue based on hard data and market conditions. (The realistic truth). | Budgeting, hiring, and operational planning. |
| Revenue Projection | An optimistic, aspirational target set by leadership. (The dream outcome). | Investor pitches and motivating sales teams. |
| Sales Forecast | A hyper-focused prediction of expected bookings and short-term pipeline conversions. (An input). | Tracking sales rep quotas and quarterly pipeline health. |
Now, let's understand the types of revenue forecasts that you may come across.
Key Types of Revenue Forecasts
There are also different types of revenue forecasts based on methodology and time span:
- Short-term vs. Long-term - Short-term forecasts focus on immediate pipeline conversion, while long-term forecasts take a broader market-based view.
- Top-down vs. Bottom-up - Top-down forecasting starts with macro assumptions and allocates them across business units. Bottom-up rolls-up forecasts built from ground realities.
- Operational vs. Financial - Operational forecasts model near-term revenue streams. Financial forecasts take a holistic P&L view including costs and expenses.
- Deterministic vs. Probabilistic - Deterministic forecasts provide a single expected outcome. Probabilistic forecasts model a range of outcomes and probabilities.
Now, let's examine some key business uses and benefits of revenue forecasting.
Why is revenue forecasting important?
Accurate revenue forecasts can be the difference between success and failure for a business. Here are a few ways forecasting powers planning across the organization:
1. Budgeting with Realistic Precision
For finance teams, the single biggest use of forecasts is to build organization-wide budgets.
Budgets dictate how much gets spent on everything from R&D investments to marketing programs and payroll. Without reliable revenue forecasts, budgets devolve into guesswork.
For example, assume a company's revenue was $5M last year. Now the CFO needs to build next year's budget.
With intelligent forecasts, finance can model that based on new product launches, a 10% industry growth rate, and sales team expansions, revenues are likely to reach around $7.5M next year.
The CFO can now budget for expenses accordingly - say $1M for new engineering hires, $500K for more marketing, $150K for sales operations software etc.
Without forecasts, the CFO is flying blind. Maybe she pads the budget with a 20% increase to $6M. But if actual revenues only end up at $5.5M, suddenly there's a multi-hundred thousand dollar budget shortfall, requiring drastic cuts.
Conversely, if revenues actually reach $8M but budgets are based on last year's numbers, the company is now missing key growth opportunities due to under-investment.
2. Optimize Operations Management
Beyond budgets, forecasts guide operational decisions across departments:
- Sales: Forecasts feed territory assignments, quota setting, compensation planning, and capacity modeling whereas under-forecasting leaves money on the table.
- Marketing: Forecasts dictate digital and outbound campaign budgets and funnel targets where bad forecasts can waste spending and lead to missed opportunities.
- Product: Prioritizing the roadmap requires expected revenues from new features so bad forecasts can result in misplaced priorities.
- HR: Hiring and workforce planning requires expected growth rates and flimsy forecasts risk talent shortages or bloat.
Across the board, teams depend on forecasts to optimize operational management for future success amid constraints.
3. Fuel Strategic Decisions
Forecasts also provide the quantified confidence executives need to drive growth through major strategic moves:
- Funding rounds: Forecasts build credibility on growth potential to establish valuations. Weak forecasts undermine bids for capital.
- M&A valuation: Pre-transaction due diligence depends on target revenue forecasts. Bad forecasts lead to overpayment or lost deals.
- Market expansion: Breaking into new regions or verticals requires quantifying addressable revenues and investment payback.
- New product prioritization: High-impact opportunities are identified by revenue potential under constrained resources.
- Executive recruitment: Attracting star senior talent requires painting a compelling growth.
Creating reliable revenue forecasts empowers executives to place decisive strategic bets amid uncertainties, as opposed to shooting blind.
4. Track Performance to Plan
Revenue forecasts also provide a scorecard against which actual results can be monitored. Comparing real revenue performance vs. forecasted expectations then allows deviations to be easily flagged. With this information at hand, teams can course-correct before small misses snowball into major disasters.
Without forecasts as the reference point, there is no way to reliably track progress against potential. Revenue actuals in a vacuum don't reveal whether performance is on-target or off-course.
{{INLINE_TOFU}}
What are the types of revenue forecast models?
Now that we understand the fundamentals of revenue forecasting, let's examine some of the most common revenue forecasting models and techniques.
Broadly, forecasting approaches can be divided into two families:
- Quantitative models take a data-driven statistical approach to identifying trends and patterns in historical data that can be used for future predictions.
- Qualitative models incorporate expert perspectives, market analyses and contextual business insights to predict future revenues.
There are four common forecasting models namely linear regression, time series, bottom-up, and top-down. The best way to perform revenue forecasting is by combining multiple models to benefit from each of them.
Let's explore some of these popular models.
Comparison of the 7 Core Revenue Forecasting Models
Selecting the appropriate framework depends heavily on your data infrastructure, historical runway, and business model complexity.
| Model | Best for | Data needed | Complexity | Best time horizon |
|---|---|---|---|---|
| Linear regression | Quantifying revenue drivers | Large historical dataset | Medium | Short to medium |
| Time series | Seasonal or recurring revenue | 12+ months of historical revenue | Medium to high | Short to long |
| Bottom-up | Cross-functional operating plans | Pipeline, territory, and team inputs | Medium | Short to medium |
| Top-down | Strategic planning and market-entry assumptions | TAM, market share, macro assumptions | Low to medium | Medium to long |
| Pipeline-based | B2B SaaS and enterprise sales teams | CRM stage data and win rates | Low to medium | Quarterly |
| Scenario-based | Board planning and uncertainty management | Base model plus assumptions | Medium | Medium to long |
| AI / ML | Large datasets with multiple signals | Clean, connected CRM, finance, and product data | High | Any |
What are the 4 forecasting models?
If you're looking for the short answer, most businesses group forecasting into four core approaches: time-series models, regression models, bottom-up / pipeline models, and scenario-based models. In practice, teams often expand that list to include top-down planning and AI/ML forecasting, but these four buckets cover the majority of real-world use cases.
- Time-series models forecast from historical patterns and seasonality.
- Regression models forecast based on relationships between revenue and key drivers like spend, headcount, or pipeline volume.
- Bottom-up and pipeline models build forecasts from deals, territories, product lines, or team inputs.
- Scenario-based models model best-case, base-case, and worst-case outcomes for planning under uncertainty.
If you need more precision, the seven models below break these categories into practical methods you can actually implement.
1. Linear Regression Models

Linear regression analyzes historical data to model how changes in key variables impact revenue.
Regression provides a data-backed view into drivers of revenue growth and contraction.
However, regression models are only as good as the input data. They may miss complex real-world dynamics that are not reflected in historical data. Approaching them as helpful guiding tools rather than absolute truth is important.
Key Benefits
- Quantifies the relationship between revenue drivers and outcomes
- Calculates the impact of each variable on revenues
- Models complex interactions between multiple variables
- Provides data-driven revenue projections
How It Works
Simple linear regression uses one variable, often time, to predict revenue.
For example, it can help a business quantify how much additional revenue every $1 increase in marketing spend has historically generated. This insight can be used to forecast revenue under different scenarios.
Multiple linear regression incorporates additional factors simultaneously like marketing spend, sales activities, market dynamics etc.
The model examines historical data to calculate coefficients measuring each variable's unique relationship with revenue. These insights feed the predictive model to forecast expected revenue under different scenarios.
Considerations
- Regression modeling requires large volumes of accurate historical data
- Predictive power diminishes beyond modeled relationships
- Difficult to model nonlinear variable interactions
Regression provides a data-backed view into drivers of revenue growth and contraction. It brings statistical rigor to projecting the top and bottom-line impact of decisions around pricing, hiring, product launches, geographical expansion and more.
However, these models are only as good as the input data. They may miss complex real-world dynamics that are not reflected in historical data. Approaching them as helpful guiding tools rather than absolute truth is important.
2. Time Series Forecasting

Time series analysis detects historical patterns in data over time. This helps tease out seasonal and cyclical trends from broader growth trajectories and random noise.
It decomposes revenue time series into:
- Trend - Overall upward/downward trajectory
- Seasonality - Cyclical patterns
- Noise - Random unexplained variations
Time series models maximize signals and minimize noise in historical data for sophisticated revenue projections tailored to the business. These models can incorporate recent data, balancing responsiveness to change with smoothing noise and help you extract actionable insights for reporting and forecasting.
Key Benefits
- Models trends and seasonality specific to the business
- Highlights time-based nuances impacting revenue
- Provides granular, frequently updating forecasts
How It Works
Time series techniques like moving averages, exponential smoothing, and ARIMA modeling analyze a revenue time series to optimize the predictive modeling of its components.
For example, enterprise software revenues may spike every fourth quarter due to a year-end budget flush. Media subscriptions may dip in the summer months when travel is high. Understanding these nuances helps make more contextual and accurate forecasts.
You can then use the insights generated from the time series forecasts to smoothen the growth curve giving you more predictable revenue.
Considerations
Time series models need sufficient history to detect reliable patterns. They may miss entirely new market dynamics or one-off events, unlike the past. Hence, combining them with human judgment is important.
3. Bottom-Up Forecasting

Bottom-up forecasting taps insights from sales, account management and other frontline teams to build projections. They incorporate pipeline health, competitive threats, and market mood along with historical data.
How It Works
Let's take an example organization with sales, marketing, finance, and leadership teams. Here's how bottom-up forecasting would work:
- The sales team starts by analyzing the health of its current pipeline and expected deal cycles to forecast expected conversion rates by product line and region.
- Meanwhile, marketing examines recent campaign performance and lead generation trends to estimate new MQLs by campaign channel. They apply conversion rates to project new SQLs.
- Finance consolidates these detailed bottom-up forecasts from each department. They identify and resolve any inconsistent methodologies or assumptions between teams.
- Leadership reviews the consolidated forecast and makes final top-down adjustments to determine the official revenue projection.
Key Benefits
- Incorporates insights from sales, account management, and other frontline teams
- Reflects pipeline health, competitive dynamics, and micro-market nuances
- Promotes buy-in through the inclusion of cross-functional inputs
Considerations
Inconsistent assumptions between teams can skew the overall forecast. Guidance from leadership on industry outlook, macroeconomic factors and growth objectives helps align assumptions and methodologies.
4. Top-Down Forecasting

Top-down forecasting starts with the big-picture view of the total addressable market, growth trajectories, economic conditions and business strategy. Leadership sets goals and divides revenue targets across functions.
This ensures strategic alignment between long-term goals and short-term operations. However, seemingly arbitrary targets could demotivate teams without context on the rationale so with top-down forecasting, you need to ensure two-way communication and transparency from leadership.
How It Works
Let's look at top-down revenue forecasting through an example.
- The executive/leadership team starts with the overall revenue growth target based on market outlook and strategic goals. They divide this target across sales, marketing and customer success based on revenue impact capacity.
- Each team gets their individual revenue target along with guidance on growth assumptions like pricing, conversions, expansions etc.
- Teams build goal-aligned execution plans around sales territories, campaigns, and account targeting to meet their top-down number.
- Leadership reviews department plans to ensure coordination and consistent assumptions are in place.
Considerations
- Teams lack insights into the rationale behind seemingly arbitrary targets
- Overlooks micro-market nuances and competitive dynamics
- Requires reconciliation of opposing projections
Blending both top-down and bottom-up approaches for revenue forecasting can help set realistic targets based on market conditions while aligning activities to growth objectives.
5. Pipeline-Based Forecasting
Pipeline-based forecasting uses your active sales pipeline to predict future revenue by applying conversion probabilities at each deal stage.
This model is especially popular with B2B SaaS companies that have well-structured CRM data. Rather than relying solely on historical trends, pipeline forecasting looks at what's actually in your funnel right now.
How It Works
Each deal in your pipeline is assigned a probability based on its current stage. For example:
- Discovery stage: 10% close probability
- Demo completed: 30% close probability
- Proposal sent: 60% close probability
- Negotiation: 80% close probability
The weighted sum of all deals gives you the expected revenue. For instance, a $100K deal at the proposal stage contributes $60K to the forecast.
Key Benefits
- Directly tied to real sales activity, not just assumptions
- Updates in real-time as deals progress
- Helps sales leaders identify pipeline gaps early
Considerations
Pipeline forecasting depends on accurate CRM data and consistent stage definitions across the team. If deal stages are subjective or data entry is inconsistent, the forecast will be unreliable. Pairing it with historical conversion rates improves accuracy.
6. Scenario-Based Forecasting
Scenario-based forecasting builds multiple revenue projections — best case, base case, and worst case — to prepare for different business outcomes.
Instead of relying on a single number, this model accounts for uncertainty by mapping revenue under different assumptions. It's particularly valuable for startups, businesses entering new markets, or companies operating in volatile industries.
How It Works
Define 3 scenarios with different assumptions:
- Best case: Higher win rates, faster deal cycles, successful product launches. Example: 20% growth if new enterprise segment converts at expected rates.
- Base case: Continuation of current trends with modest improvements. Example: 10% growth in line with historical averages.
- Worst case: Market downturn, lost key accounts, or delayed product launches. Example: Flat or -5% growth under economic slowdown.
Leadership uses these scenarios to plan contingency budgets and resource allocation.
Key Benefits
- Prepares the organization for multiple outcomes, not just one target
- Forces leadership to identify risk factors and mitigation strategies
- Useful for board presentations and investor communications
Considerations
Scenario-based forecasting works best when combined with a data-driven base model (like time series or pipeline). Without grounding in real data, scenarios can devolve into arbitrary guesses.
7. AI and Machine Learning Forecasting
AI and machine learning (ML) forecasting uses algorithms to identify complex, nonlinear patterns in large datasets that traditional models may miss.
As businesses accumulate more data from CRMs, marketing platforms, and product analytics, ML models can process these signals to generate more accurate and adaptive revenue predictions.
How It Works
ML forecasting models are trained on historical data and learn to recognize patterns without being explicitly programmed. Common approaches include:
- Random Forests and Gradient Boosting: Ensemble methods that combine many decision trees for robust predictions. These handle mixed data types and provide feature-importance metrics showing which variables drive revenue most.
- Neural Networks (LSTM/GRU): Deep learning models that capture temporal dependencies in sequential data — ideal for businesses with complex seasonal patterns.
- Regression-based ML: Enhanced versions of traditional regression that automatically detect variable interactions.
Key Benefits
- Processes far more variables simultaneously than traditional models
- Self-improves as more data becomes available
- Captures nonlinear relationships between revenue drivers
Considerations
ML models require large, clean datasets to train effectively. They can also be 'black boxes' — harder to explain to stakeholders than a simple regression. For most mid-market companies, combining ML insights with traditional models provides the best balance of accuracy and interpretability.
What is the Best Method for Revenue Forecasting?
The best forecasting method depends on your use case. Here's a quick comparison of all 7 models to help you decide:
| Model | Best for | Data needed | Complexity | Best time horizon |
|---|---|---|---|---|
| Linear regression | Quantifying revenue drivers | Large historical dataset | Medium | Short to medium |
| Time series | Seasonal or recurring revenue | 12+ months of historical revenue | Medium to high | Short to long |
| Bottom-up | Cross-functional operating plans | Pipeline, territory, and team inputs | Medium | Short to medium |
| Top-down | Strategic planning and market-entry assumptions | TAM, market share, macro assumptions | Low to medium | Medium to long |
| Pipeline-based | B2B SaaS and enterprise sales teams | CRM stage data and win rates | Low to medium | Quarterly |
| Scenario-based | Board planning and uncertainty management | Base model plus assumptions | Medium | Medium to long |
| AI / ML | Large datasets with multiple signals | Clean, connected CRM, finance, and product data | High | Any |
Let's understand this with two examples.
A SaaS company with recurring subscription revenue may find time series analysis to be very effective. That's because, studying historical revenue patterns over time, seasonal cycles and trends become apparent. Statistical time series models can help quantify these patterns to accurately predict recurring revenues.
On the other hand, for a retail chain opening new store locations, a bottom-up approach could prove more useful. Each new store manager could prepare detailed forecasts for their location based on demographics, nearby competitors, marketing plans etc. Aggregating these bottom-up projections provides a realistic the overall revenue forecast.
The point is, every business is situated differently. The ideal approach depends on:
- Data availability - length of revenue history, presence of relevant drivers/variables
- Revenue characteristics - recurring/seasonal patterns, level of variability
- Business structure - centralized/decentralized, product diversity
- Strategic context - expanding to new markets/geographies, introducing major new offerings
Leaders need to understand revenue drivers in their industry and business and use the insights to tailor the forecasting methodology to their specific situation and objectives.
Combining methods can also be beneficial. For example, a short-term quarterly forecast may use time series analysis to leverage recent revenue trends. And for the annual budget, a bottom-up approach could then add local market perspectives for a comprehensive view.
The key is adapting forecasting approaches to match business realities which provides the accuracy and insights required for confident decision-making across the organization.
Recommended Models by Business Type
Not sure which model fits your business? Here's a quick guide:
- B2B SaaS (subscription-based): Start with time series analysis for recurring revenue patterns, then layer in pipeline-based forecasting for new business. Track MRR/ARR components — new revenue, expansion, churn — separately for the most accurate picture.
- B2B Sales-Led (enterprise deals): Combine bottom-up forecasting from your sales team with pipeline-based models. Long sales cycles make pipeline stage probabilities critical.
- Product-Led Growth (PLG): Use usage-based signals (active users, feature adoption, seat expansion) as leading indicators. Pair with scenario-based models to plan for viral growth or plateau scenarios.
- Early-Stage Startups: With limited historical data, rely on top-down market sizing combined with bottom-up pipeline estimates. Use scenario-based models for investor conversations.
- Established Enterprises: Leverage time series + linear regression with deep historical data. Add AI/ML models when data volume justifies the complexity.
A Practical B2B SaaS Revenue Forecasting Framework
For most B2B SaaS companies, the most reliable revenue forecast combines three layers instead of relying on a single model:
- Time-series baseline for recurring revenue trends, seasonality, and historical growth.
- Pipeline-based forecast for new business expected to close this quarter.
- Expansion and churn adjustments for renewals, contractions, and upsell revenue already inside the customer base.
A simple framework looks like this:
Forecasted revenue = Recurring baseline + weighted pipeline + expected expansion - expected churn
This approach works well because SaaS revenue usually comes from multiple streams at once: new ARR, renewals, upgrades, downgrades, and churn. If you only model pipeline, you'll overstate confidence. If you only model history, you'll miss major GTM changes already visible in CRM data.
Use scenario planning on top of this framework to create best-case, base-case, and worst-case versions for executive reviews.
How to Forecast Revenue: A Step-by-Step Process
Regardless of which model you choose, the revenue forecasting process follows a consistent framework. Here's how to build a reliable forecast from scratch:
Step 1: Gather and Clean Your Data
Pull historical revenue data from your CRM, accounting software, and marketing platforms. Ensure data is complete, deduplicated, and covers at least 12 months. The more history you have, the more reliable your forecast.
Step 2: Define Your Forecast Horizon
Decide whether you're forecasting for next month, next quarter, or next year. Short-term forecasts (1-3 months) work best with pipeline and moving average models. Long-term forecasts (1-5 years) benefit from time series and top-down approaches.
Step 3: Identify Revenue Drivers
Map the key variables that influence your revenue: sales headcount, marketing spend, average deal size, conversion rates, churn rate, and seasonality patterns. These become inputs for your forecasting model.
Step 4: Select and Apply Your Model(s)
Choose from the 7 models above based on your data availability and business type. Most companies get the best results by combining 2-3 models — for example, pipeline-based for Q1 accuracy plus time series for annual planning.
Step 5: Validate and Adjust
Compare your forecast against actual results monthly. Track forecast accuracy as a percentage and investigate significant variances. Adjust your model inputs as new data becomes available — forecasting is iterative, not a one-time exercise.
Revenue Forecast Formula: A Quick Example
Here's a simple revenue forecast using the straight-line method — one of the most accessible models for businesses with steady historical growth:
Formula: Forecasted Revenue = Last Period Revenue x (1 + Growth Rate)
Example:
- Q4 2025 revenue: $500,000
- Average quarterly growth rate (last 4 quarters): 8%
- Q1 2026 forecast: $500,000 x 1.08 = $540,000
For a more nuanced forecast, apply a weighted moving average that gives more importance to recent quarters:
Weighted Forecast: (Q4 x 0.4) + (Q3 x 0.3) + (Q2 x 0.2) + (Q1 x 0.1)
These formulas give you a starting point. Layer in pipeline data, seasonality adjustments, and market signals for a more complete picture.
Revenue Forecasting KPIs to Track
A forecast is only useful if you measure how accurate it is over time. Track these KPIs every month or quarter:
- Forecast accuracy %: How close forecasted revenue was to actual revenue.
- Pipeline coverage: Qualified pipeline value divided by quota or revenue target.
- Win rate by stage: Helps validate whether your pipeline weighting is realistic.
- Average sales cycle length: Important for forecasting timing, not just deal value.
- Expansion rate and churn rate: Critical for SaaS businesses where retained revenue drives the forecast.
If forecast accuracy slips, don't just update the number—review which assumption broke: close rates, cycle length, seasonality, pricing, or churn.
Revenue Forecasting Models: Best Practices
What are some of the best practices for ensuring accurate revenue forecasting when using these revenue forecasting models? Let's look at 4 of the best practices that you should consider following.
1. Start with high-quality data
Remember this—garbage in, garbage out. Even the most advanced model cannot compensate for poor-quality data. Invest in processes and systems to collect accurate, complete revenue data, with proper change logs and auditing.
2. Eliminate outdated information
Stale data loses relevance quickly. Establish mechanisms to continually gather the latest data on revenue drivers. This could involve surveys, sales team feedback, customer interviews etc.
3. Reduce the length of planning cycles
Annual plans using old assumptions miss market shifts. Re-forecast more frequently using the latest data to stay agile. Quarterly or even monthly cycles are preferable.
4. Avoid a futile bid for perfection
Obsessing over tiny accuracy improvements is counterproductive beyond a point. Focus on balancing usefulness and cost when selecting model sophistication.
Common Revenue Forecasting Mistakes to Avoid
Even with the right model, forecasting can go wrong. Here are the most common pitfalls and how to avoid them:
1. Relying on a Single Model
No single model captures every variable. Combining a quantitative model (like time series) with a qualitative approach (like bottom-up sales input) provides a more balanced forecast.
2. Ignoring External Market Signals
Internal data tells you what happened. External signals — economic indicators, competitor moves, regulatory changes — tell you what might happen next. Build these into your assumptions.
3. Over-Relying on Excel Spreadsheets
Excel-based forecasting is error-prone, hard to version-control, and burns out teams with manual updates. As one FP&A practitioner noted, version-controlled assumption templates with automated data ingestion produce more reliable results than spreadsheet-based models.
4. Setting It and Forgetting It
A forecast created in January is outdated by March. Re-forecast quarterly at minimum — monthly is better. The best teams treat forecasting as a continuous process, not an annual exercise.
5. Conflating Forecasts with Targets
A forecast is what you expect to happen based on data. A target is what you want to happen. Mixing the two leads to inflated projections and missed budgets. Keep them separate.
What Practitioners Say About Revenue Forecasting
Revenue forecasting isn't just a finance exercise — it's a cross-functional challenge that impacts every team. Here's what real practitioners are saying:
- Automation is replacing spreadsheets. FP&A teams are increasingly moving from Excel-based forecasting to Python scripts and purpose-built tools. Version-controlled assumption templates with automated data ingestion produce more reliable, auditable results.
- Simpler models often outperform complex ones. Data science practitioners note that for small datasets (common in mid-market B2B), classical methods like moving averages and linear regression frequently beat ML models that need large training sets.
- Forecasting cycles burn out teams. Monthly re-forecasting in manual spreadsheets is a top complaint. The solution: invest in tools where departments update their inputs independently and the forecast consolidates automatically.
- The art-vs-science debate is over. Revenue operations leaders emphasize that gut-feel forecasting is no longer sufficient. 'We have models, AI, and abundant data. Together, they make the science of revenue forecasting accessible to every RevOps professional.'
How Factors.ai Can Help Your Business Drive Revenue
Let's face it, optimizing your GTM strategy is tedious, and time-consuming without having all the right data in one place.
You have your metrics in different silos across marketing, sales, and revenue and piecing together a complete picture feels impossible. You could have leaks in your funnel, but cannot find the exact pages. Attribution has become a shot in the dark. And you're pouring money into campaigns without knowing if they're working or not.
This is where Factors.ai comes in.
Factors.ai is an AI ABM and multi-touch attribution platform. Factors.ai integrates all your disparate data sources, CRM, MAP, web analytics, social media, ad platforms into one unified view.

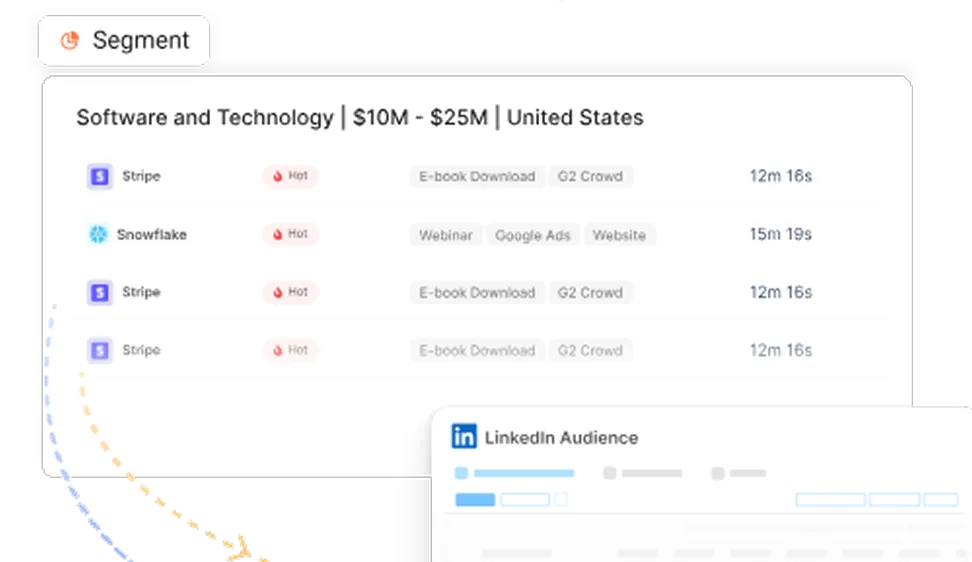
You can quickly pull custom reports to get insights and answers on the fly. Factors also leverages leading IP resolution technology to reveal anonymous website traffic. Helping you discover up to 64% of untapped traffic and turn them into known, sales-ready accounts. More accounts to market means more pipeline and revenue.
With unified data and a complete view of your funnel, you gain the power to make strategic decisions that move the revenue needle. Scale what works, fix leaks, attribute MQLs to campaigns, analyze account journeys—Factors has you covered.
Don't shoot in the dark. Book a demo with Factors to see how we can help you get better insights and data to power your forecasting models and make data-driven decisions to boost pipeline and growth
Optimize Revenue Forecasting for Smarter Business Decisions
Accurate revenue forecasting models help businesses predict future income and make informed financial, sales, marketing, and operational decisions.
Key forecasting models include:
- Linear Regression & Time Series Analysis: Use historical data to identify trends and predict future revenue.
- Bottom-Up & Top-Down Forecasting: Build projections from frontline sales insights or allocate from macro-level market targets.
- Pipeline-Based Forecasting: Convert active deals into expected revenue using stage probabilities — ideal for B2B SaaS.
- Scenario-Based Forecasting: Model best, base, and worst-case outcomes for strategic planning.
- AI & Machine Learning: Process complex datasets to uncover nonlinear revenue patterns at scale.
The bottom line: No single model works for every business. The most accurate forecasts combine 2-3 models tailored to your data maturity, business type, and planning horizon. Start with the simplest approach that fits your data, then layer in complexity as your needs grow.
Choosing the right model depends on business type, data availability, and forecast horizon. By leveraging predictive analytics and market insights, businesses can refine strategies, improve budgeting, and drive sustainable growth.
FAQs on Revenue Forecasting models
1. What is revenue forecasting and why is it important?
Revenue forecasting is the process of predicting future revenue for a company using historical data, predictive modeling, and insights. Accurate forecasts empower data-driven planning and growth decisions across functions like finance, sales, marketing and operations. Reliable revenue forecasts are mission-critical for budgeting, managing operations, fueling strategic growth moves and tracking performance.
2. What are the top revenue forecasting models?
Popular models include linear regression to model revenue drivers, time series analysis leveraging historical patterns, bottom-up forecasting aggregating projections from frontline teams, and top-down forecasting starting with leadership's total target. Combining approaches provides flexibility to tailor models to business needs and data availability.
3. How often should you update revenue forecasts?
Outdated assumptions lose relevance quickly, so forecasts should be refreshed frequently. Quarterly or monthly re-forecasting cycles are preferable to stay agile versus annual plans. Access to latest revenue driver data enables more responsive modeling.
4. What are some common pitfalls of revenue forecasting?
Potential pitfalls include unpredictable market shocks, limitations of available data, human errors in model assumptions, and finite resources to build sophisticated models. Perfection is unrealistic but maximizing useful accuracy is key.
5. What data is needed for accurate revenue forecasts?
Quality historical revenue data is the foundation. Relevant drivers like market trends, sales activities, product changes, and economic indicators help explain revenues. Updated inputs prevent stale assumptions. Data challenges need pragmatic solutions.
6. How can technology enable better revenue forecasts?
Tools like CRM, account intelligence and analytics tools like Factors, etc. provide key sales and marketing data inputs. Purpose-built FP&A software centralizes data for modeling and reporting. Technologies like AI and machine learning can boost forecasting sophistication.
7. What best practices improve revenue forecasting?
Best practices include maintaining high-quality data, eliminating outdated information, shortening planning cycles, combining modeling approaches, and focusing models on business needs. Avoid needless complexity but leverage enough sophistication to meet objectives.
8. What is the difference between revenue forecasting and sales forecasting?
Sales forecasting predicts expected bookings and pipeline conversions based on leading indicators like open deals and rep activity. Revenue forecasting is broader, it incorporates sales forecasts alongside other revenue sources like renewals, expansions, and usage-based income to project total company revenue. Sales forecasts are one input into the overall revenue forecast.
9. Can you forecast revenue in Excel?
Yes. Excel supports basic forecasting using built-in functions like FORECAST.LINEAR, TREND, and moving average calculations. For simple models with limited data, Excel works well. However, as data volume grows and you need real-time pipeline integration or multi-variable regression, purpose-built FP&A tools or CRM-connected platforms like Factors provide more reliable, automated results.
10. How do you forecast revenue for a new product with no historical data?
Without historical data, combine top-down market sizing (total addressable market x expected capture rate) with bottom-up estimates from early sales pipeline and beta customer signals. Scenario-based forecasting is especially useful here — model best, base, and worst cases to set realistic expectations for stakeholders and investors.
11. What are the 4 forecasting models in business?
The four most common forecasting model categories are time-series, regression, bottom-up or pipeline, and scenario-based forecasting. Many companies also use top-down planning and AI/ML forecasting, but those four categories cover the majority of business forecasting use cases.
12. How do you forecast revenue for a B2B SaaS company?
For B2B SaaS, the best approach is usually a hybrid forecast: start with a recurring revenue baseline, add a weighted pipeline forecast for new business, then adjust for renewals, expansion revenue, contractions, and churn. This gives a more accurate picture than relying on pipeline or historical trends alone.

See how Factors can 2x your ROI
Boost your LinkedIn ROI in no time using data-driven insights
Try AdPilot Today


.avif)
.avif)
See Factors in action.
Schedule a personalized demo or sign up to get started for free
LinkedIn Marketing Partner
GDPR & SOC2 Type II

.svg)


.avif)