

Heading 2
SaaS Marketing Reporting Done Right: 5 Tips for Extracting Actionable Insights from Your Reports
What is SaaS marketing reporting? And how do teams make the most of their marketing reports to achieve actionable insights and drive bottom line growth?
Written by


.svg)


TL;DR
- Marketing reports help with decision-making in SaaS marketing
- Before creating a report, know your primary goal, target audience, relevant metrics, report actionability, and reporting frequency
- Avoid common pitfalls like lack of data collaboration between teams, over-reliance on vanity metrics, and ignoring context when creating or analyzing reports
- Use visually engaging elements like graphs and charts for better and faster comprehension of complex data sets and trends
- Three important SaaS marketing reports—marketing attribution, campaign performance, and content marketing reports
- Use a powerful analytics platform like Factors to streamline your reporting process and gain valuable insights for data-driven decision-making
In today's data-driven world, marketing teams are well aware of the importance of collecting and analyzing the right data to inform their strategies.
But, the sheer volume of data available can be both a blessing and a curse. It can lead to an abundance of insights or overwhelm teams while letting the right data go unused. 60% to 73% of all data in an enterprise is left unused when running analytics.
To ensure that your marketing team doesn't fall into this trap, you need proper marketing reporting in place. In this guide, we’ll talk about how you can create top-notch marketing reports specifically tailored for your company.
Marketing reporting basics: Questions to ask before you make your reports
Before diving headfirst into creating marketing reports, let’s take a step back and consider some critical questions. These questions will ensure that your report is not only comprehensive but also specifically tailored to the unique needs and objectives of your team and organization.
1. What is the primary goal of this report?
Before you begin creating a report, you must have the primary objective in place. This gives your reporting the necessary direction and will also make it easier to pick the right metrics for the report.

For instance, if you're creating a report on lead generation for your B2B SaaS company, you'll want to include metrics related to website traffic, lead conversion rate, cost per lead, and qualified leads generated.
2. Who is the target audience for this report?
Once you know the goal and pick the metrics according to the requirements, you need to think about the person reading the report. Not all metrics are important for everyone on the team.
For example, if you’re reporting to the upper management teams, focus on high-level metrics, such as revenue, overall performance, and other growth indicators. This audience wants to see the big picture and how a project or campaign aligns with the company's overall objectives.
For team leaders or project managers, including conversion rates, task completion rates, and individual performance indicators. Team leaders want to understand the team's performance along with the goal achievement.
Finally, we come to individual team members. For this set, focus on metrics relevant to their roles and responsibilities. This might include individual performance metrics, task progress, and any feedback or suggestions for improvement.
3. Which metrics should we be tracking?
Depending on the goals of your marketing efforts and the specific channels utilized, different metrics will be relevant to measure success. Here are five of the nine most important SaaS marketing metrics you need to track.

- Conversion rate: Measure the percentage of visitors who take a desired action, such as signing up for a trial or making a purchase.
- Marketing Qualified Leads (MQLs): Track the number of leads generated by your marketing efforts who are more likely to become customers.
- Customer Acquisition Cost (CAC): Calculate the average cost to acquire a new customer, including marketing and sales expenses.
- Customer Lifetime Value (CLV): Estimate the total revenue a customer will generate over the entire duration of their relationship with your company.
- Retention & Churn: Monitor the percentage of customers who continue using your SaaS product and those who cancel, to understand customer satisfaction and inform retention strategies.
We’ve covered these and other top SaaS marketing metrics in detail that can be valuable in your reporting.
4. How can we make these reports more actionable?
To maximize the utility of your reports, consider incorporating clear visualizations such as graphs or charts that showcase trends over time or performance benchmarks against industry standards.
This way, decision-makers can quickly grasp key insights without sifting through endless rows of raw data.
5. How frequently do we need to create and analyze these reports?
The frequency at which you create and analyze marketing reports depends on the specific goals and needs of your B2B SaaS company. However, here are some general guidelines on report frequency:
- Weekly: Weekly reports help you track short-term performance and make data-driven decisions. These reports often focus on metrics like website traffic, leads, and conversions.
- Monthly: Monthly reports provide a more comprehensive view of your marketing performance and allow you to analyze trends and patterns over a longer period. These reports typically include a broader range of metrics, such as customer acquisition cost (CAC), lifetime value (LTV), and churn rate.
- Quarterly: Quarterly reports help evaluate the effectiveness of your campaigns and make adjustments as needed. Quarterly reports often include a mix of high-level KPIs like revenue growth and more granular metrics related to specific campaigns and channels.
- Annually: Annual reports offer a big-picture view of your marketing performance and are important for strategic planning and goal setting. These include a thorough analysis of the key metrics, as well as an evaluation of your overall marketing strategy in terms of its alignment with the company’s goals.
5 marketing reporting mistakes to avoid in B2B marketing
As important as it is to create insightful marketing reports, you must avoid common mistakes that can diminish the value and impact of these reports. Here are some prevalent pitfalls in marketing reporting and examples of how they manifest in a B2B context.
1. Lack of data collaboration
In many B2B organizations, marketing data is siloed within individual teams. This leads to a fragmented and incomplete view of marketing performance. Without input from the sales team, the marketing team may be unable to determine lead quality or measure the efficacy of lead nurturing efforts accurately.
To solve this, you need to foster a culture of data collaboration and sharing. Businesses can ensure that all relevant stakeholders have access to the information they need to make informed decisions. A tool like Factors can help bring together data from various analytics and CRM platforms to give a complete 360-degree view of the marketing performance.
2. Not tying metrics to business outcomes
When creating marketing reports, prioritize metrics that directly impact revenue generation, customer acquisition, and retention. For instance, if one goal is increasing annual recurring revenue (ARR), make sure you're tracking metrics such as customer lifetime value (CLV) or churn rate alongside standard campaign performance indicators.
Also, track the number of marketing-qualified leads (MQLs) that convert to sales-qualified leads (SQLs) and ultimately close deals. This will give your readers a better understanding of how your marketing efforts have helped the company achieve its goals.
3. Over-reliance on vanity metrics
Vanity metrics may appear impressive at first glance, but they often fail to provide meaningful insight into marketing success. Instead of fixating on surface-level stats, dive deeper and examine how these figures impact crucial factors like lead generation, conversion rates, or sales pipeline growth.
Suppose you see an increase in social media following and engagement in a particular month. Looking at just the vanity metric, it may seem like the company is growing in the right direction. But if you dig deeper to find that the audience engaging with your content isn’t moving further down the funnel, the vanity growth adds no value to the company.
4. Disregarding context when creating or analyzing reports
Without context, interpreting marketing data can be misleading and result in poor decision-making. B2B marketers should consider industry trends, seasonal fluctuations, and competitor activities when analyzing their marketing reports.
For instance, in the case of a company that sells tax preparation software as a service (SaaS), there might be a significant uptick in subscriptions in the months leading up to the tax filing deadline. If this seasonal trend is not considered, the sudden increase could be misinterpreted as the success of a recent marketing campaign. Similarly, a drop in subscriptions after the tax season shouldn't automatically be seen as a failure in marketing efforts.
5. Overlooking actionable insights
Effective marketing reporting should provide not only data but also actionable insights that drive improvement. This requires a thorough understanding of the target audience, marketing goals, and key performance indicators (KPIs). As you craft your reports, add and present information such that it can be turned into specific actions or strategic decisions.
For example, a B2B software-as-a-service (SaaS) company can analyze its website's user behavior data, such as time spent on specific pages or click paths, to identify areas where potential customers may be dropping off during the sales process. After identifying the important areas, the company can make targeted improvements to its website layout, content, or calls to action, ultimately increasing conversion rates and driving more sales.
{{INLINE_TOFU}}
Tips to extract actionable insights from your marketing reports
To maximize the impact and utility of your marketing reports, it's essential to focus on extracting actionable insights that can drive decision-making and strategy optimization. Here are five tips to help you achieve this:
1. Define clear objectives
Start by outlining specific, measurable goals for each report. Are you looking to optimize your ad spend, improve customer engagement, or identify your most successful marketing channels? Knowing the objectives will help you focus your analysis and extract the most relevant insights.
For instance, if you’re looking for ways to increase sales, you may want to analyze your marketing channels and identify the most effective channels that drive conversions. Then, pinpoint the best-selling products that appeal to your target audience. With this, you can allocate your resources more effectively and make well-informed decisions on marketing strategies.
2. Understand the context of your data
Before making major changes to your marketing, consider external context that may influence performance. This can include industry trends, competitor actions, seasonal fluctuations, or even global events like economic downturns or pandemics.
Suppose there's a decrease in your trial sign-ups during a trade show. When you take that in context, potential customers may be busy attending sessions which can affect your marketing campaigns. Recognizing this helps avoid unnecessary changes to your strategies and helps you optimize your efforts around the event instead.
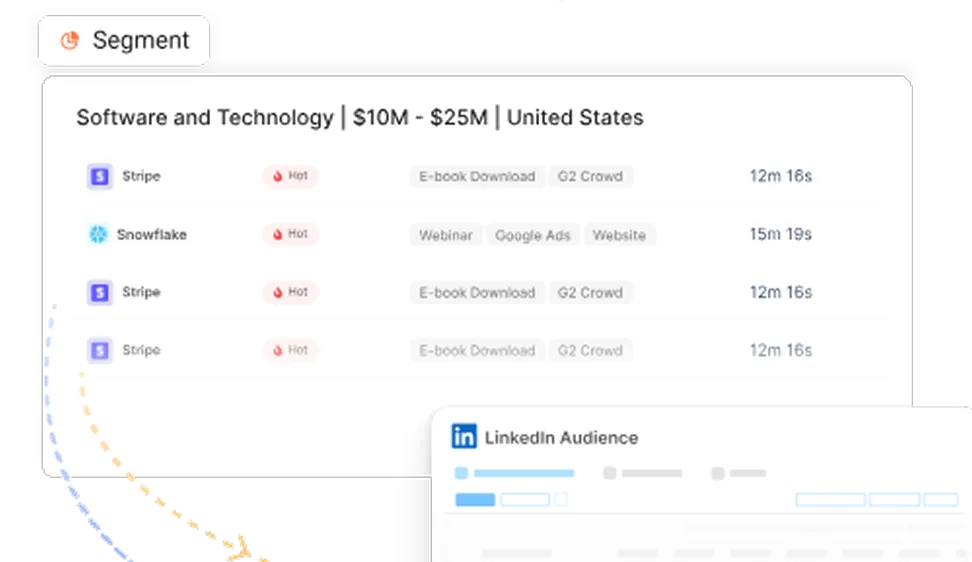
3. Segment your reports
Your customer-base is diverse. And understanding this diversity can help deliver the right information to the right group. Start by segmenting your marketing reports based on demographics, geography, behavior, or other relevant details. This will help you uncover trends, patterns, and preferences that can inform your marketing strategies.
For example, suppose you operate a project management SaaS. Through segmented reports, you discover that:
- small tech startups frequently use the platform for sprint planning
- larger corporations use it more for long-term project tracking
With this knowledge, you can now tailor the marketing messages to highlight the exact features and benefits that resonate with each segment—enhancing the relevance of your communications and positively impacting your conversion rates.
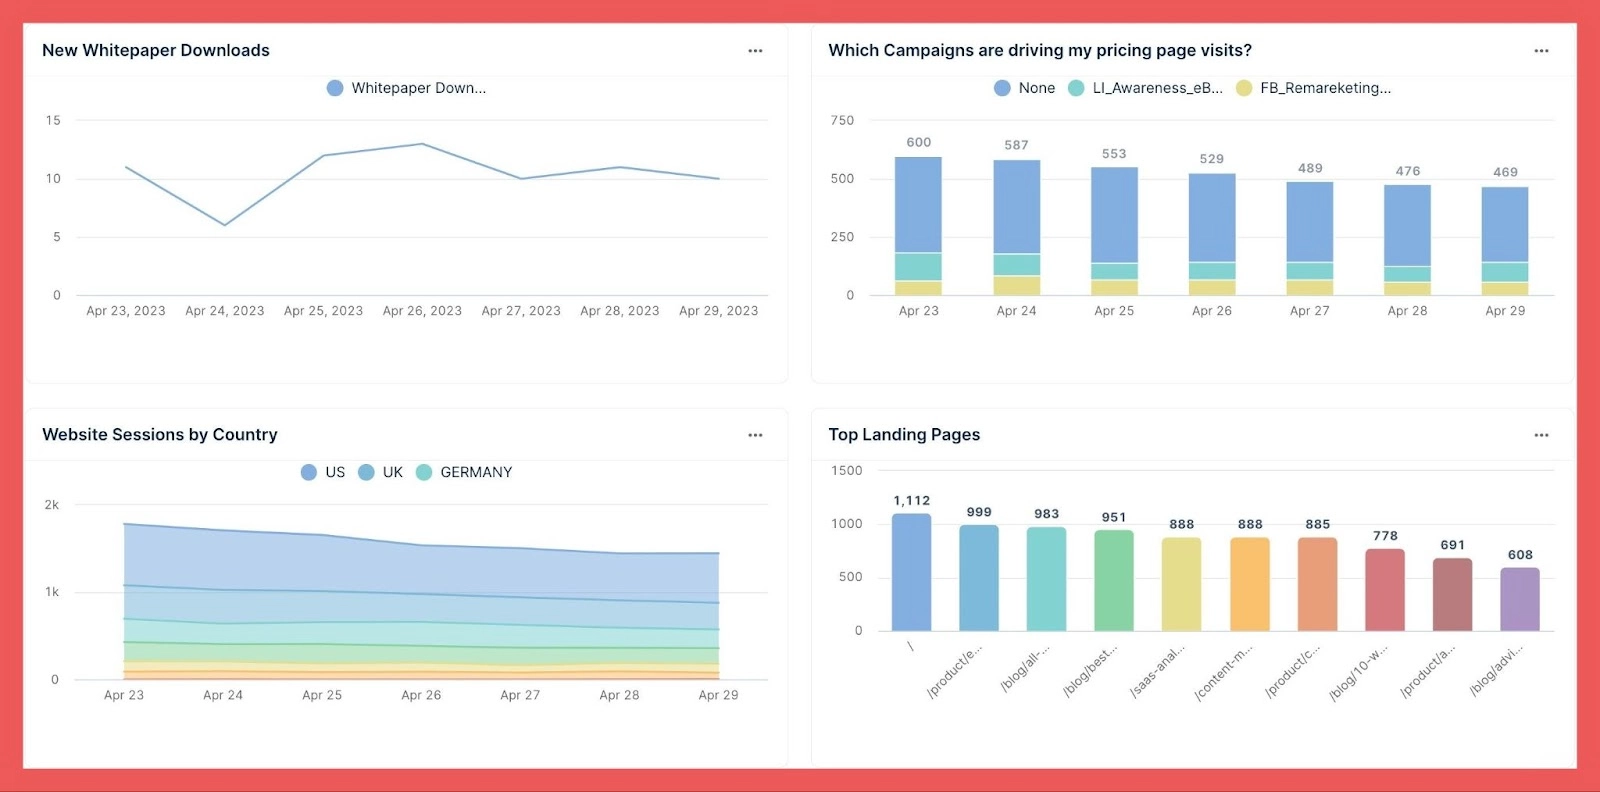
4. Improve visualizations
A well-designed visualization can make a world of difference in how easily you can understand and interpret your marketing reports. Use charts, graphs, and other visuals to present your data clearly and compellingly to your audience. People are more likely to consume and leverage visual data. Also, it’s easier to identify trends, spot anomalies, and draw accurate conclusions from visual plots compared to reading through tables of data.
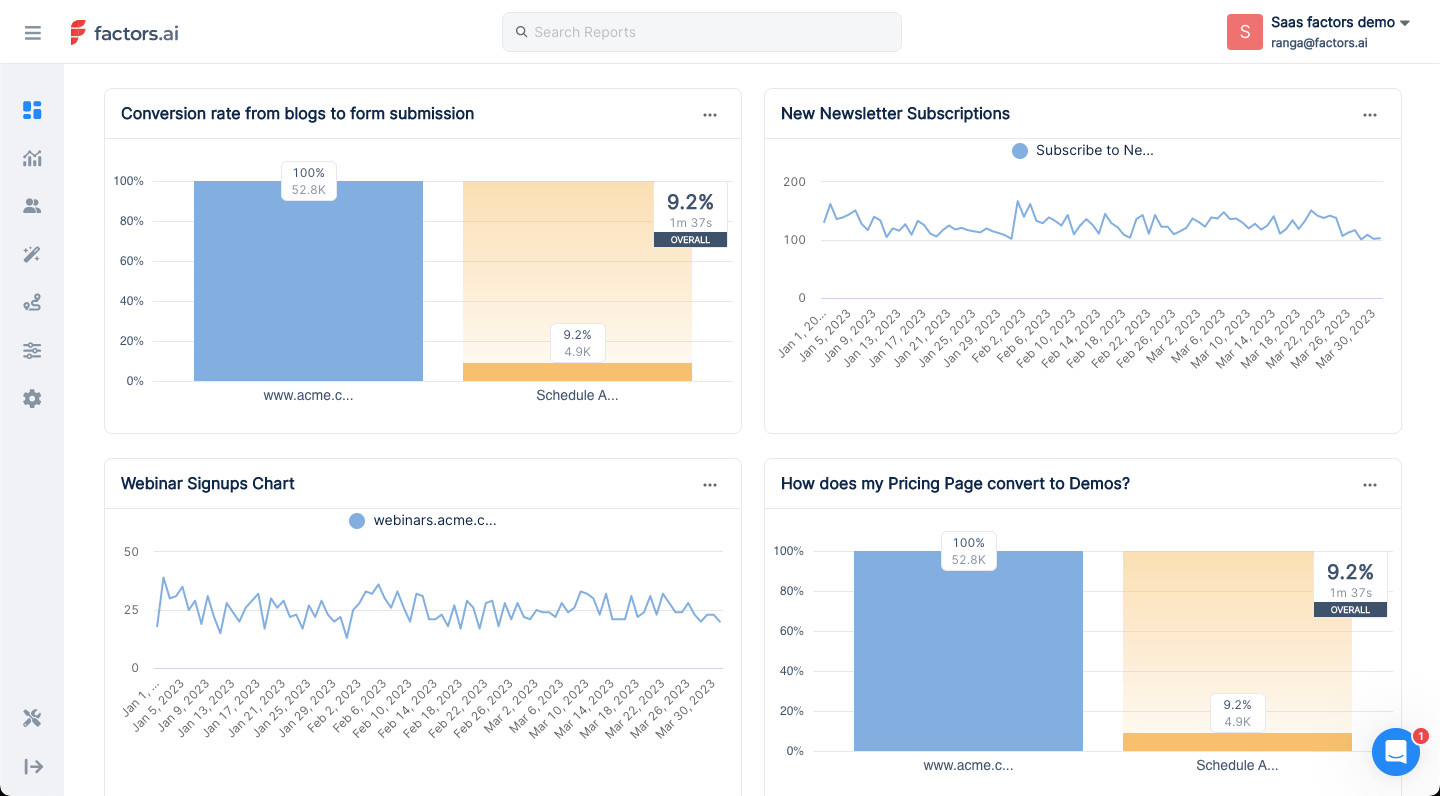
To make visualization easier, use tools like Factors, PowerBI, or Google Looker Studio to create interactive dashboards that allow you to explore your data from multiple angles and extract valuable insights.
5. Embrace data storytelling
Data storytelling means weaving a narrative around your data, making it easier to understand, remember, and act upon. This can connect marketing data points with broader business objectives while keeping the presentations easy to digest. Stories can also help stakeholders better understand the significance of your marketing efforts.
For example, if your data reveals that a targeted content marketing campaign significantly boosted trial sign-ups and subsequently increased monthly recurring revenue (MRR), showcasing this storyline in your report will emphasize the strategic value of content marketing efforts.
3 types of marketing reports SaaS companies should be creating
To fully understand the impact of your marketing efforts and make informed decisions, you need to create and analyze various types of marketing reports. Here are three types of marketing reports that SaaS companies should be focusing on:
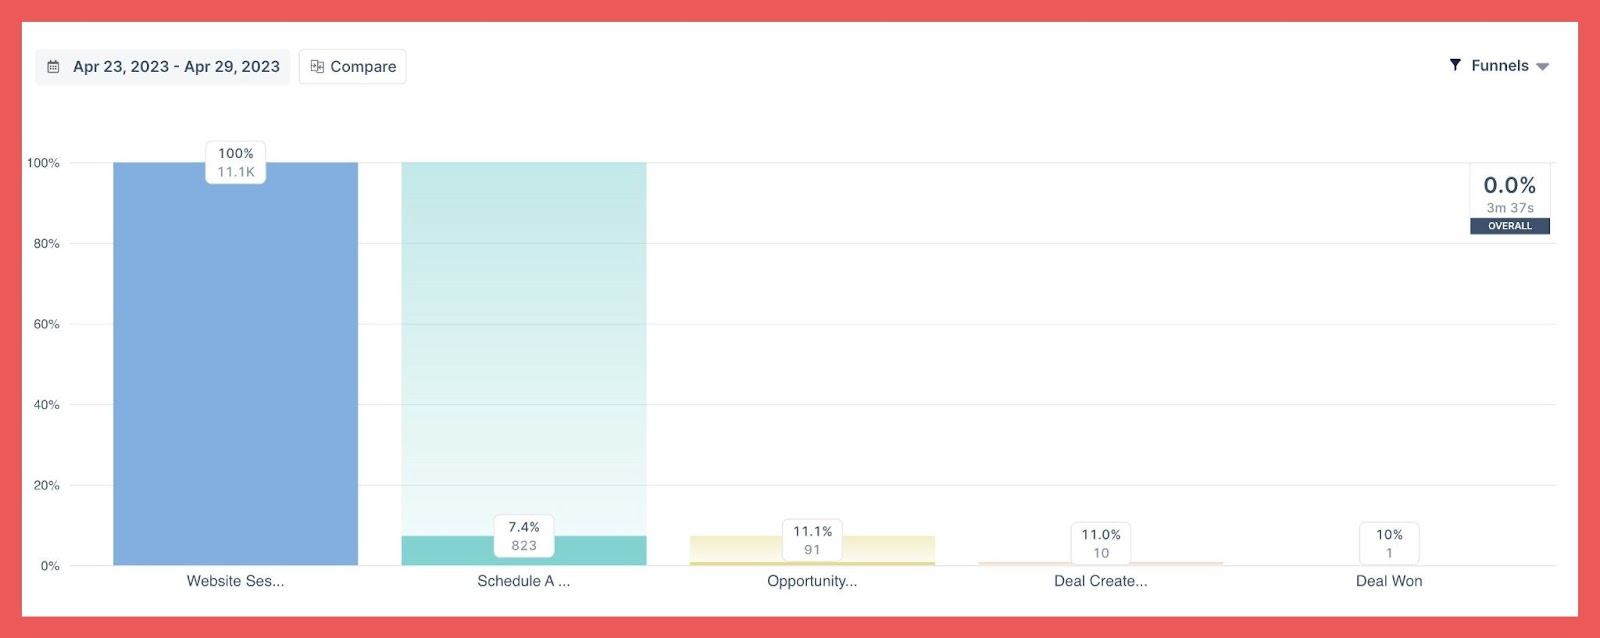
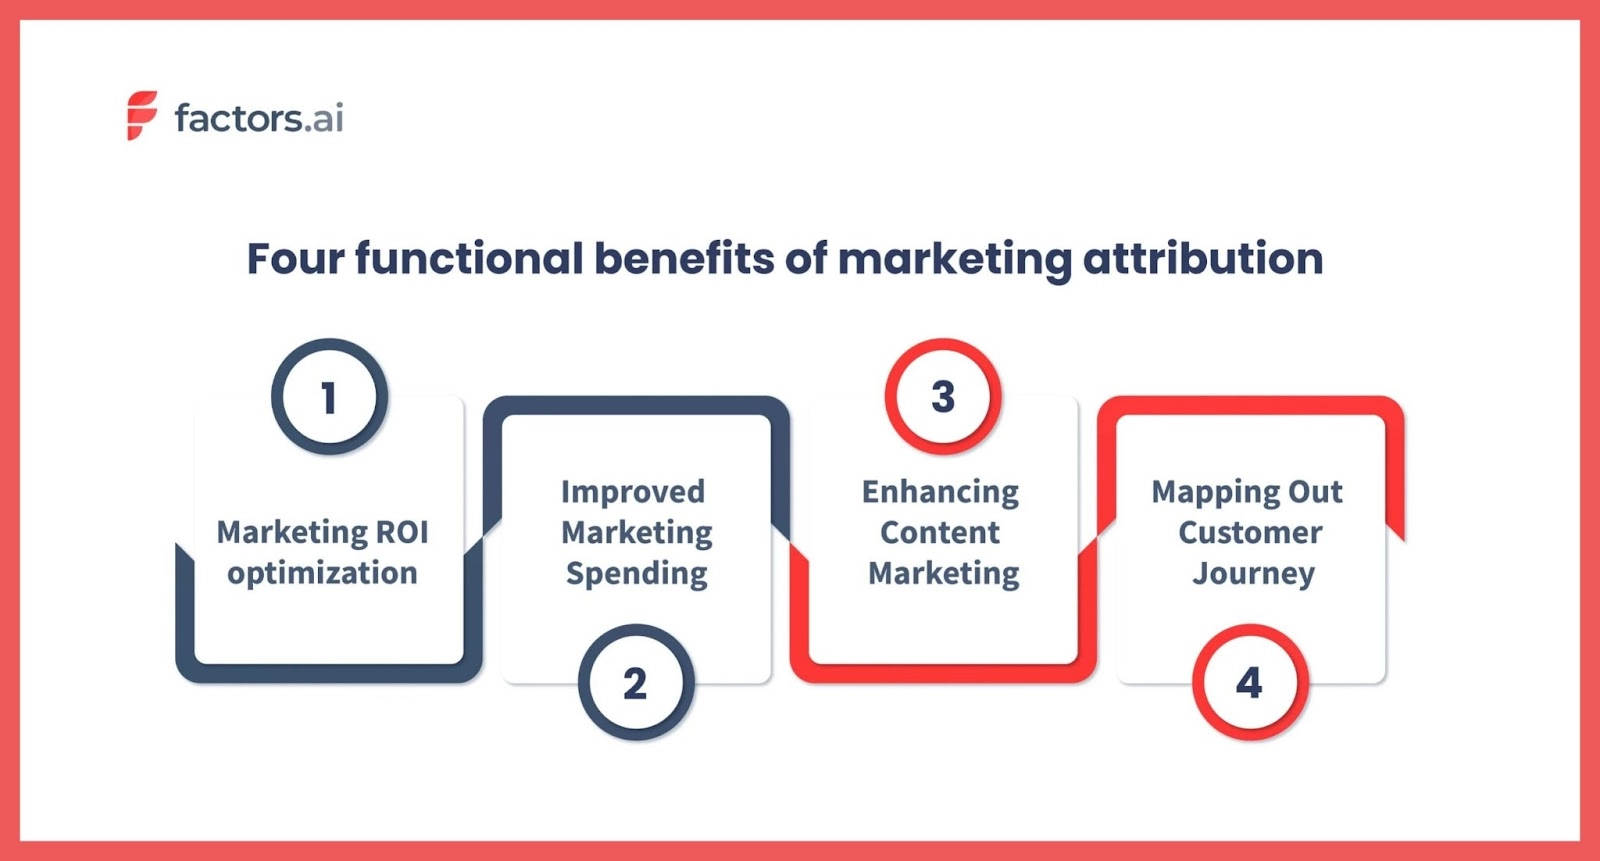
1. Marketing attribution reports
These reports help you understand which marketing channels or touchpoints contribute the most to achieving specific goals like lead generation or customer acquisition. By accurately attributing success to different initiatives, you can allocate resources more effectively and optimize strategies based on performance.
Suppose your marketing attribution report shows that LinkedIn advertising has consistently generated a high number of qualified leads at a low cost per acquisition (CPA). In that case, you may want to increase your ad budget for LinkedIn while reducing spend on lower-performing channels.
2. Campaign performance reports
Campaign performance reports are vital for measuring the effectiveness of individual marketing campaigns and initiatives such as email series, content promotions, or product launches. These reports typically include metrics like click-through rates (CTR), conversion rates, return on investment (ROI), and customer feedback.
For instance, if you recently launched a webinar series targeting C-level executives in the FinTech industry, your campaign performance report could assess registration numbers, attendee engagement levels, post-webinar survey responses, and any subsequent sales pipeline growth attributed to this initiative.
3. Content marketing reports
Content marketing is often an integral part of B2B SaaS companies' overall strategy. Monitoring the effectiveness of your content assets can provide valuable insights into what resonates with your target audience and drives desired outcomes such as increased website traffic or lead generation.
A comprehensive content marketing report may track metrics such as page views, time spent on a page, bounce rate, or social media shares for individual blog posts or e-books. Additionally, assessing how specific pieces of content impact broader business outcomes like trial sign-ups or revenue growth can further refine your understanding of your content's value.
When it comes to streamlining your marketing reporting process and gaining valuable insights, leveraging a powerful tool like Factors can be a game-changer. Factors’ comprehensive analytics platform offers an efficient way to generate marketing attribution, campaign performance, and content marketing reports, allowing you to make data-driven decisions that drive business growth in the B2B SaaS space.
Unlock the power of data-driven decision-making with stellar marketing reports
The modern data-driven world presents a double-edged sword for SaaS marketing teams. On one hand, it offers access to an abundance of data to inform strategies and drive growth. On the other, it poses the risk of overwhelming marketers, leading to valuable data being left unused.
To unlock the full potential of your data, you need to craft tailored, insightful, and actionable reports that address your unique business needs and objectives. Central to the process of marketing reporting are reporting and analytics tools that streamline and enhance your reporting efforts.
Enter Factors. Factors is an advanced B2B account analytics, attribution, and account intelligence platform that aims to help businesses drive more pipeline with less spend. By revealing anonymous companies visiting the website, decoding customer journeys, and providing valuable insights, Factors gives companies the data they need to make the right decisions and optimize their marketing strategies.
Don't let valuable insights slip through the cracks. Embrace data-driven decision-making and upgrade your B2B SaaS marketing game with powerful marketing reporting today.
Effective SaaS marketing reporting is essential for driving growth and extracting actionable insights. The article "SaaS Marketing Reporting Done Right: 5 Tips for Extracting Actionable Insights from Your Reports" from Factors.ai offers key strategies to improve reporting processes:
1. Define Clear Objectives: Set a primary goal for the report, whether it's tracking lead generation, evaluating campaign performance, or content effectiveness.
2. Understand Your Audience: Tailor reports to the audience's needs, providing high-level overviews for executives and detailed metrics for marketing teams.
3. Select Relevant Metrics: Focus on metrics that directly impact decision-making and avoid vanity metrics.
4. Enhance Visualizations: Use visual elements like charts and graphs to simplify complex data and highlight trends.
5. Utilize Advanced Analytics Tools: Leverage platforms like Factors.ai for multi-touch attribution, intent capture, and workflow automation to streamline reporting.
These strategies help SaaS companies transform reports into valuable tools for strategic planning and performance optimization.
FAQs
To further enhance your understanding of marketing reporting in the B2B SaaS context, here are some frequently asked questions with concise answers:
1. What are the main components of a marketing report?
A typical marketing report may include:
- An executive summary highlighting key findings and insights
- Data visualizations like charts, graphs, or tables for clear presentation of the conversion rates, traffic, session data, and leads and revenue generated
- Analysis of performance/results aligned with business objectives
- Actionable insights and recommendations for optimization or improvements
- Appendices with raw data or supplementary information as needed
2. How do you run a marketing report?
To create an effective marketing report, follow these steps:
- Set clear objectives and goals for the report
- Determine which metrics are most relevant to your campaign or initiative
- Collect data from various channels (e.g., Factors, Google Analytics, CRM, social media platforms)
- Analyze the data within the context of your goals and industry landscape
- Present findings through clear visualizations and concise narratives
- Include actionable insights that guide decision-making or strategy adjustments
3. What is the objective of marketing reporting?
The primary goal of marketing reporting is to give in-depth insights into the performance of different campaigns or projects. It helps make decisions based on data by providing actionable suggestions for optimization or enhancement.
Marketing efforts are aligned with wider business goals in these reports. They can help discover growth opportunities and improve overall efficiency. This leads to achieving desired results such as generating leads or acquiring customers in B2B SaaS companies.

See how Factors can 2x your ROI
Boost your LinkedIn ROI in no time using data-driven insights
Try AdPilot Today


.avif)

.avif)
See Factors in action.
Schedule a personalized demo or sign up to get started for free
LinkedIn Marketing Partner
GDPR & SOC2 Type II

.svg)


.avif)


.avif)