
Routines - Scheduled Tasks in Factors.ai
Write what you want in plain English, once. Routines runs it on your schedule and delivers it to Slack, email, or your own systems via API. And when a campaign crosses a line you set, it can flag it or pause it for you.
.jpg)
Reporting is still the most manual part of GTM.
.avif)
In a recent webinar poll, reporting topped the list of sales marketers’ most vexing tasks of the year. Performance reports, content and campaign analysis, and pipeline and funnel attribution. The same work, every week.
Today that means stitching data across sources, remembering exactly which filters to apply, logging in, downloading, formatting, and sharing.
Campaign monitoring is worse. Overperforming and underperforming campaigns get caught days late, because someone has to remember to go look.
Routines takes both jobs off the calendar. The report arrives whether or not anyone remembered it, and the alert fires the moment the number moves.
Every routine is either a report or an alert.
Pick the one that matches the job: something you always want to see, or something you only want to hear about when it breaks.

Reports deliver on schedule
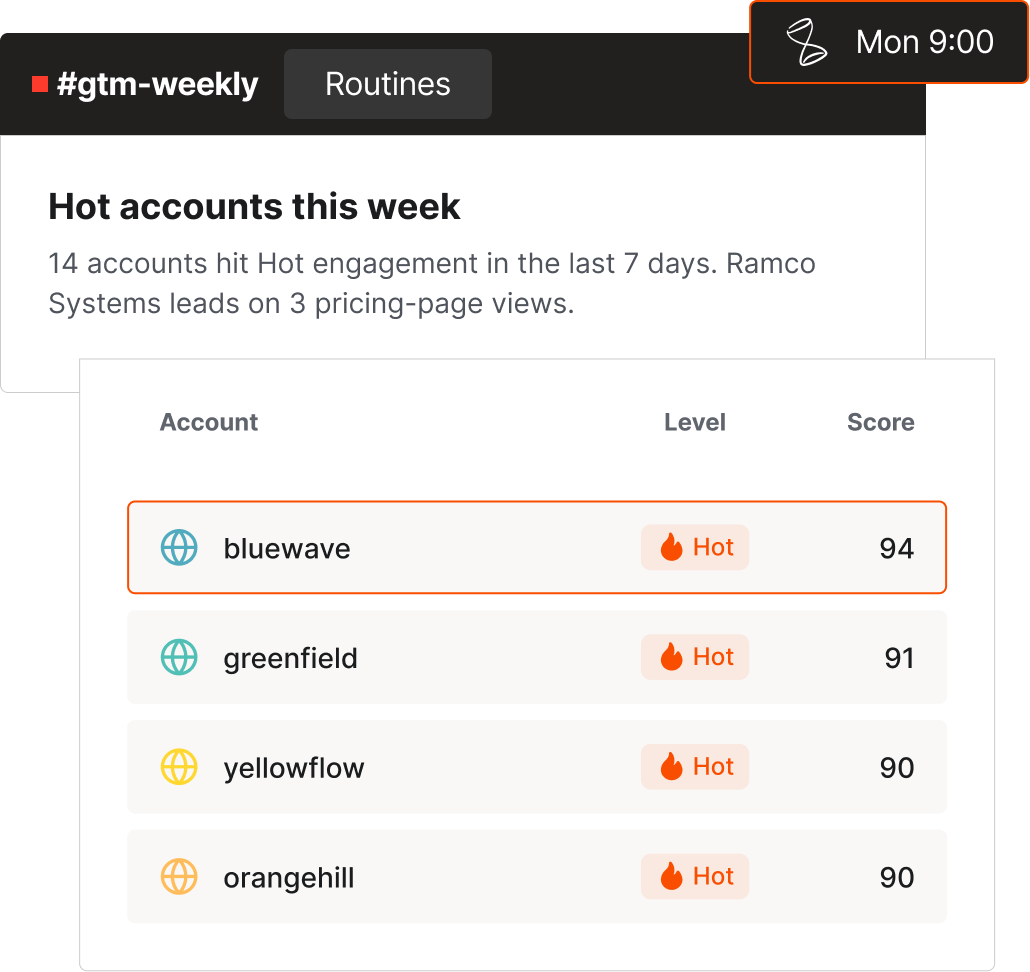
Written once, delivered forever. A weekly engagement leaderboard, a pricing-page visitors digest, new pipeline created last week, LinkedIn performance week over week.
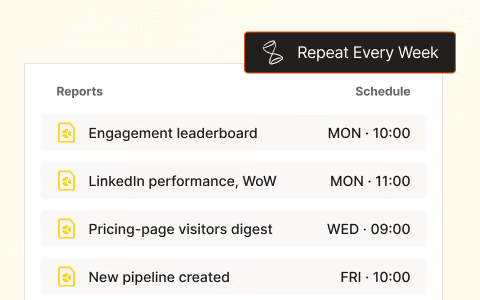
Fires on its schedule, every time.

Alerts stay silent until something breaches
Cost per lead spikes over 25%. Daily spend deviates 40% from its trailing average. Brand impression share drops below 90%. Nothing breached means nothing sent.
.avif)
One notification, on the day it mattered.

Three things to decide, then it runs itself
Write the instruction
Plain English, as prescriptive as you'd be with a new analyst. Name the segment, the metrics, the columns, and how you want it sorted.
Set the schedule and channel
Daily, weekly, or monthly, and where it lands: a Slack channel, an inbox, or your own stack over the API. This lives in the setup, not the instruction.
Read what arrives
Reports show up on time. Alerts show up only when the condition is met. Both render as formatted tables and summaries, not raw text.
Routines you can paste in today
Every one of these works on day one for any Factors project. Anything in [brackets] is a placeholder. Swap in your own segment, page, or form name. Most run fine on defaults.
Report
Top website-visiting accounts
Identify the top 10 accounts that visited our website in the last 7 days, ranked by Total Sessions. For each account include company name, domain, Total Sessions, Engagement Score, and lifecycle stage. Then for each account list the known contacts at that company with contact name, email, and job title where available. After ranking by sessions, enrich each domain's engagement score and lifecycle via account journey before reporting. If an account has no known contacts, say so explicitly rather than dropping the account. Only report. Do not change anything.
Report
Hot accounts this week
List every account whose Engagement Level is Hot based on activity in the last 7 days. For each, show company name, domain, Engagement Score, Engagement Level, Top Engagement Signals, and lifecycle stage. Lead with a one-line count of how many accounts are Hot, then the table sorted by Engagement Score, highest first. Only report. Do not change anything.
Report
Pricing page visitors
List all accounts that viewed our pricing page in the last 7 days. For each include company name, domain, number of pricing-page views, Total Sessions, Engagement Score, and lifecycle stage. Sort by pricing-page views, highest first. For the top 5, list the top 10 known contacts with name, email, and job title where available. Only report. Do not change anything.
Report
Form submissions digest
List every account that submitted one of our forms in the last 7 days. For each include company name, domain, which form was submitted, the contact name and email where known, Engagement Score, and lifecycle stage. Lead with a one-line total, then a table. Only report. Do not change anything.
Report
Net-new companies not yet in CRM
List companies that visited our website in the last 7 days that do not yet have a lifecycle stage in our CRM, meaning they are not yet tracked as records. For each show company name, domain, Total Sessions, the pages viewed, and Engagement Score. Lead with a one-line count of net-new companies, then a table sorted by Total Sessions, highest first. Only report. Do not change anything.
Report
Weekly engagement leaderboard
List the top 15 accounts by Engagement Score based on the last 7 days of activity. For each include company name, domain, Engagement Score, Engagement Level, Top Engagement Signals, and lifecycle stage. Present as a ranked table with a one-line headline naming the single most engaged account. Only report. Do not change anything.
Report
New pipeline created last week
List all deals or opportunities created in the last 7 days. For each show the account name, domain, deal stage, deal amount where available, owner, and the associated lifecycle stage. Lead with a one-line total count and total value, then a table sorted by deal amount, highest first. Only report. Do not change anything.
Report
Website-to-form conversion trend
Summarize conversion from website visit to form submission for the last 7 days versus the previous 7 days, broken down by marketing channel. Lead with a headline giving the overall conversion rate and its change versus the prior week, then a table of each channel with both weeks and the percentage change. Only report. Do not change anything.
Report
Weekly in-depth segment digest
From the '[SEGMENT NAME]' segment, list every account with activity in the last 7 days. For each account show its Engagement Score, Engagement Level, Top Engagement Signals with counts, industry, annual revenue, and how recently it was last active. Rank accounts by Engagement Score, highest first. Sort the accounts into three groups based on their Top Engagement Signals: buying signals present (a pricing page visit, a sign-up or trial start, a demo request, or repeated views of high-intent product or migration content); high engagement with no buying signal yet; and LinkedIn-only, where the sole signal this period is LinkedIn ad engagement. For the top 3 accounts by Engagement Score, also pull the last 30 days of journey: the last 3 pages or pieces of content viewed, and the known contacts with name, email, job title and a short note on what each did. If an account has no known contacts, say so explicitly. Open with a one-paragraph summary covering how many accounts are in scope, how many are Hot, and which account leads the week. Then add a Notable stories section of two to four sentences on each of the three most sales-actionable accounts. Then show the three grouped tables.
Report
Negative keyword hygiene
For the last 14 days, pull keyword performance by ad group for broad-match and phrase-match keywords, along with the existing negative keyword lists. Recommend per campaign: standard junk negatives to add where the negative list is thin, broad-match keywords that lack phrase or exact variants, and any duplicate or conflicting negatives to resolve. Present as a digest grouped by campaign, listing the recommended negatives in a table the team can review before applying. Only report and recommend. Do not add or remove any keyword.
Report
ICP traffic quality by paid campaign
Create a KPI report on LinkedIn paid clicks, broken down by company name and company domain (only where company name is known) in the last 180 days. Then find me accounts in the '[SEGMENT NAME]' segment. Using both reports, calculate what percentage of accounts in that segment are attributable to each individual campaign. For example: 30% of accounts come from Campaign A, 20% from Campaign C. Attribution rules: if an account was touched by multiple campaigns, count it toward every campaign it engaged with, so percentages may sum to more than 100%. Use the total number of accounts in the segment as the denominator, and separately report how many segment accounts had zero LinkedIn paid clicks so the unattributed portion is visible.
Report
LinkedIn change log impact report
Look at the last 90 days for LinkedIn account [ACCOUNT ID] and tell me: for every change we made, did it help or hurt? Step 1. Pull the change log for currently active campaigns, campaign groups, and ads. For each change note what was changed with name and ID, the change type (budget, bid, targeting, creative, pause/launch), old value to new value, who made it, and when. If nothing changed, say so and stop. Step 2. For each changed object, take an equal-length window right before the change and compare it to the window from the change until now. Show whether impressions, reach, CPM, clicks, CTR, leads, cost per lead, and influenced pipeline moved in the good direction, using arrows. Step 3. Compare each change against account-wide spend and conversions for the same period and against campaign groups we didn't touch, as a control. Step 4. Mark leads and pipeline as too early to tell if the change is recent, and flag anything with too little data or overlapping changes. Say correlated, never caused. Step 5. Order changes by impact, call out the two or three clearest wins and anything that clearly hurt, and end with a short double down on / revisit section. If the change log can't be pulled, stop and say exactly what's missing. Never make up data.
Report
LinkedIn job title waste breakdown
Analyze all active LinkedIn campaigns for LinkedIn Ads account ID [ACCOUNT ID]. Show the impression breakdown by job title and identify where spend is likely being wasted. For each job title include impressions, clicks, CTR, spend, and conversions if available, whether the title seems relevant or potentially irrelevant, and the reason for flagging it. Flag job titles that have high impressions or spend but low or no engagement or conversions, that appear unlikely to be relevant for a B2B buying audience, or that sit outside our typical ICP personas. Rank the flagged job titles by estimated wasted spend and recommend which should be reviewed or excluded. If the data is insufficient to confidently classify a job title, say so clearly instead of making unsupported assumptions.
Report
Hot accounts this week
List every account whose Engagement Level is Hot based on activity in the last 7 days. For each, show company name, domain, Engagement Score, Engagement Level, Top Engagement Signals, and lifecycle stage. Lead with a one-line count of how many accounts are Hot, then the table sorted by Engagement Score, highest first. Only report. Do not change anything.
Report
Net-new companies not yet in CRM
List companies that visited our website in the last 7 days that do not yet have a lifecycle stage in our CRM, meaning they are not yet tracked as records. For each show company name, domain, Total Sessions, the pages viewed, and Engagement Score. Lead with a one-line count of net-new companies, then a table sorted by Total Sessions, highest first. Only report. Do not change anything.
Report
Weekly engagement leaderboard
List the top 15 accounts by Engagement Score based on the last 7 days of activity. For each include company name, domain, Engagement Score, Engagement Level, Top Engagement Signals, and lifecycle stage. Present as a ranked table with a one-line headline naming the single most engaged account. Only report. Do not change anything.
Report
Target-segment activity snapshot
List every account in the [ICP] segment that was active in the last 7 days. For each show company name, domain, Total Sessions, Engagement Score, Engagement Level, and lifecycle stage. Lead with a one-line count of active accounts, then a table sorted by Engagement Score, highest first. Only report. Do not change anything.
Report
Top account deep-dive
Identify the single most engaged account in the [ICP] segment over the last 7 days by Engagement Score, then pull its full account journey. Summarize that account's recent touchpoints, the channels and pages driving engagement, Top Engagement Signals, known contacts with name and job title, and current lifecycle stage. Present as a short briefing a sales rep could read before a call. Only report. Do not change anything.
Report
ICP traffic quality by paid campaign
Create a KPI report on LinkedIn paid clicks, broken down by company name and company domain (only where company name is known) in the last 180 days. Then find me accounts in the '[SEGMENT NAME]' segment. Using both reports, calculate what percentage of accounts in that segment are attributable to each individual campaign. For example: 30% of accounts come from Campaign A, 20% from Campaign C. Attribution rules: if an account was touched by multiple campaigns, count it toward every campaign it engaged with, so percentages may sum to more than 100%. Use the total number of accounts in the segment as the denominator, and separately report how many segment accounts had zero LinkedIn paid clicks so the unattributed portion is visible.
Alert
LinkedIn spend anomaly alert
Check daily spend for every active LinkedIn campaign over the last 7 days. Only alert if any single campaign's spend yesterday deviated by more than 40 percent, up or down, from its trailing 7-day average. Skip campaigns whose 7-day average spend is below 25 dollars, since the signal is too noisy. If nothing breaches that, do not notify. When alerting, name each affected campaign with yesterday's spend, its trailing average, and the percentage deviation. Only report. Do not change anything.
Alert
Google Ads cost-per-lead spike alert
Check cost per conversion by Google Ads campaign for the last 7 days versus the prior 7 days, looking only at campaigns with at least 500 dollars of spend in the recent week. Only alert if any qualifying campaign's cost per conversion rose by more than 25 percent. If nothing rose that much, do not notify. When alerting, name the affected campaigns and show a table of their spend, conversions, and cost per conversion for both periods with the percentage change. Only report. Do not change anything.
Alert
Google Ads brand defense monitor
Check Search Impression Share and Search Budget Lost Impression Share for our brand and high-priority Google Ads campaigns over the last completed week. Only alert if Search Impression Share drops below 90 percent or Search Budget Lost Impression Share exceeds 5 percent. If neither breaches, do not notify. When alerting, for each affected campaign include the impression share, and split the loss into rank-driven versus budget-driven by reporting Search Rank Lost Impression Share and Search Budget Lost Impression Share, with a one-line read of whether to raise budget or investigate competitor pressure. Only report. Do not change anything.
.avif)

Writing an instruction that lands
Routines does what you ask, so the quality of the output tracks the specificity of the ask.
Four habits that make the difference.
Name the ad account when you have more than one
If several ad accounts are synced on a platform, include the account ID and name so the routine picks the right one. Left generic, it defaults to every connected account on that platform.
Keep schedule out of the instruction
Run cadence and delivery channel belong in the setup. The data window, last 7 days or last 14 days, belongs in the instruction.
Break the ask into reports
Describe it the way you'd literally build it in Factors: one report, then another, then the calculation that joins them. Be prescriptive without adding jargon.
Define your own terms
Spell out attribution rules, thresholds, and anything company-specific rather than assuming it's understood. Say what the denominator is and what counts as a match.
Got questions? We got answers
Can a routine take actions, or only report?
It can act. A routine can pause or resume a campaign, or add and remove keywords, based on the instruction you write. For example: "if a campaign's cost per lead crosses $200 for three consecutive days, pause it and notify me."
Keep a human in the loop on anything that takes an action. Set the routine to send you the recommendation first, approve it yourself, and move to fully autonomous once you have watched it behave over a few cycles.
Where does the output get delivered?
Slack, email, or the API. Slack output renders as real markdown: tables, headers and lists, not a wall of raw text, so a digest is scannable in the channel. The API route lets you pull results into your own workflows.
What data can a routine reach?
Anything in your project: website activity and form submissions, engagement scoring and account journeys, CRM lifecycle and deals, LinkedIn and Google Ads performance, segments, and third-party signals pushed in through the Intent Upload API.
What do paid media routines require?
A connected LinkedIn Ads or Google Ads integration. If more than one ad account is connected on a platform, name the account in the instruction. Otherwise the routine defaults to all connected accounts on that platform.
Bring the digest or alert your team assembles by hand every week. In 30 minutes we will show you the routine that replaces it, running on your own data.
.png)
.png)
Your data is in safe hands. Rest assured, data security and
privacy compliance is a top priority. Factors.ai is SOC 2 type II certified.
We’re also GDPR, CCPA, and PECR compliant.

SOC 2 (TYPE II)SOC 3
SOC 2 (TYPE II)SOC 3

GDPR
Compliant


.svg)



.avif)

are searching for
your product
