

Heading 2
The Complete Guide to Building A SaaS CMO Dashboard
CMO dashboards offer holistic view of customer data related metrics & KPIs. This article shows how CMO dashboards can drive data driven business decisions.
Written by


.svg)


TL;DR
- CMO dashboards offer a holistic view of customer data-related metrics and KPIs through intuitive visualizations.
- The benefits of SaaS companies using CMO dashboards include rapid decision-making, sensible use of time and resources, improved ROI, and unified visibility of marketing performance.
- Before you build a comprehensive CMO dashboard, pay close attention to user-friendly design, use helpful visualizations, integrate platforms to consolidate data, and measure the right metrics/KPIs.
- SaaS businesses must track metrics/KPIs such as conversions, leads, traffic, conversion rates, acquisition cost per channel, retention and churn rates, customer lifetime value, and revenue and pipeline velocity by channel source. A CMO dashboard helps visualize these metrics and KPIs with clarity.
Tracking campaign performance across marketing channels can be a tedious and unintuitive process. CMOs often have to rely on individual department reports to gather a summary of how the team is performing – an endeavor that leaves many gaps and relies heavily on guesswork.
In addition to the time it takes to compile reports, derive actionable insights, and chart next-steps, the traditional way of doing things is prone to several manual errors.
The solution? The perfect CMO dashboard that helps streamline your work based on relevant analytics and metrics under one roof.
This article shows how powerful CMO dashboards can be used to drive data-driven business decisions.
What is a CMO dashboard?
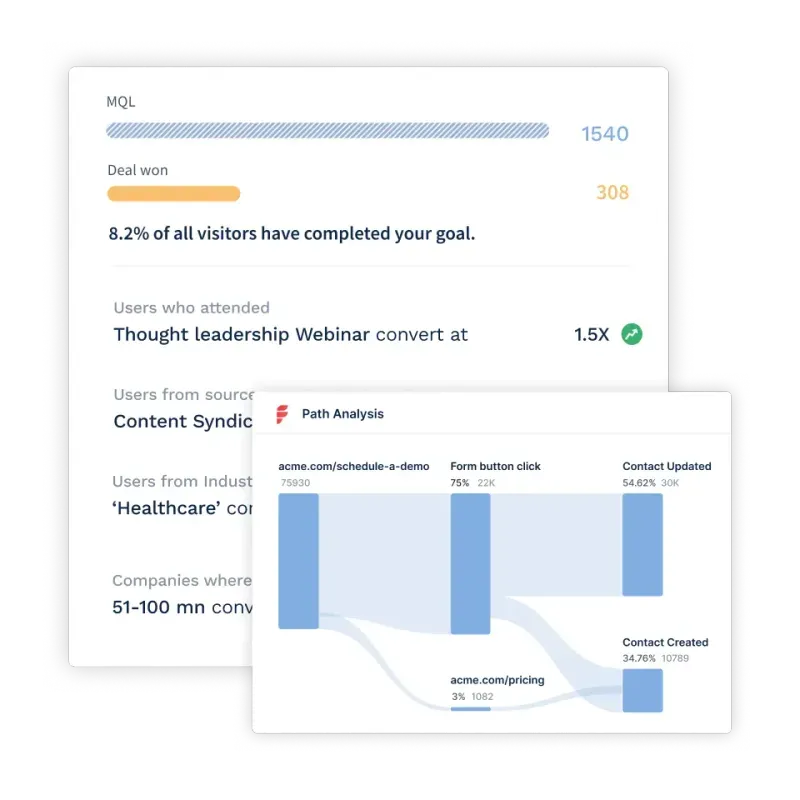
A CMO dashboard is a tool that reports and visualizes KPIs and metrics related to a company's marketing activities across demand gen, content, paid, events, and more. It is a centralized, bird’s eye view that helps marketing executives monitor and analyze marketing initiatives and performance in real-time.
There is no hard and fast rule to building a CMO dashboard for your SaaS company. That being said, there are certain elements that are essential for marketing leaders to identify patterns, track progression, and optimize strategies to drive bottom-line business objectives.
We’ll explore these essential ingredients in later sections of this blog.
Why do CMOs need to use dashboards?
Here’s a look at the top benefits of using a well-designed CMO dashboard:
1. Improves decision-making
When making expensive business decisions, relying on guesswork can cost you heavily. CMO dashboards help marketing leaders make well-informed and accelerated decisions based on data-driven insights.
For example, a CMO dashboard can help you identify which channels and marketing campaigns are not performing if you're making budget-related decisions. It also enables you to identify the reason behind poor campaign performance and the following steps to be taken.
Let's say you have the company blog, paid advertising, and podcasts as key marketing channels. A deep dive into the dashboard will help you uncover how much revenue each channel can generate, the cost of leads from each touchpoint, and how long it typically takes them to convert.
2. Offers a quick overview of data without wasting time and resources
A CMO dashboard lets you save hours of work and wasted resources on collecting and processing raw data from scratch.
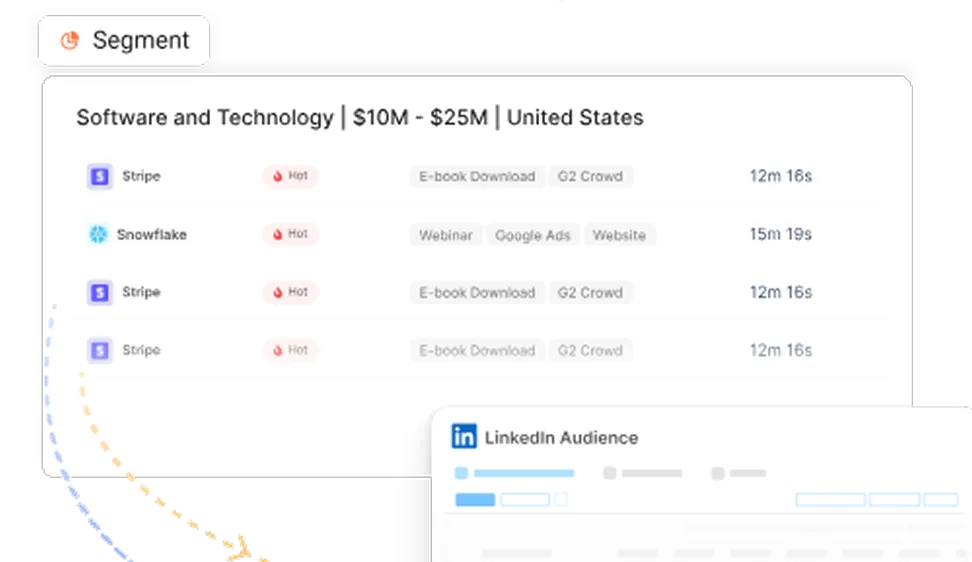
CMO dashboards extract and present an accurate overview of essential data from platforms or sources such as LinkedIn, Facebook, YouTube, articles, Google Ads, and more.
For example, let’s say you’re calculating the number of sessions on your website that come through various channels. A CMO dashboard will gather the data from all the channels, creating an easy visual for you to see which has driven the most sessions.
3. Helps identify trends and patterns
With all the data condensed onto one dashboard, CMOs and their teams can collectively take note of repetitive patterns in their target audience. This helps them further understand which type of campaigns work well on what channel and when leading to the ability to adapt campaign resources on the go.
For example, the company publishes a blog on the website every Tuesday. But they also post a video on LinkedIn on the same day. Over time, a CMO dashboard can display which content formats perform better on Tuesdays, helping the team double down their focus on that channel alone.
{{INLINE_TOFU}}
Key considerations when building a CMO Dashboard
An effective CMO dashboard is the central hub for monitoring marketing performance, aligning teams, and driving data-backed decisions. When designed thoughtfully, it becomes an invaluable strategic asset.
1. Intuitive and action-oriented design
A CMO dashboard is defined by its ease of use and ability to drive decisions. A cluttered, text-heavy layout overwhelms users with data but does not provide enough context to make decisions.
In contrast, a clean, visual interface tells a straightforward performance story that connects insights to actions and helps make data-backed decisions. Here are a few considerations for an insightful dashboard.
Prioritize key metrics

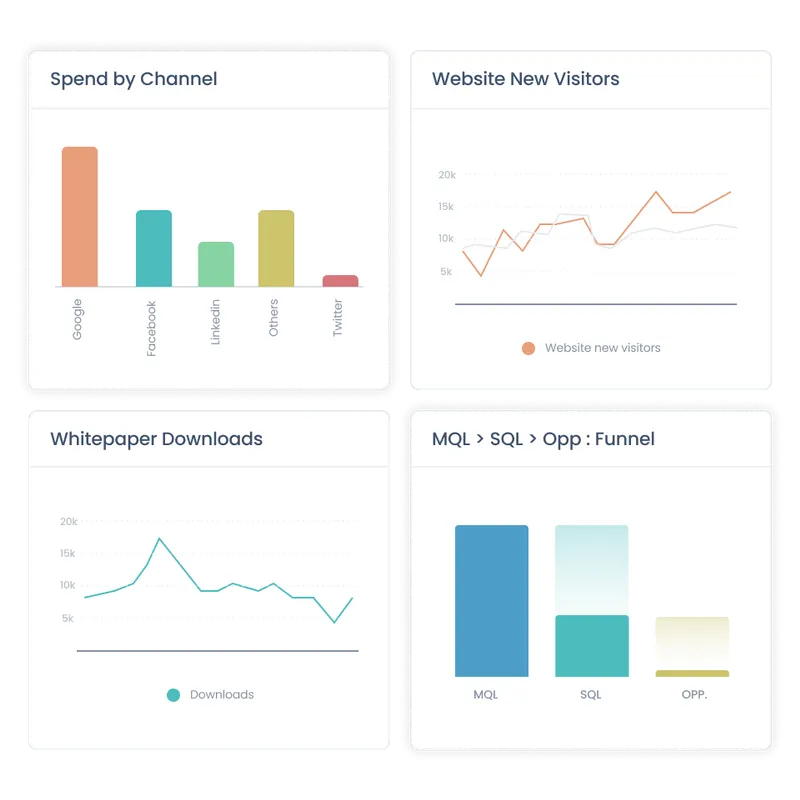
Prioritize the most critical metrics and add impactful visualizations like charts, graphs, gauges, and indicators to showcase them. For instance, use:
- Line charts to display trends over time for metrics like web traffic, conversions, etc.
- Comparison charts or pie charts to show channel effectiveness, campaign ROI, and more
- Funnel visualization to showcase drop-offs across the customer journey
- Alerts and gauges to highlight metrics nearing goals or thresholds
Optimize Information Absorption

Use color coding, alerts, and trends to highlight priority areas at a glance. Make sure that your dashboards have ample white space for better data absorption.
Also, include explanatory captions and annotations to provide essential context.
Offer Intuitive Interactions

Offer intuitive interactions like drill-downs, filtering, and segmenting to customize views on demand. For instance, help users:
- Filter data by categories, campaigns, regions, or date ranges
- Drill down from aggregate metrics to detailed data breakdowns
- Isolate underperforming categories and campaigns
Such flexibility allows slicing and dicing data along different dimensions for deeper analysis.
Streamline Navigation
Create tabs or dropdowns to switch between views, campaigns, time frames, and other dimensions. Optimize compatibility across devices so users can access the dashboard anywhere conveniently.
Most importantly, align terminologies and visualizations to thought processes familiar to users through day-to-day work. Simplicity and intuitiveness accelerate adoption.
2. Unified Data Foundation Across Teams

Marketing cannot drive impact alone. Close alignment across teams provides comprehensive visibility into the end-to-end customer journey.
Break Departmental Silos
Integrate your CMO dashboard tightly with essential systems like CRM, sales analytics, web analytics, finance systems, etc. Automatically sync campaign data, lead status changes, deal progress, and other cross-functional data flows.
For instance, pull web visitor profiles from analytics platforms to enrich lead records. Or, pass lead quality assessment and scoring metrics from marketing to sales for better follow-ups.
Shared Visibility Through Attribution
Compare the performance of marketing-generated vs. sales-generated pipelines on metrics like lead quality, sales cycle times, win rates, and deal sizes.
Conduct multi-touch attribution to understand marketing's influence at each buying stage. Such unified visibility bridges departmental silos with shared goals and metrics, steering coordinated priorities across teams.
3. Flexibility to Highlight Strategic Focus Areas
While cross-functional data consolidation provides tremendous value, a one-size-fits-all dashboard rarely meets specialized business needs fully. You need the dashboard to be customizable and dynamic.
Customizable Templates

Empower users to highlight metrics aligned to their goals—broad awareness or targeted account-based sales—without relying on IT.
Provide pre-built templates for different personas and use cases that showcase industry-specific benchmarks more relevant to their context.
Dynamic Filtering and Segmentation

Offer easy-to-use customization options such as an intuitive template builder interface. Let marketers filter data views dynamically by parameters like region, customer persona, product line, etc.
Such flexibility allows teams to analyze performance through different lenses—whether for the leadership team or campaign managers. As business objectives evolve, custom-tailored dashboards stay focused on what matters most.
4. Ongoing Optimization and Iteration
No dashboard gets designed perfectly right from the beginning. As marketing campaigns and strategies adapt in response to market dynamics, your dashboards also continuously realign to maintain relevance.
User Testing and Feedback Analysis
Monitor usage patterns and user feedback to identify navigation, metric, or visualization enhancements: track clicks, hovers, and other interactions to uncover usability issues. Conduct user surveys and interviews to gather feedback.
Maintain Flexibility
Maintain flexibility for adding new datasets from emerging sources and channels. Continually experiment, test, and optimize to fulfill ever-changing information needs most effectively.
Through an intuitive and action-oriented design backed by an integrated, flexible data foundation, the CMO dashboard becomes a powerful nerve center driving shared visibility, coordinated execution, and data-informed decisions across the business.
CMO Dashboard KPIs and Metrics
A CMO dashboard can include tons of KPIs and metrics depending on what you’re trying to track. However, below are the ones that are of topmost priority:
1. Top-of-the-funnel metrics such as engagement, traffic, leads
Top-of-the-funnel metrics are brand awareness metrics like the engagement rate, traffic, and leads generated. Most SaaS marketing executives track these to attract the target audience and turn them into long-term subscribers.
1. Engagement rates are metrics used to measure and track the active involvement of your target audience for the content you produce. The engagement rate formula is:
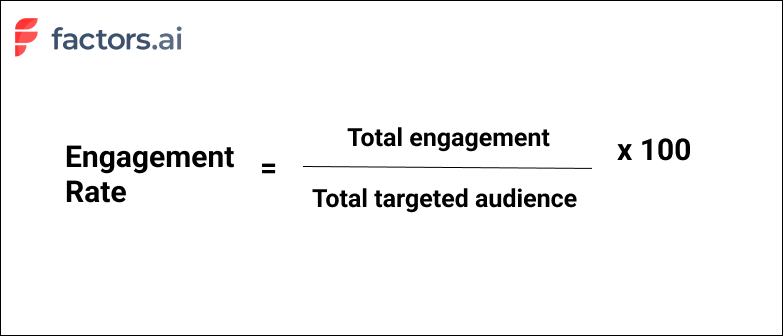
2. Traffic for SaaS companies is the volume or the total number of visitors their website gets over a certain time period.
3. Leads generated is a mandatory sales KPI every SaaS company must track. Measuring leads lets you uncover issues and nurture prospects further.
Why do these metrics matter?
Top-of-the-funnel metrics help measure the overall exposure of the target audience to your marketing efforts. Tracking and measuring them gives insight into what can help minimize roadblocks that stop prospects from signing up.
2. Conversion rates and efficiency
1. Conversion rates: measure the number of targeted users who converted from unknown prospects to engaged contacts. The higher the conversion rate, the more impact your marketing strategies have. The formula to calculate the conversion rate is:
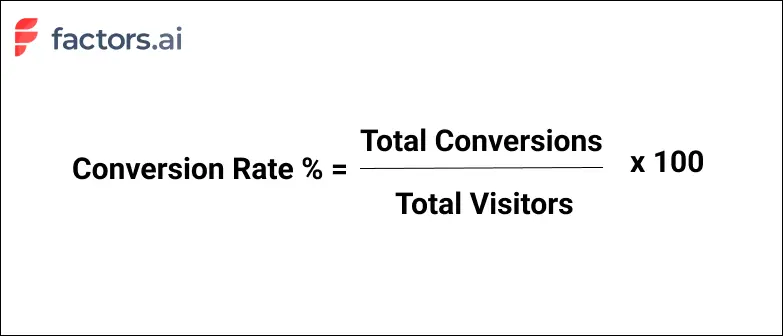
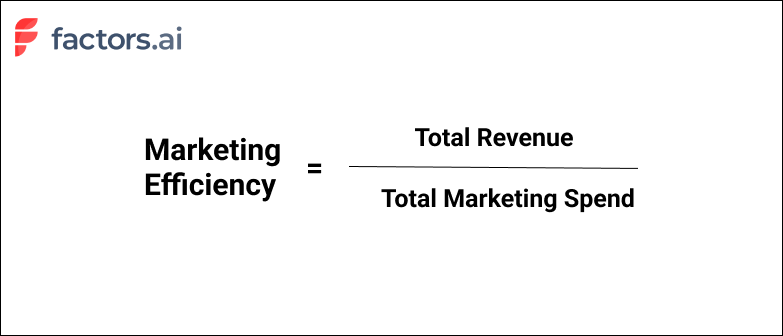
2. Efficiency: In marketing, the ROI measures the overall performance of your marketing efforts, and conversion rates directly indicate the performance. That means increasing conversion rates while reducing acquisition costs promises a better ROI and shows better strategy efficiency. The formula to calculate marketing efficiency is:
Why do these metrics matter?
Conversion rates and efficiency directly reflect how well your SaaS marketing activities are executed and determine the overall effectiveness of your business campaigns.
3. Cost of acquisition by channel
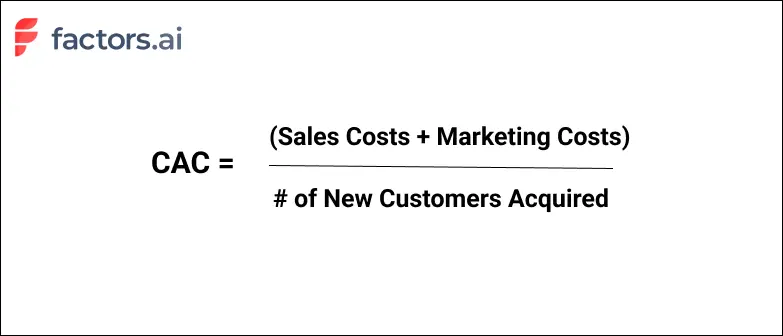
It’s best to track certain KPIs by marketing channels, such as social media, emails, ads, organic search, etc. Calculating the cost of customer acquisition (CAC) for each channel is one such KPI that indicates the marketing expenses spent on obtaining customers.The formula to calculate CAC by channel is:
Why does this metric matter?
Measuring CAC lets you decide whether or not to pursue marketing for a particular channel and demonstrates high-performing marketing channels having low CAC.
4. Retention and churn rates
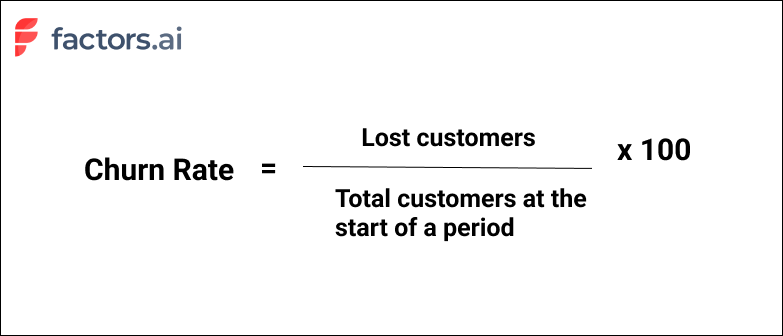
Customer retention and churn rates are opposites that indicate the number of customers retained or lost over a time period. The formula to calculate churn rate is:
Why are these metrics important?
Customer churn and retention rates are one of the most important metrics for SaaS CMOs. Measuring churn rate can help shed light on why subscribers are refusing to renew your service, and based on high or low retention rates, you can decide whether to pursue the same strategies or refresh them.
5. Customer lifetime value
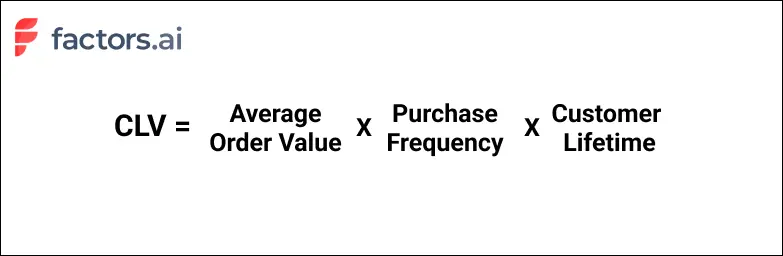
Customer lifetime value, or CLV, indicates the average pay throughout a customer’s relationship with your company. It is a critical SaaS KPI to showcase revenue as it conveys a customer’s worth on average. The formula to calculate CLV is:
Why does this metric matter?
CLV is a critical SaaS business viability measure. It is essential for understanding the business value each customer brings and your SaaS company’s long-term potential.
6. Revenue and pipeline velocity by channel source
1. Revenue by channel source tracked by CMOs indicates how well their ads, campaigns, and other marketing efforts perform based on their source. Additionally, it tells you the aggregate revenue earned from successful conversions from each outlet.
2. Pipeline velocity by channel source is a key KPI indicating the speed at which leads move through your sales pipeline for each channel source.
Why do these metrics matter?
A high pipeline velocity means smoother onboarding processes and better conversions. So tracking this and revenue by channel source over various periods lets you improve conversions from each source.
7. Revenue Growth Percentage
Revenue growth percentage indicates how rapidly total company revenue increases over a set time, typically month-over-month or year-over-year. It shows the overall momentum and health of the business.
The formula to calculate revenue growth is straightforward—take the revenue difference between the current and past periods and divide that by the one-time period revenue.
For example, for year over year revenue growth, use the formula:
((Current Yearly Revenue - Last Year's Yearly Revenue) / Last Year's Yearly Revenue) x 100.
Why does this metric matter?
Monitoring rapid or declining growth % signals how well marketing and sales efforts are faring and hitting targets. When coupled with cost metrics, it also showcases profitability trends. Understanding growth by revenue streams also enables executives to double down on the highest traction channels.
8. Customer Lifetime Value
Customer lifetime value totals the likely earnings a business can generate from customers throughout their tenure. In essence, it conveys an average customer's worth.
The formula factors average order size, purchase frequency in a given period, and the average lifespan.
For instance, CLV may be calculated as: CLV = Average Order Value x Purchase Frequency Per Year x Average Lifespan in Years.
Why does this metric matter?
Tracking CLV over annual cohorts helps spotlight content, features, or channel innovations that make customers stickier. Comparing CLV vs acquisition cost also determines the breakeven period to recover expenses.
9. Cost Per Lead
Cost per lead signifies the average expenditure to generate a qualified marketing lead. It is calculated by dividing total lead gen marketing spend by the number of leads captured.
CPL can be calculated as: Total marketing dollars spent / Number of leads
If you spent $1000 to get 10 customers, that’s 1000/10 = $100 — Your CPL is $100.
Why does this metric matter?
Monitoring CPL trends determines the influence of brand equity on the sales funnel—a strong brand lowers CPL over time.
Comparing CPL by channel also helps optimize spending by identifying the lowest-cost customer acquisition sources. Analyzing CPL alongside customer lifetime value further ascertains profitable activities.
10. Brand Search Volume

Brand search volume measures monthly search queries for your brand name and keywords. Sudden surges or declines show changing consumer interest.
Why does this metric matter?
Tracks brand visibility gains/losses to correlate awareness-building campaigns and events. Guides keyword targeting and content strategies.
Creating Effective CMO Dashboards in Factors AI
Over the course of this article, we’ve covered what a CMO dashboard is, what its benefits are, and a few common metrics for CMOs to track. But constructing a comprehensive CMO dashboard is easier said than done — unless of course, you leverage a tailor-made dashboarding tool like Factors.
Factors unifies and reports data across complex buyer journeys involving multiple stakeholders, touchpoints, and channels under one roof. What does this mean for you? No more individual tools to analyze campaign performance, website engagement, and pipeline/revenue related metrics.
It’s simply all the metrics you care about as CMO in one, intuitive, customizable dashboard. Here are a few nifty features loved by CMOs:
- Ad hoc filters and breakdowns: Slice and dice metrics and KPIs with a wide range of filters and breakdowns to answer questions like: “How does conversion rate vary between companies with at least 200 employees and smaller teams of less than 50?” or “What’s the difference in sales velocity between leads from paid search and organic social?”
- Automated AI-fueled insights: It’s one thing to have your data in one place — but how can CMOs make sense of the numbers? Factors offers automated insights into what’s helping and hurting a specific conversion goal. What’s driving demo form submissions? Our Explain engine may suggest Linkedin campaigns and the pricing page have a positive influence while Display ads and email outreach is limiting performance. This helps the larger team improve resource allocation and drive ROI.
- Custom funnels, KPIs, and properties: Every business has different requirements. This is no different when it comes to reporting and dashboarding needs. Factors supports limitless customizations to KPIs and properties so CMO dashboards can be tailor-made to the what matters most to you.
A SaaS CMO dashboard is a centralized tool that visualizes key marketing metrics, such as conversions, traffic, customer acquisition cost, churn, and pipeline velocity, across channels. It enables CMOs to make data-driven decisions, optimize strategies, and align teams effectively.
Essential Features of a SaaS CMO Dashboard:
- Intuitive Design: Easy-to-use interface that helps users quickly understand performance.
- Integrated Data Sources: Combines data from multiple channels and systems for a comprehensive view.
- Real-time Insights: Provides up-to-the-minute information to make fast, informed decisions.
Enhancing with Factors:
- Automated Data Consolidation: Factors.ai streamlines data collection and reporting.
- Actionable Analytics: Provides insights that drive optimization and increase ROI.
- Improved Operational Efficiency: Reduces manual tasks, allowing marketing teams to focus on strategy and execution.
Curious to see Factors in action? Schedule a personalized demo here!
A SaaS CMO dashboard is a centralized tool that visualizes key marketing metrics—such as conversions, traffic, customer acquisition cost, churn, and pipeline velocity—across channels. It enables CMOs to make data-driven decisions, optimize strategies, and align teams effectively.
Essential Features of a SaaS CMO Dashboard:
- Intuitive Design: Easy-to-use interface that helps users quickly understand performance.
- Integrated Data Sources: Combines data from multiple channels and systems for a comprehensive view.
- Real-time Insights: Provides up-to-the-minute information to make fast, informed decisions.
Enhancing with Factors.ai:
- Automated Data Consolidation: Factors.ai streamlines data collection and reporting.
- Actionable Analytics: Provides insights that drive optimization and increase ROI.
- Improved Operational Efficiency: Reduces manual tasks, allowing marketing teams to focus on strategy and execution.

See how Factors can 2x your ROI
Boost your LinkedIn ROI in no time using data-driven insights
Try AdPilot Today


.avif)


.avif)
See Factors in action.
Schedule a personalized demo or sign up to get started for free
LinkedIn Marketing Partner
GDPR & SOC2 Type II

.svg)


.png)


.avif)