.svg)

.webp)
Build Vs. Buy for B2B Marketing Analytics (Part 2)
The following is the second half of a two-part series about the factors involved in building and buying a B2B marketing analytics and attribution solution. This post deals with the cost and time requirements for an in-house and an off-the-shelf solution. It also compares the opportunity costs of building and buying a solution.
Be sure to check out part one which talks about the need for a B2B marketing analytics and revenue attribution solution. Along with a breakdown of the technical requirements for each solution.
Costs Involved
This segment is an overview of the costs involved in building an in-house B2B marketing analytics and revenue attribution solution. While there are certainly other costs involves, we cover 5 of the most prominent ones:
· Cost of ETL
· Cost of Data Warehousing
· Cost of Data Processing
· Cost of Data Visualization
· Cost of Staff
Cost of ETL
Extract, Transform and Load (ETL). Extracting structured or unstructured data from a source — this could be data from your CRM or Google Ads. Transforming includes processes like cleaning, duplication, sorting, etc. and ensuring data integrity and compatibility. Loading involves placing all of the transformed data into a data repository or a data warehouse. The data could be either loaded completely or at predetermined intervals.
This is the cost of maintaining a data pipeline. While it is possible for your engineering team to set up a data pipeline, some companies find it cost effective to use an ETL tool. These tools include tools such as Hevo, Fivetran, Google Dataflow, Pentaho, etc.
Fivetran, foe example, lists a range of pricing tiers. The starter tier’s price (which is for a small team’s data stack or the bare minimum for an in-house solution), would depend on the number of rows you update. This will range anywhere from 2 million total rows at a monthly estimated fee of $120, to 500 million total rows at an estimated $4,628 per month.
Cost of Data Warehousing
In the previous blog we talked about the need for a data warehouse from an analytics perspective. We discussed why relying on application databases is not scalable. While you could invest in a local data warehouse, there are a multitude of benefits to investing in a cloud data warehouse. Ultimately, this will prove to be convenient when building an in-house solution. Scaling operations would be expensive as it requires more ram (and in all likelihood, a dedicated database manager). That being said, cloud-based data warehouses like Google Cloud Storage, AWS Redshift, Microsoft Azure, and Snowflake fit the bill.
Cloud data warehouse storage prices vary depending on a range of factors. Google Cloud Storage, for example, has options varying in region and class — the class of storage, standard, nearline, coldline, and archive is determined by the frequency of access to the storage. In the region of US-central Iowa, at the standard class, warehousing will run you about $0.020 per GB per month.
Cost of Data Processing
Most cloud-based data warehouse services also include processing data. This is the cost to process SQL queries, scripts, functions, and more. This is in addition to the cost of loading data that you are processing in storage. Processing data is usually handled by a database management system like Bigquery, AWS Redshift, Oracle, Singlestore, etc. These services offer Cloud database as a service.
The cost involved in the pricing of these services includes the use of vCPU, Memory and cloud storage. Singlestore, for example, on its standard plan has a starting price of $0.65 per hour and will increase depending on the number of vCPUs and memory used. A vCPU of 16 and 128GB of memory will cost you $3,796 per month.
Cost of Data Visualization
In the previous blog, we talked about the presentation of your reports to your end-user. This requires a data visualization tool. A skilled engineer could purchase data visualization libraries and build them out. But for the sake of time, a lot of businesses resort to data visualization tools like Tableau, Looker, and PowerBI.
A data visualization tool like Tableau will cost you $70 per month per license.
Cost of Staff
Staff will, by far, be your most expensive costs. To build a marketing analytics and attribution in-house solution, you would at the very least require a small team of 3 full time data engineers and 1 data scientist. You will require experts with experience across programming language and ETL. In the US, the break down is as follows: on average a data engineer’s CTC is $116,772 per annum, along with a $5,000 cash bonus and other non-cash benefits as of 2022. The average CTC of a data scientist in the US will cost $102,865 as of 2022. (Indeed.com). These costs will have to be multiplied by the number of data engineers and scientists hired.
In terms of cost an off-the-shelf solution like Factor.ai will as of this date cost you $1,188 per annum on the starter plan which includes web analytics, multi-touch attribution, funnel mapping, Metric reports and more. Their growth plan on the other hand will cost you $5,988 an AI powered “Explain feature”, automated weekly insights and a dedicated customer success manager
Time
To build a fully operational in-house B2B marketing analytics and revenue attribution solution, with a team of 3 full time data engineers and 1 data scientist will take anywhere between 9 to 12 months.
An off-the-shelf solution like Factors.ai can be set-up in minutes. It requires no professional services for onboarding either.
So...Build or Buy?
Now, we're all caught up about the resources required to build an in-house B2B marketing analytics and attribution solution, as well as what to expect from an off-the-shelf solution. So should you build or buy? This section runs through the opportunity cost of building and buying. Essentially, what are you missing out by choosing whether to build or buy.
Opportunity Cost of Building:
By choosing to build an in-house solution you forgo the benefit of:
· The cost savings earned from buying a solution
· The time saved from not having to set up an in-house solution
· No-code integrations and developer dependency
· Maintenance and innovations handled by the service
· Using an advanced SDK, and not having to optimize SDK
· Data cleansing handled by the service
· Data visualization within the same product
· Unified Dashboard
Opportunity Cost of Buying:
By purchasing an off-the-shelf solution you incur the following opportunity costs:
· Product may not fulfill very unique analytics aspects of your business
· Product may not deliver on their promises
· Certain products may not fulfill your data privacy requirements (learn more)
· If a vendor liquidates or gets acquired, you cannot ensure data ownership and continuity of business
In Conclusion…
The most important point to take away from this is that when you build an in-house solution, you would have to weigh the risk of doing so. The average tenure of a CMO is about 40 months. Would they prefer to spend the first 9 to 12 months of their tenure waiting on a solution that isn’t proven to meet their need, or have a solution that is up and running within a week for a fraction of the cost of building one?
In my opinion there is too little to gain and a lot to lose when buying. Most of the opportunity costs of buying could be avoided with modern solutions like Factors.ai. Where custom plans can be built to fulfill your business’s unique needs. A demo of the product can be requested to ensure if the product delivers on its promise. Factors.ai uses first party cookies and is GDPR, CCPA, PECR and SOC2 compliant. And Factors.ai can send their client’s data to their Bigquery instance on demand giving full data ownership to the client.
Still on the fence? Book a demo with Factors.ai now.
The B2B Sales Funnel Unveiled: Insights & Best Practices
Understanding the B2B Sales Funnel
When it comes to B2B marketing, qualifying your sales leads is not an easy job. Given the several steps involved in a B2B customer journey, visualizing each one as a funnel can be insightful (and actionable). It identifies what’s helping and hurting conversion rates along a prospect’s journey to becoming a customer. Which in turn, helps optimize the journey and improve conversion rates.
What is a B2B Sales Funnel?
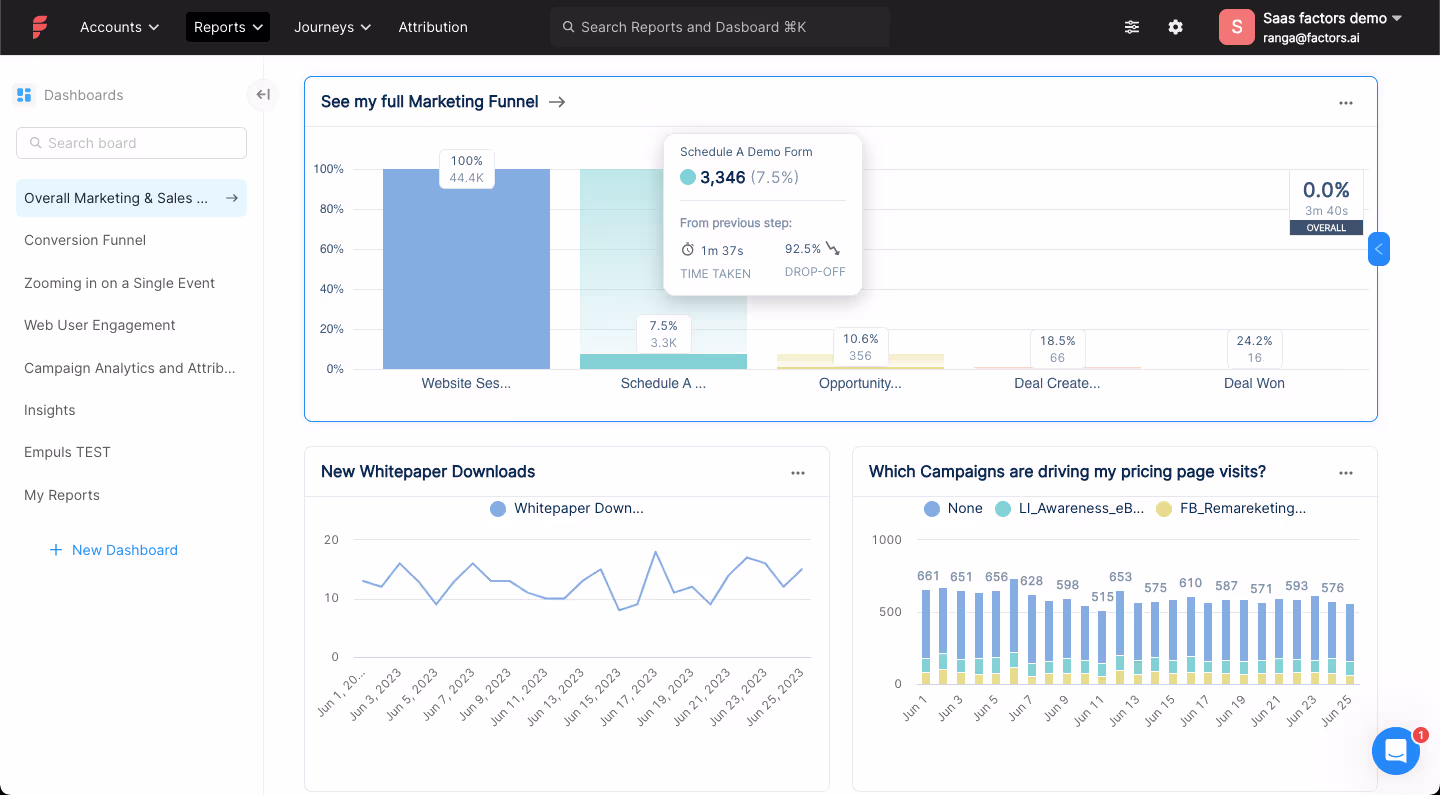
A B2B sales funnel is a visual model that illustrates a prospect’s journey. The funnel graphically represents the proportion of prospects present in all stages. It can also represent customer engagement and break down each interaction from first-touch to deal-won. Here’s why a B2B funnel differs from a B2C funnel:
* Unlike in B2C, a B2B prospect is composed of several decision-makers who would have to greenlight an investment.
* The sales cycle in B2B is considerably longer than a B2C one. This is not only because of the layers of approval required but also the meticulous research, review, and demos, and larger contract values.
* In a B2B endeavor, customer retention and the need to build a long-term relationship with clients are critical for long term success. Hence, brand building is placed on a pedestal for B2B customer engagement.
Breaking Down the Stages of the Funnel
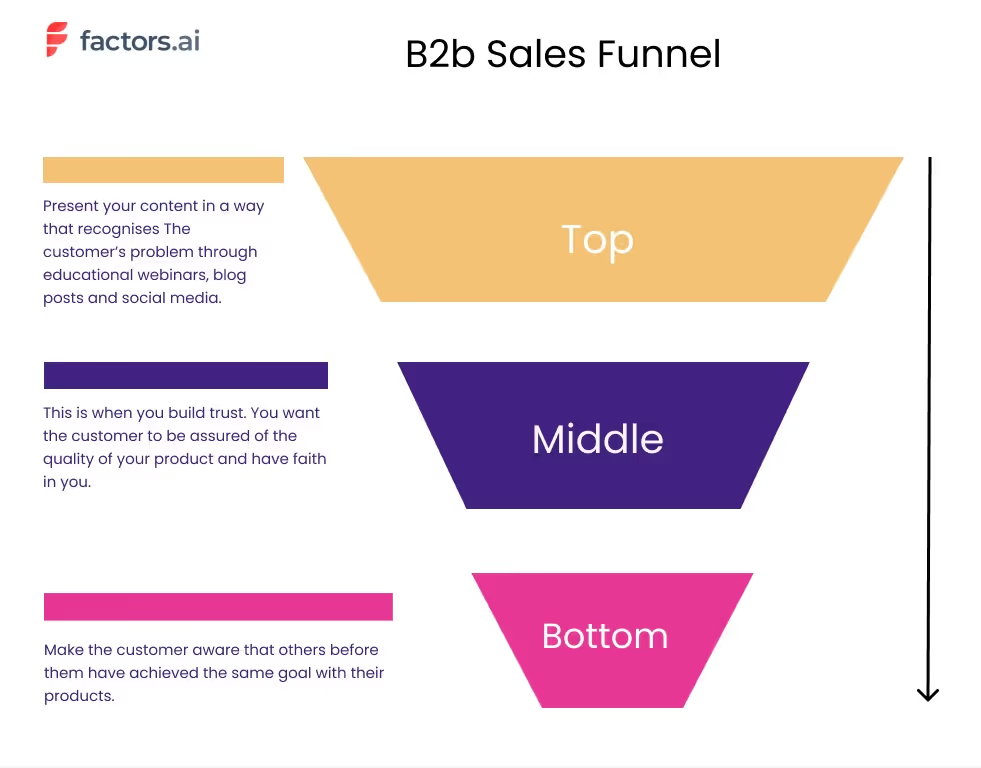
Several terms exist for the different stages of the funnels. Functionally, however, most of them are relatively synonyms. For the sake of simplicity, a B2B sales funnel can be divided into 3 levels:
1. Top of Funnel (ToFu)
2. Middle of Funnel (MoFu)
3. Bottom of Funnel (BoFu)
Picture of funnel broken in three parts; top middle bottom. On the left of the funnel write down what is buyer intent?
On the right side of the funnel; list down the marketing efforts commonly used at that stage; like top stage is content marketing and blogs.
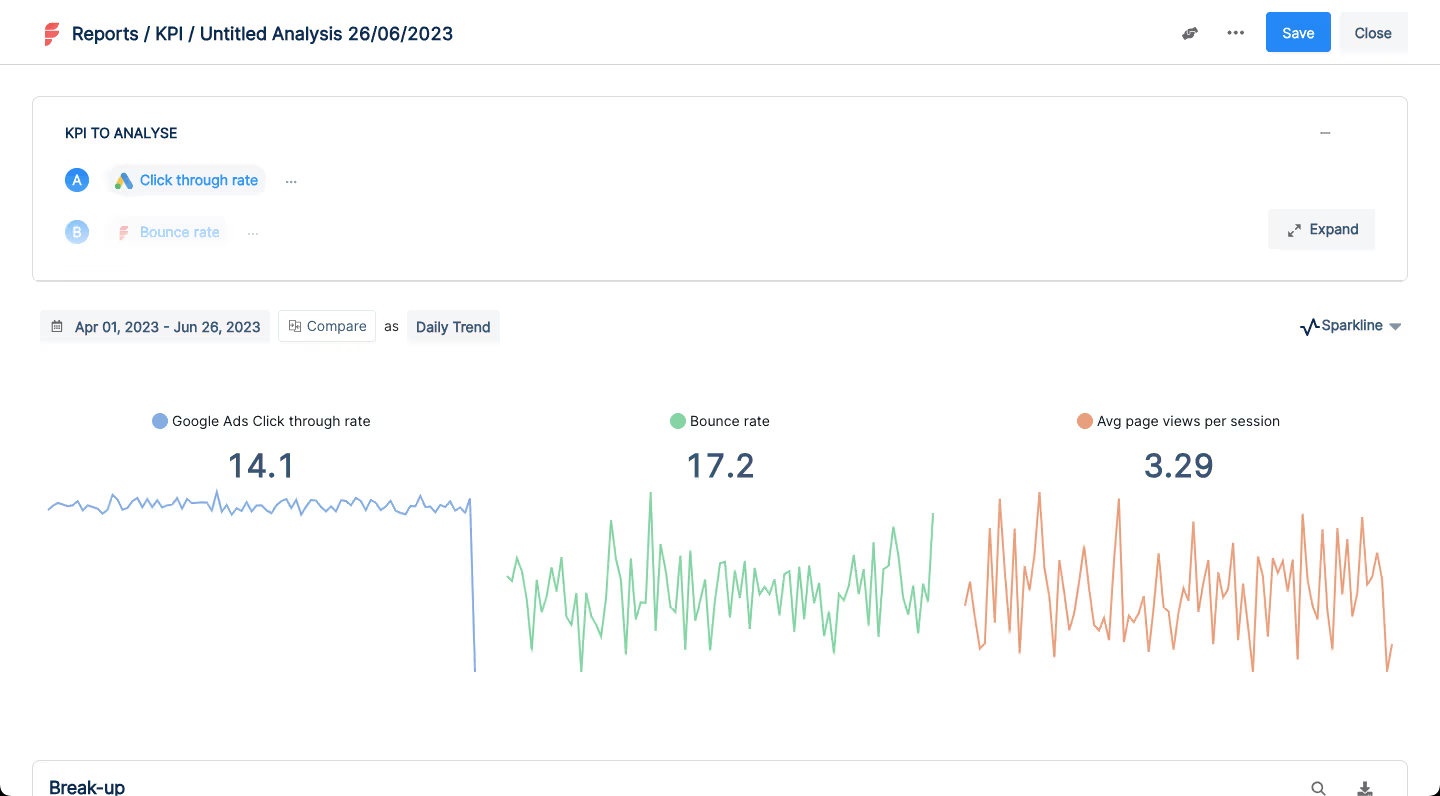
When guiding your users through the funnel, there are several you can use to assess whether you’re doing it successfully. These metrics can help you evaluate past performance, predict future trends and optimize your current efforts. Some of these are click- through- rate, conversion, content shares and SEO metrics. Analytics software like Factors and Google Analytics can be used according to your campaign goals, content channels and campaigns.
Top of sales funnel
The top of funnel level deals with the awareness and interest stage in a prospect’s journey. The objective of this stage is to consistently bring in fresh, new traffic. At this stage, prospects may not be entirely aware of the problem you’re solving. From a B2B standpoint, this not only involves your advertising, but is heavily centered around content marketing, educational content creation, & building a strong organic presence.
B2B prospects commonly require significant nurturing before going further down the funnel. For example, a company like Salesforce revolves their content strategy around CRM among other things educating prospects on all things CRM related and more.
Common top-of-the-funnel marketing touchpoints include:
- Blogs
- Podcasts
- E-Books
- Webinars
And key top-of-the-funnel metrics to track include:
- Number of site visits
- Web session duration
- Bounce rate
- Keyword rankings
- CTR
- Mail open rate
Middle of Sales Funnel
"This level of the funnel corresponds with the engagement stage of a prospect’s journey. After creating awareness and defining the problem, prospects would now evaluate their solutions. At this stage, you would need to build your brand authority and elucidate how your solution is the superior option." - says Milosz Krasinski, Managing Director at Chilli Fruit Web Consulting.
The approach to marketing changes at this level. Here, content becomes increasingly brand-oriented and employs lead magnets or gated content to bolster your brand authority. This can also be ensured by hosting webinars, events, and live-demos. MoFu blogs also tend to be more product heavy as opposed to industry-specific.
Common middle-of-the-funnel touchpoints include:
- Comparison articles
- Retargeted ads
- Product reviews
- Trial sign-ups
Bottom of Sales Funnel
Not to be confused with the expression “being at the bottom of the barrel”. The bottom of the funnel is a crucial stage in the buyer’s journey. It’s where you would ultimately want to guide all your prospects towards. It is known as the conversion stage because at this stage prospects make a purchasing decision and possibly convert into customers.
It must be noted that bottom of funnel prospects can vary depending on your conversion goal. It could even include prospects that sign up for a demo, make an account, mail a product query, or anything that expresses high engagement with the brand or product. Based on historical trends, you could identify which conversion goal is conducive to a prospect becoming an MQL, an SAL, or an SQL.
At this level, the sales team starts to get involved. It’s the combined effort of sales and marketing that ultimately onboard customers through promotional offers and strategies. Considering the B2B sales cycle, this is still a long, arduous process. The bottom of the funnel also helps form the ideal client profile which serves in identifying target accounts with ABM (account-based marketing).
How to Guide Users through the Sales Funnel
The core objective of the funnel is to help guide potential B2B customers through the process, without spending too much or overdoing it and driving them away from making a purchase. However, once you have identified what stage your customers are at- what next? It is important to take advantage of this new information to adapt your content to target your customers better.
Along each stage of the sales funnel, content must be curated to drive up customer engagement. And the type of content that customers expect differs at different stages of the funnel. Let’s look at how buyer intent differs across the three stages of the funnel:
1. Top of the funnel: The customer has arrived at your ad because there is a problem that they are facing. Present your content in a way that recognises their problem through educational webinars, blog posts and social media.
2. Middle of the funnel: Remember that at this point, your customer is still looking for a solution. This is when you build trust through content marketing campaigns, blog posts. You want them to be assured of the quality of your product and have faith in you.
3. Bottom of the funnel: In this last stage, make them aware that others before them have achieved the same goal with their products. Use testimonials, product USPs and case studies to drive your point home.
Flipping the Funnel: An Alternate Way
Instead of using the conventional B2B funnel, Binnet and Field suggest flipping the funnel. This means to think of the funnel as ‘in market’ and ‘out market’ buyers. Instead of looking at your B2B customer journey as a funnel that has a narrower customer base at each stage, focus on different aspects like ‘activation’ or ‘branding’ at the in market and out market stages respectively. Find out more about this alternate perspective here.
In Conclusion…
The stages of a B2B marketing funnel are diverse. Each stage adopts different types of content strategy, tactics, interactions, and analytics. This makes it all the more essential to compartmentalize efforts into an organized funnel, making the process disciplined.
The funnel not only keeps track of your prospects at each level but also identifies different pain points that limit prospects from moving down the funnel. Measuring your funnel helps distinguish your leads better too, which can be quite useful given that 79% of MQL are never converted to sales.
From a B2B angle, the funnel highlights the importance of efforts like SEO, building domain authority for TOFU and long-form product heavy blogs for MOFU, etc. Given the nature of B2B prospects, all these factors contribute to the movement down the funnel.

How to do B2B account scoring
The following blog is an overview of account scoring. It goes over the basic steps in creating a scoring scheme as well as the various functions of an ICP (Ideal Client Profile). It also distinguishes account scoring from ABM (Account-Based Marketing) and assesses how lead scoring and account scoring deal with different B2B clients.
Catch our previous piece on lead scoring models explained here!
What is account scoring, and how is it different from account based marketing?
You might have heard that account scoring is somewhat analogous to ABM (Account-Based Marketing). This isn’t far from the truth. Think of account scoring more as a means to improving ABM. In that sense, they are consubstantial. ABM is a broader approach to marketing that targets key accounts or accounts that are most likely to convert and generate the most revenue. This is based on using an ICP (Ideal Client Profiles) which states the attributes of those target accounts. ABM also deals with compartmentalizing those key accounts, designing the method of engagement, and collaborating with other departments.
Meanwhile, account scoring is a method of ranking and sorting your target accounts based on a scoring scheme. Just like in ABM, account scoring uses an ICP as a filter to identify your target accounts. By scoring your target accounts you can better ascertain the value of organizations, on which you can expend your limited resources on. Account scoring is comprehensive with its scoring schemes by prioritizing unique attributes of target accounts.
Steps to create account scoring:
1) Ideal Client Profile: Your ICP in account scoring has two functions. The first is to use your ICP to make target accounts or rather filter out a range of target accounts before scoring them. The second function of ICP acts like an explicit scoring model as in lead scoring. This means using your ICP as a benchmark while scoring organizational traits, like the size of the company, ACV, location, etc. This becomes an inevitable part of your scoring scheme.
2) Creating a Scoring Scheme: A scoring scheme is nothing but the basis of assigning a score to a target account. As mentioned in the previous step, your ICP has the role of designing your explicit scoring. With that sorted, you can establish some implicit scoring criteria. Such as rewarding points based on email engagement, content download, and web analytics. For example, an organization visiting a review page could earn 3 points, while traffic generated through PPC could earn 7 points. The value of certain touch points and engagements can be determined by using a revenue attribution tool.
3) Customisation: A scoring scheme is never linear. All elements within a scheme might not apply to every organization. Different organizations and stakeholders might have different uses for your services and different valuations for their touch points. Hence, it is important to measure the relative impact of the scoring scheme on your target accounts. It is also crucial to revise your ICP, rearrange their permutations, create several ICPs, and compare them.
Account scoring vs lead scoring
One could argue that both these scoring methods are somewhat similar. Both their scoring models have an implicit and explicit element to them. So, is it just a matter of what they’re called? The most important distinction here is that account scoring deals with organizations while lead scoring deals with individual leads.
Account scoring views a client as an organization with several decision makers involved. While lead scoring is better suited for dealing with a single decision maker. This is why lead scoring is the better choice for clients with a lower ACV, this implies a low level of decision making involved, with only one or few decision makers. And because of its individualistic nature, lead scoring has a stronger emphasis on engagement.
Account scoring on the other hand is better suited for high ACV organizations with more decision makers. This necessitates the need to create key accounts for an organization rather than scrutinizing an individual lead. It also works better with ABM and account-based engagements. The use of ICP has more prominence in organizations and takes the number of stakeholders and ACV into account.
.webp)
4 practices B2B marketers can adopt from their B2C counterparts
Contemporary B2B marketing is closing the gap
In the marketing realm, it’s a common precedent to pit B2B and B2C marketing against each other. And rightly so, given their inherently dissimilar attributes with who they’re selling to, how long it takes to make a purchase, etc. With that said, research and technology have proven there are a lot alike between the two. They might be subtle but understanding those subtleties are impactful for the long haul.
Technology has shown us the prevalence of digital customers in B2B buyer personas is similar to that of B2C. With B2B marketing showing a progressive interest in becoming more brand-oriented, research has shown us the importance of emotional connection at higher levels of a B2B element value. Like in B2C, building a social media presence or making more personalized content to promote branding has shifted the agenda of B2B marketing. To emphasize further, here are 4 things B2B marketing could adopt from B2C marketing.
4 things b2b could adopt from b2c marketing
1. Marketing to People:
This translates to the personalisation of your marketing strategy that will tend to customers’ emotional and logical needs. B2C marketing for the longest time has honed the art of delivering personalized messages to individual prospects. While historically B2B marketing has been informational/educational akin to the needs of the several decision-makers involved. B2B prospects are nurtured with their need to research.
You’ll be surprised to know that adding a personal element to your interaction in your marketing promotes perceived brand value. In fact, B2B customers are 50% more likely to convert when they see personal value, and are 8x likely to pay a premium for a comparable service. The use of dynamic content that corresponds with a user’s needs on a website, and B2B email marketing to establish a personal tone, are some examples of personalisation. This isn’t to diminish the informational/professional element of B2B marketing but to add a personal touch to the same.
2. Building a Community Around the Brand:
From a business relationship to fans of the brand. Presumably, this is much harder for a B2B organization to achieve, while it’s second nature for most B2C brands. OnePlus for example built a community forum that gives users access to news, discussion and social features. This not only promotes the brand and its products but also allows for more customer engagement.
There are different channels through which B2B companies can build their communities. This can include creating a subreddit and uploading infographics on YouTube. Using these mediums could prove to be more useful than building your own forum thanks to the already well established B2B marketing communities within them. If you are keen on building one with a more tight-knit approach, consider forming a public discord server or a public slack channel.
When it comes to building a social media presence in B2B, having a social media presence alone won’t cut the mustard. Instead, a continual effort to build through customer engagement is key. B2C brands often create community posts and polls on Twitter, create short quizzes, answer queries, etc. This dynamic however is hard to build over the professional overtone, but adopting its practice should facilitate some creative and original content. It is also important to utilize a wide array of social media platforms, and not ones that might generate the most prospects.
Influencer marketing is something B2C marketing is all too familiar with. And for good reasons, people are more likely to purchase something with more credibility. But before you do so, you would have to sell the product to your influencer first, which involves a great deal of good faith and trust. The influencer marketing space in B2C is cataclysmically large, to scale the same for B2B would be pretty impractical. Instead, an affiliate program that incentivises existing customers to recommend the product or service to others. Even leaving reviews on authentic platforms like G2 increases the credibility of your brand by having other brands and marketing leaders vouch for it.
3. Buyer Personas and B2B Mobile Traffic:
Building a strong buyer persona is something B2B marketing could use to improve its content strategy and create more engaging content that addresses its challenges. This means understanding your target audience. In B2B this represents all the decision-makers involved, their pain points, goals and most importantly intent data. Research shows that B2B companies that utilize buyer personas in their content strategy perform better.
Speaking of buyer personas, it’s not unusual to expect a large portion of B2C buyers to use their mobile devices for research and queries. But what if I told you the use of mobile phones is gradually becoming the source of a lot of B2B search queries, over 50% of it to be precise. More buyers are using their phones for B2B research during work and leading organizations are generating 40% of revenue through it. Considering that mobile-first B2B generates higher engagement, site traffic, search queries and leads. Maybe it’s worth adopting from our B2C cousins.
4. Privacy and Privacy first marketing:
Becoming a privacy-first business is a big deal in this current digital climate. Given that the customer pool for the average B2C marketer is larger and its not so admirable track record with data security and privacy. More B2C marketers are becoming more proactive with their data and how they interact with it. This concerns B2B marketers as well, from a business perspective, data security is paramount. Educating yourself in B2C data security practices can be useful as most of the regulations governing these practices and the use of cookies stems from B2C practices in the past. To learn more about becoming a privacy-first business refer to this blog.
It's not hard to believe that the line between B2B and B2C marketing is getting blurry. At the very least they share the same goals. To generate as many leads and convert them. While contemporary B2B marketing adopts features of B2C marketing, the same could be said the other way around. Their culmination of experience in lead generation and conversion brings a lot to the table for the future of marketing methodology.

Factors. ai vs Bizible: Pricing, Integration, Features and More
Marketing today looks nothing like it did just a few years ago. You need to keep an eye on numerous campaigns on various channels, understand where your users are coming from, what drives them, possibilities of churn, and endless optimizations. For tasks like these, companies can’t help but rely on B2B marketing tools like Factors.ai and Bizible.
Well-known in the marketing space, both of these tools come with a variety of capabilities and functionalities for analytics, attribution, personalization, and optimization to help B2B firms make better-informed marketing decisions.
But how do you know which one’s right for you?
The following blog delves into the features offered by them and a comparative analysis of their respective strengths and weaknesses in the marketing analytics field. Curious how one of these tools can become part of your marketing arsenal? In this article, we’re covering everything from the features to pricing, integrations and even reviews for both Bizible and Factors!
About Bizible
Bizible (now Marketo Measure) is a widely-used attribution tool aimed at providing B2B and B2C marketers with insights on their customer journey and revenue impact. It does so with strong touchpoint tracking and attribution modeling.
Bizible Integrations
The Adobe Marketo Measure (previously Bizible) extends its functionality to seamlessly integrate other tools to collect information on web source, medium, keyword, cookies, visitor behavior. Using this you can optimise your marketing strategies accordingly. Here are some of the tools that are supported by Bizible:
- Microsoft Dynamics CRM (for custom objects, pre-built CRM reports, templates and dashboards)
- Marketo Engage
- WordPress
- Salesforce Sales Cloud
- HubSpot Marketing Hub
Bizible Features
- Dedicated A/B testing integration, lets you track the revenue impact of your Optimizely and VWO site experiment. These experiments can provide insight to your marketing team to help optimize their campaigns and improve ROI.There are a few types of Marketo Measure A/B reports available to customers, which enable reporting on A/B Test results regarding leads, contacts, and opportunities.
- Dedicated Boomerang stage feature was designed to enhance visibility into the customer's journey, particularly for customers with extended sales cycles. Marketers are empowered by this feature to establish touchpoints at every stage transition throughout the Opportunity journey. For example, it captures scenarios where a contact progresses from MQL to SAL and subsequently returns to the MQL stage. This is known as the boomerang stage, or when contacts "re-enter the MQL stage" or "re-MQL." The Boomerang Stage feature seamlessly integrates with the Marketo Measure Custom Stages, working together to enhance the functionality.
- Multi-currency Compatibility which allows users to switch between different currencies for their reported spend and sales revenue. Currently, this feature covers these two metrics.
About Factors. ai
A compelling alternative to Bizible, Factors. ai comes into the picture as an AI-fueled marketing analytics and attribution platform that works with SME and mid-market B2B companies like Razorpay, Chargebee and Clickhouse. Not only does Factors.ai offer robust attribution capabilities, but it also provides a user-friendly interface and intuitive reporting tools. The platform is divided into 4 broad categories:
- Marketing and website analytics
- Marketing attribution
- Journeys analytics
- Account identification.
Factors. ai Integrations
Factors has the ability to connect with advertising platforms, customer relationship management (CRM) systems, and customer data platforms (CDPs). Consequently, it can be used to track user actions across various touch points on a website, analyze campaign information, and even gather data from events recorded in the CRM. This comprehensive integration enables holistic analysis and reporting of data.
Factors. ai Features
Factors.ai comes bundled with unique features that aid attribution.
- User/account timeline: showcases all touchpoints for all users across their conversion journey over a span of time presented neatly on a timeline graph. This feature helps businesses identify valuable touchpoint data for all its users that can pinpoint every single step of every user’s conversion journey.
- Customizable Stage Transitions: With this feature, users can track and optimize the customer journey by defining and customizing stage transitions that align with your unique sales cycles, allowing for granular analysis of each stage.
- User-Friendly Interface: Users can enjoy a seamless and intuitive platform that makes it easy to navigate, visualize data, and access actionable insights, ensuring effortless usage for marketers of all skill levels.
- Cross-Channel Analysis: It is also possible to analyze the performance of your marketing efforts across multiple channels, such as digital advertising, social media, email marketing, and more, to understand the synergistic effects and optimize cross-channel strategies.
How do the two compare?
Here is a table comparing the features that Bizible and Factors. ai come with:

In the next few paragraphs we will look at their strengths and weaknesses when pitted against each other with respect to integrations, attribution, onboarding and implementation, reporting quality, pricing, and privacy and compliance.
1. Integration
There are some points to consider when comparing the integration features of their tools. First off, the tools that these apps integrate with, do not completely overlap. For instance, Factors. ai does not integrate with Microsoft Dynamics Integration- Bizible does, and Bizible does not integrate with CDPs, which Factors. ai does. Second, Factors. Ai offers out-of-the-box integrations while Bizible comes with high developer dependency for tasks such as tracking HubSpot landing pages or integrating with LinkedIn.
Bizible can integrate with a wide range of applications and platforms. These popular apps span across CRM, CMS, marketing automation, email marketing, advertising platforms, web and sales analytic tools. Some of these commonly used platforms are Marketo, Google Ads, WordPress, MailChimp, Outreach and SalesLoft.
Factors. Ai can also integrate with similar ad platforms, CRMs, and CDPs. CDP helps improve data quality, identify new audiences, and connect behavioral data. At the moment, Factors can integrate with third-party CDPs like Segment.
2. Attribution
B2B marketing attribution is like detective work for marketers, uncovering the hidden fingerprints of success. It's an process that delves deep into the influence of various marketing touchpoints on coveted conversion goals, such as demos, pipeline growth, and revenue generation. The process involves employing a variety of multi-touch attribution models to evaluate and quantify the contribution of each marketing touchpoint towards achieving these objectives.
Factors. ai and Bizible both offer marketing attribution capabilities. They share a few similarities and differences.
Channels and Subchannels
Marketing Channels serve the purpose of categorizing and organizing your marketing activities for convenient reporting in both the Marketo Measure ROI Dashboard and your CRM system. Bizible offers 40 custom channels, which can be customized and renamed according to your organization's preferences. The Marketing Channel represents the broadest level of classification, encompassing various Subchannels. These Subchannels can be viewed as the specific "type" of source through which your leads are generated. Examples of Marketing Channels include Paid Search, Organic Search, Display, and Paid Social. Subchannels play a significant role in indicating the specific version or variation of the Marketing Channel used to attract leads.
Currently, Bizible offers 40 custom channels and 200 subchannels. Channels and subchannels in Bizible attribution categorize and organize marketing touchpoints, providing insights into the performance of different marketing sources. This helps marketers understand the effectiveness of various channels and subchannels in driving conversions and revenue, informing decision-making and optimization strategies.
A business growing at a fast pace might opt for more channels to avoid chances of narrowing attribution and analytics. Factors.ai attribution does not specifically use the terminology of ‘channels’ and ‘subchannels’ in the same way as Bizible. Instead, Factors.ai focuses on integrating various data sources, such as ad platforms, CRMs, and CDPs, to provide a holistic view of marketing performance and customer journeys. It analyzes the impact of different touchpoints and events across the customer journey, offering comprehensive insights into marketing effectiveness and revenue attribution.
Attribution models: Factors.ai has the capability to create attribution reports at both company and user levels, can track both website and non-website events, and has a customized dashboard that collects and visualizes all crucial data in one place. Factors.ai also delivers 9 attribution models that include influence, time-decay, U-shaped and W-shaped.
Bizible offers 6 different attribution models that can help marketers decide what touchpoints are impactful in the customer journey. These are Lead creation, First-touch, U- shaped, W- shaped, Full- Path, and the Custom model.
Attribution model funnels and metrics:
Bizible and Factors. ai both provide a range of metrics and filters to analyze attribution models and measure marketing performance. Here are some of the key metrics and filters offered:
- Revenue Attribution: Measures the revenue generated by each touchpoint or marketing source, providing insights into their contribution to the bottom line.
- Conversion Attribution: Determines the contribution of each touchpoint to conversion events, allowing you to understand which marketing efforts are driving conversions.
- Touchpoint Influence: Measures the influence of a specific touchpoint on conversions or revenue, providing a granular view of individual touchpoint performance.
These platforms also allow filters like:
- Time-based Filters: Can be used to analyze attribution data within specific time frames, such as daily, weekly, monthly, or custom date ranges.
- Revenue Range Filters: You can set filters to analyze attribution data within specific revenue ranges, allowing you to focus on different tiers of revenue generation.
The difference between the two lies in Factors’ AI- driven approach to provide attribution models. With this information, you can dynamically allocate credit to marketing touchpoints based on their actual impact on revenue and conversions, and also forecast future performance by availing predictive analytics. Factors. ai also emphasizes seamless integration with CRM systems and marketing platforms.
3. Onboarding and Implementation
Setting up Bizible requires some level of dependency on developers. You might also require technical support from your development team for processes like creating a custom model. As per reviews on g2, the onboarding process can take a few months to fully complete. On the whole, Bizible works as a solid attribution tool, but reviewers often report problems with the onboarding and implementation.
Factors offers a quicker onboarding process of under 30 minutes, without requiring heavy-duty technical assistance. Factors’ tracking script can be set up directly or through Google Tag Manager in only a few minutes. Find out more about the process here. In case you're facing any difficulties, you can also get in touch with Factors' customer support team available round the clock.
4. Analytics/Reporting
Bizible has a wide selection of drill-through data. You can access marketing reports on the revenue by channel, closed revenue, contacts created, opportunities created, closed deals etc. It provides snapshots of CRM at any point in time and the distribution of records across opportunity stages.
Factors.ai can also extract and analyze relevant data points to give you a comprehensive overview of your customer relationships and interactions.The snapshot provided by Factors.ai may include key CRM metrics and visualizations, such as pipeline value, conversion rates, sales velocity, lead distribution, and performance trends. This enables you to have a holistic view of your CRM data and track the progress of your sales and marketing activities.
Bizible and Factors.ai both give you the option to visualize marketing data the way you want. If you connect to a business intelligence (BI) platform, you can present data with more flexible visual options. Standard metrics like bounce rates and monthly visitors are available on both Factors and Bizible, when integrated with data analytics platforms.
5. Pricing
Bizible's pricing information is not available on their website. That said, according to reviews online, Bizible is 5% and 6% more expensive than the average attribution production, for small and mid sized businesses respectively.

This is not very convenient for SMEs and startups. However, according to GetApp, Bizible scores high with 4.8 out of 5 stars on the value of money rating. They allow a maximum of 25 users per plan. It is important to note that this number can vary with lower plans.
Factors. ai pricing is geared to cater to startups and SMEs. Their high tier growth plan is more affordable for these businesses and comes with customer support and functionality. They also offer specific plans that are purpose-built for your business’s unique analytical and attribution requirements. They also allow unlimited users per plan.
What is the right option for you?
Ultimately, the choice between Bizible and Factors.ai depends on your specific requirements and priorities. Bizible may be a good fit if you prioritize strong touchpoint tracking and existing integrations with tools like Microsoft Dynamics CRM and Marketo Engage. Furthermore, Bizible pricing is considered appropriately priced by users. On the other hand, Factors.ai offers AI-driven attribution models, customization options, and a user-friendly interface, making it a compelling option for those seeking a more agile and appropriate solution for startups and SMEs.
Consider your business's needs, budget, and desired features to determine which platform aligns best with your goals and will empower your marketing team to make better-informed decisions. The choice between the two depends on the specific requirements, the importance placed on factors such as AI-driven attribution, customization, predictive analytics, and user interface. Evaluating these differences can help determine which platform better aligns with your organization's marketing measurement requirements in terms of attribution modeling and the depth of integration needed. If you’re interested in seeing how Factors.ai could align with your business, schedule a personalized demo here.
Wondering how Factors fares against other top analytics tools? Here are some quick reads:

