
Measuring Marketing With Change Science (Part 1)
Discover how change science may be used to evaluate marketing success. Learn how to use statistical significance to make daily decisions as a marketer


.svg)


We all have heard the saying: “Change is the only constant,” which translates to the fact that everything changes, every time. While that is too philosophical, and since marketers – more so data-driven B2B marketers – are not really fans of philosophy, there is a need to “measure” change. And not just that, a business needs to “attribute”, “rank”, “predict”, “explain”, and hopefully even “bring about" change using data analytics. Since statistics is the mother of all real-world measurements, and probability is the grandmother thereof, the science of measuring change too lies somewhere close by.
Since surface (i.e., not deeply thought-out) definitions are easy to make but difficult to follow with real-world data, the real challenges are solved by taking support from the well-researched areas of data science and probability. One extreme is to discuss the topic of change with its extreme roots, but that could easily fill-up a book (which is under way), but we stick to measuring change w.r.t. marketing analytics.
The questions
The main questions from a marketing perspective are: “What main factors changed from last week to this?”, and “By how much did these main factors change?”. But before that, let us understand something even more basic.
Why to measure?
Marketers take various targeting decisions on a daily basis – which audience to target, how frequently, and with what kind of marketing campaigns. They also have to keep track of various prospective customers, their journey, their overall statistics, and most importantly, reasons why a particular technique worked (or didn’t work) – be it a campaign or a strategy. And there are various goals when it comes to marketing. While some techniques could be motivated towards increasing reach (where it’s important to maximize the number of eyeballs a webpage could get), others increase conversions (at various points in a funnel – form-fills, email cold/warm calls, prospects, pre-sales, sales, etc.).
The foregoing marketing goals are achieved by measuring both static marketing performances (i.e., what happened today / this week), and also more dynamic, time-aware ones. While analyzing performance over time is a comprehensive view of marketing goals’ achievements / shortcomings and hence makes it cumbersome to digest multiple metrics of interest in a single frame, summaries of the same are preferred. And one of the summaries of a dynamic measurement of marketing performance comes in the form of change – that is, what changed, by how much, and why. In this article, we would focus on measuring overall changes, and would dig deeper into measuring the causes for the same in a follow-up blog.
What to measure?
Based on the business requirements, marketers focus on tracking and eventually improving relevant KPIs (key performance indicators). For the scope of this article, we would explain change analysis taking the example of one important metric marketers are concerned about – the number of leads they generate every week. They achieve this by driving relevant visitors to their website every week. Any change in the number of leads that they get as compared to what they expected calls for an investigation on the reasons for the difference between expected and actual metrics.
Since the first step into any such investigation is to measure and compare (with last week) some global performance indicators measuring the reasons for change, the same is the focus of the current article. Hence, keeping a webpage in mind, we take the example of measuring the number of visitors (those who reached the website), the number of leads (visitors who reached target), and the conversion rate therefrom (leads per visitor).
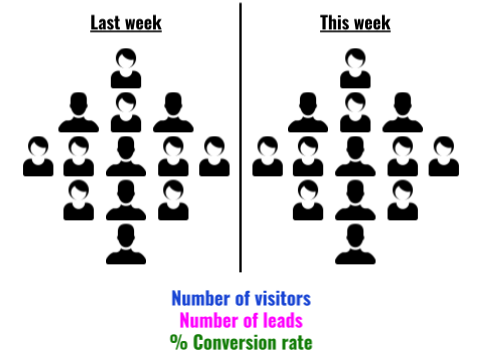
When we perform these measurements for two given periods of time (say consecutive weeks), we could compare them. Let V1, L1, and C1 represent the number of visitors, number of leads, and conversion rate of week 1 respectively, and let V2, L2, and C2 represent the same measurements from week 2.
{{INLINE_TOFU}}
How to measure?
The four simple change measurements one could perform are the following:
- Total change: This is the most basic measurement of interest that preserves both the “unit” and the “sign” of change. For example, if the number of website visitors who filled out a form changed from 50 last week to 75 this week, we get an absolute change value as +25 form-fillers. In short, it answers the question: “How much more/less?”.
More formally though, one could measure absolute change in visitors (𝚫V = V2-V1), leads (𝚫L = L2-L1), and conversion rates (𝚫C = C2-C1). - Relative change: While absolute change remembers the unit of the entity one is measuring, it is – more often than not – more convenient to adopt a normalized change score. Taking the same example as before, change in the number of form fillers from 50 to 75 means a change value of +25, but the same is true if form-fillers had increased from 150 to 175 (viz., +25). What separates the two cases is relative change (i.e., how much did the unit change per unit original), which is +0.5 (=25/50) for the former (50→75), and +0.17 (=25/150) for the latter (150→175). The specialty of this score is that it remains a fraction between -1 and +1, and helps in comparing two “changes”. In a day-to-day language, a “percentage” variant of this metric is used by marketers.
Again, a formal representation of relative change in visitors (𝚫rV = 𝚫V / V1), leads (𝚫rL = 𝚫L / L1), and conversion rates (𝚫rC = 𝚫C / C1) would also help engrave the idea. - Percentage change: As described earlier, it’s easier to understand when one says “the number of visitors saw a 50% increase” (as opposed to saying the relative change of visitors was +0.5). Therefore, as a human-friendly change metric, the percentage variant is more popular than its math-friendly counterpart (relative change).
A notable caveat is as follows. “From X to zero” would mean a “100% decrease” (and vice-versa), but “from zero to X” turns out to be an “infinite% increase”, which is absurd. One workaround to rectify this is to call “from zero to X” as “from min to X”, where min could be set based on the metric of interest (e.g., min could be just 1). Another workaround is to call “from zero to X” as a “100% increase”. Another interesting point is that “no change”, it’s called a “0% change” – even if it is “from zero to zero”.
From the perspective of our current example, percentage change in visitors (𝚫pV = 100 x 𝚫rV), leads (𝚫pL = 100 x 𝚫rL), and conversion rates (𝚫pC = 100 x 𝚫rC) could be computed by simply multiplying the relative change by 100. - Factor change: Some marketers (and sometimes marketers) like to express change in percentage differences, and sometimes in factor increments/decrements (and some do both), and this is purely a personal/company-wide choice. Picking the same example from above, whether it is convenient to say “the visitors increased by 50%” or “this week’s visitors are 1.5x last week’s” differs from use-case to use-case, but is only a different way of expressing relative change.
Although one has to be cautious, however.
- “1x” means no change (a “0% change”). For example 100→100, 1→1, 0→0, etc.
- “0x” means a “100% decrease”, from, say 100 to 0, 5 to 0, but not from 0 to 0 (since we choose to call it a “1x” change.
- “2x” means a “100% increase”.
- “1.5x” means a “50% increase”.
- In general, “kx” means a “100*(k-1)% increase/decrease”, where it’s an increase when k > 1 and a decrease when k < 1.
- When saying “kx”, k never goes negative.
Going by the earlier example of website visitors, we could be interested in the factor change in number of visitors, (𝚫fV = V2 / V1), leads (𝚫fL = L2 / L1), and conversion rates (𝚫fC = C2 / C1).
Measuring overall change
Depending upon the business and the audience, there are multiple combinations of possibilities. We only cover some of them, summarizing overall (global) change. And as mentioned earlier, our next article on this topic would dive deeper into digging up the “reasons that drive this overall change.”
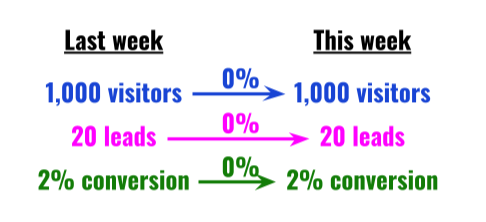
No change
Let us start with a simple world, and slowly drift towards complex scenarios. Suppose our website had 1,000 unique visitors last week, and 1,000 new unique visitors this week (i.e., there was no change in the number of visitors). Of the 1,000 users last week, 20 signed-up for our newsletter, and the same trend continued this week as well. In other words, both last week’s and this week’s conversion rate was 2% (20*100/1,000). What does this tell us about this week’s performance over last? That it remained the same! In other words, there was a 0% increase/decrease in both reach and lead conversion rate.
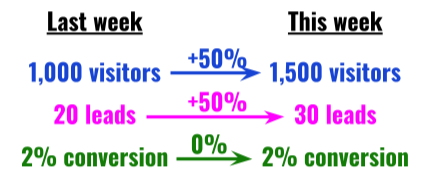
Proportionate increase in visitors & leads
Now, if we had more visitors (say 1,500) this week as compared to the last, with a proportionate increase in leads so as to maintain the 2% conversion rate, it would amount to a 50% increase in visitors and leads, but a 0% change in conversion rate.
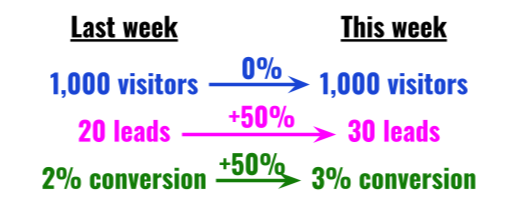
Increased leads, retained visitor count
On the other hand, if the total number of visitors had remained the same, and leads would have increased by 50%, this would increase the conversion rate by 50%.
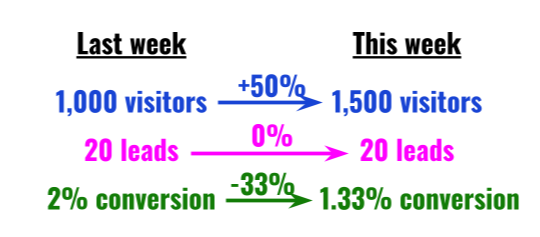
Increased visitors, no change in leads
If, however, the number of leads would have remained the same despite an increase in visitors (by, say, 50%), we would see a 33% fall in conversion rate.
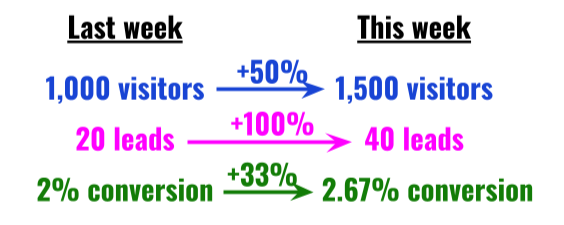
Disproportionate increase in visitors & leads
It is also possible that the number of leads increased by a disproportionate amount, which led to an increase in conversion rate.
Measuring change factors
We just discussed how measuring overall change is straightforward: simply report the signed/relative/percentage difference or factor change in visits, leads, and conversion ratio between the two weeks. But this is only half battle won. What is ideal is to measure the “causes” for the change. For example, we know that a 2x increase in visitors (V2 = 2V1) and 1.5x increase in leads (L2 = 1.5L1) – and hence a 25% drop in conversion rate (C2 = L2/V2 = 0.75L1/V1 = 0.75C1) – happened. But why it happened is one of the most important questions change science has to answer.
What causes change?
A seasoned marketer can quickly understand the main factors that led to a drop or a rise in scale (#visitors) or conversion (leads/visitor). But where data analysis comes in is in short-listing such factors from the rest, and hence help the marketer with her weekly (or periodic) decisions. In this article we only give an intuitive idea of what causes change (and how we measure it). In part 2 of this series on Change Science, we discuss the exact procedures and methods to measure factors that cause change periodically.
The more we know about our customers, the more our analysis benefits. While measuring change, as it was mentioned above, we usually track the number of visitors (V), the number of leads (L), and the respective conversion ratio (C). Along with mere counts, one ought to measure the profiles of such visitors and leads – in both weeks. For example, with a 2x and 1.5x raises in visitors and leads, to know what caused it, one has to track how the properties of visitors and leads have changed. The properties we are referring to are usual user/event based properties – from simple demographic ones such as Location (country, city, etc.), User Agent (browser, OS, etc.), etc. to marketing-oriented ones such as Referrer (domain, campaign, etc.) – along with their values (a “property=value” combination looks like “country=India”, for example). In summary, in addition to tracking overall statistics (visitor and lead counts), we also track counts “grouped-by” their properties.
Needless to mention, such properties are too many to count, and property=value combinations are even more. This is where Factors.AI comes in. We track-down each factor, measure the change attributed to the factor, and surface top insights. And we repeat the process for any event pair combination (in say, a funnel), for every property, and for every consecutive period of interest. We urge you to follow-up with us in the next article that describes how exactly we surface the main change factors via our very own Weekly Insights feature.
Stay tuned.

See how Factors can 2x your ROI
Boost your LinkedIn ROI in no time using data-driven insights


.avif)


.avif)
See Factors in action.
Schedule a personalized demo or sign up to get started for free
LinkedIn Marketing Partner
GDPR & SOC2 Type II

.svg)


.avif)


.avif)