.svg)

.webp)
Attribution is Broken (Part I)
In 1908, Henry Ford introduced the Model-T to the world with a full-page advertisement in Life magazine. The print ad read like an article and was chock-full of technical jargon by design. Back then, a marketer’s function was straightforward — inform all potential customers of the existence and superiority of the product. Who you were marketing to wasn’t half as important as what you were marketing. As long as buyers in the market were aware of the Model-T’s vanadium steel chassis and four-cylinder engine, Ford’s marketing team could sleep well at night knowing they had done their jobs.

Of course, the role of the marketer has evolved *a little* since then. At the time, print ads were one of the few viable communication channels available to marketers. There was also a stubborn focus on the product itself — with little thought given to what worked for each customer. Owing to years of progress in marketing technology and a radical shift towards customer centricity, marketers today have a lot more to think about. Recent digital transformations have empowered marketers with dozens of channels: social media, email, blogs, videos, podcasts, websites, etc. In turn, they’re able to reach potential customers with content that’s specifically tailored to them.
On the other side of the equation, digital transformation has also provided customers with far more control. Relevant market information (product details, reviews, alternatives) is instantly accessible to potential buyers. And when your competitors are a single click away from you, there is no room for complacency. As a result, the modern marketer must go above and beyond traditional information distribution. Today, the four staple functions performed by marketers are:
- Delivering predictable pipeline and revenue
- Building the company’s brand
- Developing long-term growth initiatives
- And empowering the sales team
Still, as marketing has evolved in terms of technology and practice, analysing data and deriving insights have grown increasingly complex as well. While marketers are able to design sophisticated multi-channel campaigns, determining the basic metrics — what’s working, what’s not, which campaigns to invest in, etc. — can become tricky. Here’s an example to illustrate this:
Gendesk, a help desk software start-up, takes out advertisements on Youtube and Facebook. Deepti, a customer success VP, stumbles upon the YouTube ad while trying to watch a video of a sleep-talking cat. She takes notice of Gendesk and clicks through to their website. Though she likes what she sees, she forgets to sign up for a demo. Later that week, Deepti comes across the Facebook ad while scrolling through her feed. This time, she ensures to schedule a call and finds the product to be a great fit. After discussing with her team, Deepti decides to make the purchase.
As a marketer, this is great news. But when you’re looking to repeat this process in a scalable manner, a key question to ask yourself is “Which ad do I credit for the purchase decision?” Though there are cases to be made for each ad, the right answer is a subtle combination of both. Identifying this combination of credit, or in other words; determining the values to attribute to the various touch-points along the customer journey is now the holy grail of marketing analytics.
Enter: Marketing Attribution
The previous example was based on a highly simplified customer journey — one customer and two channels. In reality, marketers target several types of customers and employ several different channels to engage with their audience. What’s more is that the buyer’s journey is almost never a linear path. Deepti may well have stumbled upon the youtube ad, visited Gendesk’s website, interacted with their chatbot, reviewed the pricing page, read a blog about the product, and clicked back to the website before coming across the Facebook ad and making his purchase. Marketing attribution is a tremendously powerful system that determines these various touch-points along the customer journey and attributes a percentage value to each one of them.
Okay, but why’s marketing attribution so important anyway?
“The reality is that marketing has become THE most efficient way to accelerate growth in our digital economy. The imperative is to connect the dots, so each marketing expense dollar is aligned and reported against revenue growth.”
- Paul Albright of Captora.
A well-oiled marketing attribution system can result in efficiency gains of up to 30%. At its core, attribution modeling enables marketers to allocate resources in a strategic manner. Marketers can ensure that they’re actively driving conversions by optimizing their spending based on data-driven metrics. Zendesk’s marketing team, for example, can use a variety of attribution models to derive an understanding of what campaigns are working, and what campaigns aren’t. Accordingly, they can make evidence-based decisions on where to invest and what to alter. Ultimately, this results in a notable rise in ROI, a stronger grasp of SEO/SEM, and an improved alignment between marketing and sales. On average, marketers employ at least 6 communication channels to reach their customers today. As this number continues to rise, attribution will only become increasingly critical to the success of modern marketing initiatives.
________
All that being said, marketing attribution isn’t without its challenges. In fact, even after the emergence of highly effective multi-touch models, several organizations continue to report attribution manually through spreadsheets.
There are many considerations that go into choosing the right attribution model which can present several challenges for the marketer:
The Sales Cycle:
Attribution is a lagging indicator. It takes time and patience to see if models are working. Based on the length of the sales cycle, the effects of a new campaign or changes made into existing ones will reflect much later into the future.
Ease of Set-up and Implementation:
30% of companies in the UK say that they have chosen their current attribution model based on ease of use. If put in a position to choose between a model that is easy to implement and a complex model that would be tedious for the team to implement, marketing heads would prefer the simpler model. Similarly, technological limitations may also hinder the execution and implementation of attribution models.
A Culture of Data and Measurement:
To be able to value the insights provided by attribution models, there needs to be a culture of measurement and accuracy within marketing teams.
Communication of Insights:
Communicating the insights from the model is significant for communicating cost justification as well as for taking action based on the insights from attribution. To get funds and approvals for software costs, and implementation costs in terms of time, effort, and training, the team needs to be able to communicate the insights well and accurately.
Attribution to Improve, Not Prove:
Marketers often use attribution to prove that campaigns are working. As mentioned in the earlier section, this is important to be able to justify costs. However, limiting attribution to this purpose can lead to lost insights and higher costs. Attribution, at its core, is directional in nature. Attribution models can be used to see what is working well and also to check what is not working and needs to be abandoned. Marketing and Sales teams are often working on several kinds of campaigns and this is a useful tool to see which campaigns are performing better and can be emulated in future projects.
Volume bias:
Most often, an organisation’s highest volume campaign can show up as its most successful campaign if marketers do not track other metrics like conversion rate and win rate. To understand, let’s consider the example of an organisation that sells CRM software to businesses. Say in the last six months, they saw a total of 500 downloads, out of which 400 were attributed to Campaign A which was implemented in the form of in-person promotional events like webinars while the remaining 100 were attributed to Campaign B which was implemented in the form of ads on YouTube and Instagram. By themselves, these numbers make it seem like Campaign A was the more successful campaign. But what if we find that the 400 downloads were made by customers from a total of 10,000 attendees in those in-person events while the remaining 100 from the second campaign were made by customers out of a total of 500 users who were presented with the ads. So if we look at the conversion rates for Campaigns A and B, we see that they were 4% and 20% respectively. This comparison could possibly give us the insight that if Campaign B was promoted further, with more funds and effort directed towards it, the organisation might’ve seen more downloads of its software with the it’s higher conversion rate relative to Campaign A.
Absence of predetermined hypotheses:
To get effective insights from an attribution model, marketers need to be specific about what they’re trying to measure. For example, say the conversion rate for leads from campaign X within the period of the last 30 days since it went live for geographic location Y- can be used to understand if a campaign was successful within the target audience from that location. If marketers do not know what exactly they are looking for, they will end up giving an overall attribution report and miss out on gainful insights.
Invisible touchpoints:
Several attribution models being used by organisations do not account for certain important touchpoints. Models that do not track the relationship between online activity and offline sales may lead to digital signal bias. For eg. one might have seen the ad for a clothing app on Instagram but they decide to go to the store and purchase the item. Models that do not include sales touches may not include the impact of sales actions. On one hand, it may hamper the accuracy of the outcome metrics and on the other, it may cause disarray with the sales teams instead of aiding collaboration between the two teams.
In order to choose the right attribution model for your team and reap the benefits that attribution brings to modern marketing, marketers need to be wary of these challenges and address them.
In further blog posts, we will be exploring the various challenges of attribution that we have outlined here in greater detail.
Modern buyer paths require deeper insight than traditional attribution allows.
1. Model Advantage: Tracks multiple touchpoints across the customer journey.
2. Why It Matters: Offers a clearer view of what truly drives conversions.
3. Strategic Benefits: Enables smarter budget allocation, campaign optimization, and performance measurement.
Adopting multi-touch attribution helps marketers make data-backed decisions that reflect real user behavior.

Amplitude Vs. Factors.ai: What’s The Right Choice In 2025
Amplitude Vs. Factors.ai: What’s The Right Tool For You In 2025
B2B go-to-market teams are increasingly relying on marketing and website analytics tools to track and optimize performance. In response to this growing demand, established product analytics tools like Amplitude and Mixpanel are attempting to introduce their own versions of website analytics, marketing funnels, and multi-touch attribution.
There’s no doubt that Amplitude is great at what it does. In fact, it’s rated as one of best product analytics solutions in the market today. But how does a tool that specializes in product analytics fare against a purpose-built marketing analytics solution like Factors.ai? And more importantly, what’s the better choice for your use-case?
This blog compares Amplitude vs Factors.ai. Here’s what we’ll be covering:
- Marketing Analytics vs Product Analytics
- Comparing Common Features
- What Amplitude Does, That Factors Doesn’t
- What Factors Does, That Amplitude Doesn't
- What’s The Right Tool For You?
- Comparison Table
tl;dr:

Marketing Analytics vs Product Analytics
Before diving into the comparison between Amplitude and Factors.ai, it’s worth highlighting the difference between marketing analytics and product analytics.
Marketing analytics tools are geared towards tracking and optimizing performance across campaigns, website, and CRM. Popular marketing analytics tools you may have heard of include Google Analytics, Factors.ai, and Adobe Analytics. Marketing analytics can help answer questions such as:
- Which marketing efforts drive the most ROI and pipeline?
- Which campaigns should be scaled or cut to optimize budgets?
- What marketing channels attract high-quality accounts to the website?
- How are visitors engaging with the website? What’s helping and hurting conversions?
- What is the impact of content on pipeline? Which blogs resonate most with visitors?
Product analytics tools like Amplitude, Mixpanel, and Heap are better suited to tracking event-based data within web and mobile products. These tools help understand how customers use specific features within a product. Product analytics can help answer questions like:
- Which product features are most popular? How does usage vary by customer type?
- How long do customers spend using a specific feature every week?
- Which customers are most likely to convert to higher tier plans?
- Which customers are most likely to churn based on engagement?
- How can the product road map be finetuned based on product usage?
Needless to say, marketing analytics tools are better suited to marketing & sales teams while product analytics tools are more helpful to product teams. Here’s a quick brief about Amplitude and Factors.
About Amplitude
Amplitude is an established product analytics platform that works with commercial and enterprise-level companies like Atlassian, Dropbox, and Adidas. The platform is divided into three products:
- Amplitude Analytics
- Amplitude Experiment
- Amplitude CDP.
About Factors
Factors is an AI-fueled marketing analytics and attribution platform that works with SME and mid-market B2B companies like Razorpay, Chargebee and Clickhouse. The platform is divided into 4 broad categories:
- Marketing and website analytics
- Marketing attribution
- Journeys analytics
- Visitor identification.
As Amplitude begins to dip its toes into website analytics, it makes sense to compare the two solutions. Here's a breakdown of thei common features:
Amplitude vs Factors.ai: Comparing Common Features
1. Website Analytics
As discussed, Amplitude is primarily a product analytics platform while Factors.ai specializes in marketing and web analytics. However, since both solutions rely on event-based analytics, a comparison makes sense.
1. Data
On paper, Amplitude offers a wider range of integrations than Factors. That being said, most of these integrations are geared towards product analytics use-cases.
As a result, Amplitude’s integration with ad platforms (Google, Linkedin, etc) and CRMs (HubSpot, SalesForce, etc) tends to be limited. In turn, Amplitude’s functionality as a website analytics platform comes into question.
For instance, Amplitude cannot stitch website data with CRM data such as lead stages (MQLs, SQLs, etc), offline events (sales calls, emails, etc), or revenue figures (deal size, LCV, etc). Instead, Amplitude users are limited to website analytics that’s in isolation to the rest of the buyer journey. As B2B marketing teams become increasingly responsible for driving bottom line metrics, siloed website data is a serious limitation.
Factors integrates with ad platforms, CRMs, and CDPs. As a result, it’s capable of linking website touchpoints, campaign data, and CRM events for holistic analytics and reporting.
2. Metrics & KPIs
Businesses rely on a wide range of metrics to measure website performance and guide the decision-making process. Standard metrics like bounce rates and monthly visitors are available on both Factors and Amplitude. However, granular metrics like scroll depth or engagement rates become tedious to configure on the latter.
Given that Factors.ai is designed for B2B website analytics, it offers the ability to track a wide range of KPIs and metrics out-of-the-box. Furthermore, creating custom KPIs is easier on Factors, involving zero developer dependency.

Overall, both Amplitude and Factors do a good job of basic website analytics and reporting. But if you’re really trying to identify visitor behavior, track top-performing content, and drive BoFu conversions — Factors is probably the better choice.
2. Funnels
In short, a funnel is a sequence of steps taken by users across campaigns, website, CRM, and product. Here’s a funnel of prospects visiting the pricing page, submitting a demo form, qualifying as an SQL, creating an opportunity, and closing the deal:
Even before trying its hand at marketing and website analytics, Amplitude delivered powerful funnels for product analytics. With Amplitude, product teams can learn how to improve onboarding, see how customers progress from free plans to paid ones & more.
Amplitude is now offering a similar, event-based funnel feature for websites. At the moment, Amplitude provides more room for funnel configurations and breakdowns as compared to Factors.
Factors is on par with Amplitude for most B2B funnel use-cases. That being said, Amplitude offers a few advanced functionalities that Factors doesn’t. For example only Amplitude can exclude specific events between funnel steps and compare multiple events at a single step.

Note that while Amplitude’s funnel capability is more flushed out than Factors, it is unable to bring in CRM data. As a result, Amplitude cannot create funnels across website and CRM events.
For instance, Amplitude and Factors can create the following funnel:
Homepage -> Pricing page -> Features page -> Newsletter signup -> Demo request
But only Factors can create a funnel to visualize this journey:
Homepage -> Demo request -> Opportunity created -> Deal created -> Deal won

Amplitude’s funnel is mature and better suited to product teams. Factors’ funnel showcases the wider picture and is better suited to GTM teams.
3. Path Analysis
In short, path analysis or Pathfinder helps track aggregated customer flows across website and product. It helps map out events fired by users as well as the sequence of those events taken by users within a specific time period.

Pathfinder is a core feature in Amplitude. As a result, it's currently better than Factors’ path analysis in terms of refinement and functionality. Given that path analysis is a recent feature on Factors, it’s a matter of time before both tools are on par with each other.
4. Marketing Attribution
In short, B2B marketing attribution is an analytics technique that measures the influence of various marketing touchpoints on desired conversion goals such as demos, pipeline, and revenue using a range of multi-touch attribution models.
While Amplitude is a well-established brand in product analytics, it’s only just entering the marketing attribution space. Unlike Amplitude, marketing attribution has always been a cornerstone feature for Factors.ai. Given that this is Factors’ expertise, it outperforms Amplitude comprehensively when it comes to marketing attribution.
Here are a few limitations with Amplitude’s marketing attribution that Factors solves for:
- Limited conversion milestones: As previously discussed, Amplitude cannot integrate with CRM data for marketing attribution. As a result, conversion milestones are limited to website events such as page views or form submissions. It is not possible to attribute marketing’s influence on key metrics like SQLs, pipeline, or deals using Amplitude. This makes for highly ineffective attribution for B2B marketing teams that are looking to prove their impact on revenue.
- No revenue attribution: Continuing with the previous point, Amplitude cannot attribute marketing touchpoints to revenue/spend metrics like ad spends, deals closed, deal size, etc. Given that a major use-case for B2B marketers is to measure ROI and improve resource allocation, this limitation hinders Amplitude’s attribution functionality in B2B settings.
- No account-level attribution: Amplitude’s attribution is at a user-level as opposed to at an account-level. Unlike B2C transactions, B2B deals involve lengthy sales cycles and several stakeholders from a single buying account. Naturally, it makes sense to attribute marketing touch-points at an account level rather than by individual users. Since Amplitude does not support account-level analytics, its attribution tool remains largely ineffective for B2B teams.
- Limited granularity: At the moment, Amplitude can attribute marketing channels and campaigns to website events. No doubt, having high level data at a channel and campaign level is helpful. However, in order to really optimize marketing ROI and scale the right efforts, it’s essential to have granular attribution at an ad group and keyword level as well. Currently, this is not supported by Amplitude.
- Limited touchpoints: Currently, Amplitude’s attribution modeling only considers paid ads and digital marketing touchpoints. Factors has the ability to attribute conversions to offline touchpoints such as events, webinars, and sales calls. This is a crucial piece of the puzzle for B2B marketers.

Factors counters each of these limitations by delivering multi-touch attribution across keywords, ad groups, campaigns, channels, website, and CRM events at an account-level. All in all, Factors is the better choice when it comes to B2B marketing attribution.

So what’s the right tool for you? The answer depends on what you’re looking for. To break it down further, here are a few pointers on what each platform does that the other doesn’t.
What Amplitude Does, That Factors Doesn't
- Product analytics: As discussed at the top of the article, Amplitude is a leading product analytics tool with exceptional retention analytics and cohort analytics. If these use-cases are important to you, look no further than Amplitude.
- Mobile analytics: Amplitude is capable of tracking event-level data on mobile (app-based) products as well. Since Factors focuses on web-based event analytics, it cannot analyze mobile events whatsoever.
- Experiments (A/B testing): Amplitude offers Amplitude Experiments to conduct A/B testing within the product and website. This is a valuable feature for product and design teams to test hypotheses on messaging, product features, and design.
- CDP: Amplitude provides a native customer data platform. The CDP helps improve data quality, identify new audiences, and connect behavioral data. At the moment, Factors can integrate with third-party CDPs like Segment for similar use-cases.

What Factors Does, That Amplitude Doesn’t
- Integrates marketing, CRM, and revenue data: This point has been discussed multiple times in this blog but it’s worth highlighting again. Unlike Amplitude, Factors can easily integrate data across ad campaigns, website, and CRM. This empowers holistic marketing analytics, funnels, and attribution rather than siloed web and product analytics.
- Intuitive UI & low-lift implementation: Any analytics tool involves a learning curve. That being said, Factors is significantly easier to implement and use as compared to Amplitude. Onboarding takes minutes as opposed to weeks or months. The platform is far more user-friendly for non-technical GTM teams to create relevant reports and dashboards.
- Anonymous visitor identification (IP-lookup): A stand-out feature offered by Factors.ai is anonymous visitor identification. In short, Factors uses reverse IP-lookup technology to identify companies visiting your website without requiring the visitor to submit contact information. This is especially valuable to B2B companies looking to identify, track, and convert high-intent accounts that are already visiting the site.
- Automated AI-fueled insights: Factors’ AI-algorithm works to provide intuitive automated insights into what’s helping and hurting custom conversion goals. With Explain and Weekly Insights, teams can drill down into how keywords, campaigns, channels, website content, and offline events are influencing objectives such as increasing traffic, booking demos, ramping up newsletter subscriptions, or driving pipeline.


So What’s the Right Tool For You?
This is the primary consideration when deciding between Amplitude and Factors — are you looking to monitor and improve your product? If so, Amplitude is the better choice. Are you a B2B team looking to monitor and optimize GTM performance? If so, Factors probably makes more sense.
In summary...
Still on the fence about which tool may be better suited to you? See Factors in action over a quick demo
Compare Factors.ai with other tools:
Both platforms deliver powerful insights but serve different analytical needs.
1. Amplitude: Focuses on product analytics, tracking in-app user behavior and engagement.
2. Factors: Specializes in marketing analytics, with features for campaign tracking and revenue attribution.
3. Strategic Fit: Choose based on whether your priority is product usage insights or marketing performance optimization.
Understanding your team’s goals helps select the platform that drives actionable, data-driven decisions.

How CMO Responsibilities are Evolving in the Age of Data Analytics and Visualization
Remember the days when the role of marketing was limited to promotions, campaigns, and branding? Because we…don't 😅. Marketing has evolved into an all-encompassing function that covers everything from demand generation and sales enablement to CX and pipeline growth.
And at the helm of all this? The Chief Marketing Officer.
CMOs today are responsible for far more than just creative strategy. In addition to leading traditional marketing functions, It’s essential for CMOs to stay on top of product-market fit, consumer trends, competitive landscapes, and marketing’s bottom-line impact on revenue.
And none of this would be possible without data.
In fact, 64% of marketing executives strongly agree that data-driven marketing is crucial to business success. But how exactly is data, analytics and visualization influencing (and even improving!) the responsibilities of a CMO?
This article highlights everything you need to know about the evolution of CMO responsibilities and the profound impact of data and technology on the marketing function.

Understanding The Current State Of CMO Responsibilities
Data and technology has transformed the current state of CMO roles and responsibilities. Here’s how:
Intuition can only take you so far
In the past, CMOs relied heavily on intuition and creative judgment to form strategies that may or may not work. These decisions were based on personal experience, high-level market trends, and subjective industry knowledge.

Now, CMOs work with data-driven insights to guide their decision making process. No doubt, intuition and personal judgment still play an important role in successful marketing. But it certainly helps to back up a hypothesis with hard-hitting numbers.
As businesses increasingly become digital-first, collecting relevant data across the customer journey has become far more accessible. Marketing leaders can leverage this data to drive results across brand strategy, customer acquisition, and retention by understanding what works and what doesn’t.
In addition to validating decisions, data-driven marketing also encourages dynamism and adaptability within various marketing functions. Experiments that would otherwise take months to produce results can be answered in a matter of days with journey analytics, heat maps, and A/B testing. This results in an agile, hyper-efficient marketing function that’s primed to optimize ROI and drive growth.
Data delights marketers & customers alike
Just as data and analytics benefits marketers, so does it benefit buyers and the overall customer experience. Back in the day, marketing teams had very little information to work with. CMOs had no choice but to make broad assumptions and rely on spray & pray tactics to attract buyers.
For one, targeting a wide audience with generic messaging can be expensive for smaller teams with limited budgets. Secondly, it can be ineffective (and annoying to customers) given that broad messaging that tries to appeal to everyone, generally appeals to no one.

Today, CMOs can use cutting-edge visitor identification technology, account scoring, and intent data to specifically target sales-ready buyers with relevant marketing initiatives. This improves the buying experience for customers by swapping spammy email blasts and cold calls with personalized initiatives for the right accounts at the right time. Ultimately, this personalized marketing bolsters brand perception, improves conversions with fewer resources, and drives customer lifetime value — which is far more cost-effective than acquiring new customers.
The more things change, the more they stay the same
Since the days of David Ogilvy, driving sales has been the north star for marketing. This, most definitely, hasn’t changed. That being said, the accuracy and granularity with which we can measure marketing's impact on revenue has improved dramatically in recent years.

Gone are the days of tedious, unintuitive marketing reporting. Several plug and play solutions can automatically consolidate marketing and revenue data across campaigns, content, website, CRM, and more under one roof. As we’ll see in later sections, this unified data can then be used for further analysis, visualization, and dashboarding.
It’s also easier than ever to quantify the influence of every customer touchpoint on pipeline and revenue with sophisticated tools like multi-touch attribution. All this, to help CMOs’ prove and improve marketing’s impact on sales.
How Is The Data Boom Shaping The World Of Marketing?
Now that we’ve established the importance of data and analytics, let’s explore a few data-based tools and techniques that CMOs can leverage to drive ROI and shape marketing strategy:
1. Customer Segmentation & Personalization
Customers, especially B2B ones, expect a personalized experience at every turn of the buyer journey. For instance, if you’re a CMO, you likely receive dozens of cold emails every week — but only respond to, if any, the well-researched, personalized mails that are actually relevant to you. It’s no different with any other buyer.

Customer segmentation allows marketers to slice and dice their audience based on firmographics (revenue range, head count, etc), technographics (techstack), and intent data (engagement, page views, etc). This in turns allows marketers to personalize their efforts and target high-intent buyers with tailor-made efforts. Less spam, better conversions: win, win!
2. Account Intelligence
B2B SaaS marketing teams invest heavily in driving relevant traffic to the company website. Unfortunately, even the most optimistic benchmarks find that only about 5% of website traffic actually convert through form submissions or sign ups. So is the remaining 95% of anonymous traffic simply taken to be potential pipeline down the drain? Well, until recently, yes 😳.
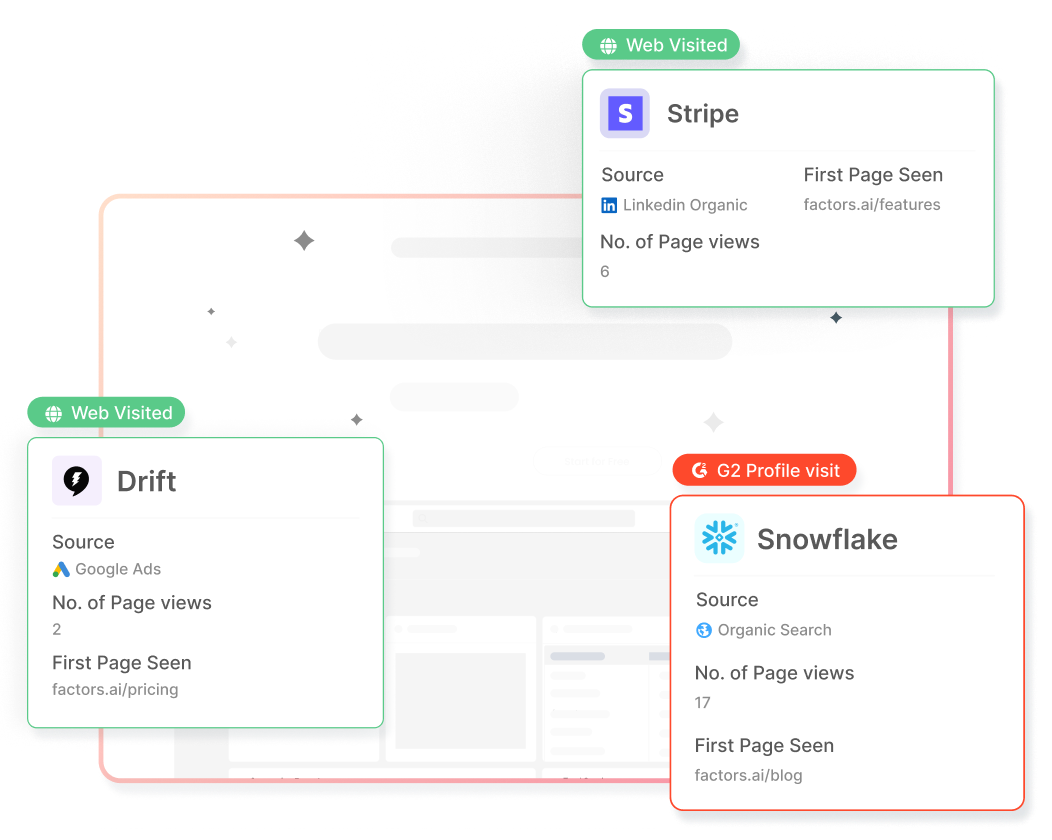
Now, with IP-lookup technology, marketing teams can tap into databases with millions of companies to identify accounts that are already visiting the website but are yet to convert.
How can CMOs and marketing teams use this?
- Optimize RoAS by retargeting accounts from paid ads who are yet to sign-up.
- Know in real-time when target accounts are live on the site, to strike while the iron’s hot
- Run relevant marketing efforts based on what target accounts are engaging with.
3. A/B Testing & Heatmaps
“What would work better on this landing page: Headline A or Headline B?”
Questions like this are exactly what A/B testing tools help answer with practical data. Rather than relying on individual judgment or biased surveys, A/B testing showcases multiple versions of a web page, creative, etc to a particular audience. Based on real-life performance, A/B testing can reveal what works better very quickly.
Heat maps are also valuable in identifying what visitors or users are engaging with within your website. This provides insight into points of resonance and friction for the target audience.
4. Customer Journey Mapping
B2B customer journeys have always been lengthy, nonlinear, and complex. To solve for this, several solutions (including Factors.ai) can help unify and visualize various touchpoints along the journey in an intuitive manner. This helps CMOs achieve a bird’s eye view of the entire buying process from first visit, to sales engagement, all the way to deal closure.

5. Multi-Touch Attribution
As businesses embrace digital transformation, CMOs and marketing teams are increasingly adopting multi/omni-channel marketing to deliver a consistent, persuasive experience to online buyers. Marketing channels range from search ads, email marketing, social media, organic blogs, marketplaces, and more.
Without making sense of the numbers, it can be difficult to know which of these channels actually influenced conversions. Multi-touch attribution is a sophisticated analytics technique that collects and credits every touch point along a customer journey based on its relative influence on conversions.

All the tools and analytics techniques discussed above rely crucially on data. The more voluminous and accurate your database, the more valuable the insights will be. The following section discusses a few practices for CMOs to make the most of their data.
Fulfilling CMO Responsibilities In The Age Of Data Analytics & Visualization
Here are a few key practices for CMOs to reap the benefits of data and analytics tools.
1. Build a culture around data
As previously mentioned, none of the tools or techniques discussed in preceding sections would be possible without data. It’s essential for CMOs to create a strong, unequivocal culture around data-driven marketing — whether it be maintaining hygienic CRMs or qualifying a hypothesis with data-backed experiments.
It’s also just as important to eliminate siloed data by unifying numbers and KPIs under one roof. This ensures that the entire department, if not organization, is on the same page.

2. Pick the right tools
Every marketing department is built different. CMOs must invest in appropriate tools and marketing technologies to support their team based on size, scale, and objectives. For example, heatmaps or attribution tools may not be essential to a smaller team that are just starting out. On the other hand, visitor identification, customer segmentation, and dashboarding tools can provide significant ROI for early-stage teams with limited budgets.
In addition to functionality, here are a few more aspects to consider when investing in a martech tool:
3. Create relevant dashboards
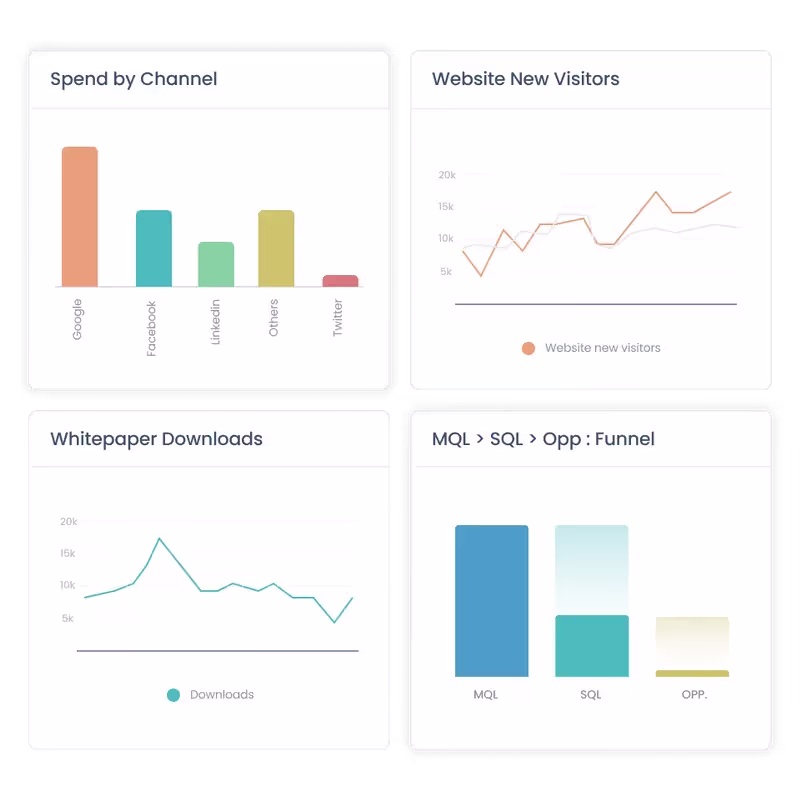
It’s definitely not feasible (or recommended) for CMOs to stay on top of every little marketing effort that the team’s working on. Instead, CMOs may rely on a bird eye’s view to guide strategy and improve performance at a higher level. CMO dashboards offer an intuitive view of all things marketing at a quick glance.
Suggested reading: The complete guide to building a SaaS CMO dashboard

Based on the nature of your business, your CMO dashboard may reflect marketing spends, marketing sourced-pipeline by channel, MQLs generated by campaign, and other high-level marketing KPIs. You definitely don’t need to be bogged down by CTRs and likes, unless otherwise there’s a true anomaly in performance.
4. Ensure privacy compliance
Lastly, in an increasingly privacy-first digital ecosystem, it’s important to ensure privacy compliance with all the tools and technologies that associate with customer data. SOC2 Type II and GDPR are industry-standard security frameworks that you should look for in every data-based product you’re considering investing in. (Psst…Factors is SOC2 Type II, GDPR, PECR, and CCPA compliant)

How CMOs Can Take Marketing Data From Insights To Impact
Before concluding this article, here’s a quick highlight of the profound value that data can have on influencing and improving CMO responsibilities in this digital age.
- Optimize spends: Rather than relying on guestwork, CMOs can confidently allocate spend towards initiatives that work. This results in less marketing leakage all around.
- Real-time decision-making: Rather than relying on intuition alone or waiting several weeks, CMOs can take a glance at a dashboard to make quick, data-driven decisions.
- Drive marketing ROI: CMOs may adopt powerful tools like attribution to understand what works when. This results in the efficient allocation of resources and maximum ROI.
- Reduce CAC: With the right set of data, marketers can personalize targeting and improve conversion rates with less spend. This, in turn, reduces the cost of acquiring customers and even improves the overall LTV of customers.
- Prove marketing impact: Finally, marketing data and data-leveraging tools help CMOs quantify the impact of marketing on bottom-line business objectives like pipeline & growth.
And there you have it. We’ve seen how data has well and truly disrupted the role and responsibilities of a CMOs. Luckily, it's only for the better. CMO responsibilities have transcended creative strategy to encompass a wide range of bottom-line objectives — all of which can be turbocharged with the right data analytics tools and technologies.
Curious to see how Factors help CMOs drive marketing results and business growth? We’d be happy to have a quick chat!
CMOs play a critical role in shaping business success through integrated marketing leadership.
1. Core Responsibilities: Strategic planning, brand oversight, and aligning marketing with business goals.
2. Key Functions: Lead campaigns, analyze market trends, and drive data-informed decisions.
3. Strategic Impact: Foster collaboration across departments to boost performance and long-term growth.
Effective CMOs bridge vision and execution, ensuring marketing fuels measurable business outcomes.

Linkedin Ads For Early-Stage Teams: Framework & Priorities
With over 750 million users, LinkedIn is by far the largest professional network in the world.
What started off as a simple platform for like-minded business people to connect, has transformed into a social media behemoth. Today, LinkedIn offers everything from algorithmic news feeds, LinkedIn groups, live streaming, and of course, a wide range of advertising mechanisms.
What does this mean for us B2B marketers? Opportunity.
LinkedIn’s massive database of professionals, companies, and industries may be leveraged by marketers to reach out to the right audience with the right message and drive high-quality opportunities.
But there’s no hiding behind the fact that paid marketing on Linkedin can be expensive and competitive — especially for Seed/Series A companies looking to make limited budgets go a long way.
As a result, early-stage teams generally prefer spending on Search Ads over LinkedIn. The former is believed to drive more high-intent leads and in turn, better return on ad spend. Conversely, LinkedIn is thought to be better suited to bigger companies for expensive, top of the funnel branding campaigns.
This is not necessarily true.
When executed well, LinkedIn ads can be an effective channel to generate high-quality leads and bottom-of-the-funnel pipeline — even for smaller teams. This chapter of our no-nonsense guide explores the Linkedin ads framework we’ve crafted over months of wins, mistakes & learnings as an early-stage start-up.
We won’t be discussing the basics of Linkedin Ads given that there’s loads of resources available on this as is. Instead, you can expect to find practical guidelines to pick off low-hanging fruit and drive RoAS.
Linkedin Ads For Series A: Framework & Priorities
Quick results with limited spend and minimal effort is at the core of our LinkedIn ads framework. With that in mind, we suggest using LinkedIn ads to target the following audiences:
- Retarget prospects that are already engaging with your company
- Target customers of your competitors
- Target top of the funnel ICP audience with ABM
Given that not all accounts are equally likely to convert, It’s important to prioritize the right set of audiences. Here’s an order of priority we’ve been seeing growing success with:
1. Your first priority should be to retarget accounts that are already interacting with your brand — visiting high-intent pages, engaging with G2 reviews, or viewing previous LinkedIn ads. Given that these accounts already know about your product/company in some capacity, we can safely assume that they’re problem, solution AND brand aware.
This audience is at a stage where they’re researching solutions (including yours!) to solve a challenge that they’re actively facing. This set can also include lost and churned accounts that have returned to engage with your brand.
In short, this audience is relatively further along the sales funnel and accordingly, will require the least effort (and spend 😉) to convert.
2. Next, look to target customers of your competitors. While this set of audience may not be aware of your brand, they’re certainly aware of the problem and are in fact already using an alternate solution. This implies that they’re ready to buy and may consider switching to your solution if it’s a better fit. In terms of ideal customer profile, it doesn't get much better than this. Use sales intelligence tools like Builtwith or Slintel to generate competitor customer lists.
3. Finally, target your general ICP audience with account-based marketing (ABM). This consists of the set of accounts that fit your ideal customer profile criteria (based on size, industry, revenue range, technographics, etc). Although this set of audience would make great customers, they’re unaware of your brand as well as the problem your product is solving for. Accordingly, these accounts will require the most effort (and spend) to convert.
With this priority framework established, let’s explore how to build these audience lists, run ads that convert, and optimize paid LI ads.
I. Build Audience Lists
For Retargeting…
Here’s a 3 step process on creating an audience list for LinkedIn retargeting
Step 1. Identify accounts from your website, reviews, and ad impressions

Use LinkedIn’s website tracking pixel in tandem with IP-based account identification tools to discover anonymous companies engaging with your website, G2 reviews, and previous LinkedIn ads.
Tactical Tips: LinkedIn’s website tracking pixel is limited to the number of visitors who actually accept cookies upon landing. This may be an issue for smaller teams with limited traffic because visitors accept cookies only 11% of the time. This may dramatically shrink your audience list. Luckily, there’s a quick fix:
Use an “opt-out” cookie policy instead of an “opt-in” policy everywhere outside the EU to have cookies accepted by default. Both policies are privacy compliant outside the EU, but an “opt-out” policy will result in far more accounts identified by the LinkedIn pixel.

Step 2. Filter down your targets
Depending on the size of your website, you may identify hundreds or thousands of unique accounts every week. It’s probably unrealistic to go after each and every one of them. Instead, refine your list by only targeting accounts that visit high-intent pages (Pricing, Landing pages, Comparison blogs, G2 reviews etc) and fit your ideal client profile based on geography, industry, technographic, revenue range, etc. Once complete, you’ll be left with a list of high-fit, high-intent ICP accounts.

Tactical tips: In order to launch a campaign on LinkedIn, you must target at least 1,000 members. (Or 300 members, with Matched Audience — but we strongly discourage the use of MA). Given that you’re likely targeting multiple people from the same company, a final list of 500 accounts is a good starting point.
3. Build a target member list:
At this stage, we have a brand-aware and possibly in-market set of ICP accounts ready for targeting. Use a sales intelligence tool like Apollo, Zoominfo, or LinkedIn Sales Navigator to create a list of at least 1,000 relevant members to target based on their roles, seniority, etc.
Tactical tips: We find that it’s valuable to create awareness across the entire company you’re targeting. Accordingly, we strongly recommend targeting at least 2-3 employees from every account: final users, their managers, and the final purchase decision makers.
For Competitor Customers & ABM
The process for creating audience lists in these cases is straightforward. Skip straight to building target member lists using sales intelligence tools like Builtwith, Zoominfo, Slintel, etc. Construct lists of competitor customers and ICP accounts by apply the right filters (technographics, firmographics, roles) so you’re left with the right contacts from the right companies.

Now, we’re all set to run highly targeted ads that drive conversions.
II. Run ad campaigns
At this stage, we have a primed list of high-fit, high-intent audience fit for targeting. It's safe to assume that every member we’re targeting would find the product/service we’re marketing to be, at the very least relevant, if not of explicit interest to them.
So now, we run great ads! Here are a few point to keep in mind:
Define objectives
The objective and approach of your LinkedIn ads should differ based on the audience you’re targeting. For instance, retargeting ads should look to convert brand-aware accounts and accordingly can be far more direct as compared to ABM ads targeted towards brand-unaware accounts. Here’s how to think about it:
With retargeting ads, ads you’re targeting members that have already visited your website, interacted with your review pages, or viewed a previous ad. We needn’t create brand awareness from scratch. Instead, we should aim for these ads to generate sign-ups. Accordingly, use straightforward lead-gen forms instead of content assets or website redirects here. In this case, leads generated and conversion rate will be the two key objectives. You may also track cost per conversion and cost per lead. Targets for these will vary based on your budget and ACV.

Tactical tips: Keep the number of form fields to a minimum. Work mail and phone number are plenty.
With ads targeted towards competitors' customers and ICP audience in general, it’s better to use a 2-stage funnel: the first stage involves running comparison ads or branding ads to create awareness about your solution. The second stage involves converting target accounts with standard lead gen forms. While this is a more elaborate process than a simple lead gen form, it’s sure to drive better conversions as the target audience will be aware of your work, and thus more likely to submit a form.

Make a mark with messaging
You do not want to run pesky ads and have people mute your campaigns. It’s vital to incorporate customer research into your ad copy and designs to capture positive attention. Even little things like line breaks and emojis can make or break your campaign.

Remember to sell on every element of the ad: the intro text,headline, in-image text, description, etc. Most users won’t consume every part of the ad in its entirety — so ensure that each element is persuasive in its own right:

Depending on the target audience, you’ll want to use different messaging. The two examples shared above are relatively more direct with a clear objective — “let us give you a free trial”. This will probably be better suited to retargeting campaigns.
{{LINKEDIN_BANNER}}
For ads targeted towards competitors, however, comparative ad creatives are likely to perform better. That being said, it’s also important to stay on the right side of the law and respect copyright and trademark policies. Here are a few competitor ad creatives we’ve found success with:


Experiment. Experiment. Experiment.
Continue to experiment with different ad formats, messaging, and creatives until you identify what clicks. Here are a few examples of ads we’ve found success with:
1. Testimonial ads:

2. Before/After ads:

3. Ads with a hook or questions:

And there you have it! Advertising on LinkedIn, when done right, can be a highly effective channel to drive pipeline and revenue. To conclude, here are a few common mistakes to avoid while running LinkedIn ads:
- When using LinkedIn targeting, ensure that job titles are set in inverted commas so LinkedIn only targets users with those specific titles as opposed to related ones. Eg: ‘CMO’, ‘PMM’, etc.
- Do not use the audience network on LinkedIn as it generally targets irrelevant members resulting in wasted spends.
Maximize ROI by focusing on high-impact audience segments from the start.
1. Target Audiences: Engaged prospects (retargeting), competitors’ customers, and top-of-funnel ICPs.
2. Approach: Use account-based marketing (ABM) to personalize outreach and boost relevance.
3. Strategic Benefits: Improve lead quality, optimize ad spend, and accelerate early growth.
A focused LinkedIn ads strategy helps early-stage teams scale smarter and drive meaningful results.
.webp)
A (non-exhaustive) list of limitations with GA4 [2022]
With GA4 here to stay, here’s why you might want to leave
[July 5th 2023 Update] As of this month, GA4 has been sunsetted. What's more? Sweden has recently announced a comprehensive ban of Google Analytics due to security concerns. The Swedish Authority for Privacy Protection has cautioned users against the use of GA as a result of privacy risks posed by the U.S. government. This makes Sweden one of several European nations to have elected to ban Google Analytics in recent months.
It’s official — on July 1st, 2023, GA4 will permanently replace Universal Analytics (GA3) as Google’s primary marketing analytics platform. While ga4 vs universal analytics (ua) is still hotly debated, the general verdict emerging within the marketing community is that ga4 falls short in several, fundamental aspects. Criticism ranges from ga4’s exceptionally unintuitive UI to limitations around ga4 events, event parameters, and reporting mechanisms. The following article lists out a few of these major drawbacks to highlight why it may be time for B2B marketers to consider ga4 alternatives.
I usually can find my way round any piece of software quickly. But Google Analytics 4 is making me cry...
I've never seen a tool upgrade that made simple things sooo complicated :face_palm: Non-tech business owners were already struggling to use it. But now they have NO chance.
Gill Andrews (@StoriesWithGill)
GA4 migration challenges
The most pressing issue with migrating to GA4 is that the platform is not ready for independent use as of yet. Several bugs continue to persist, third-party integrations are scarce, and many features, including core ones like internal filtering, continue to remain under development. To be fair, ga4 is likely to squash these issues by the time it's standardized in 2023. But at the moment, ga4 is a half baked product.
How to set-up GA4? Well, the logistics of migrating to ga4 isn’t all that straightforward either. While former universal analytics users have the option to upgrade for free, this facility is not available for all ua properties. Depending on your Google Tag Manager implementation, setting-up GA4 can take significant time and effort (depending on developer bandwidth) — in some cases, as long as a month!
Marketing analytics on GA4
Missing metrics and reports on GA4
A big change from UA to ga4 is the shift away from sessions and pageviews. Hit types like page views, social, transaction, use-timing, and more have been consolidated into a single measurement property on ga4 — events. Familiar metrics like average session duration and bounce rate have been stripped as well. The latter is an especially jaring loss because it’s a valuable metric for marketers to understand and compare landing page performance.
Standard reports have also taken a hit in google analytics update from UA to ga4. For instance, acquisition reporting on UA had as many as 30 standard reporting techniques. This included useful features such as traffic acquisition reports and source/medium reports. Unfortunately, ga4 has adopted only 10% (just 3) of its predecessors standard reports! One explanation for this is that ga4 is transitioning from a full fledged marketing analytics platform to a solution that enables you to capture and transport data elsewhere for further analysis.
Conversion tracking on GA4
Universal analytics offered 4 types of goals — session duration, page/sessions, destination, and event. Conversion goals could easily be configured, for example, a “thank you” page could be tagged as the destination to measure form-fill conversions, in a matter of seconds. Because ga4 misses out on this “destination” goal type, ga4 requires tedious, manual GTM configurations to set-up “form-fills” as a conversion goal. In fact, Zack Duncan from the Root and Branch Group found that it takes around 16 minutes (along with adequate knowledge of GTM) to configure submission tracking on GA4 (as compared to a minute on UA). This is a major limitation for B2B SaaS websites and marketers as a significant proportion of leads come through demo form fills.
Event collection on GA4
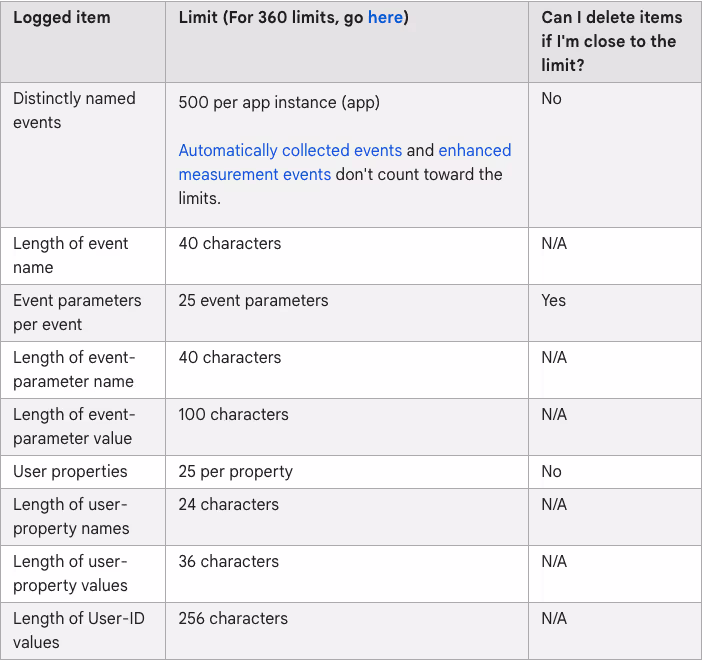
Other Ga4 mechanisms have also faced significant backlash for a couple of reasons. Let’s start with event collection limits. As a rule, ga4 will not log events, event parameters, and user properties that exceed these limits:
- Distinctly named events: 500 per app instance
- Event parameters per event: 25 event parameters only
- User properties: 25 properties only
While these limits may suffice for early-stage teams, event collection on ga4 will almost certainly become an issue once the organizations starts to scale and garner complex events on relatively high-traffic websites.
Character limits on GA4
What’s especially concerning is that on ga4, distinctly named events and user properties can not be deleted/updated if you’re close to hitting their limits. In addition, ga4 heavily restricts character length on event and user names and values. For example, ga4 will truncate page names to a maximum of 300 characters. So, if your landing page has a url longer than 300 characters (which is far from uncommon), it will consider only the first 300 characters and perform attribution and analytics based on that. This could also mean that the entirety of the UTM may not be sent to google analytics servers, which in turn means a significant loss in data.
Data sampling and Processing time on GA4
Credit where credit is due — ga4 has taken a big step in the right direction by eliminating data sampling for standard reports. The keyword here, however, is standard. Advanced reporting (explore, advertising, configure) on ga4 continues to sample data under certain conditions. These advanced reports include core techniques like funnel exploration, path exploration, user explorer and more.
A drawback of unsampled data analytics on ga4 is the processing time. Standard ga4 claims up to 24 hours of processing time for intraday reporting and as much as 48 hours for complex features like multi-channels funnels and attribution modeling. To put this in perspective, Factors.ai delivers standard reports near instantly and will require at most 24 hours (half that of ga4!) for multi-touch attribution reporting.
While on the topic of data, it’s worth mentioning that ga4 offers data-retention for up to 14 months only. What’s more? XL properties are limited to a measly 2 months! This can be of great hindrance to B2B SaaS marketing analytics — wherein customer journeys can easily stretch across a couple of years.
Custom events, properties, and dimensions on GA4
As of today, GA4 supports only 2 scopes for custom dimensions: event scopes and user scopes. This is two less than UA’s custom scopes which covered session and product dimensions as well. What’s worse is that the pair of custom dimensions offered on GA4 are heavily limited (even with GA360!). Here’s how the limits break down for standard GA4:
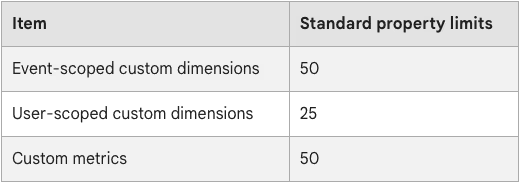
- Event-scoped custom dimensions: Max 50
- User-scoped custom dimensions: Max 25
- Custom metrics: Max 50
If you reach the ceiling on these custom dimensions, unfortunately your only option on ga4 is to archive infrequently used dimensions and hope for the best.
Google Analytics 4 (GA4) introduces a new interface and shifts away from Universal Analytics, creating challenges for teams adapting to the change.
1. Key Issues: Steep learning curve, limited functionality, and reduced cross-platform support.
2. Challenges for Users: Many teams are facing difficulties with GA4’s non-intuitive interface.
3. Strategic Move: Exploring alternatives that focus on ease of use and better integration can streamline analytics processes.
Adopting a more user-friendly analytics solution can help businesses maintain efficiency and data accuracy.
And there you have it…
This article explicitly covers a non-exhaustive list of shortcomings with GA4. Other concerns include useability, privacy-risks, lack of third-party integrations, and challenges at scale. While Google Analytics has dominated the marketing and web analytics space for years now (mostly because it’s a free tool), its limitations are starting to catch up with it. With dozens of robust Google Analytics alternatives emerging from the market, now is the time to replace ga.
Factors is an end-to-end marketing analytics and revenue attribution platform that goes above and beyond the likes of Google Analytics to help you make sense of (and optimize) your marketing efforts. Here’s how Factors compare to Google Analytics.
Interested in learning more? Book a personalized demo here!

Google Search Marketing in 2022: Keyword Matching
Search marketing with Google Ads is kinda cool. It helps users who are looking for specific information, products, or services connect with businesses looking to sell specific information, products or services — all through a wonderfully powerful, complex search engine. But how does search marketing work? More specifically, how does keyword matching work in the latest iteration of Google Ads? Let’s find out…
How does keyword matching work on Google Ads?
There are 7 steps involved in Google Search Ads to connect the right audience with the right message using keyword matching. Here’s how it works:
1. First, a user types a search query into Google. Google then processes this text against spell-checks, synonyms, and related terms to form what’s called the “retrieval query”. This retrieval query wrangles all relevant search ad keywords that could be served into a set.
2. From this set of keywords from the retrieval query, Google verifies eligibility based on keyword match type, campaign, ad group, etc. This is performed using advanced machine learning and natural language tech to understand and optimize matching for intent and relevance. Other factors considered by Google are budget, geo, negative keywords, creatives, landing page, time of day, etc.
3. When choosing from multiple eligible keywords from the same account (For example, if company X bids on both “B2B marketing analytics tools” and “B2B marketing analytics software”), Google will prioritize those keywords that are closer to being an exact match to the search term. So if a user searches “marketing analytics software”, they will receive the former search ad. Once filtered down, Google has its set of ad groups with eligible, relevant keywords.
4. With this set of ad groups containing eligible keywords, Google’s responsive search ads creative system will automatically rally the “best performing creative — including headline and description” for the user based relevance.
5. Next, we arrive at the stage wherein bids are calculated using Ad Rank. Ad Rank is a scoring system that assigns value to ads to determine if or not your ad will be presented to the audience. Of course, your bid amount is an important factor in determining Ad Rank as well.
6. Here, Google Ads chooses the optimal combination of ad relevance and ad rank. Once again, Google’s algorithm is looking for landing page quality and keywords in an ad group. The latter implies it’s highly important to group keywords by theme, to ensure favorability.
7. The final step is straightforward. Once Google Ads processes all the aforementioned information, each advertiser enters into auction and those advertisements with the highest Ad Rank (including and especially bid amounts) are displayed for your audience to see.
Keyword match types on Google Ads
As the name suggests, keyword matching matches words and phrases from the search ads you bid on to terms that people actually use when searching. Hence, it’s crucial to bid on the relevant keywords to ensure your ads align with what your audience is looking for. Google Ads offers three match types. The accuracy with which the keyword needs to match a user’s search query will be determined based on match type you choose:
1. [Exact match]
As you may have guessed, [Exact match] types require an exact match between the keyword and the search query. For example, if the keyword is “B2B marketing analytics”, only search queries that mean the same, like: “B2B marketing analytics software” or “B2B marketing analytics tools” will trigger the search ad.
2. “Phrase match”
Phrase matching is marginally less rigid than [Exact match] types. It essentially considers all searches wherein the primary keyword is part of a larger string of search text (i.e. a phrase). For example: “Best software for B2B marketing analytics”
3. Broad match
Broad match provides the most loose matching out of the three match types. It considers the exact keyword, phrases around the keyword and all related terms around the keyword. For example, Google may trigger an ad for the search term “B2B marketing attribution” because it's somewhat related to “marketing analytics” as well.
Note: In short, Exact match keywords are a subset of Phrase match keywords. And Phrase match keywords are a subset of Broad match keywords.
Broad Keyword Matching on Google Ads
Google Ads have increasingly been pushing Broad match types as their AI-algorithms continue to improve their understanding of language, intent, relevance, etc. In recent year, keyword matching on Google Ads has evolved from a pure syntax-matching system (wherein a user’s search query text simply matches an advertisers search ad keyword) to a semantics based system (wherein broadly related themes and topics are recognized as relevant enough inquiries to warrant the display of an indirectly relevant search ad). Here are some signals that broad match takes into consideration (in addition to exact keyword and phrases):
1. Other keywords in the ad group: Arguably the most important signal is relevance of other keywords within a specific ad group. For example, if the search term is “salmon sweaters” and your ad group consists of the keywords “orange sweaters”, “red sweaters” and “blue sweaters”, Google Ads will understand that in this case, salmon refers to the colour and not the fish.
2. Previous searches: Google Ads also takes into account a user's previous search when deciding what ad to present. For example, let’s say a user previously searches for “manchester city vs liverpool football score”. Google uses this historical data in the future so that simply searching “man city vs liverpool” will retrieve the football score without mention of either word.
3. User location: This one is straightforward. Google analyses user location to personalize search results. Eg: B2B SaaS marketing agencies based in New York vs B2B SaaS marketing agencies near me. This may or may not be as relevant to your marketing efforts depending on the type of product you’re selling. Still quite handy to be aware of.
4. Landing page: Last but most definitely not least is an ads landing page. Does the landing page contain relevant keywords? Does it contain quality content — including images and creatives, to ensure a valuable experience for the visitor? These are questions to keep in mind when constructing and improving upon your landing pages.
And there you have it! An overview into how keyword matching works on Google Ads.
Curious to learn how Google Analytics compares to Factors.ai? Read on here
Google’s 2022 update on keyword matching changes the way marketers approach search campaigns, with smarter targeting now essential for success.
1. Key Changes: Updates in keyword matching rules for more accurate targeting and better campaign structure.
2. Strategic Benefits: Enhanced targeting leads to smarter campaigns, better ROI, and more efficient ad spending.
3.Actionable Insight: Adapting to the new rules allows marketers to maintain performance and take advantage of improved match strategies.
By understanding and adjusting to these changes, marketers can optimize their search campaigns and boost overall returns.

