

Heading 2
Dreamdata vs. Hockeystack [2026]: Features, Pricing, Reviews & More
Compare Dreamdata vs HockeyStack by features, pricing, reviews, and more. Find the best B2B marketing attribution tool for you
Written by


.svg)


It’s no secret that the B2B SaaS funnel involves several touchpoints across campaigns, website, offline events, and CRM. Given that customer journeys are complex and nonlinear, measuring and optimizing marketing’s impact on revenue may seem like a daunting task. To solve for this, there’s been an influx of plug and play B2B marketing attribution and analytics tools in recent years.
While there’s no shortage of marketing attribution tools out there, each solution has its own unique set of features, strengths, and limitations. This blog compares two popular B2B marketing attribution tools — Dreamdata and Hockeystack — to help readers decide which solution may be better suited to their needs.
Note that this blog won’t cover the basics of what marketing attribution is. Instead, you can find a wide range of resources on marketing attribution here:
- A Comprehensive Guide To Marketing Attribution
- B2B Marketing Attribution
- Challenges With B2B Attribution (And How To Get Over Them)
About Dreamdata
Dreamdata is a Denmark-based B2B revenue attribution platform that works to connect and crunch revenue related data across the customer journey. At a high level, much like any other competent marketing analytics tool, Dreamdata helps teams identify what GTM effort drives revenue, where to cut costs, and how to scale the right campaigns.
As following sections highlight, Dreamdata provides a robust analytics suite, a wide-range of integrations, and a strong customer success experience. That being said, the platform seems to fall short when it comes to implementation, custom reporting and dashboarding, and ease of use. Each of these features and limitations are covered in detail below.
About HockeyStack
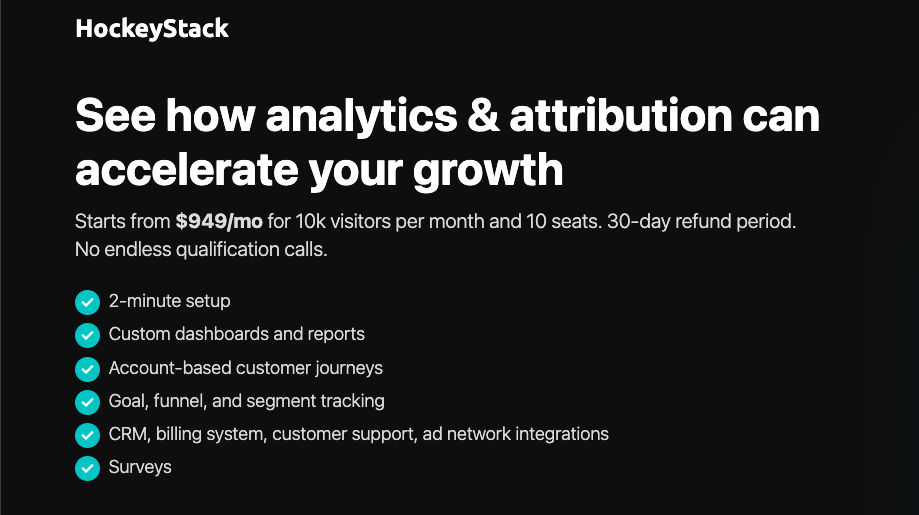
HockeyStack is a B2B analytics and attribution platform that helps teams track data across campaigns, website, and CRM to measure marketing ROI, view account-based intent signals, and improve budget allocation.
HockeyStack claims a rapid implementation process and customizable dashboards. That being said, HockeyStack offers fewer integrations and limited granularity when it comes to reporting. Again, each of these features and shortcomings are highlighted in detail below.
Dreamdata vs. HockeyStack: Key Features
Both Dreamdata and HockeyStack are effective marketing attribution tools in their own right — but no product is perfect. The next couple of sections examine key features, strengths and limitations of each solution. Naturally, there’s bound to be significant overlap; but the devil is in the details. After covering a few key common features, we explore where each platform outperforms the other.
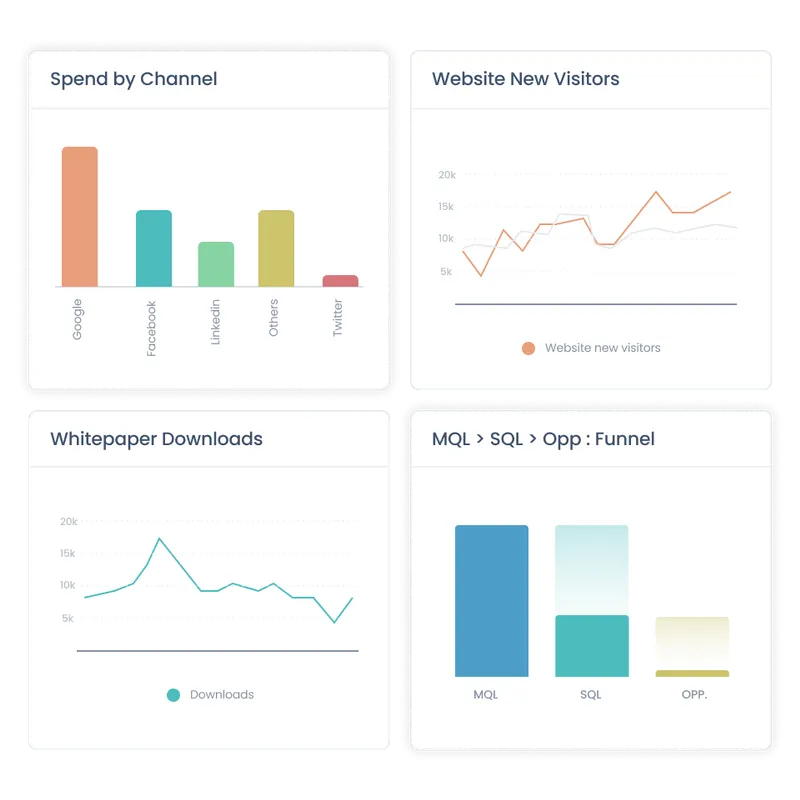
#1 Tracking & Analytics:
As most analytics solutions do, both Dreamdata and Hockeystack unify marketing and revenue data under one roof. Both tools also provide a wide range of analytics capabilities to help teams make well-informed decisions across campaigns, website, content, and more.
Both solutions employ javascript codes that are added to a website to track visitor interactions and engagement. They can measure standard website performance metrics like pageviews, scroll depth, clicks, form submissions, and more at an account and user level. In turn, teams can gauge customer behavior and learn how different content and webpages influence pipeline by cohort.
Dreamdata and HockeyStack also integrate with ad platforms, marketing automation platforms, and CRMs to consolidate campaign metrics, offline events, and revenue metrics. This helps marketing teams monitor their efforts and understand what’s helping or hurting bottom line conversions. Note that Dreamdata currently provides a wider range of integrations than HockeyStack — more on this later.
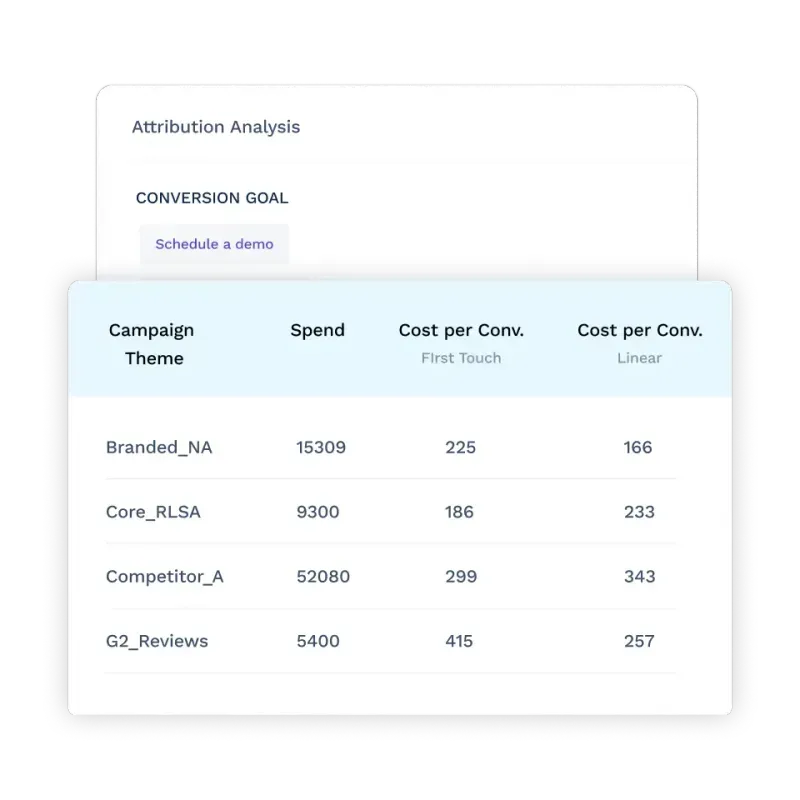
#2 Multi-touch attribution
Attribution analysis is at the core of Dreamdata and Hockeystack. Unsurprisingly, both solutions do a good job of measuring performance across marketing activities and attributing each touchpoint back to revenue.
They can stitch and credit measurable touchpoints across channels, campaigns, website, and offline events (from CRM) based on their influence on pipeline. Using a range of multi-touch attribution models, marketing teams can quantify their impact on revenue from first-touch to deal won at an account level. Here are a few use-cases multi-touch attribution on Dreamdata and Hockeystack can solve for:
- Measuring ROAS across ad campaigns
- Attributing revenue back to marketing channels
- Tracking the impact of organic social and SEO efforts
- Learning which content and channels drive bottom-line metrics
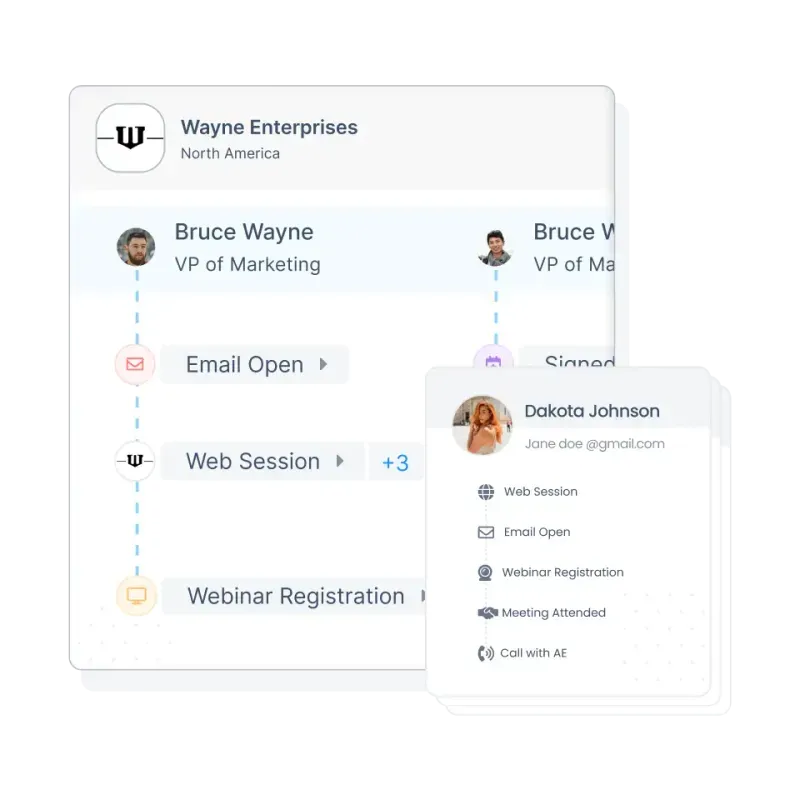
#3 Journeys
Journeys analytics is a relatively recent feature that’s not as common amongst other marketing analytics and attribution tools. That being said, both Dreamdata and HockeyStack offer variants of journey analytics.
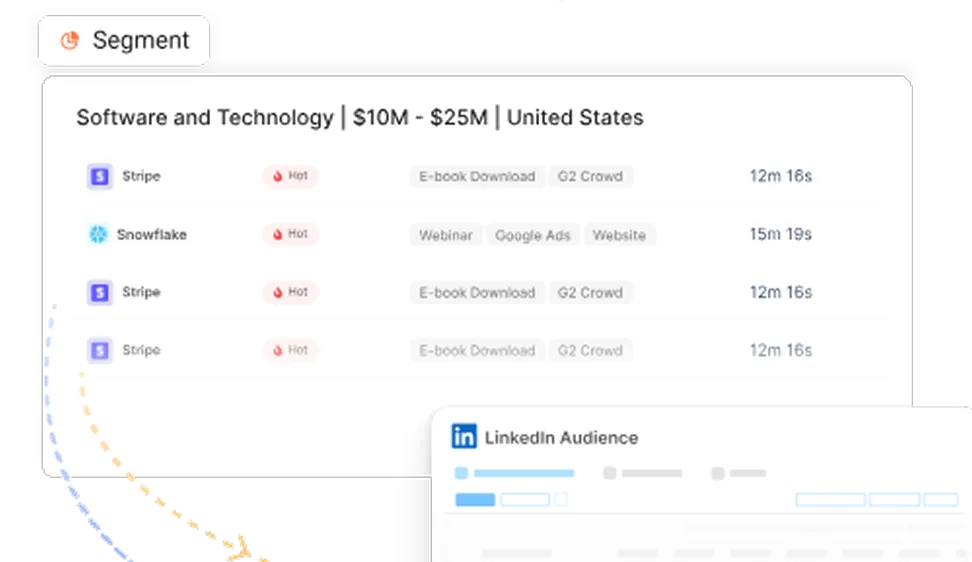
In short, journey analytics helps teams visualize complex, non-linear customer journeys by mapping each stakeholder’s touch-points at an account level. Why is this helpful? It provides an intuitive timeline of profiles, behavior, and intent across each account within the pipeline. This information may in turn be used to personalize further marketing efforts, optimize retargeting campaigns, customize sales pitches, and identify buying patterns.
HockeyStack and Dreamdata work well for all three features covered above. Still, both tools have their own strengths and limitations. The following section highlights stand-out reasons why users may prefer one over the other.
{{INLINE_BOFU}}
What Dreamdata Does Better
1. Out-of-the-box Integrations
Dreamdata offers a wider range of out-of-the-box integrations as compared to HockeyStack. While both solutions provide integrations with the most popular ad platforms, CRMs, MAPs, and CDPs, Dreamdata goes the extra mile to cater to relatively niche platforms and data warehouses as well.
Key integrations supported by Dreamdata and HockeyStack*: HubSpot, SalesForce, Google Ads, Facebook Ads, Linkedin Ads, Marketo, Pardot, Intercom, Segment
Key integrations supported by Dreamdata but not HockeyStack*: Zoho, G2, Zapier, Outreach, AdRoll, Google Data Studio, BigQuery
*based on HockeyStack website
Pro Tip: Note that in case Dreamdata and HockeyStack doesn’t support an integration for a specific platform, both tools offer custom integrations as per demand.
2. Detailed & Granular Reporting
Although this isn’t necessarily a drawback with HockeyStack, users have complained about its lack of granularity. Reviews compare HockeyStack’s reporting capabilities to that of Google Analytics (GA4) — decent, but not detailed enough. Given that Dreamdata is a relatively mature product, their reporting capabilities provide deeper insights across conversion rates, customer lifetime value, and revenue attribution, and more.

3. Customer Success
B2B analytics and attributions platforms are complex. While tools are becoming increasingly intuitive, it’s important for non-technical users to have easy access to timely, effective CSM. Fortunately, Dreamdata seems to support robust customer success servicing. This is especially valuable since Dreamdata’s implementation is reportedly an involved process.

4. Templatized Reporting + UI
This is a double edged sword. Dreamdata delivers a structured, non-customizable dashboard and event framework that offers little room for flexibility. Dashboards are broadly grouped into the following categories: Engagement, Content, Performance, Journeys and Revenue.
On one hand, this may be beneficial to smaller SaaS teams with limited technical resources as it’s likely to cater to most of their analytics and reporting needs.
However, as the business starts to scale, its requirements may include custom dashboards and events that are company-specific. At this point, Dreamdata’s templatized reporting may be a drawback.
Although reviews suggest that Dreamdata involves a steep learning curve, it’s fair to assume that its UI is a step ahead of HockeyStack. HockeyStack is a relatively younger product and users tend to find the platform a little rough around the edges. That being said, reviews also suggest that they’re showing quick improvement. It’s likely only a matter of time before both platforms are on par with each other.

What HockeyStack Does Better
1. Implementation
HockeyStack makes strong claims about its rapid implementation process, suggesting that users can onboard and get started in a matter of minutes. This is in stark contrast to Dreamdata, which, as a more sophisticated tool, requires an involved, drawn-out implementation process. HockeyStack’s intuitive onboarding is a big advantage to smaller teams that don’t have the resources for dedicated onboarding or maintenance support.

2. Custom Dashboards
Dreamdata’s platform focuses on solving the most common SaaS use-cases. As a result, the platform tends to be relatively less flexible. HockeyStack, on the other hand, promotes far more customizations across events, reports, dashboards, and visualizations. HockeyStack provides the option of preconfigured templates, but lets users build reports from scratch as well. While granularity may be lacking when compared to Dreamdata, this ability for flexible dashboarding may be helpful for teams looking for tailor-made, high-level reports.

3. Funnels, Surveys & Impression Tracking
Along with the key analytics and attribution features discussed, HockeyStack provides a few features that Dreamdata doesn't.
The most valuable of these features is probably Funnels. Funnels is a powerful analytics technique that helps users graphically visualize different stages of the sales cycle. These stages can be configured by users to, for example, see how website visitors are progressing from the home page, to the pricing page, and to a blog before scheduling a demo.
Surveys is another feature that, as the name suggests, allows users to create surveys for self attribution. Finally, Linkedin Impression Tracking is another nifty feature that enables users to identify companies viewing Linkedin campaigns.
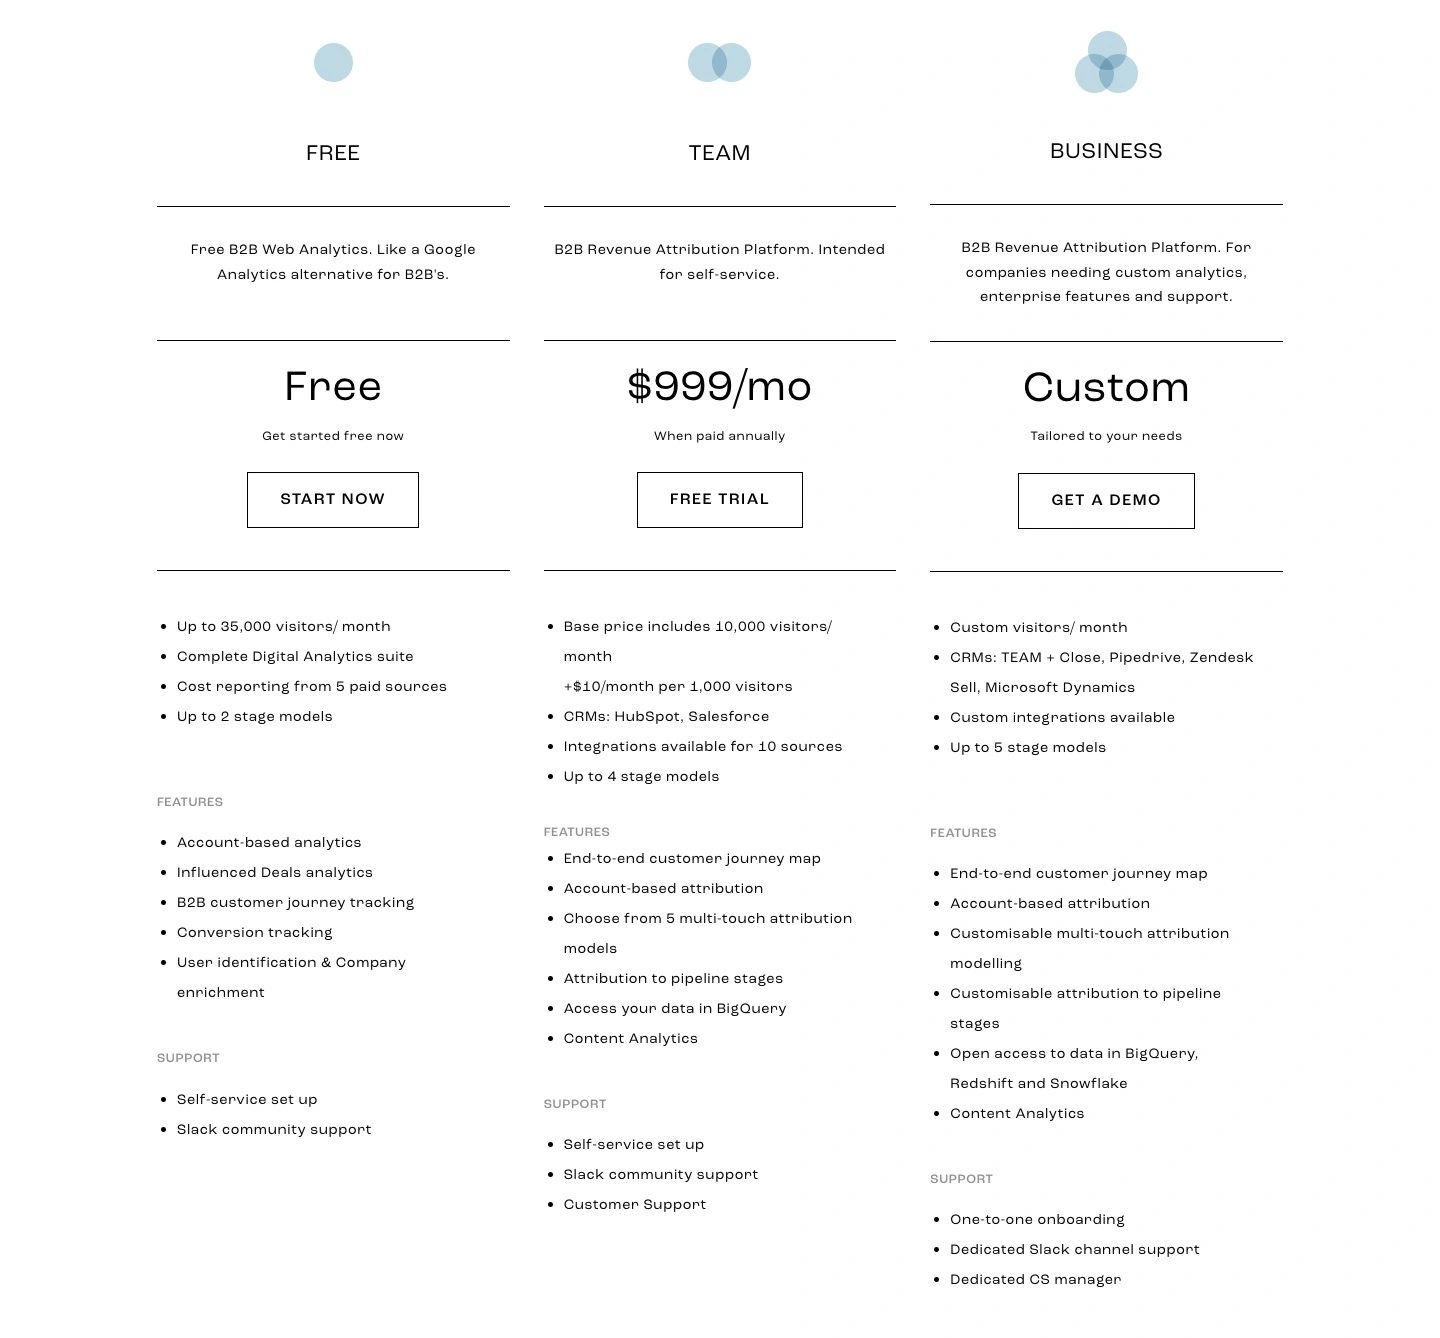
Dreamdata vs. HockeyStack: Pricing
[December 2023 Update]: Both HockeyStack and Dreamdata have revised pricing since this article was published. While HockeyStack have increased their starting price, Dreamdata have decreased theirs. Here's an updated rundown of pricing:
- Dreamdata pricing now starts at $599/mo for up to 30,000 MTUs
- HockeyStack pricing now starts at $1399/mo for up to 10,000 monthly visitors


[Pricing as of February 2023]
- Dreamdata’s paid plans start at $999/month for 10 seats and up to 10,000 MTUs
- HockeyStack’s paid plans start at $949/month for 10 seats and up to 10,000 monthly visitors
- HockeyStack offers a 14-day free trial
- Dreamdata offers a free web analytics tool as an alternative to Google Analytics
Still On The Fence About What B2B Attribution Tool To Go With?
And there you have it. A breakdown of Dreamdata and HockeyStack, and the reasons why one could be a better fit for you over the other. Still On The Fence About What B2B Attribution Tool To Go With? Here are a few reasons why you might want to consider Factors as well:
- Rapid, no-code integrations across ad platforms, CRM, MAP, and more
- Granular, end-to-end analytics, attribution, and journeys across ad campaigns, website content, offline events, organic content, and more
- Fully customizable events, properties, dimensions, and dashboard
- Dedicated customer success management
- Funnels, path analysis and website tracking
And…
- Website visitor identification
- AI-fueled conversion insights
- Real-time Slack alerts
- Cost-effective analytics pricing plans starting at $399/month
Dreamdata vs. HockeyStack – both are powerful B2B marketing attribution platforms, but they cater to different needs:
- Dreamdata is known for its advanced multi-touch attribution and deep third-party integrations, making it ideal for larger teams navigating long, complex sales cycles. However, it comes with a steeper learning curve, longer setup time, and limited dashboard customization.
- HockeyStack, on the other hand, is built for speed and flexibility. It offers quick implementation, highly customizable dashboards, funnel visualization, and even cookieless tracking, making it perfect for agile marketing teams needing fast, actionable insights.
Pricing Snapshot:
- Dreamdata: Starts at $999/month.
- HockeyStack: Offers a free tier, with paid plans starting at $99/month.
Enter Factors.ai – a game-changing platform that merges the best of both worlds. It combines multi-touch attribution, account intelligence, and workflow automation into a seamless experience. With Factors.ai, marketing teams can gain comprehensive insights, streamline operations, and drive revenue-focused decision-making with ease.

See how Factors can 2x your ROI
Boost your LinkedIn ROI in no time using data-driven insights
Try AdPilot Today


.avif)

.avif)
See Factors in action.
Schedule a personalized demo or sign up to get started for free
LinkedIn Marketing Partner
GDPR & SOC2 Type II

.svg)


.avif)