
Heading 2
Content Reporting: Tips and Best Practices to Create the Right Dashboards
Learn best industry practices in content reporting and how these can help your company maximize its content ROI
Written by
.avif)
Vrushti Oza
Content Marketer
Summarize this article


.svg)


Content managers spend the bulk of their time drawing up content briefs, editing email newsletters, and collaborating with marketing teams to ensure they set the right tone. Detailed content reporting on key metrics is essential for content managers to iterate and curate effectively going forward. This blog highlights the importance of content reporting as well as a few best practices to create relevant content dashboards.
What is content reporting?
Content marketers use content reporting to analyze the performance of their assets across website, organic channels, social media, syndication and more.
Modern content reporting eliminates the need for manual analysis. Instead of juggling between several unintuitive tools, marketers can use a unified, interactive dashboard to reflect holistic information about content performance.
This has the benefit of centralizing all your reporting and getting relevant insights to you in real-time. Metrics that content marketers keep track of to optimize their content performance include clickthrough rate (CTR), bounce rate, time on page, and website traffic through the identification of unique visitors.

Why is content reporting important?
It’s imperative for your content marketing team to create high-value content for your target audience. In order to do this, you have to understand how your target audience is responding to the content you’ve already put out. Once you figure out how different content resonates with different personas, you can create more content that is relevant to their journey at each stage of the funnel. Ultimately, this improves the customer experience and drives more conversions.
In a nutshell, content reporting helps marketers:
1. Understand which content performs well
Content makes up a significant proportion of any B2B company’s expenses. It’s important that you get the best results from the time and money your company puts into its marketing efforts. Dedicated content reporting based on metrics such as engagement (including time spent, scroll depth, bounce rate, and pageviews) or conversions (such as influenced demos and pipeline) gives you a keen idea of the type of content your target audience is looking for.
2. Measure the impact of content across the sales funnel
Marketing teams are increasingly being asked to tie their efforts back to pipeline and revenue. With comprehensive content analytics and reporting in place, marketers can connect the dots between distribution channels, assets, and bottom-line metrics.
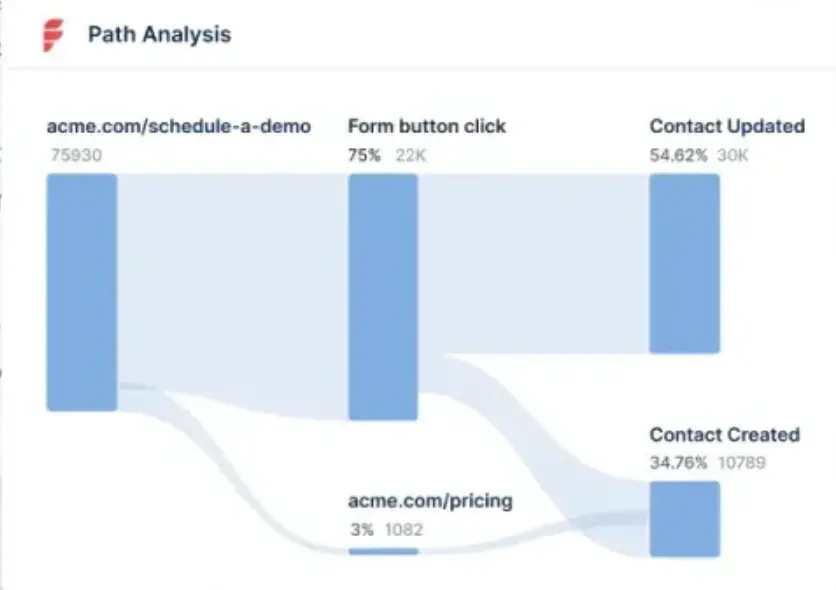
With path analysis and account journey mapping, marketers can pin-point how prospects are interacting with blogs, case-studies, white papers, etc before turning into MQLs, SQLs, and pipeline. With multi-touch attribution, marketers can determine which assets initially bring in top-of-the-funnel leads and which assets help influence the final conversion to paying customers.
Content analysis and reporting at this level helps prove content marketing’s impact on high level business objectives and improves content strategy by shedding light onto what works and what doesn't.
3. Streamline content production, distribution, and repurposing
Content reporting allows you to see what content provides value to your prospects when they’re at the bottom, middle, or top of the funnel respectively. You’ll therefore be able to streamline content production and offer prospects and clients content that’s relevant to them.
Your target audience’s needs are constantly evolving, though–which means your content also has to do the same. Dedicated content reporting will help you assess whether certain channels or posts are underperforming with respect to crucial content metrics. This information helps you know when you need to refresh your content. You can also see which content is performing well, so you can repurpose it for further use.
4. Optimize the process and minimize overheads
When you know which channels and content help to bring the most leads and conversions, you eliminate any shots in the dark about the conversion process.
You’ll be able to make more educated guesses about which marketing channels to invest in based on past trends. This allows you to cut down on marketing expenditure that doesn’t bring in results, and focus your energies towards high-value content creation and distribution on channels that will resonate with your target audience.
5. Understand what type of audience engages with each content piece
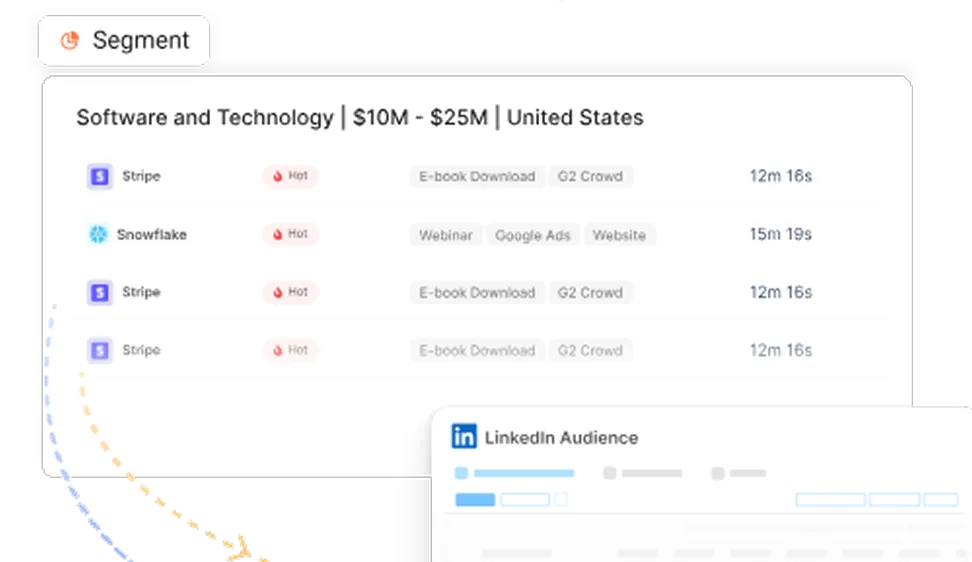
Content marketing teams often produce loads of ungated assets without actually knowing who the final consumer of their content is. Visitor identification tools like Factors.ai help identify anonymous accounts visiting the website — along with firmographics such as the visitor’s industry, employee headcount, and revenue range.
This provides unprecedented visibility for content marketers to gauge who their audience really is and what types of content appeal most to them. For example, maybe visitors from enterprise-level companies prefer content around security and privacy compliance. Early-stage start ups, on the other hand, may find content around pricing more relevant.
Visitor identification helps content marketers tailor assets towards their ideal audience and promote relevant content going forward.This, in turn, helps improve the odds of conversion along the customer journey.
What should you include in a content report?
Some metrics are more valuable than others when it comes to content reporting. Most free tools such as Google Analytics only provide the bare minimum to track content performance. This includes clicks, impressions, social-shares, and bounce rates. No doubt, these are useful metrics — but only when used in conjunction with other, granular KPIs, filters, and breakdowns.
For example, aggregate bounce rate on Google analytics is a metric that measures the number of visitors who drop off from a website after visiting a single page. In B2B, this is a remarkably ineffective metric unless broken down by B2B segment such as industry, revenue range and so on. Only then can marketers compare variations in bounce rates to discern how different assets influence different sets of audiences.
Your content team should employ tools that are able to measure metrics that industry experts recommend keeping track of for detailed content analysis. This includes:
- Scroll depth: The scroll depth is an engagement metric that encapsulates how deep a user scrolls down your landing page or blog content. Typically, a scroll depth of 50% or more means that your content is resonating with visitors.
- Conversion rate: The conversion rate represents the number of users who converted as a ratio of the total visitors to your website. If your product interests prospects, or your content addresses website visitors’ pain points, they are more likely to convert. Another version of this is the Marketing Qualified Lead (MQL) to Sales Qualified Lead (SQL) conversion rate.
- Impressions: Your impressions indicate how much engagement your content generates. This content could be anything: an article, a blog, or one of your web pages. The impressions metric helps you understand the performance of your social media and search engine marketing campaigns.
- Time on page: Like the scroll depth, the time a prospect spends on a web page or blog post indicates their interest in your service.
- Unique users: The number of visitors to your website can be challenging to calculate, since it’s essential that each unique visitor be counted only once, regardless of how often they visit your website.
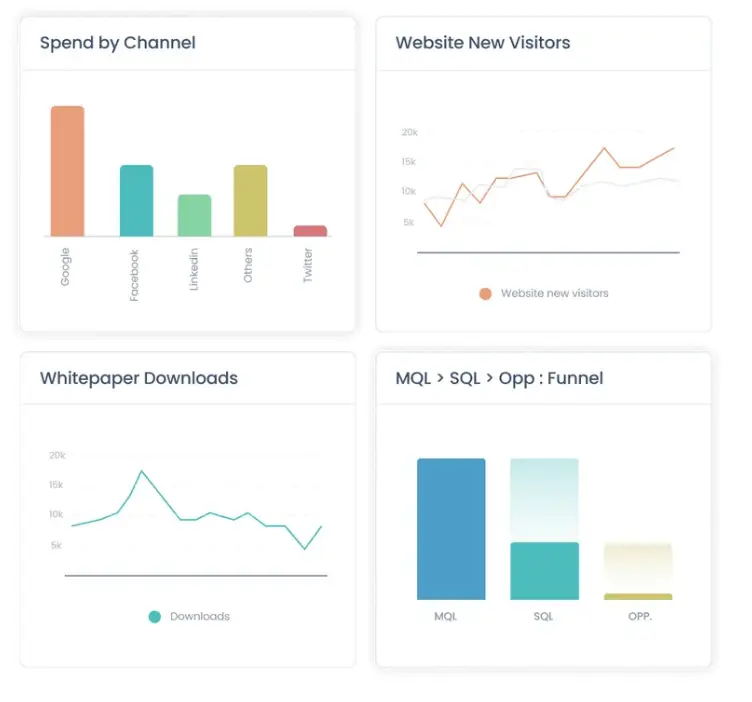
Your content reports also need detailed but easily understandable visualizations that allow you to make beneficial decisions at a glance. A content marketing dashboard should immediately help you grasp how key metrics are changing to drive efficient decision-making related to content and attribution.
{{INLINE_TOFU}}
Best practices to create effective content dashboards
Your content dashboard should show you everything you need to create an effective content strategy on the same page. Here’s how your marketing team can ensure it has the best possible content dashboard:
1. Understand the metrics you’re using
How is each metric connected to your strategic goals or overall revenue? Asking this question helps to streamline the information on your dashboard so it only shows you relevant metrics. Your marketing team needs to understand how each metric displayed corresponds to the company’s goals to effectively adapt the marketing strategy accordingly.
2. Set the right goals
Not all your goals have to be connected to revenue–some of them can be associated with your company’s strategic goals, such as acquiring prospects in a certain industry sector or locality. Metrics such as the influenced pipeline, for example, are not associated with revenue but with the success of your marketing efforts. Tracking the right metrics while keeping company goals in mind allow you to focus on growth.
3. Make data easy to consume
While deciding which metrics to include in your visualizations, ask yourself the following questions:
- Who/what is this visualization for?
- Does a specific metric help you make quicker and better marketing decisions? If the answer is yes, include it.
- Which visualizations are easiest to understand for each metric?
- How can each piece of data be connected to your company’s overall revenue?
4. Include comparison data
Comparison data is crucial for keeping track of progress. A dashboard incorporating comparison data will often employ graphs and charts that display how certain metrics have changed over selected quarters, for instance. This data helps you see how much closer you are to achieving company goals than before.
5. Don’t forget about influenced pipeline
Measuring how marketing has influenced pipeline helps you see what marketing content influences a lead’s decisions and how. Essentially, the influenced pipeline shows you the real impact of your marketing efforts, and informs you about the channels that most contribute to conversions. It helps you understand the buyer’s journey in greater detail.
Are there any tools to help with content reporting?
Tools like Factors offer analytics and multi-touch attribution dashboards, along with dedicated content reporting. You’ll be able to see all of your important metrics in one place, along with detailed, comprehensive visualizations that allow you to easily understand your company’s marketing strategy performance at a glance.
Factors’ attribution features also help combine all this information with your customer relationship management (CRM) software entries. This allows you to have a holistic understanding of each buyer’s journey, complete with the touch points that encouraged conversion and the content they found most useful.
Effective content reporting helps teams evaluate performance and refine strategies with clarity.
1. Core Focus: Track KPIs like engagement, conversions, and traffic quality through dynamic dashboards.
2. Best Practices: Align reports with business goals, segment data by audience, and update regularly.
3. Strategic Benefits: Enable informed decisions, highlight content impact, and improve marketing ROI.
Well-structured reporting transforms raw data into strategic value, driving smarter content and business outcomes.
Conclusion
Effective content reporting is a critical aspect of developing and adapting your content marketing strategy to current trends in the market. Book a demo with us today to find out how Factors can help your company with effective analytics, attribution, and reporting.
FAQs
1. What does a good content report look like?
A good content report includes key metrics for content marketing and visualizations that allow you to make quick and important marketing decisions on a single dashboard. Visualizations involving comparison data are also important, as they help you understand progress in performance.
2. What’s in a content report?
A content report displays changes in engagement and conversion metrics, and detailed analyses of how different types of content are performing across the various marketing channels your company employs. It should connect each metric to specific company goals, and also include easily understandable visualizations for quick decision-making.

See how Factors can 2x your ROI
Boost your LinkedIn ROI in no time using data-driven insights
Try AdPilot Today


.avif)

See Factors in action.
Schedule a personalized demo or sign up to get started for free
LinkedIn Marketing Partner
GDPR & SOC2 Type II

.svg)


.png)