

Good Reads
Fix pipeline pains. Solve GTM puzzles. Read strategic brain dump.
Written for marketers who want real solutions to a leaking pipeline (and their dark circles).
Want to read more from us?

I’m looking for…
AI for small business marketing: a practical guide for growing without a bigger team
Learn how AI for small business marketing can benefit teams across functions such as content, ads, automation, and attribution without wasting budget on unnecessary tools.
.avif)
TL;DR
- Small businesses are closing the AI adoption gap with enterprises faster than any previous technology cycle, not because they have better tools, but because lean teams feel the impact of every hour saved.
- The biggest waste of an AI marketing investment isn't picking the wrong tool. It's buying five tools before you've fixed your workflows, your CRM hygiene, or your attribution.
- A small business using AI for marketing doesn't need 15 subscriptions. Four to six tools that actually integrate with each other will outperform a bloated stack every time.
- Most AI marketing advice online is built for ecommerce with massive audiences and high-volume purchases. B2B SMBs need account-level intelligence and pipeline visibility, not more blog posts.
- If AI helps you produce 50 pieces of content but pipeline stays flat, you haven't gained efficiency. You've just automated noise at scale.
If you've ever worked in a small business, you've probably had at least one week where the marketing team consisted of one person, three spreadsheets, and a concerning amount of optimism.
Somehow, that same person was expected to manage content, email campaigns, paid ads, reporting, SEO, lead nurturing, website updates, and whatever emergency appeared in Slack before lunch… and then they start looking like this meme:

For years, the only solution was hiring more people or accepting that certain things simply wouldn't get done… AI changed that equation.
And no, it’s not because it replaced marketers… despite what every second LinkedIn post would have you believe, most marketers are still stubbornly employed.
AI enabled small teams to achieve wayyy more than they could before. Tasks that once took hours now take minutes. Workflows that required specialists can often be handled by generalists. The gap between what a five-person company and a fifty-person company can execute has narrowed dramatically.
The problem is that many businesses responded by collecting AI tools the way some people collect Pokémon.
So before you sign up for another AI platform, it's worth understanding where AI genuinely helps, where it doesn't, and how small businesses can use it to create growth instead of just creating more work (because we all hate that).
Why is AI becoming a competitive advantage for small businesses?
For the first time in marketing history, small businesses have access to capabilities that used to require agencies, analysts, and enterprise software licenses. Personalization, predictive analytics, audience intelligence, and large-scale content production were locked behind six-figure budgets a decade ago. Today, a small marketing team can access similar capabilities through AI tools that cost less than a single contractor.
The adoption numbers tell a clear story. According to the SBE Council's 2026 Small Business Tech Use Survey, 82% of small business employers have now invested in AI tools, and the typical small business runs a median of five. Marketing is consistently the number one use case. The real surprise, though, is how quickly the gap between small and large businesses is closing. Small businesses adopted AI at a faster rate than large firms by mid-2025, a reversal that hadn't happened before in technology adoption monitoring data.
The underlying pressure is straightforward. CPCs on Google Ads rose 12% year over year in Q1 2026, the steepest annual increase since 2021. Content saturation makes organic visibility harder to earn every quarter. Attention spans are shrinking while buyer journeys are getting longer. Small businesses can't compete through manual execution alone anymore, and the ones using AI marketing for SMBs aren't just surviving the inflation.
The biggest misconception I keep hearing is that AI gives small businesses an unfair advantage. It doesn't. It simply gives them access to the same playing field larger companies have had for years. The companies pulling ahead aren't the ones adopting the most AI tools. They're the ones integrating AI into workflows that were already working, fixing the foundation while everyone else is busy chasing the next product launch.
The biggest AI marketing mistakes small businesses make
Most SMBs don't have an AI problem. They have a tool-hoarding problem, and I've watched it play out the same way more times than I can count.
- Buying AI tools before fixing workflows. A team has no CRM process, no consistent lead tracking, no campaign structure, and no attribution model. They can't explain how a lead moved from ad click to closed deal. And yet, they're evaluating their fourth AI platform of the quarter. The tool isn't the bottleneck. The workflow is the bottleneck, and no amount of automation fixes a process that doesn't exist yet.
- Replacing strategy with prompts. AI generates content. It does not generate positioning. A prompt can produce a blog post in minutes, but it can't tell you whether that topic matters to your buyers, how it connects to your product narrative, or where it fits in your funnel. The teams treating AI like a strategy shortcut end up with more content and less clarity.
- Chasing every new AI launch. AI fatigue is real, and it's costing teams both money and focus. A new tool launches every week promising to transform some part of your marketing. Teams sign up for trials, overlap subscriptions, and end up with three tools that do roughly the same thing.
- Measuring outputs instead of outcomes. More blogs, more emails, more social posts. Those are outputs. Pipeline created, revenue influenced, and opportunities advanced are outcomes. Attribution debates sometimes resemble group projects where everyone claims credit for the final result, but at least the group project ends.
What AI should actually replace in a small marketing team (and no, it’s not a person)
Here's a useful filter I call the Repetition Rule. If a task happens repeatedly and follows predictable patterns, AI should probably help with it. If a task requires judgment, context, or relationship-building, AI should stay faaaar away from it.
Most marketers don't need AI to create more work. They need AI to eliminate the work nobody should be doing manually anymore.
| Area | Tasks AI should handle | What still needs a human |
|---|---|---|
| Content production | Blog drafts, repurposing, social post generation, video script outlines | Positioning, voice, editorial judgment |
| Email marketing | Segmentation, personalization triggers, draft generation | Strategy, sequencing logic, relationship context |
| Paid media | Creative testing, audience suggestions, budget recommendations | Campaign strategy, brand alignment, vendor negotiations |
| Reporting | Dashboard assembly, trend detection, attribution analysis | Interpretation, strategic recommendations, stakeholder communication |
The key distinction is between execution and decision-making. AI compresses execution time dramatically. A task that took four hours can drop to under one, and for small teams where every hour saved has outsized impact, that compression is significant. But the decisions about what to execute, when, and why still require the kind of judgment that comes from understanding your market, your buyers, and your competitive position.
The best AI marketing tools for small businesses, organized by use case
Generic tool lists are everywhere, and most of them are unhelpful because they organize by product name rather than by the job you're actually trying to do. Here's how to think about the best AI tools for small business marketing in 2026, organized by the problems they solve.
- AI content creation
Tools worth knowing: OpenAI (ChatGPT), Anthropic (Claude), Jasper
ChatGPT remains the entry point for most teams. It's flexible, affordable, and handles everything from brainstorming to draft generation. Claude excels at longer-form, nuanced writing where tone consistency matters. Jasper focuses specifically on marketing use cases and understands brand voice, which helps teams producing high-volume blog posts, emails, and ad copy keep their output consistent.
The limitation across all three is the same. AI writing tools produce competent drafts, but they don't produce strategic content. Every output still needs a human editor who understands the audience, the product, and the competitive landscape.
- AI design
Tools worth knowing: Canva, Adobe
Canva's AI layer, Magic Studio, handles image generation, background removal, text-to-image, and template-based design. For teams without a dedicated designer, it removes the dependency on external creative resources for everyday assets. For most small businesses doing budget-friendly AI marketing, Canva covers 80% of visual needs at a fraction of the cost of Adobe.
- AI SEO
Tools worth knowing: Surfer SEO, Clearscope, MarketMuse
This category matters because AI-generated content without optimization rarely performs in search. Surfer SEO starts at $89/month and offers the best feature-to-price ratio for teams scaling content production. Clearscope begins at $129/month and focuses on semantic depth and content grading. If you're publishing regularly and want your content to rank, pair your AI writing tool with an optimization platform.
- AI email marketing
Tools worth knowing: Mailchimp, HubSpot, Customer.io
Each of these platforms now uses AI for segmentation, send-time optimization, subject line generation, and basic personalization. HubSpot integrates email deeply with its CRM, making it strong for B2B teams tracking leads through longer sales cycles. Mailchimp works well for smaller lists with simpler workflows. Customer.io excels at event-triggered messaging for SaaS products.
- AI marketing automation
Tools worth knowing: HubSpot, ActiveCampaign, Zapier
Automation is where AI tools for small business marketing automation start earning their keep. HubSpot's Starter plan handles basic workflows, form follow-ups, and lead nurturing sequences. ActiveCampaign goes deeper on conditional logic for teams with more complex buyer journeys. Zapier connects tools that don't natively integrate, which matters when your stack includes three or four platforms that need to share data.
AI attribution and buyer intelligence...
This is where the conversation gets interesting, because most small businesses don't actually struggle with generating leads. They struggle with understanding which companies are visiting their site, which campaigns are creating revenue, and where budget leaks are happening.
Factors.ai sits in this category. It identifies anonymous companies visiting your website using IP resolution and enrichment. It consolidates intent signals from LinkedIn, Google, G2, and your CRM into a single account-level view. It tracks multi-touch attribution across first touch, last touch, and influenced campaigns, so every campaign gets credit for what it actually did.
The positioning here is specific. Factors isn't a content tool or an email tool. It's the tool that helps small teams make decisions, not just create more content. For B2B teams spending on LinkedIn and Google ads, the visibility into which accounts engaged with which campaigns is hard to get from native platform analytics alone.
Building an AI marketing stack without enterprise budgets
Small businesses don't need 15 AI tools. They need four to six tools that talk to each other, and the best AI marketing stack for a small business is the one your team actually uses every day.
Under $300/month
| Tool | Monthly cost | Primary job |
|---|---|---|
| ChatGPT (Plus) | ~$20 | Content drafts, brainstorming, research |
| Canva (Pro) | ~$15 | Visual assets, social graphics |
| HubSpot (Starter) | ~$18 | CRM, email, basic automation |
| Factors.ai (Free/Basic) | $0–varies | Account identification, attribution |
| Zapier (Starter) | ~$20 | Tool integration, workflow automation |
This stack covers content creation, design, CRM, attribution, and integration for under $300/month. It's not flashy, but it handles the core workflows that small business digital marketing with AI requires. The tools overlap minimally, and Zapier fills the gaps where native integrations don't exist.
Under $1,000/month
For scaling teams, expand the stack with Surfer SEO ($89/month) for content optimization, ActiveCampaign for deeper automation, and Factors.ai's growth tier for expanded account identification and LinkedIn ad analytics. If your team saves 6 hours per week through AI, that's 24 hours per month of reclaimed time. At even a conservative rate, the tools pay for themselves in the first month.
The trap to avoid is adding tools faster than your team can adopt them. A tool nobody uses is worse than no tool at all, because it costs money while creating the illusion of progress.
How small businesses can use AI across the entire funnel
- Top of funnel
Blog creation, SEO research, and social content production are the most obvious starting points. AI compresses the production timeline from days to hours, which means a small team can maintain publishing consistency without burning out. The goal at this stage is visibility, reaching buyers before they know they're buyers.
- Middle of funnel
Lead nurturing, retargeting, and website personalization sit here. This is where SMB marketing with AI starts getting more sophisticated. AI-powered email sequences adapt to user behavior. Retargeting ads surface to accounts showing engagement signals. The shift from top to middle of funnel is the shift from creating awareness to building consideration.
- Bottom of funnel
Intent detection, pipeline attribution, and revenue reporting matter most at this stage. Knowing which accounts visited your pricing page twice this week, which campaigns influenced those visits, and how that maps to pipeline value changes the conversation from 'how much content did we publish?' to 'which activities are creating revenue?'
AI marketing strategies for local businesses
Local businesses often don't need 'AI transformation.' They need better consistency, and AI helps maintain consistency at scale. Clinics, agencies, consultants, restaurants, and real estate firms all share the same fundamental challenge. They need to show up reliably in local search, respond to inquiries quickly, and stay top of mind with their community.
1. Google Business Profile optimization. AI tools can generate and schedule posts, suggest keyword-rich descriptions, and monitor competitor profiles for changes.
2. Review generation. Automated follow-up sequences after appointments or purchases prompt reviews without manual effort.
3. Automated follow-ups. AI-powered CRM tools handle first-touch responses and qualify leads automatically. For service businesses, the gap between a lead arriving and being followed up with is where revenue is most commonly lost.
4. Local SEO content. AI drafts location-specific landing pages and blog posts targeting neighborhood-level keywords that would take hours to write manually.
5. Appointment nurturing. Automated reminders and rebooking sequences keep the calendar full without requiring front-desk attention.
AI for B2B SMB marketing: what works differently
Most AI marketing advice online is built for ecommerce, and that's a problem for B2B teams. B2B SMBs operate in a completely different world, with smaller audiences, longer sales cycles, higher average contract values, and buying committees that involve multiple stakeholders.
At $10K+ annual contracts, you're not optimizing for click volume or cart abandonment rates. You're optimizing for account-level intelligence, identifying which companies are in-market, understanding their research behavior, and timing outreach to match buying intent.
6. Account research. AI summarizes company news, funding rounds, hiring trends, and tech stack data in minutes instead of hours.
7. Intent tracking. Tools like Factors.ai consolidate signals from website visits, ad engagement, G2 activity, and third-party sources into a unified account view.
8. Lead qualification. AI scoring models prioritize accounts based on engagement patterns and firmographic fit, so sales teams focus on the right opportunities.
9. Pipeline forecasting. Predictive models estimate deal likelihood based on historical data and current engagement levels.
No attribution model answers every question perfectly, and anyone who tells you otherwise is probably selling one. But having some visibility into the buyer journey is infinitely better than flying blind, which is where most B2B SMBs still are today.
Measuring ROI from AI marketing investments
The wrong question is 'What AI tool should I buy?' The right question is 'What bottleneck am I trying to remove?' Framing AI marketing investment decisions around bottleneck removal changes the entire evaluation process, because it forces you to define the problem before shopping for the solution.
Efficiency metrics tell you whether AI is saving time and reducing friction. I track hours saved per week on content production, email setup, and reporting. I look at campaign launch speed and reporting assembly time. These aren't glamorous numbers, but they're the clearest signal that AI is actually doing something useful.
Growth metrics tell you whether AI is contributing to business outcomes. Pipeline influenced by AI-assisted campaigns, customer acquisition cost reduction, and revenue per marketer are the three I care about most. If none of these are moving, the efficiency gains aren't converting into anything real.
Attribution metrics tell you whether your budget is going to the right places. Opportunity creation by channel and campaign, account engagement scoring and progression, and channel contribution to closed-won revenue round out the picture.
If AI creates 50 blogs but pipeline stays flat, you didn't gain efficiency. You just automated noise. The best AI marketing tools for small businesses in 2026 are the ones that connect activity to outcomes, not the ones that produce the most output.
What does the future of AI marketing looks like for small businesses
Trend 1: AI moves from assistants to operators. The current generation of tools responds to prompts. The next generation will execute multi-step workflows autonomously. The transition from assistants to operators is the single biggest shift on the horizon.
Trend 2: Marketing shifts from execution to orchestration. When AI handles the production layer, the marketer's job moves upstream. Strategy, prioritization, and quality control become the core skills.
Trend 3: AI-native marketing teams emerge. These are teams designed from day one around AI workflows, not teams that retrofitted AI onto existing processes. They're leaner, faster, and structured around decision-making rather than production.
Trend 4: Attribution becomes mandatory. As AI marketing spend grows, the pressure to prove ROI grows with it. Teams that can't connect their AI investments to revenue outcomes will lose budget.
Trend 5: First-party data becomes a competitive moat. AI tools without access to your own customer data, CRM records, or platform analytics produce generic outputs. The businesses that collect, organize, and activate first-party data will get significantly better results from every AI tool they use.
The marketers who win the next decade won't be the ones who produce the most content. They'll be the ones who consistently make better bets, faster, with the same data everyone else has access to (duh). Marketing has never suffered from a lack of content. It's suffered from a lack of clarity, and AI either amplifies that clarity or amplifies the confusion. The choice depends entirely on how you use it.
FAQs for AI for small business marketing
Q1. What is AI for small business marketing?
AI for small business marketing refers to using artificial intelligence tools and platforms to automate, optimize, or enhance marketing activities like content creation, email personalization, ad targeting, SEO, and attribution. These tools help small teams operate with capabilities that previously required larger budgets and dedicated specialists, compressing the time and cost of common marketing workflows. Think of it less as a technology upgrade and more as a leverage multiplier for a team that's already stretched thin.
Q2. How can small businesses use AI for marketing?
Small businesses can use AI across the full funnel. At the top, AI handles blog drafts, social content, and SEO research. In the middle, it powers email nurturing, retargeting, and website personalization. At the bottom, it supports intent detection, pipeline attribution, and revenue reporting. The key is starting with your highest-friction workflow and automating that first, rather than trying to adopt everything at once.
Q3. What are the best AI marketing tools for small businesses?
The best tools depend on the job you need done. For content creation, ChatGPT, Claude, and Jasper lead the category. For design, Canva's Magic Studio handles most visual needs. For SEO optimization, Surfer SEO offers the best value at $89/month. For CRM and automation, HubSpot Starter and ActiveCampaign are strong choices. For attribution and buyer intelligence, Factors.ai provides account identification, multi-touch attribution, and LinkedIn ad analytics that most SMB tools don't offer.
Q4. Is AI marketing worth it for companies with small budgets?
Yes, provided you start with the right priorities. A stack of ChatGPT, Canva, HubSpot Starter, Factors.ai, and Zapier can run under $300/month and cover content, design, CRM, attribution, and integration. The ROI typically shows up within the first month through time savings alone. The risk isn't spending too little. It's spending on tools that don't connect to your workflows or your revenue goals.
Q5. How much should a small business invest in AI marketing tools?
A realistic starting budget is $100-300/month for a lean stack. Scaling teams investing in deeper automation, SEO optimization, and account intelligence typically spend $500-1,000/month. The right investment level depends on your team size, your marketing maturity, and the specific bottlenecks you're trying to remove. Always calculate cost per problem solved rather than comparing subscription prices in isolation.
Q6. Can AI replace a marketing team?
AI can replace specific tasks within a marketing team, but it can't replace the team itself. Content drafts, email segmentation, ad creative testing, and reporting assembly are all tasks AI handles well. Positioning, strategy, relationship-building, and the judgment to know which AI outputs are good enough to publish still require humans. The most effective teams treat AI as a capability multiplier, not a headcount replacement.
Q7. How do you measure ROI from AI marketing?
Measure three categories separately. Efficiency metrics track hours saved, campaign launch speed, and reporting time. Growth metrics track pipeline influenced, CAC reduction, and revenue per marketer. Attribution metrics track opportunity creation by channel, account engagement, and channel contribution to closed revenue. Connecting these layers gives you a complete picture of whether your AI investments are driving real business impact.
Q8. What AI tools help with lead generation for small businesses?
For B2B lead generation, Factors.ai identifies anonymous companies visiting your website and consolidates intent signals across channels. HubSpot and ActiveCampaign automate nurturing workflows that keep leads engaged. For content-driven lead generation, ChatGPT and Surfer SEO help teams produce and optimize content that attracts organic traffic. The most effective approach combines visibility tools with nurturing automation, so you both generate and convert leads efficiently.
Q9. How can local businesses use AI for marketing?
Local businesses benefit most from AI in five areas: Google Business Profile optimization, automated review generation, lead follow-up sequences, local SEO content creation, and appointment nurturing. The goal isn't a dramatic AI transformation. It's using automation to maintain the consistency that keeps local businesses visible, responsive, and top of mind within their community.
10 Best Visitor Queue Alternatives For B2B Teams
Visitor Queue was acquired in January 2026. Here are 10 better alternatives, including Factors.ai, Leadfeeder, Lead Forensics, compared on features, pricing, compliance, and support.
TL;DR
- Visitor Queue was acquired by Leadinfo in January 2026 and is no longer sold as a standalone product. If you are on it, it is time to evaluate other options.
- Company-level IP identification tells you which business visited, not which person. Some tools add decision-maker contact data for the company, but those contacts are not necessarily the person who visited.
- Factors.ai is the strongest overall alternative. It pairs company identification (up to 75% of company visits, depending on traffic) with person-level deanonymization (via RB2B) for US traffic,
- Factors.ai, with RB2B integration, now supports US-based B2B person-level deanonymization, surfacing name, title, work email, LinkedIn URL, and firmographics on previously anonymous visitors.
- What you pay for identification alone is rarely the full cost. Factor in what you'll spend to enrich, activate, and report on that data separately.
Before we get into the alternatives, let's talk about the problem most sales teams have suffered through at least once… they pull up last week's website report, and there are EIGHT-HUNDRED company visits. Sounds a-mazing!.
Then begins the archaeological expedition 🔍
Three hours on LinkedIn… twenty tabs open. Somebody muttering "I'm pretty sure this VP of Revenue visited the pricing page." You eventually come away with a few names, two replies, and everyone calls it a ✨productive✨afternoon.
And, to be fair, that's roughly the problem Visitor Queue was built to solve. Company-level identification, a clean UI, sensible pricing. For teams asking "Who's visiting our website?" for the first time, it did the job.
Then January 2026 happened.
Visitor Queue was acquired by Leadinfo. The old product is gone, the domain redirects, customers are being migrated, and new buyers are effectively shopping under a different banner.
Which… isn't the worst thing in the world.
Because most teams outgrow IP-based identification wayyy faster than they expect. Knowing that someone from Acme visited your site is mildly interesting… but knowing who showed up, what they cared about, and how to act before they book a demo with your competitor? That's where things get fun.
So, if you're evaluating Visitor Queue, or suddenly found yourself back in buying mode, this guide covers the 10 best Visitor Queue alternatives for 2026.
We'll start with Factors.ai (because I may be a little biased). And ALSO because I think it's the strongest option if you want the full picture.
What Visitor Queue did and where it ran out of runway
Visitor Queue identified companies visiting your website by matching IP addresses to a database of 220M+ company profiles. You'd install a JavaScript pixel, and within minutes, your dashboard would show company names, industries, employee counts, page views, and time on site.
It was genuinely useful for teams that previously had zero visibility into anonymous traffic. The interface was clean, the setup took under 30 minutes, and pricing started at $31/month, which made it easy to justify to budget-conscious stakeholders.
Here's where the friction started, though.
- It stayed at the company level. You knew Acme Corp visited your pricing page three times this week. You didn't know which of their 300 employees did it, what role they held, or whether they were the actual decision-maker. G2 reviewers consistently flagged this: one noted that Visitor Queue would surface 15 different contact emails for a single company, leaving SDRs to guess who the actual visitor was. That's not a lead. That's a research project.
- Bot traffic consumed paid credits. Multiple Capterra reviewers flagged this specifically: if your plan covered 700 unique companies but bot traffic ate through 700 visits, you'd see zero real prospects. You were paying for noise.
- No intent context. Knowing someone visited doesn't tell you why. Visitor Queue didn't layer in third-party intent signals, CRM engagement history, or ad interaction data. You got a list, not a signal.
- No activation path. The workflow ended at "here's who came by." Getting that data into CRM workflows, ad audiences, or SDR sequences required connecting separate tools, none of which were native.
Those aren't small gaps for teams trying to build pipeline in 2026. They're the whole point.
Top Visitor Queue alternatives and competitors in 2026
To make your evaluation easier, here is how the top visitor identification and account intelligence platforms better than Visitor Queue, stack up side-by-side:
How to pick a Visitor Queue alternative: What actually matters
Before comparing tools, it helps to be clear on which problem you're actually solving. Most visitor identification platforms compete on the same surface-level claims, so the differentiation lives in the details.
Keep this table open when you read the alternatives below. The right tool is the one that solves your specific gap without adding three more tools to compensate.
10 best Visitor Queue alternatives for B2B teams in 2026
1. Factors.ai: Best for full-funnel B2B GTM teams
If Visitor Queue was showing you that a company visited, Factors.ai shows you who visited, what they engaged with across your entire GTM motion, and what to do about it right now.
It's a meaningful upgrade in scope, and that's precisely why it leads this list.
What makes Factors.ai different
Factors isn't just a visitor identification tool that happens to have some extras bolted on. It's a full-stack ABM and account intelligence platform where visitor identification is the starting layer.
Waterfall enrichment across multiple data providers. Factors.ai uses a waterfall enrichment model across 4-5 data providers to identify up to 75% of companies visiting your website, depending on your traffic mix. It's the foundation everything else is built on.
Person-level deanonymization via RB2B. This is new, and it changes what "visitor identification" means. Factors now integrates with RB2B to deanonymize US-based B2B visitors at the individual level. For every identified person, you get first name, last name, job title, LinkedIn URL, work email, company name, industry, employee count, and revenue range. That payload goes directly into Slack alerts, so an SDR gets notified the moment a target-account decision-maker hits the pricing page, with LinkedIn URL and work email already in the message. Marketing can build segments of ICP-fit visitors by title or function and activate them immediately via ads or sequences. RevOps can slice attribution reports by enriched person-level attributes, not just anonymous account traffic.
All enriched fields carry the RB2B prefix in Factors and are available across Account Timeline, Segments, Reports, Real-time Alerts, and Agents. You toggle it on in Settings, and person-level identity starts flowing.
Multi-source intent signals. Factors combines first-party signals (website behavior, product activity, form interactions), second-party signals (LinkedIn Ads, paid search, CRM engagement, G2 Buyer Intent), and third-party signals (Bombora company-level intent) into a single account view. That's a faaaar more complete picture than IP identification alone.
LinkedIn and Google AdPilot. High-intent accounts identified by Factors can be pushed directly into LinkedIn and Google Ads audiences, automatically, daily, without manual uploads. AdPilot controls impression frequency, suppresses low-fit accounts, and feeds conversion signals back to ad platforms via CAPI, so LinkedIn optimizes toward accounts that actually close, not just form fills.
Multi-touch attribution. Factors tracks every account touchpoint from first visit to closed-won revenue, across web, ads, CRM, and product. You can see which channels influenced pipeline and which campaigns drove actual deals, not just clicks.
AI Scout agents. Scout handles account research, buying-group mapping, closed-lost reactivation, and post-meeting tracking. It can surface anomalies in your pipeline, answer natural language queries about campaign performance, and send real-time Slack or Teams alerts when high-intent behavior spikes.
What Factors.ai users say
"We were able to identify and close a $45k deal in just 15 days. This was a big win we would've missed if it weren't for Factors."
- Saurabh Wahegaonkar, AudienceView (G2)
"With Factors.ai, we're no longer in the dark. Data consolidation is magic, no more juggling platforms. Our ABM campaigns and outreach got a big boost. It's our single source of truth."
- Anirudhh Sridharan, Pipeline Marketing Lead, Everstage (G2)
"Factors has given us the clarity we always needed with LinkedIn Ads. We can see how campaigns influence every stage of the buyer journey."
- Arun Pattabhiraman, CMO, Sprinklr (G2, 4.5 stars)
Factors.ai pricing
Factors uses a usage-and-seat-based model that scales with how much of your GTM motion you want connected.
Optional GTM Engineering Services handles RevOps workflow design, ICP modeling, enrichment automation, and SDR enablement for teams without in-house bandwidth.
Factors.ai compliance
SOC 2 Type II and ISO 27001 certified (via GCP infrastructure), GDPR compliant, AES-256 encryption at rest, TLS in transit, dedicated Data Protection Officer, formal incident response plan. Suitable for enterprise procurement requirements and regulated industries.
Support
White-glove onboarding, dedicated Slack channel, dedicated CSM on Growth and Enterprise plans, weekly review calls, and optional GTM Engineering Services. This isn't a "read the docs and figure it out" setup.
G2 rating: 4.5/5 (75% of them gave us a 5-star rating. See for yourself)
Best for: Growth-stage to enterprise B2B SaaS teams running ABM campaigns across LinkedIn and Google, teams that need multi-touch attribution, and RevOps functions that want a single source of truth across web, CRM, ads, and pipeline.
2. Leadfeeder by Dealfront: For GDPR-first European teams
Leadfeeder, now part of the Dealfront platform, is probably the most established name in B2B visitor identification and a natural first stop when evaluating Visitor Queue replacements.
The platform identifies companies visiting your website, enriches them with firmographic data, and pushes that context into your CRM for sales follow-up. Its strongest differentiator is its GDPR-native European data infrastructure, it's purpose-built for teams that need full legal compliance for EU traffic, which is why it remains the default choice for European B2B companies.
Dealfront, as a combined entity (Echobot + Leadfeeder), also gives you access to 60M+ company profiles and 400M+ contacts with 40+ real-time buying intent signals, strong native CRM integrations, and LinkedIn ad audience matching at 90%+ accuracy.
The limitations: company-level identification only. No person-level data. No native ad activation layer comparable to AdPilot. Analytics are solid for pipeline attribution, but don't extend to full multi-touch revenue tracking across channels. If you are looking for alternatives, read our Leadfeeder alternatives blog to know which tool best fits your stack.
Pricing: Free Lite plan (7-day history, 100 companies). Paid plans start at $99/month (billed annually) for 50 identified companies and scale by volume. Enterprise pricing by contact.
G2 rating: 4.3/5 across 730+ reviews.
Best for: B2B teams in Europe or selling into European markets that need GDPR compliance as a non-negotiable, with solid CRM workflow integration.
3. Lead Forensics: best for company-level identification with built-in contact data
Lead Forensics is one of the longest-established names in B2B website visitor identification. It says it owns and maintains its B2B IP database, and it is built around visitor identification as a core sales workflow rather than as one module inside a wider platform.
It identifies the companies visiting your site and can provide contact details for relevant decision-makers at those companies, including job titles, emails, direct dials and LinkedIn profiles. These contacts are not necessarily the people who visited your site. That suits outbound-focused sales teams that want contact data in the same tool, without a separate enrichment step. Lead Forensics also includes real-time alerts, lead scoring, a built-in lead manager and CRM integrations.
Things to keep in mind: Lead Forensics identifies companies, not individual visitors. Its pricing is quote-based and depends on your website traffic, so you will need a demo and free trial to get a figure. Lead Forensics states that it does not provide native multi-touch attribution.
Pricing: Quote-based, calculated from your website traffic. Lead Forensics lists two plans, Essentials and Automate, with unlimited users and a one-week free trial. Confirm current packaging and contact-data inclusions with Lead Forensics.
Best for: B2B sales and marketing teams that want company-level visitor identification, decision-maker contact data and lead management in one tool.
Also, read Lead Forensics alternatives and competitors.
4. RB2B: Best for US person-level identification on a budget
RB2B does exactly one thing, and it does it well: it tells you which individual is on your website, not just which company, for US-based visitors.
Instead of a company name, you get the person's name, LinkedIn profile URL, job title, and company. Those get delivered as real-time Slack alerts, which means SDRs can reach out within minutes of a high-intent visit, while the prospect is still warm. (Factors.ai actually uses RB2B as an enrichment layer within its platform, so if you want this capability embedded in a broader GTM system, you don't need RB2B as a standalone tool.)
The limitations are real. RB2B only works for US traffic. It has no built-in outreach tools, no ad activation, no attribution, and limited integrations beyond Slack, HubSpot, and Salesforce via Zapier. It's a signal source, not a platform.
Pricing: Free tier (150 identifications/month). Pro plan starts at $79/month for 300 monthly resolutions. Annual pricing available.
G2 rating: ~4.5/5 across early reviews.
Best for: US-focused outbound sales teams that want to go straight from "someone's on the site" to "a named person with a LinkedIn URL" without a complex setup.
Check out RB2B alternatives in 2026.
5. Albacross: best for ABM-focused European teams
Albacross is a Swedish platform that sits at the intersection of visitor identification and account-based marketing, with a particular strength in European B2B data. It's a genuine step up from pure IP identification tools, offering intent scoring, behavioral data, and the ability to target identified accounts with display advertising through its native ABM module.
The platform is GDPR-compliant by design and integrates with HubSpot, Salesforce, Pipedrive, Marketo, and Zapier. AI-powered buyer persona recommendations are a useful differentiator for marketing teams that want account prioritization without building custom scoring models from scratch.
Pricing is less transparent than Albacross's European peers: the self-service plan runs around €79/month for up to 100 identified companies, with the Growth tier requiring a custom quote. G2 reviewers consistently flag that Salesforce integration requires going through Zapier rather than a native connector, which adds friction for enterprise sales teams.
If you are currently using Albacross and are looking to evaluate other platforms, you might want to read our blog on Albacross alternatives in 2026.
Pricing: Self-service at €79/month (100 companies). Growth plan: custom pricing, unlimited companies.
Best for: European ABM-focused marketing teams that want company-level identification paired with intent scoring and light display advertising capabilities.
6. Snitcher: For SMBs that want simplicity and fair pricing
Snitcher is the rare tool that earns an unusually high G2 score (4.8/5 across 160+ reviews) for a relatively simple product. It identifies companies visiting your website, layers that data directly into Google Analytics 4 via its native Spotter API integration (a genuinely unique capability in this category), and surfaces contact details for outreach.
All plans include the full feature set. No premium-gating behind higher tiers. No native integrations locked to enterprise plans. HubSpot, Salesforce, Pipedrive, Slack, and Zapier all come standard.
Its scope is intentionally narrow. There's no person-level identification, no ad activation, and no multi-touch attribution. It's a company-level identification tool that does its job cleanly, costs fairly, and doesn't make you read three pages of documentation to figure out what you're actually buying.
Notably, Factors.ai uses Snitcher as one of its waterfall enrichment sources, so teams that start with Snitcher and later need more depth tend to graduate upward rather than switch sideways.
Pricing: Starts at $49/month for 50 identified companies. Scales to $279/month for 2,000 companies. 14-day free trial available.
G2 rating: 4.8/5 across 160+ reviews.
Best for: Budget-conscious SMB and mid-market B2B teams that want clean company identification with GA4 integration and zero configuration complexity.
7. Warmly: best for real-time on-site engagement
Warmly takes a different angle than most tools on this list: rather than handing you a list of companies to research later, it engages those visitors while they're still on your site through AI chat and person-level identification.
The platform layers 20+ data providers in a waterfall to achieve around 65% company-level and 15–25% person-level identification. Its AI Chat (Inbound Agent) qualifies visitors, answers questions, and books meetings automatically. A TAM Agent handles audience building, buying committee identification, and intent scoring for outbound.
The trade-off is cost. Warmly's pricing starts at $16,000/year for its entry-level Nurture Agent and scales to $25,000/year for the Marketing Ops Agent. That's a significant jump from Visitor Queue's $31/month starting point, and it's structured for teams with mature outbound motions rather than teams that are still figuring out their ICP.
If you feel Warmly dropping the ball, then it is time to look for other alternatives. You might want to read the Warmly.ai alternatives blog to evaluate your options.
Pricing: Annual pricing starting at $16,000/year (Nurture Agent) to $25,000/year (Marketing Ops Agent).
Best for: Sales-led mid-market teams that want to catch and convert high-intent visitors in real time, with a budget for dedicated AI engagement infrastructure.
8. Leadinfo: the platform that acquired Visitor Queue
Since Visitor Queue's January 2026 acquisition, Leadinfo is now technically the direct successor. Existing Visitor Queue customers are being migrated here, so if you were already in the ecosystem, this is your immediate path forward.
Leadinfo has more going for it than just "it absorbed the product you had." It offers 70+ integrations (compared to Visitor Queue's more limited set), AI bot detection, autopilot outreach campaigns, a Leadbot chat widget, and better European data coverage. For teams in the EU, the data residency and GDPR alignment is built into the foundation.
The limitations are similar to what you'd expect: company-level identification only, no person-level, and contact enrichment depth varies by geography. Pricing has shifted to euro-denominated tiers starting at €49/month for 50 identified companies.
If you were happy with Visitor Queue and don't need more depth, Leadinfo is the path of least resistance. If you were hitting Visitor Queue's ceiling, this isn't the upgrade you're looking for.
Pricing: Starts at €49/month for 50 identified companies, scaling by volume.
Best for: Existing Visitor Queue customers migrating to the successor platform, or European B2B teams wanting company identification with a broader integration set.
9. Clearbit (Breeze Intelligence): best for HubSpot-native enrichment
Clearbit was acquired by HubSpot in 2023 and rebranded as Breeze Intelligence. If you're already deep in the HubSpot ecosystem, it's the lowest-friction way to add company identification and data enrichment to your existing workflows.
Breeze Intelligence adds company data to form fills, auto-shortens forms using known contact data, and enriches CRM records with firmographic detail. It's less a standalone visitor identification tool and more an enrichment layer that happens to reveal some visitor company context.
Company-level only. No person-level identification. Credit-based pricing means costs can escalate quickly at scale. Some features are HubSpot add-ons rather than core inclusions. The rebranding also created some uncertainty around roadmap and pricing transparency that hasn't fully settled.
Pricing: Starts at $45/month (annual) for 100 credits. Scales with usage volume.
Best for: B2B teams already on HubSpot that want native enrichment without adding another tool to the stack.
10. ZoomInfo WebSights: best for teams already in the ZoomInfo ecosystem
ZoomInfo's visitor identification module, WebSights, extends its massive contact database (500M+ verified contacts, 100M+ companies) to website visitors. If your team is already using ZoomInfo for outbound prospecting, WebSights gives you a tighter loop between "who's on our site" and "who do we have data on."
The firmographic depth is strong because it's drawing from the same database your SDRs already use. But it's company-level identification, not person-level, and it functions as an add-on rather than a standalone product. The real friction is ZoomInfo's pricing model, notoriously opaque, often described by buyers as aggressive in the sales process, and expensive relative to standalone alternatives.
Reddit threads and G2 reviews both point to a consistent pattern: ZoomInfo as an organization is difficult to negotiate with, and bundling WebSights into an existing contract isn't always the deal it appears to be on the surface.
Pricing: Custom quotes. Add-on to existing ZoomInfo contracts. You can also read the ZoomInfo pricing blog to dive deeper into pricing and specifications.
Best for: Enterprises already on ZoomInfo contracts who want visitor identification folded into the existing data environment without adding a new vendor.
Also, read ZoomInfo alternatives
Head-to-head: How do the top Visitor Queue alternatives compare?
Why do teams move from Visitor Queue to Factors.ai, specifically?
Visitor Queue and Factors.ai aren't in quite the same category, and that's exactly the point. Visitor Queue answered "which company visited?" Factors answers "who visited, what are they researching, where are they in the buying journey, and what's the best next action right now?"
That shift matters most for teams that have already validated that someone is visiting their site and now need to know what to do about it. Here's where the upgrade becomes concrete.
Person-level signals, not just company data. Factors' RB2B integration surfaces name, title, work email, and LinkedIn URL on US-based B2B visitors who would otherwise be anonymous. An SDR gets a Slack alert the moment a target-account VP hits the pricing page, with their LinkedIn URL already in the payload. That's a same-day conversation, not a three-day research project.
Intent data that pre-dates the visit. Factors layers in Bombora third-party intent, G2 Buyer Intent, and CRM engagement history alongside website behavior. So when an account shows up on your site, you can see whether they've been researching your category across the web for the past two weeks, not just that they visited today.
Ads that respond to pipeline signals. LinkedIn AdPilot and Google AdPilot move identified accounts into audiences automatically, control impression frequency to prevent ad fatigue, and feed conversion outcomes back to the platform via CAPI. Your ad spend concentrates on accounts that are actually progressing, not accounts that happened to have a corporate IP address.
Attribution that survives the full funnel. Factors tracks every touchpoint from first anonymous visit through MQL, SQL, Opportunity, and Closed Won. You can tell your CFO exactly which campaigns influenced that $300K deal (not just which ones generated clicks)
What to look for in your Visitor Queue alternative: A buyer's checklist
Before you sign anything, run this checklist. It catches the gaps that vendor demos tend to skip over.
- Identification depth: Does the tool identify companies only, or individuals? Person-level data is only possible for US traffic on most platforms without GDPR complications.
- Bot filtering: Does the platform filter bot traffic before it counts against your credit or company limits? Visitor Queue users flagged this as a meaningful budget drain.
- Integration coverage: Which CRMs, ad platforms, and MAPs does it connect to natively? "Zapier-only" for a key integration is a workflow tax that compounds over time.
- Compliance posture: Do you need GDPR-native EU data processing? SOC 2 Type II certification for enterprise procurement? Know your requirements before the sales call.
- Activation capability: Can the tool do something with identified visitors, or does it just list them? Pushing accounts into ad audiences, triggering Slack alerts, or syncing to CRM sequences natively is worth far more than a longer company list.
- Pricing model risk: Per-company pricing scales against your traffic. If you're growing, run the math at 2x and 5x your current volume before committing.
- Support model: Dedicated CSM vs. email-only vs. community docs. For complex GTM setups, the implementation quality matters as much as the feature set.
- Trial quality: Does the trial give you enough volume and integration access to validate the tool with real data, or is it a limited demo environment?
FAQs for Visitor Queue alternatives
Q1. Is Visitor Queue still available?
Visitor Queue was acquired by Leadinfo in January 2026. The Visitor Queue.com domain now redirects to LeadInfo’s website. Existing customers are being migrated to Leadinfo, and new users should sign up directly with Leadinfo. Visitor Queue as a standalone product is no longer sold, and pricing has shifted to Leadinfo's euro-denominated tiers.
Q2. What's the difference between company-level and person-level visitor identification?
Company-level identification (Visitor Queue, Leadfeeder, Lead Forensics) tells you that someone from Acme Corp visited your site using IP-to-company matching. Some of these tools, such as Lead Forensics, add contact details for decision-makers at the company, but those contacts are not necessarily the person who visited. Person-level identification (RB2B, Factors.ai via RB2B integration) tells you that Jane Smith, VP of Marketing at Acme Corp, visited your pricing page. It is currently limited to US traffic.
Q3. Which Visitor Queue alternative works best for European teams?
Dealfront/Leadfeeder and Albacross are the strongest options for GDPR-compliant identification of EU traffic. Both are built on EU-native data infrastructure and process data within European regions. Leadinfo (the Visitor Queue successor) is also EU-hosted and GDPR-aligned. Factors.ai is US-hosted and GDPR compliant with supplementary EU transfer safeguards.
Q4. What does Factors.ai's RB2B integration actually do?
It deanonymizes US-based B2B website visitors at the person level, surfacing first name, last name, job title, LinkedIn URL, work email, company name, industry, employee count, and revenue range. All enriched fields are available across Account Timeline, Segments, Reports, Real-time Alerts, and Agents inside Factors. You turn it on under Settings → Integrations → Factors Visitor Identity Enrichment → RB2B.
Q5. Is Visitor Queue cheaper than its alternatives?
Visitor Queue's entry price of $31/month (now Leadinfo at €49/month) was among the most affordable in the category. Most alternatives start higher: Snitcher at $49/month, Leadfeeder at $99/month, and Factors.ai with a free tier and paid plans scaling from there. But "starting price" rarely reflects what you'll actually spend once you add enrichment, CRM sync, and activation tools that aren't native to the cheaper platforms.
Q6. Which tool is best for small B2B teams with a limited budget?
Snitcher is the strongest SMB option: clean interface, all features on all tiers, starts at $49/month, GA4 integration baked in, and a 4.8/5 G2 rating. Factors.ai's free plan (200 companies/month, 3 seats) is worth considering too, particularly if you expect your GTM motion to grow beyond basic company identification in the next 6–12 months.
Q7. Can Factors.ai replace Visitor Queue entirely?
Yes, and then some. Factors.ai identifies visitors (company-level, up to 75% of company visits depending on traffic, plus person-level for US traffic via RB2B), layers in multi-source intent signals, activates identified accounts via LinkedIn and Google Ads, and tracks attribution all the way to revenue. It's a superset of what Visitor Queue did, embedded in a full-funnel GTM platform.
Q8. Why do teams outgrow company-level identification tools?
Because knowing that a company visited doesn't close deals. The workflow breaks down at the point where you need to know who to contact, what they care about, and when to reach out. Tools that stop at the company-level leave SDRs doing manual LinkedIn research, marketers running un-segmented retargeting, and RevOps reporting on traffic instead of pipeline. The teams that graduate past this are usually the ones that realize their visitor identification tool isn't the bottleneck, their ability to act on the data is.
Q9. How do I evaluate person-level identification tools before buying?
Ask three questions on every sales call: what percentage of your traffic will be identified at the person level (not company level), how is that identification done (IP-only, deterministic matching, identity graph, probabilistic inference), and what's the geographic scope (US-only is common for person-level tools due to GDPR). Run a trial with enough traffic volume to validate the actual match rate rather than relying on vendor claims.
Q10: Is company-level visitor data actually enough to book meetings?
Honestly? Rarely on its own. Knowing "Acme Corp visited your pricing page" just creates a massive research project for your SDRs. They end up wasting hours guessing which VP did it and cold emailing 15 different people. To actually book meetings efficiently, you either need a tool that handles person-level tracking (like Factors.ai via RB2B) or a separate database tool to manually enrich that company list.
Q11. Do person-level tracking tools like RB2B violate GDPR regulations?
Yes, which is exactly why they are strictly gated to US-based traffic. GDPR has incredibly strict rules regarding tracking individual PII (Personally Identifiable Information) without explicit consent. If you have heavy European traffic, you'll want to stick to company-level tracking tools. You can simply turn off the RB2B enrichment and still use Factors.ai for account-level information. And FYI, Factors.ai is GDPR compliant.
Factors.ai vs Cognism: The GTM Platform Breakdown
Comparing Factors.ai and Cognism across features, pricing, intent data, CRM integration, and compliance. Find out which platform actually fits your GTM motion.
TL;DR
- Cognism is an outbound-first contact database built for cold calling; Factors.ai is an AI ABM and Attribution platform that offers exceptional account intelligence and contact-level intelligence. It offers website visitor identification (>75% account-level coverage), ad activation, and multi-touch revenue attribution.
- The two platforms solve different problems. Cognism helps you find and reach contacts. Factors.ai helps you understand which accounts are in-market and measure what's actually driving the pipeline.
- Cognism pricing starts at roughly $22,500/year for 5 users with no free plan and no published pricing. Factors.ai offers a free plan and tiered plans.
- If your sales motion depends on SDRs grinding the phones in Europe, buy Cognism. If you spend money on paid ads, run ABM campaigns, and need to prove marketing ROI, Factors.ai is the best Cognism alternative
- Factors.ai and Cognism platforms are GDPR-compliant and SOC 2 Type II certified.
Picture this. Your SDR team is prospecting into EMEA and hitting a 22% call connect rate. Leadership is happy. Pipeline looks clean. Then your new VP of Marketing asks a simple question: "Which campaigns actually influenced the accounts that converted?"
And then you say something like this…

Or worse… nobody has ANY answer… embarrassinggg!
Now, that's not a Cognism problem. That's a "we bought a contact database and called it a GTM stack" problem. Cognism will get your reps on the phone with the right people in London and Munich. It won't tell you what happened before that call, after it, or how your LinkedIn ad touched the deal three weeks earlier.
If you're evaluating Cognism alternatives because you need more than a contact database, this guide is for you. We're going to compare Factors.ai and Cognism across features, intent signals, ad activation, analytics, pricing, support, and compliance so you can walk into your next vendor meeting knowing exactly what each platform can and cannot do.
Factors.ai vs Cognism: What does each platform actually do?
Before comparing features line by line, it's worth being precise about what problem each platform was built to solve.
Factors.ai
- Factors.ai is an AI ABM platform that identifies accounts visiting your website, even when they never fill out a form, and tracks how those accounts move across your ads, CRM, website, and campaigns.
- Factors.ai provides 1st party intent signals via website, CRM, product usage, 2nd party intent signals via LinkedIn ads, Google ads, Bing ads, Meta Ads, G2, and 3rd party intent signals via Bombora and CSV upload.
- The Factors platform then activates those signals to the ad channels. With features like LinkedIn AdPilot and Google AdPilot, your ad spend is concentrated on accounts that are actually showing buying behavior.
- The multi-touch attribution feature of Factors.ai connects every touchpoint back to revenue so your team can prove which campaigns built pipeline and which ones didn't.
Cognism
- Cognism is a B2B sales intelligence platform. Its core product is a database of 440M+ contacts globally, with particular strength in EMEA.
- The flagship differentiator is Diamond Data: a set of 10M+ phone-verified mobile numbers validated by human callers, not algorithms. When a rep needs to cold call the CFO of a German manufacturing company, Cognism is where you go.
- The platform has added intent signals (via Bombora), a Chrome extension, Sales Companion (an AI prospecting interface), and Cognism Engage (a basic email sequencer) in recent years, but the contact database remains the core value.
- The clearest way to describe the difference is that Cognism helps you build a list and reach out. Factors.ai helps you understand who's already interested and why, then makes your paid channels smarter because of it.
- Both platforms have a role in a modern GTM stack. For most teams, they're not an either-or decision.
But if you're looking for a Cognism alternative that goes beyond contact data and outbound prospecting, Factors.ai is the right comparison.
Factors.ai vs Cognism: Feature comparison
| Feature | Factors.ai | Cognism |
|---|---|---|
| Primary use case | Account intelligence, ABM, ad activation, multi-touch attribution | Contact database, outbound prospecting, cold calling |
| Contact database | Integrates via Apollo, ZoomInfo, Lusha | 440M+ contacts, 10M+ Diamond Data phone-verified |
| Website visitor identification | 75%+ coverage with waterfall enrichment from 4 data providers | Not available |
| Intent signals | First-party (website, CRM, product), second-party (LinkedIn, G2), third-party (Bombora) | Bombora Company Surge intent add-on, job change triggers, funding signals |
| Ad activation | LinkedIn AdPilot + Google AdPilot, native and automated | Not available |
| Multi-touch attribution | Full-funnel, MQL to Closed Won, six attribution models | Not available |
| AI layer | Scout agents: account research, email drafting, campaign optimization | Sales Companion + Cortex AI: ICP-fit account recommendations, persona research |
| CRM integration | Bi-directional: HubSpot, Salesforce, Marketo | HubSpot, Salesforce, Pipedrive, Microsoft Dynamics, Outreach, Salesloft |
| GDPR compliance | Yes | Yes, certified as core product differentiator |
| Free plan | Yes, 200 companies/month | No |
| Pricing transparency | Published tiers on website | Quote-only, no public pricing |
| Best for | B2B SaaS and mid-market teams running ABM, paid ads, and attribution | EMEA-focused SDR teams that rely on cold calling |
Factors.ai vs Cognism: Functionality and features (in depth)
Account identification: What Factors.ai does that Cognism can't
The most fundamental difference between these two platforms starts here.
Cognism is outbound-first. You define an ICP, build a list, and reach out. The platform tells you who to go after. It does not tell you who is already looking at you.
Factors.ai flips that entirely. It identifies 75%+ of companies visiting your website through waterfall enrichment across multiple data providers. You get a continuous feed of accounts showing genuine buying intent, ranked by ICP fit, engagement intensity, and funnel stage, without a single rep having to cold prospect them.
For teams that have meaningful website traffic, this is a genuinely different category of signal. An account that visited your pricing page three times this week, watched a product demo, and previously opened your emails is faaaar more valuable than a name on a list who matched your firmographic filters.
Wait, that’s not it (**puts on a smug smile**), Factors now ALSO deanonymizes US-based B2B visitors at the person-level through RB2B. For every identified visitor, you get first and last name, job title, LinkedIn URL, work email, company name, industry, employee count, and revenue range.
How does this help your teams?
- SDRs get a Slack alert the moment a target-account decision-maker hits the site, with their LinkedIn URL and work email already in the payload.
- This helps marketing build ICP-fit segments by title or firmographic and activate them directly via ads or sequences.
- CS can also see who, at a customer account, is visiting churn-risk pages.
- RevOps can slice attribution reports by enriched person-level attributes instead of anonymous account traffic.
Intent signals: one layer vs. three
Cognism's intent layer is Bombora Company Surge, available as an add-on on the higher tier. It surfaces accounts researching topics relevant to your product across 12,000+ content sources, which is useful for outbound prioritization. Job change triggers, funding signals, and hiring surge data are also available.
What it doesn't do is connect those signals to your own first-party data. You see that "Company X is researching CRM solutions" but you don't know if they've been on your website, engaged with your LinkedIn ads, or if a contact from that company opened your emails last week.
Factors.ai unifies three layers:
- First-party signals: website behavior, CRM engagement, product usage, form interactions, and abandoned forms
- Second-party signals: LinkedIn Ads engagement, G2 Buyer Intent (which accounts are viewing your G2 profile and comparing you against competitors), paid search, CRM campaign data
- Third-party signals: Bombora intent data
When all three layers are combined and scored at the account level, you stop guessing at intent and start measuring it. Accounts that show signals across multiple sources move to the top of the list. Accounts showing intent on only one channel stay lower until the pattern strengthens.
Ad activation: Factors.ai's structural advantage
This is where the comparison gets genuinely lopsided for teams running paid campaigns.
Cognism has no ad activation capability. It's a data provider. Once you have a contact's number, you call them or import them into a sequencing tool. What happens to your LinkedIn budget while that outreach cycle runs is entirely separate and unconnected.
Factors.ai's LinkedIn AdPilot and Google AdPilot connect your intent signals directly to your ad campaigns:
- Dynamic audience sync: Audiences update automatically based on ICP fit, funnel stage, and engagement signals. Accounts that show buying behavior get added. Accounts that go cold get suppressed. Your ad budget follows intent, not static lists.
- Impression control: Frequency capping at the account level prevents over-serving ads to the same companies, which burns budget and annoys the very accounts you're trying to win.
- View-through attribution: Tracks how LinkedIn ad impressions influence pipeline, even when accounts don't click. This matters because B2B buyers see an ad, visit your site organically later, and your last-touch model credits search while LinkedIn gets nothing.
- Conversion API (CAPI): Sends enriched conversion events, including MQL and SQL signals, back to LinkedIn so the algorithm optimizes toward accounts that actually become revenue, not just form fills.
Google AdPilot applies the same logic to Google Ads: daily audience syncs, CAPI integration, buyer-stage-specific targeting, and conversion feedback loops.
For any team spending meaningfully on LinkedIn or Google, the gap between running ads off a static list versus running them off live intent signals is measurable in pipeline efficiency.
Analytics and attribution: one platform has it, one doesn't
Cognism's analytics show you pipeline influenced by your outbound prospecting activity. It doesn't offer multi-touch attribution across channels, funnel visualization, or a unified view of how marketing and sales activity connects to revenue.
Factors.ai was built analytics-first. The multi-touch attribution engine supports six models: first touch, last touch, linear, time decay, U-shaped, and W-shaped. Every touchpoint from first anonymous website visit to closed deal is captured and attributed. The funnel analytics layer visualizes progression from MQL to SQL to Opportunity to Closed Won, with drop-off detection showing where accounts fall out.
Customer Journey Timelines combine web visits, ad exposures, CRM stages, G2 interactions, and product usage into a single chronological view per account. The result is that your team can see exactly what series of touchpoints preceded every deal.
FYI… Knowing that your LinkedIn campaign influenced 34% of closed deals last quarter is a very different conversation than saying "our SDRs called 400 numbers and booked 12 meetings."
Factors.ai vs Cognism: Pricing
Let's be precise here, because both platforms have nuances that matter to buyers.
Factors.ai pricing
Factors.ai publishes its base tiers, which is already a meaningful difference in approach.
| Factors.ai Plan | Price | Key inclusions |
|---|---|---|
| Free | $0/month | 200 companies identified/month, 3 seats, visitor tracking, Slack alerts, customer journey timelines |
| Basic | $399/month (annual) | 3,000 companies/month, 5 seats, LinkedIn intent signals, HubSpot/Salesforce integration, GTM dashboards |
| Growth | $999/month (annual) | 8,000 companies/month, 10 seats, ABM analytics, account scoring, G2 intent, Bombora intent, dedicated CSM |
| Enterprise | Custom | Unlimited companies, 25 seats, LinkedIn AdPilot, Google AdPilot, predictive scoring, white-glove onboarding |
The honest caveat: LinkedIn AdPilot ($1,000/month) and Interest Groups ($750/month) are add-ons priced separately. Teams that want the full ad activation layer should budget for those on top of the base plan. A Growth plan with both add-ons runs approximately $2,749/month.
Cognism pricing
Cognism uses custom quote-based pricing with no public list prices. The platform fee ranges from approximately $15,000/year for the Grow plan to $25,000/year for the Elevate plan, with per-user costs of approximately $1,500/year for Grow and $2,500/year for Elevate.
A 5-user Grow plan lists at roughly $22,500/year, while Elevate runs $37,500+. Add onboarding ($500–$1,500), intent data topics ($200–$400 each), and 10–15% annual renewal increases, and the real cost can land 40–60% above the initial quote.
There is no free plan. There is no monthly billing. Annual contracts auto-renew with 60-day cancellation notice windows.
| Cognism Plan | Estimated Annual Cost (5 users) | Key inclusions |
|---|---|---|
| Grow (Standard) | ~$22,500/year | Contact database, Chrome extension, CRM integrations, emails, basic mobile numbers |
| Elevate (Pro) | ~$37,500+/year | Everything in Grow, plus Diamond Data phone-verified mobiles, Bombora intent, Sales Companion AI |
| Enterprise | Custom | Fully negotiated; volume discounts available |
One thing G2 reviewers flag consistently: "We loved the data but the platform fee killed it for us, $16.5K/year for our solo SDR was a non-starter." If your team is smaller than five people or your budget sits below $20K/year, Cognism's pricing structure works against you before you've even opened the product.
Factors.ai vs Cognism: Pricing verdict
Cognism makes financial sense for EMEA-focused SDR teams where Diamond Data directly impacts connect rates, and cold call volume justifies the cost. The math works when verified mobile numbers are the core bottleneck.
For teams running ABM, paid ads, and attribution alongside prospecting, the total cost of a Cognism stack gets higher quickly. Cognism, plus a sequencing tool ($100–$150/user/month), plus an attribution platform, puts a 10-person team well above $70,000/year.
Factors.ai consolidates several of those functions: intent signals, ad activation, attribution, and account intelligence under one platform. The base tier is accessible, the free plan lets you evaluate the product with real data, and the growth tier competes favorably against the combined cost of point tools doing the same jobs separately.
Factors.ai vs Cognism: CRM integration and pipeline mapping
How Factors.ai connects to your CRM
Factors.ai treats CRM integration as genuinely bi-directional. The platform reads from your CRM to understand where accounts sit in the funnel, and writes back when accounts cross engagement thresholds or when campaign touchpoints should be logged.
The practical difference this creates:
- Pull integration: Factors.ai uses your CRM data to inform which accounts should see your LinkedIn ads, at what frequency, and with which message. An account at the Opportunity stage gets different ad treatment than an account that just visited your website for the first time.
- Push integration: When a high-intent account engages across multiple channels, Factors.ai triggers alerts and logs activity back to the CRM account record, so sales reps have the full context before they reach out.
Native integrations cover HubSpot, Salesforce, and Marketo, with bi-directional sync included across paid tiers.
How Cognism connects to your CRM
Cognism integrates natively with Salesforce, HubSpot, Pipedrive, Microsoft Dynamics, Outreach, and Salesloft. The Chrome extension lets reps enrich contacts directly from LinkedIn profiles and push them into CRM records without switching tabs. The Enhance feature keeps existing CRM records updated as contact data changes.
What Cognism does not do is read from your CRM to inform your outbound targeting. The data flow is one direction: Cognism data goes into your CRM. Your CRM stage data doesn't come back into Cognism to tell you which accounts are already in the pipeline and should be suppressed.
Factors.ai vs Cognism: Compliance and security
Both platforms take compliance seriously, and both meet the requirements most enterprise procurement teams ask for.
| Compliance area | Factors.ai | Cognism |
|---|---|---|
| GDPR | Yes | Yes, certified compliance-first positioning |
| CCPA | Yes | Yes |
| SOC 2 Type II | Yes (via GCP infrastructure) | Yes |
| ISO 27001 | Yes (via GCP infrastructure) | Yes |
| DNC list screening | Not applicable (account-level identification, no personal data stored) | 13–15 national DNC registries screened |
| Data encryption | AES-256 at rest, TLS in transit | AES-256 at rest, TLS in transit |
| Data residency | United States (GCP us-west-1b) | European and global options |
| DPA available | Yes | Yes |
One important structural point of difference on the compliance bit: Factors.ai identifies accounts at the company level and does not store personal contact data. The compliance exposure is lower by design because the platform is not processing mobile numbers or email addresses. Cognism's compliance infrastructure is more complex precisely because it handles millions of personal contact records, including phone-verified mobile numbers, across GDPR-regulated European jurisdictions.
For European teams where a DPO is involved in vendor approval, Cognism's compliance documentation is thorough and procurement-team-ready. One G2 reviewer noted: "Our DPO actually approved Cognism without us having to redline the contract, which never happened with ZoomInfo or Apollo."
Factors.ai's compliance posture is cleaner operationally for account-level intent use cases, but teams that need to store and process individual contact records for outbound will still need a separate contact database tool alongside it.
Factors.ai vs Cognism: Onboarding and support
Factors.ai's support model
Factors.ai offers white-glove onboarding that goes beyond platform training. Each new customer is set up based on their ICP, funnel stages, and existing GTM structure. A dedicated Customer Success Manager is included on Growth and above, with Slack channel access for direct, ongoing communication.
The GTM Engineering Services add-on goes further: RevOps workflow design, enrichment setup, SDR enablement, alert configuration, and ongoing optimization. For teams that don't have in-house RevOps capacity, this is a meaningful differentiator.
Cognism's support model
Cognism includes onboarding and training, though the depth varies by tier. Higher-tier customers get more structured enablement. The general user experience on support is positive across G2, with multiple reviewers citing responsive customer success teams and enablement sessions.
The limitation is that Cognism's onboarding is product-focused: it helps you learn the platform. It doesn't design your GTM workflow, configure your attribution model, or build your ABM playbook.
| Support area | Factors.ai | Cognism |
|---|---|---|
| Onboarding type | White-glove, ICP and workflow-based | Product training and enablement |
| Dedicated CSM | Included on Growth and Enterprise | Available on higher tiers |
| Slack access | Included | Not standard |
| GTM workflow design | Optional add-on service | Not available |
| Self-serve documentation | Yes | Yes |
| Support channels | Slack, email, dedicated portal | Email, live chat (24/7), account team |
Factors.ai vs Cognism: what to choose when
The right answer depends on what problem you're actually trying to solve.
| If your primary need is… | Go with… | Why |
|---|---|---|
| Cold calling into EMEA with verified mobile numbers | Cognism | Diamond Data is genuinely best-in-class for European phone outreach |
| Understanding which accounts are already in-market | Factors.ai | Website identification + multi-source intent is the right tool for this job |
| Running LinkedIn and Google Ads more efficiently | Factors.ai | AdPilot connects intent to ad spend in a way Cognism can't |
| Proving which campaigns influenced pipeline | Factors.ai | Multi-touch attribution across six models, built into the platform |
| Building targeted outbound lists for EMEA | Cognism | 440M+ contacts, 50+ filters, GDPR-compliant exports |
| Full-funnel ABM across a mid-market buying committee | Factors.ai | Account 360, buying group signals, CRM alignment, and ad activation in one stack |
| Transparent pricing with a free trial option | Factors.ai | Published tiers, free plan, 14-day paid plan trial available |
| GDPR-compliant outbound prospecting into Europe | Cognism | Purpose-built for this use case with DNC screening across 13+ countries |
What Factors.ai users actually say
"Factors.AI solves this problem by helping us identify website visitors and their level of engagement. When the data is synced with our CRM, we can see additional signals and intent metrics, which allows us to prioritize high-potential leads."
- Verified G2 review, Factors.ai
"The platform's unsampled analytics and attribution capabilities give us granularity we couldn't get anywhere else. We can finally prove which campaigns actually move pipeline."
- Verified G2 review, Factors.ai
"Factors.ai stands out for its strong analytics suite, automation tools, and competitive entry-level pricing compared to enterprise ABM platforms."
- SalesHive review, 2026
And on the Cognism side, for context:
"Occasionally, the data provided is inaccurate with false numbers. Although this is only a very small percentage of data gathered." — Verified G2 review, Cognism
"Cognism is excellent for our UK + DACH motion but we still pay for ZoomInfo for US. Wish one tool covered both at this quality level." — Verified G2 review, VP Sales, Q4 2025
The final verdict: Factors.ai as a Cognism alternative
Cognism is not a platform to dismiss. For outbound-heavy teams with EMEA pipelines and cold calling as a primary motion, Diamond Data delivers measurable ROI and the compliance infrastructure holds up in regulated markets. If that's your use case, Cognism earns its price.
But the "best Cognism alternative" question usually comes from teams that realize they've been solving half the problem. They have contact data. They don't have account intelligence. They're running LinkedIn ads with no idea which accounts are seeing them or whether those exposures influence deals. They have CRM data and website data sitting in separate tools that never talk to each other.
That's exactly the problem Factors.ai was built to solve. It's not a better Cognism. It's a different category: an account intelligence platform that activates buying signals across paid channels, connects every touchpoint to revenue, and gives marketing and sales a shared view of who's actually in-market.
Teams that need both a contact database and account intelligence typically pair them. Factors.ai plus Apollo or Lusha for contact enrichment covers the full picture: intent identification, ad activation, attribution, AND the contact data to act on the signals.
Teams that only need contact data and outbound prospecting into EMEA should seriously evaluate Cognism first.
The decision isn't really Factors.ai vs Cognism. It's: what is the actual gap in your GTM stack right now? One platform fills the contact database gap. The other fills the intelligence, activation, and attribution gap. Know which one you're solving for, and neither decision is wrong.
FAQs for Factors.ai vs Cognism
Q1. Is Factors.ai a direct replacement for Cognism?
Not exactly, and that distinction matters before you make a buying decision. Cognism is a contact database with verified mobile numbers for outbound prospecting. Factors.ai is an account intelligence and GTM platform: it identifies which companies are visiting your website, activates those accounts through LinkedIn and Google Ads, and attributes revenue across channels. Teams that need phone numbers for cold calling still need a contact database tool. Factors.ai is the right Cognism alternative for teams that need intent data, ad activation, and attribution on top of, or instead of, a raw contact database.
Q2. How does Cognism pricing compare to Factors.ai?
Cognism starts at roughly $22,500/year for a 5-user team on the Grow plan, with no free plan and no monthly billing option. Factors.ai offers a free plan (200 companies/month), a Basic tier at $399/month, and a Growth tier at $999/month. Cognism's real-world costs often run 40–60% above initial quotes once onboarding fees, intent topic add-ons, and annual renewal increases are factored in. Factors.ai's LinkedIn AdPilot and Interest Groups add-ons ($1,000/month and $750/month respectively) can significantly increase costs for teams wanting the full ad activation layer.
Q3. Which platform is better for EMEA outbound?
Cognism. Diamond Data's phone-verified mobile numbers for UK, DACH, Nordics, and France are genuinely best-in-class, and the GDPR compliance infrastructure is purpose-built for European prospecting. Factors.ai identifies EMEA accounts visiting your website and can activate them through LinkedIn campaigns, but it does not provide contact-level phone numbers for cold calling.
Q4. Can Factors.ai and Cognism be used together?
Yes, and for many mid-market teams this is the right approach. Factors.ai identifies which accounts are in-market based on website behavior, ad engagement, and third-party intent, then activates those accounts through LinkedIn and Google Ads and attributes the resulting pipeline. Cognism (or Apollo, ZoomInfo, or Lusha) provides the contact-level data so reps can actually reach the individuals at those in-market accounts. Together they cover the full signal-to-outreach cycle.
Q5. Which platform has better intent data?
It depends on what you mean by intent. Cognism's Bombora integration gives you third-party topic-based intent: which companies are researching relevant keywords across 12,000+ content sources. Factors.ai combines first-party intent (your own website and CRM), second-party intent (LinkedIn, G2), and third-party intent (Bombora) into a unified account-level score. For teams that care about multi-source intent and want to connect intent signals to their own account journey data, Factors.ai's signal layer is more actionable. For teams that just need Bombora intent added to their contact prospecting, Cognism's integration is sufficient.
Q6. Does Factors.ai work for small teams?
The free plan (200 companies/month) is a genuine starting point for smaller teams with limited website traffic. For production ABM workflows, the Basic tier at $399/month is the right entry point. The platform is most valuable for teams that have meaningful website traffic, run LinkedIn or Google Ads, and want to connect those activities to pipeline. Early-stage startups with under 1,000 monthly website visitors may not generate enough signal volume to justify the paid tiers.
Q7. How long does Factors.ai take to set up?
The first integrations, CRM, LinkedIn, Google Ads, and website pixel, are typically live within 48 hours. Full platform configuration, including audience syncs, alert workflows, and attribution model setup, is covered through the white-glove onboarding process. Most teams are seeing account identification data and running their first audience syncs within the first week. More complex RevOps workflow design is available through GTM Engineering Services as an add-on.
Q8. Is Cognism's data quality really as strong as the marketing suggests?
For EMEA, particularly UK and DACH, yes. Diamond Data phone-verified mobile numbers consistently deliver connect rates that independent reviews peg at 2–3x better than standard database providers. For North America and APAC, the data quality drops noticeably and multiple G2 reviews flag this gap. The top five cons listed on Cognism's G2 profile all relate to data accuracy and outdated information, which suggests the gap between Diamond-verified records and the broader database is real and noticeable in practice.
Q9. Why is Cognism so expensive for small startups?
Because they target mid-market and enterprise teams with budget to burn. They charge flat platform fees regardless of whether you have one user or five, meaning a solo founder or single SDR gets penalized by the math. If you're a small team, it's usually better to leverage Factors.ai’s free or basic tier paired with a cheaper data provider like Apollo until your outbound cold-calling volume justifies enterprise sales tools.
Q10. Does Factors.ai's website tracking actually work without form fills?
Yes, it de-anonymizes about 75% of website visitors at an account level. With the recent RB2B integration for US traffic, it even pulls the actual LinkedIn profiles of individual visitors. You won't get a 100% hit rate because people browse from coffee shops or home VPNs, but it gives you infinitely more actionable data than staring at standard, blind Google Analytics charts.
Generative AI marketing use cases: what actually works for B2B teams
Read about generative AI marketing use cases, tools, workflows, risks, and B2B SaaS strategies that actually drive pipeline, not just content volume.
TL;DR
- Generative AI marketing use cases have moved well past content generation into workflow automation, campaign execution, and autonomous agents that act on real buying signals, but most B2B teams haven't caught up yet.
- The majority of teams are still using GenAI for blog drafts and LinkedIn captions, which means they're automating the least valuable part of their marketing stack and calling it a strategy.
- The 15 use cases that actually drive pipeline range from SDR personalization and account-based content to predictive campaign optimization because they connect activity to revenue.
- A mediocre AI model running on strong first-party data will outperform a powerful model on generic prompts every single time, so your data layer matters significantly more than your LLM subscription.
- The generative AI marketing best practices worth following, share one uncomfortable truth: if your entire strategy can be replicated with a single prompt, it was never a strategy.
Every new technology goes through the same awkward phase: people discover it can do one thing reasonably well, then spend the next two years forcing it to do only that.
Spreadsheets became calculators, the internet became a place to upload brochures, smartphones became devices for checking email.
Generative AI's version of this is content.
Ask most marketers how they're using AI and you'll hear some variation of blog posts, social captions, email drafts, or ad copy. Useful? Sure. A little underwhelming? Also yes.
Because the biggest opportunity sitting in front of B2B marketing teams has very little to do with writing. It's about understanding buyers faster, acting on intent sooner, and building systems that make better decisions without adding more headcount.
The teams pulling ahead are producing more signal (and content).
Let’s look at some generative AI marketing tools!
Generative AI in marketing isn't about content anymore
Most marketers still think generative AI equals content generation. I don't blame them, because that's where the whole conversation started. In 2023, the primary use case was drafting blog posts and social captions with ChatGPT. By 2024, teams graduated to productivity gains across email, landing pages, and ad copy. In 2025, the conversation shifted again toward workflow automation and integrating generative AI for marketing campaigns into repeatable processes.
Now, the most interesting generative AI marketing applications look nothing like a content writing tool. The best AI agents for marketing are autonomous systems that execute multi-step campaigns with minimal human oversight. Enterprise AI agents are projected to be embedded in 40% of business applications by the end of this year, and the marketing function is where this lands first.
Content creation, the thing most teams still associate with generative AI, is now the least interesting use case. It's a commodity. The real shift is that GenAI has moved from writing assistant to execution layer, handling everything from audience segmentation and ad targeting to real-time campaign adjustments and sales alerts.
For years, marketing teams were bottlenecked by execution. They had more ideas than bandwidth. Now the bottleneck has shifted upstream to decision-making. The problem isn't whether you can create enough content. The problem is whether you can figure out what deserves to be created in the first place. The explosion of AI-generated content marketing has made this question more urgent, because when everyone can produce content at scale, differentiation evaporates.
Why most marketing teams are using GenAI wrong
The ChatGPT trap
Here's a pattern I see in nearly every marketing team I talk to. They've adopted generative AI, which feels like progress. But when you look at what they're actually using it for, it's almost always the same short list: writing blog posts, generating LinkedIn captions, rewriting emails, creating social media graphics.
Almost nobody is using generative AI to analyze buying signals, identify account intent, build audience intelligence, or improve attribution. The gap between how teams could use GenAI and how they do use it is enormous. AI's biggest impact comes from prioritizing high-intent accounts, optimizing campaigns in real time, and forecasting pipeline outcomes, not generating bulk content.
The ChatGPT trap is comfortable because the outputs feel productive. You can see the blog post. You can send the email. The work feels done. But activity and pipeline are faaaar from the same thing, and confusing the two is where teams lose months of effort.
Activity does NOT equal pipeline
More content doesn't automatically create more demand. More emails don't create more opportunities. More AI outputs don't equal more revenue. This isn't controversial, but it's the assumption that quietly underpins most generative AI marketing strategies in B2B.
After nearly a decade in B2B SaaS marketing, one pattern stays constant: the teams that win aren't the ones creating the most content. They're the teams connecting marketing activity to revenue. GenAI is a force multiplier for strategy. It's not a replacement for having one.
Also read: Will AI replace digital marketers?
15 generative AI marketing use cases that actually drive revenue
These aren't theoretical. Each use case maps to a real B2B SaaS workflow where generative AI moves the needle on pipeline, not just on content volume.
- Content research and topic discovery. Instead of brainstorming topics from gut instinct, teams are feeding sales call transcripts, support tickets, and competitor content into LLMs to extract real customer pain points. Tools like Perplexity and Gemini surface patterns across large datasets that would take a human analyst weeks to compile.
- Content creation at scale. Yes, this one still matters, just not as the primary use case. Generative AI for marketing content shines when you need fifty landing page variants, ten ad copy options, or weekly blog drafts from a structured brief. Jasper and Claude handle this well when paired with clear brand guidelines.
- Personalization across campaigns. Dynamic messaging based on industry, company size, buyer stage, and engagement history. GenAI lets you create multiple versions of the same message, each tuned to a specific persona, industry, use case, or buyer stage, without manually rewriting everything.
- AI-powered ad creative generation. LinkedIn ads, Google ads, and retargeting assets generated in bulk, then A/B tested at scale. Nearly 40% of all video ads will be built or enhanced with GenAI.
- SDR and outbound personalization. Prospect research, email creation, and follow-up sequences personalized using firmographic and behavioral data. This is where generative AI use cases in marketing overlap with sales in the most productive way.
- Account-based marketing content. Personalized account pages, industry-specific landing pages, and executive outreach materials tailored to individual target accounts. When you're running ABM across hundreds of accounts, GenAI is the only way to make personalization feasible without a small army of writers.
- Customer journey mapping. LLMs analyze touchpoint data across CRM, website, and ad platforms to visualize how accounts actually move through your funnel, rather than how you think they move.
- Website personalization. Dynamic content blocks that change based on visitor firmographics, previous engagement, or intent signals. The visitor from a 500-person fintech company sees different messaging than the visitor from a 10,000-person healthcare org.
- Conversational marketing. AI-powered chat systems qualify leads, answer questions, and book meetings. Modern conversational AI goes well beyond scripted chatbots by understanding context and intent in the way a good SDR would.
- AI chatbots and AI agents. This goes beyond basic chat. Agentic AI systems can independently handle multi-step workflows: qualify a lead, match them to an ICP, route them to the right SDR, and prep a briefing document, all before a human touches it.
- Voice and video generation. Platforms like HeyGen and Synthesia let teams create spokesperson videos, product demos, and sales outreach clips without cameras or production crews. HeyGen excels at marketing-focused avatar videos, while Synthesia is stronger for enterprise training and internal communications.
- Sales enablement content. Case studies, one-pagers, objection-handling scripts, and competitor battlecards generated from CRM data and product documentation. B2B sales teams are always asking for help with these, and GenAI can turn a structured brief into a polished first draft in minutes.
- Campaign planning. GenAI models analyze historical campaign performance, audience behavior, and competitive positioning to recommend campaign structures, messaging frameworks, and channel allocations.
- Market research. Synthesizing analyst reports, competitor announcements, review site data, and industry trends into actionable summaries. Perplexity and Gemini handle this particularly well when paired with specific research questions rather than open-ended prompts.
- Predictive content optimization. AI tools use historical data to predict customer behavior and campaign performance, helping teams focus on the content most likely to convert rather than producing everything and hoping something works.
How B2B SaaS teams are building GenAI workflows
The teams seeing the strongest results from generative AI marketing automation aren't thinking about individual tools. They're building layered workflows that connect data, intelligence, execution, and measurement into a single system.
- Layer 1: Data. CRM records, product usage signals, website intent data, and ad engagement metrics. This is your foundation, and most teams underinvest here dramatically.
- Layer 2: Intelligence. LLMs, AI copilots, and predictive systems that interpret the data layer and generate actionable insights. This is where tools like ChatGPT, Claude, and Gemini sit.
- Layer 3: Execution. Email campaigns, ad creative, content production, and sales workflows that act on what the intelligence layer surfaces. This is where the best generative AI tools for marketing teams earn their keep.
- Layer 4: Measurement. Attribution, pipeline influence, and revenue impact tracking that closes the loop and tells you what's actually working.
The biggest misconception in AI marketing is that people think better models create better marketing. In reality, better data creates better marketing. A mediocre model with great first-party data will outperform a powerful model with generic prompts every single time. This is why the teams investing in data infrastructure before they invest in AI tooling are pulling ahead, and why platforms built on first-party signals become significantly more valuable as the AI layer matures.
The best generative AI marketing tools by use case…
Choosing the right generative AI marketing platform depends entirely on what you're trying to accomplish. Here's how the most popular AI marketing tools break down by category.
Content tools
| Tool | Best for | Pricing tier | Strengths | Weaknesses | Ideal team size |
|---|---|---|---|---|---|
| ChatGPT | Versatile content and research | Free to $200/mo | Broad capabilities, custom GPTs | Generic without strong prompts | Any |
| Claude | Long-form and strategic content | Free to $200/mo | Nuanced writing, large context window | Fewer integrations | Small to mid |
| Jasper | Brand-consistent content at scale | $39/mo+ | Brand voice, templates, workflows | Less flexible for research | Mid to enterprise |
Creative tools
| Tool | Best for | Pricing tier | Strengths | Weaknesses | Ideal team size |
|---|---|---|---|---|---|
| Midjourney | High-quality image generation | $10/mo+ | Visual quality, artistic range | No direct enterprise integrations | Small to mid |
| Adobe Firefly | Enterprise-grade creative assets | Included in CC, enterprise plans | Commercially safe, brand training | Requires Adobe ecosystem | Mid to enterprise |
| Canva AI | Quick design and social assets | Free to $30/mo | Accessible, template-rich | Less customizable for complex work | Any |
Adobe Firefly Enterprise new customer acquisition grew 50% year-over-year, which tells you something about where enterprise creative workflows are heading. With Firefly for Business and Custom Models, enterprises can harness generative AI while maintaining brand integrity and governance.
Video tools
| Tool | Best for | Pricing tier | Strengths | Weaknesses | Ideal team size |
|---|---|---|---|---|---|
| HeyGen | Marketing videos and localization | Free to $149/mo+ | Avatar realism, 175+ languages | Credit system can be confusing | Small to mid |
| Synthesia | Enterprise training and comms | Custom pricing | Governance, templates, multilingual | Less creative flexibility | Mid to enterprise |
Research tools
| Tool | Best for | Pricing tier | Strengths | Weaknesses | Ideal team size |
|---|---|---|---|---|---|
| Perplexity | Real-time research with citations | Free to $20/mo | Source transparency, speed | Less depth on niche topics | Any |
| Gemini | Multimodal research and analysis | Free to $20/mo | Google data integration, large context | Still maturing for B2B | Any |
Workflow and automation
| Tool | Best for | Pricing tier | Strengths | Weaknesses | Ideal team size |
|---|---|---|---|---|---|
| Zapier AI | Connecting tools with AI steps | Free to $69/mo+ | Massive integration library | Can get complex quickly | Any |
| n8n | Custom AI workflow automation | Free (self-hosted) to $50/mo+ | Open-source, flexible | Requires technical setup | Mid to enterprise |
ABM & Revenue intelligence
| Tool | Best for | Pricing tier | Strengths | Weaknesses | Ideal team size |
|---|---|---|---|---|---|
| Factors.ai | Account intelligence and attribution | Free plan to custom pricing | Account ID, intent signals, attribution | Focused on measurement, not outreach | Mid to enterprise |
| HubSpot AI | CRM-integrated marketing automation | $45/mo+ | All-in-one ecosystem, Breeze AI | Less specialized for ABM | Any |
| Salesforce Einstein | Enterprise AI across sales and marketing | Custom pricing | Deep CRM integration, predictive | Complex setup, expensive | Enterprise |
What a modern generative AI marketing stack actually looks like
Most AI stacks today look like junk drawers that have tangled wires you’ve not used in 25 years. It has… twenty disconnected AI subscriptions sitting side by side with no workflows connecting them, no governance policies, and no way to measure whether any of it is working. I've audited marketing tech stacks where the team was paying for seven different AI tools and couldn't explain how any of them connected to pipeline.
And then you sit there looking like…

The companies seeing results are consolidating around systems, not individual tools. A modern generative AI marketing stack has four layers, and each one needs to talk to the others.
• Content layer (creation). This is where tools like ChatGPT, Claude, Jasper, and Adobe Firefly live. They produce the raw creative and written output. Most teams get this layer right, or at least they get it started.
• Intelligence layer (analysis). This is where your account intelligence, intent data, buyer signals, and competitive insights live. Platforms like Perplexity Claude, and Gemini power this layer by turning raw data into something a marketer can act on.
• Automation layer (execution). This is where workflow tools like Zapier AI and n8n connect the intelligence layer to the content layer, triggering campaigns, updating audiences, and routing alerts to sales when high-intent accounts hit engagement thresholds.
• Attribution layer (measurement). This is where you prove that the whole system is working. Multi-touch attribution, pipeline influence reporting, and revenue impact analysis close the loop. Without this layer, you're flying blind with a very expensive autopilot.
The mistake most teams make is overinvesting in the content layer and underinvesting in everything else. Creation without intelligence is just noise, and noise at scale is still just louder noise (wow, never thought I'd say that about AI marketing).
Generative AI marketing automation: yes, we're wayyy past ChatGPT prompts
The phrase "generative AI marketing automation" used to mean "I have a ChatGPT tab open while I write emails." That definition is past its expiration date. Now, real automation looks like multi-step workflows that run with minimal human intervention.
Automated content workflows follow a clear sequence: research feeds a brief, the brief generates a draft, the draft goes through human review, and approved content publishes automatically. Each step is connected, not manual. Tools like Jasper and n8n can orchestrate this end to end when set up properly.
Campaign automation works differently. An intent signal from your website or ad platform triggers an audience build, which feeds into an ad campaign launch, which gets optimized in real time based on engagement data. Marketing automation AI operates autonomously, making real-time decisions about content selection, budget allocation, and audience targeting without constant human oversight.
Agent-based workflows take this even further. Here's a concrete example of how this works with Factors.ai in the loop:
- A website visitor is identified by Factors.ai's account intelligence
- The account is enriched with company data, intent signals, and behavioral history
- AI summarizes the account's activity and buying stage
- Sales is notified via Slack or CRM with a complete account briefing
- The SDR reaches out with context, not cold
That's what autonomous marketing looks like in practice. It's not a chatbot answering FAQs. It's a system that turns anonymous traffic into qualified pipeline without anyone manually exporting CSV files or checking dashboards every morning.
AI-generated content marketing: where it works and where it breaks
What AI is excellent at…
Generative AI handles certain content tasks remarkably well. Repurposing a webinar into a blog outline, summarizing long reports for sales decks, drafting first versions of landing pages, and reformatting content across channels are all jobs where AI saves real time without sacrificing quality.
Low-risk, high-reward use cases include drafting content structures, repurposing content, and simplifying copy for non-expert audiences. These are execution tasks. They follow patterns, they benefit from speed, and they don't require original thinking. AI is very, very good at pattern execution.
What AI is terrible at…
Original opinions. Category creation. Strategic positioning. Founder storytelling. The kind of thinking that makes a reader stop scrolling and actually care about what your company has to say.
Generative models are pattern machines, and if you don't give them a strong pattern to follow, they'll default to the internet's average: safe, vague, and interchangeable. The internet doesn't need another AI-written article explaining what ABM is. It needs more marketers saying something worth remembering.
The AI-generated content marketing challenges are real and growing. Hallucinations introduce factual errors that damage credibility. Brand dilution happens when every piece of content sounds like it was generated by the same model, because it probably was. And quality risks compound over time, because the moment your audience realizes they're reading AI-generated filler, trust erodes in ways that are very hard to rebuild.
The biggest challenges of generative AI in marketing
- Data quality problems
Your AI outputs are only as good as the data feeding them. When your CRM is cluttered with duplicate records, outdated contacts, and incomplete fields, every AI-driven workflow inherits those problems. AI's ability to analyze large datasets won't get you anywhere unless that data is accurate and high-quality. Garbage in, garbage out remains the most important principle in B2B AI, and no amount of model sophistication changes that.
- Hallucinations
AI models confidently generate information that isn't true, and they do it in a way that's almost impossible to distinguish from accurate output unless a human reviewer catches it. In B2B marketing, a single hallucinated stat in a case study or product comparison can damage a deal. Hallucinations aren't a bug being fixed in the next update. They're an inherent property of how these models work, and that means human review isn't optional.
- Compliance risks
Regulated industries face particular exposure. Smart teams write a one-page AI use policy for marketing that defines assist versus authorship and clarifies where AI can help, where human ownership is mandatory, and where compliance and legal must review. The teams that skip this step discover its importance at the worst possible time.
- Brand consistency issues
Overreliance on AI-generated content happens when teams use AI as a substitute for human judgment rather than a tool to support it. In marketing, that means publishing copy with minimal review or depending on AI for brand messaging decisions that still require human context. When six different team members are prompting the same tool with different briefs, the result is a brand voice that sounds like nobody in particular.
- Attribution blind spots
Most generative AI tools create outputs but don't track whether those outputs contributed to pipeline. Without an attribution layer connecting AI-generated content to revenue, you're guessing about ROI. This is the gap that most teams don't notice until they're in a budget review and can't justify the AI spend.
- Tool sprawl
Teams adopt tools faster than they can integrate them. The result is a stack with fifteen AI subscriptions that don't communicate with each other, creating data silos that reduce the effectiveness of every individual tool. I've seen marketing teams where the AI tools cost more per month than the marketing manager's salary.
- Over-automation
Many teams are accidentally creating more operational chaos with AI than they had before. They've automated output, but they haven't automated decision quality. When you automate bad processes, you just get bad outcomes faster.
Generative AI marketing best practices
These aren't aspirational principles. They're the patterns I see in the B2B SaaS teams that are getting real results from their generative AI marketing strategies.
• Rule 1: Start with workflows, not tools. Identify the specific workflow problem you want to solve before you evaluate any technology. "We need to reduce the time between intent signal and sales outreach from three days to three hours" is a workflow problem. "We need an AI tool" is a shopping trip.
• Rule 2: Keep humans in approval loops. Every piece of AI-generated content that reaches a prospect should pass through a human reviewer. Full automation of customer-facing content is a brand risk that isn't worth the time savings.
• Rule 3: Use first-party data wherever possible. GenAI can ingest CRM data, customer interviews, and sales call transcripts to help generate content that reflects real buyer language, behavior, and intent. First-party data makes your AI outputs structurally better than competitors running on generic prompts.
• Rule 4: Measure pipeline, not productivity. "We created 400% more content this quarter" means nothing if pipeline didn't move. The metric that matters is revenue influence, and every generative AI investment should be evaluated against it.
• Rule 5: Create governance before scale. Write your AI use policy, define what AI can and can't author, establish review processes, and document your workflows. Doing this after you've scaled is like building a foundation under a house that's already standing.
• Rule 6: Build repeatable systems. A one-off prompt that produces a great blog post isn't a system. A documented workflow that consistently produces quality output from research through publication is a system. The difference is the gap between experimentation and operational maturity.
• Rule 7: Don't automate your differentiation. If the thing that makes your brand distinctive is something AI can replicate for every competitor, you've automated your way into irrelevance. Your unique perspective, positioning, and strategic thinking should remain human. If your entire marketing strategy can be replicated with one prompt, it was never a strategy.
How does Factors.ai fit into the generative AI marketing workflow?
Generative AI becomes significantly more valuable when it's grounded in real buyer signals rather than generic inputs. This is where Factors.ai connects to the broader generative AI marketing workflow naturally.
Factors.ai is built on a strong first-party data foundation, identifying more than 75% of companies visiting your website (the highest in the industry), and tracking how those accounts move across pages, channels, and campaigns to give teams a reliable account-level view of buyer activity, even when visitors never fill out forms.
The platform handles several capabilities that feed directly into the GenAI workflow. Account identification reveals which companies are engaging with your website and content. Intent signals show which of those accounts are actively researching solutions you offer. Factors tracks first touch, last touch, and influenced attribution, so every campaign gets credit for what it actually did, and budget goes where it deserves.
Factors also collects account-level intent signals from LinkedIn, Google, Meta, and Bing ad campaigns and surfaces buyer intent from G2 product, category, and review pages. This creates the data layer that makes every other AI tool in your stack smarter.
GenAI creates outputs. Factors.ai provides context. Without context, AI becomes another content machine churning out more of what nobody asked for. With context, it becomes a revenue engine that knows which accounts to prioritize, which campaigns are working, and where your budget should go next. As agentic AI systems mature, the platforms that supply reliable, real-time account intelligence will become the backbone of every autonomous marketing workflow.
The future of generative AI marketing
- AI agents will replace marketing admin work
An AI agent is a system that can set goals, plan a sequence of actions, execute those actions across platforms, evaluate the results, and adjust its approach, all without requiring step-by-step human instruction. Campaign setup, audience management, reporting, and basic optimization will all move to agents within the next two years.
- AI visibility will become a new marketing channel
With tools like Perplexity and Google's AI Mode changing how buyers research solutions, optimizing for AI-generated answers (sometimes called GEO, or Generative Engine Optimization) will become as important as traditional SEO. If your brand isn't showing up in AI-generated research summaries, you're invisible to a growing segment of buyers doing their pre-purchase homework.
- Hyper-personalization will become expected, not impressive
Account-level personalization that would have been considered impressive in 2024 will be the baseline now. Buyers will expect every interaction to reflect their specific context, and teams that can't deliver it will lose to those who can.
- Content production will become fully commoditized
When everyone can produce high-quality content at scale, the differentiator shifts from production capability to insight quality. The teams that win will be the ones with better data, sharper perspectives, and clearer strategic thinking, not the ones with the fastest AI writing tool.
- Attribution will become more important than ever
As marketing teams use more AI-driven channels and autonomous workflows, the need to understand what's actually driving revenue gets more critical, not less. 88% of marketers now report using AI in their day-to-day roles, yet only about one-third of organizations have moved beyond isolated experiments to scale AI across their operations. The gap between using AI and measuring its impact is the next frontier.
- GTM teams will become smaller but more effective
The primary benefit of agentic AI is the decoupling of output from human hours. Autonomous agents can execute thousands of personalized interactions simultaneously, letting businesses scale marketing efforts without a linear increase in headcount. The teams that figure this out earliest will have a structural speed advantage that's very hard to close.
The marketers who thrive in the next five years will be the ones who know where AI should stop. Because the competitive advantage was never typing faster. It's still judgment. It's still taste. It's still knowing what deserves attention. And no model has figured that out yet.
In a nutshell…
Generative AI marketing use cases have evolved well beyond content generation, and the B2B teams getting real results are the ones treating AI as infrastructure for revenue operations, not a faster way to write blog posts. The 15 use cases that matter most connect directly to pipeline: SDR personalization, account-based content, predictive optimization, campaign automation, and intent-driven workflows. Your stack needs four layers to work (data, intelligence, execution, measurement), and the biggest mistake teams make is overinvesting in creation tools while ignoring the data and attribution layers that make everything else effective.
If you take one action from this piece, audit your current AI usage against pipeline impact. Count how many of your AI-powered workflows directly connect to revenue, and how many just produce more content. The gap between those two numbers tells you exactly where to focus next. Start with first-party data, build repeatable workflows, keep humans in the approval loop, and measure outcomes that your CFO would actually care about.
FAQs about generative AI marketing use cases
Q1. What are the most common generative AI marketing use cases?
The most common generative AI marketing use cases in B2B include content creation at scale, campaign personalization, AI-powered ad creative generation, SDR outbound personalization, conversational marketing, predictive analytics, workflow automation, and ABM execution. The use cases gaining the most traction are the ones that connect directly to pipeline rather than simply increasing content volume, including agent-based workflows that autonomously identify, qualify, and route high-intent accounts.
Q2. What are the best generative AI tools for marketing?
The best generative AI tools for marketing span several categories. For content, ChatGPT, Claude, and Jasper lead the field. For creative assets, Adobe Firefly, Midjourney, and Canva AI are the strongest options. Video tools like HeyGen and Synthesia handle avatar-based content and localization. Perplexity and Gemini excel at research. For workflow automation, Zapier AI and n8n connect the stack together. And for revenue intelligence, Factors.ai, HubSpot AI, and Salesforce Einstein provide the data and attribution layers that make everything else more effective.
Q3. How is generative AI impacting B2B SaaS marketing?
The generative AI impact on B2B SaaS marketing shows up in several ways. Teams are reducing execution costs, accelerating content production cycles, improving personalization across campaigns, and enabling account-based workflows that scale without proportional headcount increases. The most significant shift is that smaller teams can now operate at the scale and sophistication that previously required much larger organizations, provided they invest in the right data infrastructure and workflow design.
Q4. Can generative AI replace marketers?
Generative AI can automate execution tasks like drafting, formatting, and data analysis, but strategy, positioning, messaging, judgment, creativity, and deep customer understanding still require human expertise. The teams using AI most effectively treat it as a capability amplifier, not a headcount replacement. The marketers who will struggle are the ones whose roles were already limited to execution tasks that AI handles well.
Q5. What are the biggest challenges of AI-generated content marketing?
The most significant AI-generated content marketing challenges include hallucinations that introduce factual errors, brand inconsistency when multiple team members use AI without shared guidelines, compliance risks in regulated industries, content saturation that makes differentiation harder, and over-reliance on generic outputs that sound interchangeable with every competitor's content. The compounding problem is that as more teams use the same tools with similar prompts, the collective output becomes increasingly homogeneous.
Q6. How should B2B marketing teams implement generative AI?
Start with a specific workflow problem rather than a tool evaluation. Connect AI to first-party data sources like your CRM, website analytics, and ad platforms before using it for any customer-facing output. Keep human oversight in every approval loop, especially for content that reaches prospects. Measure business outcomes like pipeline influence and revenue attribution instead of productivity metrics like content volume. And build governance policies before you scale, because retrofitting guardrails onto mature AI workflows is far more painful than building them in from the start.
Q7. What's the difference between generative AI marketing automation and traditional marketing automation?
Traditional marketing automation executes rules set by humans: if a lead downloads a whitepaper, send email sequence A. Generative AI marketing automation learns from data patterns, adapts continuously, and can make independent decisions about content selection, audience targeting, and campaign optimization. The newest evolution, agentic AI, goes even further by planning multi-step actions, executing across platforms, and adjusting its approach based on results without requiring human instruction at each step.
Q8. What does a generative AI marketing stack look like?
A modern stack has four connected layers. The data layer includes your CRM, website analytics, ad platforms, and intent data sources. The intelligence layer uses LLMs and AI copilots to interpret that data. The execution layer deploys email, ads, content, and sales workflows based on what the intelligence layer surfaces. And the attribution layer tracks pipeline influence and revenue impact to close the feedback loop. The teams seeing the best results are consolidating around integrated systems rather than collecting disconnected point solutions.
Q9. How do you measure the ROI of generative AI in marketing?
Stop measuring productivity metrics and start measuring pipeline metrics. Track how AI-powered workflows influence qualified pipeline, conversion rates at each funnel stage, sales cycle velocity, and revenue attribution by channel and campaign. Compare these outcomes against the same metrics from before AI implementation. The most honest ROI assessment looks at whether AI investments actually changed business outcomes, not just whether they changed how much content your team produced.
AI marketing automation pricing comparison: what B2B teams should actually pay for
Compare AI marketing tools by pricing, ROI, workflows, and use cases. Learn which platforms are actually worth paying for.
TL;DR
• Most AI marketing automation pricing comparison articles list subscription fees and call it a day, but the real cost of any tool includes implementation, adoption, data quality, and the invisible tax of managing five dashboards that refuse to talk to each other.
• A $49/month tool that demands manual CSV exports, CRM syncing, and constant lead cleanup can quietly cost more than a $1,000/month platform that consolidates three workflows, not because the sticker price is wrong, but because nobody budgets for operational drag.
• AI marketing tools’ pricing is shifting hard toward usage-based and token-based models, which means your monthly bill is no longer predictable, and most marketing leaders haven't adjusted their forecasting to account for it.
• The smartest B2B teams aren't buying the most AI tools, not because they have better tools, but because they know exactly what they're buying and why.
• If you can't answer "which AI tools are generating pipeline for us?" within 30 seconds, your stack is probably more expensive than it looks.
Raise a finger if you’ve watched a team spend thirty minutes debating whether to renew a $99 AI tool. Nobody in the room, meanwhile, could tell whether the attribution platform costing forty times as much was actually influencing pipeline.
Which feels very… B2B somehow.
Teams today have more AI tools than ever. Ask which ones are making money, though, and the conversation gets suspiciously quiet.
That's the problem with most AI pricing comparisons; they focus on subscription costs and feature lists, while ignoring the stuff that actually gets expensive: implementation, adoption, messy data, and the joy of managing six disconnected tools that all promised to ‘save time.’
Sooo, in this guide I’m looking at what AI marketing tools really cost, where the hidden expenses lie, and why software should be evaluated at the pipeline level, not the campaign level.
The AI marketing pricing problem nobody talks about
Here's a pattern I see constantly… a marketing leader finds an affordable AI marketing tool, signs up for the starter plan, gets a few quick wins, and then quietly discovers that the tool requires three other tools to function properly. The $49/month subscription turns into a $300/month stack. The "quick setup" turns into six weeks of implementation. The team adopts it halfway, and nobody ever measures whether it moved pipeline.
Most pricing comparisons skip ALL of this. They show you a table with monthly costs and checkmarks, and call it a comparison. What they don't show you is how seat-based pricing punishes growing teams, how usage-based pricing creates unpredictable monthly bills, or how credit-based systems quietly become the upsell engine that doubles your annual spend.
The main difference between a $49/month tool and a $1,000/month platform isn't as straightforward as it looks. A cheaper tool often means more manual operations, more data cleanup, and less visibility into what's actually working. When you add up the hours your team spends exporting CSVs, syncing CRM records, and reconciling dashboards across platforms, the "affordable" option starts looking surprisingly expensive.
B2B teams should evaluate cost per pipeline dollar generated rather than software subscription cost. That shift in thinking changes every buying decision, because it forces you to ask whether a tool is contributing to revenue outcomes or just contributing to your monthly credit card statement. The move toward token-based and consumption-based pricing models is making this even more urgent because your AI marketing tools' pricing is no longer a fixed line item. It fluctuates with usage, and most finance teams haven't really caught up.
How do AI marketing tools price their products?
Before jumping into vendor comparisons, it's worth understanding the four pricing models you'll encounter. Each one carries different implications for budgeting, scaling, and predicting what you'll actually pay.
- Subscription pricing
This is the model everyone knows. You pick a tier, you pay a monthly or annual fee, you get access to a set of features. HubSpot Marketing Hub has four tiers ranging from Free to Enterprise at $3,600/month. Mailchimp pricing starts at approximately $13/month for 500 contacts on its Essentials plan. Jasper AI offers a Pro plan at $59/month billed annually. The appeal of subscription pricing is predictability, but that predictability is often an illusion once you start adding contacts, seats, and features that sit behind higher tiers.
- Seat-based pricing
Seat-based pricing sounds simple until your team grows. HubSpot Starter, for instance, is priced at $20/seat/month on annual billing. That's manageable with three people. With ten, your costs triple before you've added a single premium feature. Every new hire triggers a budget conversation, and teams often end up sharing logins or limiting access to avoid the scaling penalty.
- Credit-based pricing
This is where things get interesting (and where most buyers get surprised). AI content platforms, agent builders, and data enrichment tools increasingly charge by the credit. Clay, for example, introduced a dual credit system in March 2026 where Data Credits pay for enrichment lookups and Actions pay for platform operations like running workflows. Credits often feel generous at signup, but they become the hidden upsell engine once you start running workflows at any real volume. Clay even charges credits for failed lookups, meaning if you query three providers and none return a result, you pay for all three attempts.
- Usage-based pricing
Token consumption, API usage, and agent execution costs are increasingly replacing flat-rate plans. Zapier uses a task-based pricing model where costs scale as automation needs grow. When your monthly bill depends on how many actions your AI agents take, forecasting becomes genuinely difficult. Marketing leaders who budget quarterly are discovering that usage-based pricing can swing 30 to 50% month over month depending on campaign volume and workflow complexity.
The net effect? Marketing leaders increasingly struggle to forecast budgets because pricing is no longer predictable. The shift from "what does this tool cost?" to "what will this tool cost?" is one of the most underappreciated changes in B2B software buying.
AI marketing tool categories and what you're realistically going to pay
Before comparing specific vendors, it helps to understand what you're likely to pay across each category.
Here's a realistic snapshot of AI marketing tools’ pricing across the most common categories:
| Category | Typical price range | Examples |
|---|---|---|
| Email marketing and automation | $13 to $890/month | Mailchimp, HubSpot, ActiveCampaign |
| AI content generation | $29 to $500+/month | Jasper AI, Copy.ai |
| SEO and content intelligence | $117 to $500/month | Semrush |
| Workflow automation | $20 to $500+/month | Zapier |
| Data enrichment and GTM | $185 to $800+/month | Clay |
| Attribution and account intelligence | $399 to $999+/month | Factors.ai |
| Enterprise marketing cloud | $1,250 to $15,000+/month | Salesforce Marketing Cloud |
The spread within each category is enormous, which is precisely why feature-level comparisons without context are almost useless. A $13/month Mailchimp plan and a $890/month HubSpot Professional plan both technically do "email marketing," but they serve completely different operational realities.
AI marketing automation pricing comparison table
This is the section most people came here for, so let's lay it out clearly. The table below reflects publicly listed prices and includes the information most comparison articles conveniently leave out.
| Tool | Starting price | Pricing model | Best use case | Hidden costs | Ideal team size |
|---|---|---|---|---|---|
| HubSpot Marketing Hub | $20/seat/month (Starter) | Subscription + contacts | Full-funnel marketing automation | $3,000 mandatory onboarding on Pro; contact-tier overages | 3 to 50+ |
| Factors.ai | $399/month (Basic) | Usage-based (accounts tracked) | Account identification, attribution, ABM | LinkedIn AdPilot ($1,000/mo), Interest Groups ($750/mo), overage charges at $100/500 accounts | 5 to 50 |
| Jasper AI | $39/month (Creator) | Subscription per seat | AI content generation at scale | Surfer SEO needed for full SEO; Business plan is custom-quoted | 1 to 20 |
| Mailchimp | $13/month (Essentials) | Subscription + contacts | Email campaigns for small businesses | Counts unsubscribed contacts; SMS and transactional email are separate add-ons | 1 to 10 |
| ActiveCampaign | $15/month (Starter) | Subscription + contacts | Marketing automation + CRM | CRM is a paid add-on ($68 to $111/mo); contact-based pricing scales steeply | 1 to 25 |
| Clay | $185/month (Launch) | Credit-based (dual credits) | Data enrichment and GTM workflows | Failed lookups still consume credits; LinkedIn Sales Navigator required ($99/user/mo) | 3 to 25 |
| Zapier | $19.99/month (Starter) | Task-based | Workflow automation across apps | Multi-step Zaps burn tasks fast; at scale, 3 to 5x more expensive than Make | 1 to 20 |
| Copy.ai | $29/month (Chat) | Subscription + credits | Short-form marketing copy | Massive jump from $29/mo to $1,000/mo Growth plan; nothing in between | 1 to 75 |
| Semrush | $139.95/month (Pro) | Subscription per seat | SEO research and content marketing | Extra user seats cost $45 to $100/mo each; key features gated behind Guru ($249.95/mo) | 1 to 20 |
| Salesforce Marketing Cloud | $1,500/org/month (Growth) | Org-based + contacts | Enterprise multi-channel marketing | Implementation costs $5,000 to $100,000+; multi-year contract lock-ins | 25 to 500+ |
Most comparisons stop at the Starting Price column. Real buyers should compare time saved, workflow consolidation, data quality improvements, and pipeline impact. A tool that costs twice as much but eliminates three other subscriptions and gives your team five hours back per week is almost always the better investment.
Affordable AI marketing tools that still deliver value
Not every team needs a $1,000/month platform, and that's perfectly fine. The best AI marketing tools for improved workflow aren't always the most expensive ones. Budget-friendly AI marketing works when you're focused and intentional about what each tool needs to do.
- Under $50/month
Mailchimp's Essentials plan starts at about $13/month for 500 contacts and covers basic email campaigns, though it no longer includes automation at that tier. Brevo (formerly Sendinblue) remains one of the most affordable AI marketing platforms for teams that need email automation without enterprise complexity. ChatGPT Plus at $20/month is the go-to for teams generating first drafts, brainstorming campaign angles, or writing ad copy variations. Canva's free and Pro tiers handle design needs for social posts, ads, and presentations without requiring a dedicated designer.
- $50 to $250/month
This is where most small B2B teams land. Semrush's Pro plan at $117.33/month billed annually gives access to core SEO tools including keyword research, site audits, and competitor analysis. Jasper AI's Creator plan at $39/month (annual) or Pro plan at $59/month (annual) covers AI content generation with brand voice features. Copy.ai's Pro plan at $49/month offers unlimited AI content generation and is popular among freelancers and small teams. ActiveCampaign's Starter plan offers automation features and e-commerce integrations from just $19/month, though you'll need the Plus plan at $49/month for CRM and landing pages.
- $250 to $1,000/month
Clay's plans start at $185/month for Launch and $495/month for Growth. Advanced automation platforms like HubSpot Professional at $890/month unlock the features that most mid-market teams actually need, including workflow automation, A/B testing, and custom reporting.
The biggest mistake teams make at each price tier isn't choosing the wrong tool. It's trying to run their entire GTM motion through five disconnected affordable tools instead of choosing two or three that integrate well and cover the workflows that actually matter.
The hidden costs behind ‘affordable’ AI marketing tools
This is the section that separates this article from every other AI marketing automation pricing comparison you'll find. The sticker price is the opening act. The real cost shows up later.
- Tool sprawl (and it's genuinely exhausting)
I've worked with teams running 10 subscriptions, five dashboards, and three separate attribution systems simultaneously. Each one was individually "affordable." Together, they created a tangled mess of overlapping data, conflicting metrics, and an operations team that spent more time switching between tools than actually analyzing results. The average mid-market B2B marketing team now manages 12 to 15 SaaS subscriptions, and the coordination cost of keeping them in sync is rarely budgeted for.
- Manual operations
CSV exports between platforms. Manual CRM syncing. Lead cleanup spreadsheets shared over Slack every Monday morning. These are the operational taxes that affordable tools impose when they don't integrate natively. A team spending two hours per week on data hygiene is spending over 100 hours per year on work that a better-integrated stack would handle automatically.
- Data quality problems
Poor data enrichment doesn't just hurt productivity. It costs pipeline. When your account data is incomplete or outdated, your SDR team wastes outreach on the wrong contacts, your ABM campaigns target companies that aren't in your ICP, and your attribution models run on dirty inputs that produce misleading conclusions.
- Attribution blind spots
Many B2B teams save $500/month on software and accidentally lose $50,000 in pipeline visibility. That's not hyperbole. When your tools can't connect campaign activity to revenue outcomes, every budget conversation turns into a guessing game. The cost of not knowing what's working is faaaar higher than the cost of the tool that would tell you.
AI agents vs traditional marketing automation: the cost comparison…
The conversation around the cost of AI agents for marketing teams is evolving fast, and the pricing models look nothing like traditional automation.
| Factor | Traditional automation | Agentic AI |
|---|---|---|
| How it works | Workflows, triggers, rule-based actions | Reasoning, multi-step execution, autonomous decisions |
| Pricing model | Seats or contacts | Tokens, actions, or usage volume |
| Predictability | High (fixed monthly cost) | Low (varies with execution volume) |
| Scaling cost | Linear: more users means more seats | Non-linear: more complex tasks means more tokens |
| Human oversight | Low once configured | Still requires guardrails and monitoring |
Traditional marketing automation tools charge you for access. AI agents charge you for execution. The distinction matters, because a team running an AI agent across thousands of accounts per month might see their bill swing dramatically depending on how many actions the agent takes, how many tokens it consumes, and whether tasks succeed or fail.
Agent pricing increasingly depends on actions and tokens rather than seats. Salesforce, for example, now includes Agentforce Campaign Creation in its Marketing Cloud editions, an AI agent that autonomously builds campaign briefs, generates audience segments, and launches journeys. The cost isn't in the seat. It's in the execution.
Platforms like Factors.ai are an interesting example of this shift. Rather than just serving as a dashboard for analytics, the platform is moving toward enabling action, including workflows built with tools like Clay, n8n, and Make that turn intent signals into sales-ready outputs. That's a fundamentally different value proposition than traditional reporting tools, and it reflects where AI marketing is heading: from consumption of data toward execution of workflows.
Which AI marketing stack should different B2B companies actually buy?
This is where the advice gets specific. The right stack depends on your team size, your budget, and (most importantly) whether your foundational systems are actually ready for more software.
- Startup (under 20 employees), budget: $100 to $500/month
Start with a CRM you'll actually use (HubSpot Free or Starter). Add one email tool with basic automation (ActiveCampaign Starter or Brevo). Use ChatGPT for content drafts and Canva for design. That's your stack. Resist the temptation to add more until you have a clear ICP, clean CRM data, and at least one repeatable demand generation motion.
- Mid-market SaaS, budget: $1,000 to $5,000/month
HubSpot Professional becomes a serious option here for teams that need workflow automation and reporting in one place. Add Semrush for SEO (Guru tier if you need content tools), a data enrichment platform like Clay for outbound, and an attribution tool like Factors.ai to connect campaign activity to pipeline. The goal at this stage is consolidation, not expansion. Every new tool should replace an existing manual process.
- Enterprise B2B, budget: $5,000 to $50,000+/month
Salesforce Marketing Cloud pricing starts at $1,500/org/month for Growth Edition and goes up to $3,250/org/month for Advanced, with enterprise plans exceeding $15,000/month depending on contact volume and modules. At this level, the conversation shifts from which tools to buy toward how to integrate them into a unified revenue operating system. Attribution visibility becomes critical because proving ROI across a $50,000/month stack requires serious measurement infrastructure.
The pattern I see most often? Teams buying enterprise software far too early. No CRM hygiene, no attribution model, no ICP clarity, yet purchasing expensive AI software hoping it fixes strategy problems. Software doesn't fix strategy. It amplifies whatever strategy you already have, including a broken one (wow, never thought I'd say that).
How to calculate real ROI before buying any AI marketing tool
Most teams evaluate AI tools by features. The better framework is to calculate what a tool actually costs against what it actually delivers.
True cost: (1) Software subscription cost, (2) Implementation and setup cost, (3) Training and onboarding time, (4) Ongoing operational cost including manual work, integrations, and data cleanup.
True ROI: (1) Pipeline influence: did this tool contribute to qualified pipeline? (2) Time saved: hours reclaimed per week or month? (3) Revenue impact: can you trace any closed deals back to this tool's contribution?
• Content team example. A team paying $59/month for Jasper AI that produces 20 blog posts per month instead of 8. If those posts generate even 5 additional MQLs per month at a pipeline value of $5,000 each, the ROI isn't $59. It's $25,000 in pipeline against $59 in software cost.
• Demand gen team example. A team paying $495/month for Clay that enriches 2,000 target accounts per month. If enrichment data improves outbound reply rates by 15% and generates 10 additional qualified meetings per month, the math changes entirely.
• ABM team example. A team using Factors.ai at $399/month to identify which target accounts are visiting their website. If that identification leads to timely sales outreach that converts even 3 accounts per quarter, the attribution platform has justified its annual cost in a single quarter.
Attribution platforms help prove software ROI faster than activity-based tools, because they connect the dots between investment and outcome. Without attribution data, every ROI calculation is an estimate. With it, you've got evidence (because marketers never lie).
What should you look for when evaluating AI marketing platforms?
After working across SaaS, demand generation, attribution, ABM, content marketing, and revenue operations for nearly a decade, these are the filters I personally use when evaluating any AI marketing platform. They're not perfect, but they've saved me from a lot of expensive mistakes.
• Data quality. Does the tool improve the quality of your existing data, or does it just add more noise? Tools that enrich, validate, and deduplicate are worth more than tools that generate volume without accuracy.
• Integrations. Does it connect natively to the tools your team already uses? If the answer is "you'll need Zapier for that," factor in the additional cost and complexity.
• Workflow reduction. Does adopting this tool eliminate at least one manual process? If a tool adds a new workflow without removing an existing one, you've increased operational load, not reduced it.
• Adoption likelihood. Will your team actually use this every week? The most powerful tool in the world is worthless if it sits unused because nobody has time to learn it.
• Attribution visibility. Can you trace this tool's output back to pipeline? If not, you'll never be able to prove its ROI at budget review time.
• Revenue impact. Does this tool connect to revenue outcomes, or does it just measure activity? Activity metrics are useful. Revenue metrics are essential.
• Pricing transparency. Can you predict what you'll pay next quarter? If the pricing model makes forecasting difficult, you're signing up for budget surprises.
• Scalability. Will this tool's pricing still make sense when your team doubles in size?
Most AI tools are just excellent demos. Very few become part of a team's actual operating system. The ones that do tend to share one trait: they solve a specific workflow problem so well that the team can't imagine going back to doing it manually.
The future of AI marketing pricing (because we're wayyy past "wait and see")
The pricing landscape for AI marketing tools is shifting in several directions simultaneously, and the trends are worth paying attention to if you're signing annual contracts.
• Usage-based pricing will keep growing. The shift from "pay for access" to "pay for execution" is accelerating across every category. Vendors will charge less for seats and more for the actions, tokens, and outcomes their platforms generate. This makes budgeting harder, but it also aligns incentives better. You pay more when you use more, which means you're paying more when the tool is working.
• AI agents will move from seats to outcomes. The idea of paying for an AI agent per action rather than per user is already showing up in platforms like Salesforce's Agentforce. Expect more vendors to follow, and expect the pricing to be confusing for at least another 18 months while the market figures out how to standardize it.
• Marketing teams will consolidate tools rather than expand stacks. The era of "one more tool" is ending, mostly because the operational overhead of managing 15 subscriptions has become unsustainable. Smart teams are choosing fewer, better-integrated platforms and investing the time to actually use them.
• Attribution platforms will become more important, not less. As AI tools multiply and their costs become harder to predict, proving which investments are actually moving pipeline will become the single most valuable capability a marketing team can have. The teams that can clearly explain which AI investments generated revenue will get more budget. The teams that can't will get cut.
The marketers who win in the next few years won't be the ones with the most AI tools (duh). They'll be the ones who can clearly explain which AI investments actually moved pipeline, and they'll have the attribution data to back it up.
In a nutshell…
AI marketing tools pricing is more complex than a subscription comparison table can capture. Subscription, seat-based, credit-based, and usage-based models all carry different implications for your budget, and most comparison articles ignore the operational costs that actually determine whether a tool is worth paying for.
The cheapest tool isn't always the most affordable once you account for implementation time, manual operations, data quality problems, and attribution blind spots. Before buying any AI marketing platform, calculate your true cost (including ops overhead) against your true ROI (pipeline impact, time saved, revenue influence). Choose tools that consolidate workflows rather than adding new ones. Invest in attribution visibility early, because it's the only way to prove whether your AI stack is generating returns or just generating invoices.
If you can answer "which AI tools are generating pipeline for us?" with confidence and data, you're ahead of 90% of B2B marketing teams. If you can't, start there before adding another subscription.
FAQs about AI marketing automation pricing
Q1. What is the average cost of AI marketing automation software?
AI marketing automation pricing varies widely depending on the category and vendor. Basic email marketing tools like Mailchimp start around $13/month. Mid-tier automation platforms like ActiveCampaign and HubSpot range from $15 to $890/month depending on the tier. Enterprise platforms like Salesforce Marketing Cloud start at $1,500/org/month and can exceed $15,000/month depending on contact volume and modules. Most mid-market B2B teams budget $1,000 to $5,000/month for their core marketing automation stack.
Q2. What are the most affordable AI marketing tools for small businesses?
The most affordable AI marketing tools for small businesses include Mailchimp Essentials (from $13/month), ActiveCampaign Starter (from $15/month), Copy.ai's free tier, ChatGPT Plus ($20/month), and Canva's free plan. These tools cover email marketing, content generation, and design without requiring enterprise budgets. The key is choosing tools that integrate well together rather than stacking disconnected subscriptions.
Q3. How much do AI marketing agents cost?
AI agent pricing is still emerging and varies significantly by platform and use case. Traditional automation tools charge per seat or contact, while agentic platforms charge per action, token, or execution. Zapier's task-based model can skyrocket in cost for users with extensive automation needs. Salesforce's Agentforce is included in Marketing Cloud editions but consumes resources per execution. Expect AI agent costs to range from $100/month for lightweight automations to $5,000+/month for enterprise-scale autonomous workflows.
Q4. Are AI marketing tools worth the investment?
They can be, but only if you measure ROI at the pipeline level rather than the feature level. A tool that costs $500/month but generates $50,000 in qualified pipeline is obviously worth it. A tool that costs $50/month but requires 10 hours of manual work weekly and doesn't connect to revenue outcomes is probably not worth it despite the low price. The deciding factor is always whether you can tie the tool's output to business results.
Q5. What is the difference between AI agents and marketing automation tools?
Traditional marketing automation runs on predefined workflows, triggers, and rules. You set conditions, and the system executes them exactly as configured. AI agents operate differently, using reasoning and multi-step execution to take autonomous actions based on goals rather than rigid rules. The pricing reflects this distinction: automation tools charge for access (seats, contacts), while AI agents increasingly charge for execution (tokens, actions, outcomes).
Q6. Which AI marketing tools are best for email campaigns?
ActiveCampaign offers robust automation features and e-commerce integrations from $19/month, making it one of the strongest options for teams that prioritize email marketing automation. HubSpot Marketing Hub provides deeper full-funnel integration but at a higher price point. Mailchimp remains well-known but has reduced its free plan limits multiple times, making alternatives like Brevo and MailerLite increasingly attractive for teams seeking the best AI marketing tools for email campaigns on a budget.
Q7. How should B2B SaaS companies evaluate AI marketing software?
Start by mapping your current workflows and identifying where manual operations create bottlenecks. Evaluate tools based on data quality, integration depth, workflow reduction, adoption likelihood, and attribution visibility rather than feature checklists. Calculate true cost (including implementation, training, and ongoing operations) against true ROI (pipeline influence, time saved, revenue impact). Prioritize tools that consolidate existing workflows over tools that add new ones.
Q8. What hidden costs should marketers watch for when comparing AI tools?
The most common hidden costs include mandatory onboarding fees (HubSpot charges a $3,000 non-refundable onboarding fee for Professional plans), contact-tier overages that escalate as your list grows, credit consumption that exceeds estimates on enrichment platforms, per-seat add-on costs that multiply with team growth, and the operational cost of managing integrations between disconnected tools. Always budget for at least 20 to 30% above the listed subscription price.
Q9. Which AI marketing platforms are best for attribution and pipeline tracking?
Factors.ai specializes in account identification and multi-touch attribution for B2B teams, connecting website visitor data to CRM outcomes. HubSpot's Enterprise tier includes multi-touch revenue attribution. For full-funnel attribution across complex B2B buying journeys, purpose-built platforms like Factors.ai tend to provide deeper insight than general-purpose marketing tools that treat attribution as a secondary feature.
10 Best Cognism Alternatives And Competitors
Is Cognism pricing too high, and are yearly contracts not cutting it? Here are 10 Cognism alternatives worth evaluating, including Factors.ai, Apollo, ZoomInfo, and more.
TL;DR
- Cognism customers report paying around $15,000 to $30,000 a year, with opaque, quote-only pricing and annual contracts with no monthly option.
- Its biggest strength is EMEA data quality and GDPR compliance. Outside Europe, Cognism’s alternatives consistently outperform it.
- Factors.ai is the top Cognism alternative for B2B teams that need account intelligence, ad activation, and full-funnel attribution beyond contact data.
- The right Cognism alternative depends on whether you need contact data, intent signals, outreach automation, or a full GTM platform.
Imagine this… You're mid-evaluation. Someone on your team found Cognism, loved the EMEA data quality, then opened the pricing page and found... nothing. No numbers or tiers… just a "book a demo" button.
Welcome to the Cognism experience. (This also reminds me of the Jet2 Holiday meme for some reason, this one…)

To be fair, Cognism is a genuinely good platform if your ICP is parked in the UK, DACH, or the Nordics. The Diamond Data phone-verified numbers are real, the GDPR compliance is solid, and the connect rates in Europe are hard to beat.
For teams outside EMEA, or teams that need more than a contact database, that math is very hard to justify.
So if you're evaluating Cognism competitors, you're probably asking one of three questions: Is there something with better US/APAC coverage? Is there something more affordable? Is there something that does more than just contact data?
This list answers all three.
Why are teams looking for Cognism alternatives?
Before getting into the list, it's worth naming what actually drives teams to search for Cognism competitors in the first place. It's rarely about Cognism being bad.
The top complaints across 1,318 G2 reviews break down as follows: 99 mentions of "Inaccurate Data," 62 of "Incorrect Numbers," 58 of "Outdated Contacts," 57 of "Incorrect Information," and 55 of "Missing Information." That's a significant volume of negative signal for a platform that leads with data quality.
Beyond data issues, the other recurring pain points are:
- No built-in outreach. Cognism is a data-only platform. You still need Outreach, Salesloft, or Apollo to actually send anything, which adds cost and complexity.
If you are looking for a workflow to convert website visitors, read this blog on warm outbound using website visitors - Rigid contracts. Annual prepayment, auto-renewal clauses, and limited credit flexibility frustrate smaller teams and agencies.
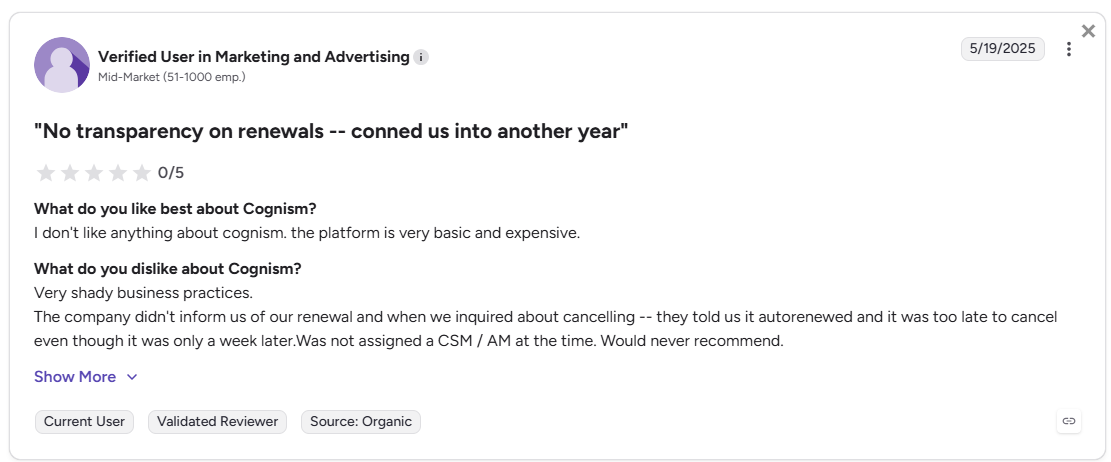
- US and APAC gaps. Cognism's EMEA coverage is its moat. For teams selling into North America or Asia-Pacific, the data quality drops noticeably.
- Opaque pricing. Cognism doesn't publish its prices. For a B2B sales intelligence platform, that single fact tells you a lot about who the product is built for, and who it isn't. And you don’t have to believe it because I’m telling you, because here are some G2 reviews.
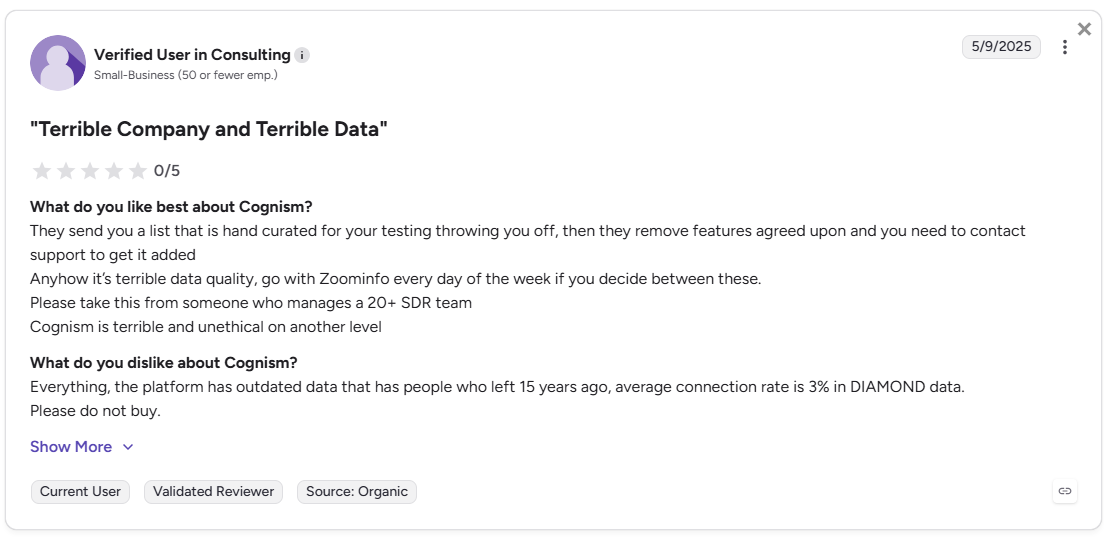
With that framing in mind, here are the 10 best Cognism alternatives.
The 10 best Cognism alternatives in 2026
1. Factors.ai: Best for B2B teams that need more than contact data
If Cognism is a database with a compliance layer, Factors.ai is an ABM platform with a database beneath it. The distinction matters enormously at the bottom of the funnel.
Factors.ai identifies more than 75% of companies visiting your website and tracks how those accounts move across pages, channels, and campaigns. What’s more, Factors.ai also offers person-level ID via RB2B for US-based B2B visitors; it surfaces name, title, work email, LinkedIn URL, and firmographics directly.
This gives marketing and sales teams a reliable account-level view of buyer activity, even when visitors never fill out forms.
Factors.ai goes WELL beyond identifying who is on your site. It tells you what they did, which campaigns touched them, and how to activate that signal across LinkedIn and Google Ads.
What makes Factors.ai different from Cognism
| Capability | Factors.ai | Cognism |
|---|---|---|
| Account-level and person-level visitor identification | 75%+ coverage via waterfall enrichment Also offers up to 40% person-level identification (via RB2B for US traffic); pulls name, title, LinkedIn URL, and work email | Not available |
| Contact database | Integrates with Apollo, ZoomInfo via API | Core product (440M+ contacts, phone-verified) |
| Intent signal sources | Website, CRM, G2, LinkedIn, Google Ads, Bombora | Bombora intent add-on only |
| Ad activation | LinkedIn AdPilot + Google AdPilot (native) | Not available |
| Multi-touch attribution | Full-funnel, MQL → Closed Won | Not available |
| Built-in outreach sequences | No (integrates with outreach tools) | Cognism Engage (basic native sequencer) |
| CRM integration | Bi-directional, HubSpot/Salesforce/Marketo | HubSpot/Salesforce/Outreach/Salesloft |
| Pricing transparency | Tiered plans, published | Quote-only, no public pricing |
| Free plan | Yes (200 companies/month) | No |
Key capabilities
- Account 360. Every account gets a unified view combining website visits, CRM stages, ad interactions, and product usage. No spreadsheet juggling.
- LinkedIn AdPilot + Google AdPilot. Native ad activation based on live buying signals. Audiences update automatically. Impressions are capped at the account level so you're not over-serving cold accounts.
- Scout AI agents. Automate account research, email drafting, campaign optimization, and list maintenance. Not a chatbot, an actual workflow layer.
- Multi-touch attribution. Tracks every touchpoint from first anonymous visit to closed deal across all your channels, not just LinkedIn clicks.
What G2 users say
"Factors.AI solves this problem by helping us identify website visitors and their level of engagement. When the data is synced with our CRM, we can see additional signals and intent metrics, which allows us to prioritize high-potential leads."
- G2 review, verified user
"The platform's unsampled analytics and attribution capabilities give us granularity we couldn't get anywhere else. We can finally prove which campaigns actually move pipeline."
- G2 review, verified user
Pricing
- Free plan: 200 companies/month, 3 seats, visitor tracking + Slack integration
- Basic: 3,000 companies/month, LinkedIn intent signals, HubSpot/Salesforce integration
- Growth (most popular): 8,000 companies/month, ABM analytics, account scoring, G2 intent, dedicated CSM
- Enterprise: Unlimited companies, 25 seats, LinkedIn AdPilot, Google AdPilot, predictive scoring, white-glove onboarding
Best for: B2B SaaS, enterprises and mid-market teams that run LinkedIn and Google Ads, need account-level intelligence, and want attribution that connects to revenue (not just top-of-funnel data).
2. Apollo.io: Best for startups and budget-conscious teams
Apollo is the answer to the question: "What if I could get a contact database AND outreach sequences in one tool, without spending $22K/year?"
Apollo.io is a strong choice for startups that want prospecting, sequencing, and outreach in one platform. Its database covers 275M+ contacts, and the sequencing tools let SDRs run multichannel outreach without a separate Outreach or Salesloft subscription.
Also, read: Best sales prospecting tools for B2B teams
What to know before buying
- Data accuracy sits around 80–85%, lower than Cognism's Diamond Data for phone numbers
- Email bounce rates can run higher than enterprise alternatives
- The free plan (100 credits/month) lets you test data quality before committing
- Paid plans start at ~$49/user/month for the Basic tier
Best for: Early-stage teams, solo SDRs, and companies that want prospecting + outreach in one affordable package, especially for US-focused outbound.
3. ZoomInfo: Best for enterprise teams with deep US coverage needs
ZoomInfo is where you go when Apollo's data accuracy isn't good enough, and Cognism's EMEA-first focus isn't the right fit. ZoomInfo starts at $14,995 per year, but the actual total cost for enterprise teams with full feature access runs significantly higher.
Also, read ZoomInfo pricing in 2026
What justifies the price? The US contact database is the deepest in the market. Org charts, technographic data, intent signals (proprietary), and conversation intelligence through Chorus.ai are all available in one platform.
If you are currently using ZoomInfo and are looking to switch, you might also want to read the ZoomInfo alternatives blog.
Cognism vs ZoomInfo, in plain terms
- ZoomInfo wins on US data depth, org chart coverage, and proprietary intent signals
- Cognism wins on EMEA data quality, GDPR compliance, and verified mobile numbers in Europe
- Many enterprise teams end up using both, which tells you something (duh)
Best for: Large sales orgs with primarily North American pipelines who need deep company intelligence, org charts, and integrated conversation intelligence.
4. Lusha: Best for small teams that need quick, affordable contact data
Lusha positions itself as the accessible middle ground: better than a basic email finder, more affordable than ZoomInfo or Cognism. Lusha starts at $36 per month per user with a credit-based model and a clean LinkedIn Chrome extension that SDRs tend to love.
The platform covers 280M+ B2B contacts, including direct dials and validated email addresses. The AI-powered prospecting layer helps prioritize outreach, and the LinkedIn integration is genuinely smooth.
Related read: Lusha alternatives and competitors
Where it falls short
- Credit limits on lower tiers run out faster than expected for high-volume teams
- Intent data isn't as deep as Cognism's Bombora integration
- Company-level intelligence is thinner compared to ZoomInfo or 6sense
Best for: Small sales teams and SDRs who need fast, affordable contact enrichment with a clean LinkedIn workflow, without committing to enterprise contracts.
5. LeadIQ: Best for LinkedIn-native prospecting workflows
LeadIQ is built for the SDR who lives in LinkedIn Sales Navigator. The platform captures prospect data directly from LinkedIn, pushes it into CRM and sequencing tools, and tracks "job changes" triggers so reps know when to re-engage warm contacts.
LeadIQ offers free and paid plans based on user count and monthly credits, with tiered pricing that scales with usage. LeadIQ is easier to use and more focused on data capture than Apollo, but Apollo offers more automation.
The job change tracking feature is underrated. When a champion moves to a new company, LeadIQ flags it so you can reach them before a competitor does.
Where it falls short
- Data volume is lower than ZoomInfo or Cognism
- Limited intent signal depth beyond LinkedIn activity
- Not built for non-LinkedIn prospecting workflows
Best for: SDR teams running LinkedIn-heavy outbound who want frictionless data capture and CRM sync without a complex platform.
6. SalesIntel: Best for teams that need human-verified US contact data
SalesIntel takes a different approach to data quality: human researchers verify contacts rather than relying solely on algorithmic validation. The ResearchOnDemand feature lets teams request verification for specific contacts within hours.
SalesIntel is a great alternative to Apollo.io for teams that value human-verified contact data. It blends automation and manual verification to maintain data quality, making it ideal for teams who rely heavily on accurate phone numbers and job titles.
The platform also includes technographic data, intent signals, and buying committee identification, making it a more complete ABM tool than a pure contact database.
Best for: Mid-market US sales teams that run high-volume cold calling and need verified phone numbers with better accuracy than Apollo can deliver.
7. UpLead: Best for transparent, credit-based contact enrichment
UpLead makes one strong promise: 95% data accuracy, with credits refunded for any email that bounces. That kind of guarantee is genuinely rare in this category and earns serious trust from smaller teams burned by bad data elsewhere.
The platform is credit-based, with transparent monthly/annual plans, no platform fees added on top, and a free trial with real data access before you buy. For teams that want to validate quality before committing, that process is faaaar cleaner than what Cognism offers.
What it doesn't do
- No built-in outreach sequencing
- No deep intent data or ABM features
- Database size is smaller than ZoomInfo or Apollo
Best for: SMBs and lean teams that want clean, verified contact data at a transparent price without the complexity of enterprise platforms.
8. Seamless.AI: Best for high-volume list building with real-time verification
Seamless.AI's positioning is simple: real-time data verification means you're pulling contact information that's being checked as you pull it, not data that was verified six months ago and may have changed.
The platform is built for SDR teams that need to move fast. The Chrome extension works across LinkedIn, company websites, and other directories, and the contact volume is generous on paid tiers.
The trade-off
- Real-time verification is a genuine differentiator for freshness
- Data accuracy reviews are mixed, with some users reporting more bounce rates than expected
- Lacks the GDPR compliance infrastructure that makes Cognism valuable for European teams
Best for: High-volume prospecting teams in North America who prioritize quantity and recency over deep enrichment or compliance features.
9. Clearbit (now Breeze Intelligence by HubSpot): Best for HubSpot-native teams
Clearbit was acquired by HubSpot in 2024 and rebranded as Breeze Intelligence. If your CRM is HubSpot, this integration is now the tightest available: real-time enrichment of form fills, company identification, and contact data all flowing natively into your HubSpot records.
The data model is firmographic and technographic first. Intent signals are limited compared to dedicated intent platforms, but the enrichment quality for the HubSpot ecosystem is strong.
Related read: Clearbit alternatives for 2026
Best for: HubSpot-first teams that want frictionless enrichment without managing a separate data vendor or integration layer.
10. Clay: Best for building highly personalized, AI-enriched outbound lists
Clay is not a traditional contact database. It's a data orchestration platform that pulls from 75+ data sources (including Cognism, Apollo, LinkedIn, and more) and uses AI to enrich and personalize outreach at scale.
The typical use case: build a highly targeted list using firmographic and technographic filters, auto-enrich each company with recent news, funding data, and technographics, then generate personalized first lines for cold emails, all in one workflow.
Why it's on this list
Teams switching from Cognism often discover they were paying for data they could access through Clay at a fraction of the cost, with more sources and better personalization workflows attached.
Where it's different
- Not a plug-and-play prospecting tool. Requires setup and a learning curve.
- Data access requires credits per row per enrichment column
- Best paired with a sequencing tool for outreach execution
Best for: Ops-savvy teams and agencies that want maximum data flexibility, AI-powered personalization, and the ability to build custom enrichment workflows without being locked into one data provider.
If you are actively looking for more tools that have similar capabilities to Clay, you might also want to read Clay alternatives for GTM teams
How to choose the right Cognism alternative for your team?
No listicle makes this decision for you. Here's a simple decision tree.
| If your primary need is… | Go with… |
|---|---|
| Full GTM platform with ad activation + attribution | Factors.ai |
| Affordable all-in-one prospecting + outreach | Apollo.io |
| Deep US enterprise data + conversation intelligence | ZoomInfo |
| Fast LinkedIn-native contact capture | LeadIQ or Lusha |
| Human-verified US phone numbers | SalesIntel |
| Transparent credits, strong accuracy guarantee | UpLead |
| HubSpot-native enrichment | Clearbit / Breeze Intelligence |
| AI-enriched outbound list building | Clay |
| High-volume real-time verification | Seamless.AI |
| Staying with Cognism for EMEA-heavy outbound | Cognism |
Look… most teams are NOT choosing one tool; they're choosing a primary platform and pairing it with something for the gaps. Factors.ai + Apollo, ZoomInfo + Cognism for EMEA, Clay + any sequencer- these combinations are common for a reason.
What matters is knowing which capability you need most, before you start talking to sales reps who will happily convince you their platform does everything.
FAQs for Cognism alternatives
Q1. What are the main reasons teams switch from Cognism?
The three most common drivers are geographic coverage gaps (weak outside EMEA), opaque pricing and rigid annual contracts, and the lack of built-in outreach sequencing. Teams selling into North America or APAC often find competitors offer better contact accuracy at a lower price. Teams that need outreach automation alongside contact data tend to move to Apollo or a combined Factors.ai + outreach stack.
Q2. How much does Cognism actually cost in 2026?
Cognism doesn't publish pricing. Based on third-party procurement data, the platform fee runs $15,000–$25,000/year before per-seat costs of $1,500–$2,500 per user annually. A 5-person team on the Grow plan typically runs ~$22,500/year. Elevate (Diamond Data tier) for the same team runs ~$37,500+. Onboarding, intent topic add-ons, and annual renewal increases push the real first-year cost higher.
Q3. Is Factors.ai a direct Cognism competitor?
Not exactly, and that distinction matters. Cognism is a contact database with compliance features. Factors.ai is an account intelligence and GTM platform that identifies companies visiting your website, activates those accounts through LinkedIn and Google Ads, and attributes revenue across channels. If you need phone numbers for cold calling, Factors.ai isn't the replacement. If you need to know which accounts are in-market, how to reach them through paid channels, and which campaigns are actually driving pipeline, Factors.ai does things Cognism can't.
Q4. Does Apollo.io have better data than Cognism?
For Europe: no. Cognism's EMEA coverage and Diamond Data phone verification are genuinely superior. For North America and global SMB coverage: Apollo is more affordable and comparable in accuracy for most use cases, though Cognism's verify rate on mobile numbers is higher. Apollo's data accuracy sits around 80–85%, and Cognism's Diamond Data verification is closer to 98% for verified numbers (though that verified set is smaller than Apollo's total database).
Q5. What's the best Cognism alternative for small teams or startups?
Apollo.io is the most practical choice at the lower end of the market: it combines contact data and outreach sequencing in one tool, offers a free plan, and paid tiers start at ~$49/user/month. UpLead is the better pick if outreach automation isn't needed and data accuracy is the priority, with transparent credit-based pricing and a 95% accuracy guarantee.
Q6. Can Clay replace Cognism?
Clay can access Cognism's data as one of its 75+ source integrations, so technically yes… you can pull Cognism contacts through Clay. But Clay is a workflow tool, not a standalone database. Teams that switch from Cognism to Clay typically do so because they want to combine multiple data sources, not because Clay's own data is superior. Expect a learning curve and budget for credits per enrichment.
Q7. What if I need GDPR-compliant data but Cognism's pricing is too high?
Factors.ai's GDPR-compliant tracking covers company-level identification without storing personal data. Kaspr is another alternative for European teams at a lower price point, particularly for LinkedIn-based prospecting. Dealfront (formerly Echobot + Leadfeeder) is specifically built for GDPR-compliant European coverage. For teams that primarily need website visitor identification from European accounts,
Q8. Does Factors.ai require a contact database to be useful?
Factors.ai identifies accounts at the company level. Most teams pair it with Apollo, ZoomInfo, or Lusha for contact enrichment. The combination is powerful: Factors.ai tells you which companies are in-market and engaging; your contact database tells you who to call there. Separately, each covers half the picture. Together, they replace the guesswork.

AI Marketing Software: The Best Platforms for Modern B2B Marketing Teams
Compare the best AI marketing software for B2B teams in 2026. Learn which tools drive pipeline, automate workflows, and improve attribution.
TL;DR
- Most AI marketing software conversations focus on feature counts and content generation speed, but the teams winning in 2026 aren't the ones with the most tools, they're the ones who actually know what's working and why.
- Attribution and pipeline visibility are now *more* valuable than content generators, not because content doesn't matter, but because measurement is the bottleneck most teams refuse to admit they have.
- Comparing Jasper to Factors.ai is like comparing Canva to Salesforce. They solve fundamentally different problems, and the best ai marketing software depends entirely on the job you're hiring it to do.
- AI amplifies existing systems. Good data and clean processes get more efficient, but broken systems just break faster (and more expensively).
- The next wave isn't "more AI tools." It's fewer tools that unify data, context, decisions, and actions, so marketers stop stitching together twenty disconnected dashboards every morning.
I was on a call last week with a marketing leader who'd just finished a vendor demo. She turned to me and said, "They used the word *AI* forty-three times in forty-five minutes, and I still don't know what the product actually does." I laughed, because I've been on that exact call before… And I know you’ve been through this too. Multiple times. The pitch always sounds the same: revolutionary AI, game-changing automation, intelligent everything. And then you ask, "Can this tell me which campaigns are actually driving pipeline?" and then suddenly the WiFi signal is weak.

That moment captures what's happening across the AI marketing software *landscape* right now. The category has exploded in size (sometimes unnecessarily), and nearly every marketing tool has slapped an "AI-powered" badge on its homepage. But for B2B teams trying to run smarter campaigns, measure revenue impact, and stop wasting budget, the sheer volume of options has made buying decisions harder, not easier. This is the guide I wish someone had handed me two years ago.
For the hundredth time, what is AI marketing software, really?
The term "AI marketing software" gets used SOO loosely that it's practically meaningless without context. At its simplest, it refers to any marketing tool that uses machine learning, natural language processing, or predictive analytics to automate, optimize, or personalize marketing activities. But that definition covers everything from a chatbot widget to a full-blown revenue intelligence platform, so we need to be more specific.
There's a BIG difference between four levels of AI in marketing today.
- First, you've got AI *features*, which are things like predictive subject lines or smart send-time optimization bolted onto an existing platform.
- Then there are AI *copilots*, like HubSpot's Breeze Copilot, which sit alongside you and help draft content, summarize records, or surface insights on demand.
- Next come AI *agents*, autonomous systems that can plan, execute, and optimize tasks without constant human input.
- And finally, there are AI-native platforms, which were built from the ground up with AI as the core architecture, not a feature layer added after the fact.
Most of what vendors call "AI" today falls into the first two categories. Adding a chatbot inside a dashboard doesn't suddenly make a platform AI-native (wow, never thought I'd say that). The real evolution has moved from basic marketing automation through CRM automation and predictive analytics into what some are calling agentic marketing systems, where software doesn't just follow rules but makes contextual decisions. The question marketers should ask before anything else is this… “does this software actually help me make *better* decisions, or does it just generate more output?”
Why do most AI marketing software conversations miss the point entirely?
Open any listicle comparing the best AI marketing software, and you'll see the same evaluation criteria recycled across articles. Number of AI features. Content generation capabilities. Number of integrations. Maybe a prompt library or two will be needed. These factors mattered in 2023. But now, they're table stakes.
The deeper problem is that most buying frameworks still evaluate tools in isolation, as if the software itself is the strategy.
But ‘modern AI marketing’ software should AT LEAST help with five things that rarely appear on comparison checklists:
- understanding demand signals
- identifying high-value accounts
- prioritizing opportunities by revenue potential
- automating execution across channels
- measuring actual revenue impact.
When you evaluate tools through that lens, the 'AI market' looks very different.
After working across SaaS companies for nearly half a decade, one recurring pattern keeps showing up. Marketing teams fail because they have fragmented data, broken attribution, and different versions of reality. Sales thinks the webinar drove the deal. Marketing thinks it was the LinkedIn ad. Finance looks at a spreadsheet and trusts neither (typical finance, I know).
Now, adding another AI tool on top of a messy stack often creates more confusion and chaos. The question then becomes this: "do I have the foundation for any AI tool to actually work?"
What are the different categories of AI marketing software
One of the biggest mistakes marketers make when shopping for AI marketing software is comparing tools that solve *fundamentally* different problems. Before we get into specific recommendations, it helps to understand the landscape.
- AI content creation software
Tools like Jasper, Writer, Claude, and ChatGPT live here. Their primary job is to accelerate content production: blogs, ad copy, emails, landing pages, social posts. These tools have gotten remarkably capable at generating first drafts and repurposing existing content across formats. They're the best AI software for content marketing when your bottleneck is volume.
- AI marketing automation platforms
This is where HubSpot AI, Marketo, and Salesforce Marketing Cloud (now rebranded as Agentforce Marketing) sit. These platforms handle lead nurturing, workflow automation, and campaign orchestration. They're the backbone of the best ai software for marketing automation, managing the operational side of how campaigns get built and delivered.
- AI attribution and analytics platforms
Factors.ai, HockeyStack, Dreamdata, and Cometly focus on a different problem altogether: connecting marketing touchpoints to actual revenue. They handle multi-touch attribution, pipeline visibility, and buyer journey analysis. For B2B teams with long sales cycles and multiple stakeholders, this category answers the question that keeps CMOs up at night: "where is pipeline actually coming from?"
- AI-powered ABM platforms
Factors.ai, Demandbase, and 6sense specialize in account-based marketing. They help teams identify target accounts, track intent signals, score accounts against your ICP, and prioritize which companies deserve attention right now. These platforms sit at the intersection of ai marketing software for lead generation and strategic sales alignment.
- AI agents and autonomous marketing systems
This is the newest category, and it's evolving fast. Tools like Scout, Agentforce, and Tofu AI can run autonomous workflows, conduct research, support decision-making, and optimize campaigns with minimal human input. In 2026, marketing teams are increasingly deploying agents that handle targeting, messaging, timing, and budget allocation in real time.
Comparing Jasper against Factors.ai is like comparing Canva against Salesforce. They solve completely different problems. You wouldn't evaluate a design tool and a CRM using the same rubric, and you shouldn't do it with AI marketing software either.
The best AI marketing software platforms
"Best" is a loaded word in any software comparison. The best AI marketing software 2026 depends entirely on the job you're hiring it to do. I'm organizing these recommendations by use case rather than vendor popularity, because that's how buying decisions actually work in practice.
Best AI marketing software for attribution and pipeline intelligence
- Factors.ai stands out here
The platform handles multi-touch attribution, visitor identification, company intelligence, AI-powered account insights, and pipeline measurement. It tracks how accounts move across channels (organic search, paid ads, LinkedIn, email, G2, direct traffic) and attributes pipeline and revenue to each touchpoint. The LinkedIn analytics are particularly detailed, showing which campaigns influenced which accounts at the impression level.
For B2B teams spending meaningful budget on LinkedIn and Google Ads, this visibility is difficult to get from native platform analytics alone. The platform also offers account scoring that uses real engagement signals (website behavior, content consumption, ad interactions, and third-party intent) to produce a live, ranked list of accounts showing the most buying activity.
As budgets get scrutinized harder, attribution platforms are becoming *more* valuable than content generators. Most marketers don't have a content problem. They have a measurement problem, and they know it. Attribution debates sometimes resemble group projects where everyone claims credit for the final result.
Best AI software for marketing automation
- HubSpot has invested heavily in AI capabilities under its Breeze AI umbrella.
Breeze Copilot helps write content and research contacts. Breeze Agents handle content creation, social media, prospecting, and customer service autonomously. The platform now includes AI-powered workflow building from plain language, predictive lead scoring, and an AEO (Answer Engine Optimization) tool that tracks how your brand surfaces in AI-powered search engines.
- Marketo remains a strong choice for teams with complex nurture programs, especially those already in the Adobe ecosystem.
Its lead scoring and campaign orchestration are mature and well-documented.
- Salesforce Marketing Cloud (now Agentforce Marketing) represents the enterprise end of this spectrum.
It brings agentic automation, generative content, and decisioning capabilities into marketing operations, all grounded in CRM data through Data Cloud. The recent Spring '26 release added campaign brief generation within Agentforce conversations and business unit support for enterprise-scale deployments.
Best AI marketing software for ABM
- Factors.ai
Combines account identification, intent signals, and dynamic audiences at a price point that's accessible to mid-market teams. It scores accounts based on engagement across your website, content, ads, and third-party sources, then alerts your team in Slack or via email when high-intent accounts surface.
- 6sense
The prediction engine of the ABM category. Its core strength is identifying accounts that are actively researching a purchase *before* they raise their hand, using AI-driven buying stage models. It's the strongest choice for sales-led organizations that need a daily "who to call" feed.
- Demandbase
Approaches ABM from an advertising-first angle. Its native DSP is genuinely differentiated for B2B ad targeting, with daily audience syncing and tight feedback loops between ad engagement and account scoring. Both 6sense and Demandbase carry enterprise price tags (typically $50K to $200K+ annually), so they make the most sense for organizations with dedicated ABM teams and mature go-to-market operations.
Best AI software for content marketing
- Jasper and Writer
Purpose-built for marketing content at scale. They handle blog drafts, ad variations, email copy, and landing page text with configurable brand voice settings. Writer, in particular, has carved out a niche with enterprise teams that need governance and style consistency.
- Claude and ChatGPT
General-purpose AI models that marketing teams have adopted as creative workhorses. They're versatile and powerful for brainstorming, outlining, editing, and repurposing content across formats.
PS: I think you should know this… AI can help scale content production, but it can't manufacture expertise. The companies winning with AI content aren't producing *more* content. They're producing more *informed* content, pieces grounded in original data, customer conversations, and genuine subject-matter depth. No attribution model answers every question perfectly, and anyone who tells you otherwise is probably selling one.
Best AI marketing software for lead generation
- Factors.ai
Handles the intelligence layer of lead generation: identifying companies visiting your website (even those who never fill out a form), scoring them against your ICP, and surfacing intent signals across channels. It's AI marketing software for lead generation that focuses on quality over raw volume.
- ZoomInfo and Apollo
Provide the contact data layer, verified emails, phone numbers, firmographic and technographic intelligence for outbound prospecting. Clay sits in the workflow automation space, stitching together enrichment from multiple data sources into personalized outreach sequences.
Best AI marketing software for enterprise teams
Enterprise teams need a different set of capabilities: governance, security, workflow orchestration, and large-scale implementation support.
- Factors.ai
Offers enterprise plans with AI-driven scoring, advanced analytics, and CRM integration for larger deployments.
- Salesforce (through Agentforce Marketing)
Offers the deepest enterprise infrastructure, with business unit partitioning, Data Cloud integration, and a Trust Layer that governs all AI data handling.
- Adobe
Brings its marketing suite capabilities to enterprise content and experience management.
- Demandbase
Remains the best AI marketing software for enterprise ABM teams running significant paid media budgets alongside account-based strategies.
AI marketing software comparison table
This AI marketing software comparison highlights a key point: no single platform does everything well. The leading AI marketing software providers each anchor in a specific use case and expand outward. The real tradeoff isn't features vs. features. It's whether the platform solves *your* specific bottleneck or just adds another dashboard to check every morning.
How do you choose the right AI marketing software?
Choosing the best AI software for marketing requires more than reading G2 reviews and booking demos. Here's a framework that actually works.
Step 1: Identify your bottleneck
Are you struggling with content production, attribution, lead generation, pipeline visibility, or account-based targeting? The answer determines which category of tool deserves your budget. Most teams try to solve three problems simultaneously with one purchase and end up solving none.
Step 2: Audit your existing stack
What tools do you already have? Where does data live, and where does reporting break down? If you're running GA4, a CRM, separate ad platforms, and maybe an intent data feed, you've already got fragmented data. Understanding what exists is the only way to figure out what's missing.
Step 3: Evaluate your AI readiness
Is your CRM data clean? Do you have reliable tracking in place? Is intent data available and actionable? These aren't hypothetical questions. AI tools can only work with the data they're given.
Here's one uncomfortable truth that I keep coming back to: AI amplifies existing systems. Good systems become more efficient. Broken systems become broken *faster*. If your CRM is a mess, buying an AI-driven marketing platform won't fix it. You'll just see your problems rendered in higher definition (duh).
Building an AI-first marketing stack
The modern B2B marketing stack is evolving from a collection of dashboards into a layered system. Here's how I think about the architecture.
- Foundation layer
Your CRM (HubSpot, Salesforce), product data, and core analytics. Everything else depends on this being clean and connected. If your foundation is unreliable, every layer above it produces unreliable outputs.
- Intelligence layer
This is where Factors.ai lives, along with intent signals and attribution platforms. The intelligence layer answers questions like "which accounts are showing buying intent?" and "which campaigns are actually influencing pipeline?" It turns raw data into decisions.
- Execution layer
HubSpot, Marketo, ad platforms, email tools. The execution layer is where campaigns get built, launched, and managed. It needs clean inputs from the intelligence layer to perform well.
- Agent layer
Scout, Agentforce, and other workflow agents that can autonomously research accounts, optimize campaigns, and surface recommendations. This layer is nascent but growing faaaar faster than most teams realize.
The future stack is becoming less dashboard-heavy and more agent-driven. Instead of opening ten tools every morning, marketers will increasingly ask systems questions and receive recommendations or actions. We're not fully there yet, but the trajectory is clear.
Common mistakes companies make when buying AI marketing software
- Buying AI before fixing data quality
I've watched teams sign six-figure ABM contracts with dirty CRM data and incomplete tracking. The platform can't identify high-intent accounts if your website analytics aren't instrumented correctly. Clean data first. AI second.
- Chasing features instead of outcomes
A platform with forty AI features sounds impressive until you realize your team only uses three. The best AI software for digital marketing is the one that solves a specific problem and gets adopted by your team, not the one with the longest feature list.
- Creating tool sprawl
Every new tool adds integration complexity, maintenance overhead, and context-switching. Before adding another platform to your stack, ask whether an existing tool can be better configured to handle the job. Tool sprawl is the silent budget killer in B2B marketing.
- Ignoring attribution
If you can't measure what's working, you can't improve it. Teams that skip attribution end up making budget decisions based on gut feel and internal politics. That might work for a quarter or two, but it catches up eventually.
- Expecting AI to replace strategy
The biggest misconception in marketing right now is that AI eliminates strategic thinking. In reality, strategy becomes *even more valuable* because execution is becoming commoditized. When everyone can produce content at scale, the competitive advantage shifts to who has the clearest understanding of their market, customers, and positioning.
AI marketing software for different B2B growth stages
- Early-stage startups
Keep it simple. HubSpot's free and starter tiers, ChatGPT for content ideation and drafting, and basic analytics (GA4 plus whatever your CRM provides) are enough. You don't need an enterprise ABM platform when your target account list fits in a spreadsheet. Spend your budget on understanding your ICP, not on software.
- Scaling SaaS companies
This is where Factors.ai earns its place. As pipeline grows, attribution becomes essential for knowing which channels deserve more investment. Advanced attribution, account identification, and ABM capabilities start paying for themselves when you're spending meaningful budget on LinkedIn, Google Ads, and content programs.
- Mid-market organizations
At this stage, multi-channel orchestration and intent data become critical. You're likely running several campaigns simultaneously across channels, and the buyer journey involves multiple stakeholders over weeks or months. An ai-driven marketing suite that unifies data across these touchpoints stops your team from operating on different versions of reality.
- Enterprise teams
Governance, AI agents, cross-channel measurement, and scalable workflows define the enterprise stack. Platforms like Salesforce Agentforce, Factors.ai at the enterprise tier, and Demandbase handle the complexity of global teams, multiple business units, and regulatory requirements. The best ai marketing software for enterprises 2025 and 2026 prioritizes security, auditability, and operational control alongside AI capabilities.
The best AI software is often the one that matches your operational maturity, not the most expensive platform on the market.
The future of AI marketing software
Several themes are converging that will reshape the ai marketing software landscape over the next few years.
- AI agents become operating systems
Salesforce's Connections 2026 event centered entirely on "becoming an Agentic Enterprise," and HubSpot's Breeze Agents are already handling prospecting and content autonomously. The shift from "AI in the stack" to "agents running the stack" is underway.
- Marketing workflows become autonomous
Instead of manually configuring nurture sequences and campaign logic, marketers will define goals and guardrails while agents handle execution, testing, and optimization. Salesforce's State of Marketing report found that 19.20% of marketers are already using AI agents to automate marketing initiatives end to end, and that number is climbing fast.
- Attribution becomes real-time
Multi-touch attribution has historically been a backwards-looking exercise. Platforms like Factors.ai are moving toward real-time account activity detection and predictive conversion scoring, which means teams can act on signals while buying intent is still active.
- Marketing tech stacks consolidate
The next wave is fewer tools that do more. The winners will likely be platforms that unify data, context, decisions, and actions rather than forcing marketers to stitch together twenty disconnected products. The patchwork approach loses to integration in 2026, and that trend will only accelerate.
AI software doesn't fix broken marketing
The AI marketing software market is sooo crowded right now. Every platform claims to automate growth, drive pipeline, and revolutionize your GTM motion. Very few help marketers answer the questions that actually matter: What's working? Which accounts deserve our attention? Where is the pipeline coming from? And what should we do next?
After nearly a decade in B2B SaaS marketing, the biggest shift I've seen isn't that AI is replacing marketers. It's that AI is *exposing* which marketing teams genuinely understand their customers, data, and revenue engine and which teams were quietly relying on guesswork the whole time. The software itself isn't the advantage. The advantage comes from how intelligently a team uses it, how clean their data is, and whether they've built the operational maturity to turn insights into action.
The marketers who win the next decade won't be the ones running the most AI tools. They'll be the ones who consistently make better bets with the same data everyone else has access to.
Frequently asked questions about ai marketing software
Q1. What is AI marketing software?
AI marketing software refers to tools that use machine learning, natural language processing, or predictive analytics to automate, optimize, or personalize marketing activities. This includes everything from content generation platforms like Jasper and ChatGPT to attribution and intelligence platforms like Factors.ai, marketing automation tools like HubSpot and Marketo, and ABM platforms like 6sense and Demandbase. The category is broad, which is why understanding the specific problem you're trying to solve matters more than the label on the box.
Q2. Which is the best AI marketing software in 2026?
The best AI marketing software in 2026 depends on what you're trying to accomplish. For attribution and pipeline intelligence, Factors.ai is a standout. For all-in-one marketing automation, HubSpot's Breeze AI suite offers the widest accessible feature set. For enterprise ABM with advertising, Demandbase and 6sense lead the category. For content generation at scale, Jasper and Writer are purpose-built. There's no single "best" tool, only the best tool for your specific use case and growth stage.
Q3. What is the difference between AI marketing software and marketing automation software?
Marketing automation software follows predefined rules to execute workflows: "if lead opens email, wait two days, send follow-up." AI marketing software goes further by learning from data, predicting outcomes, and adapting behavior without manual rule configuration. Modern platforms like HubSpot and Salesforce now blur the line by embedding AI capabilities directly into their automation engines. The practical difference is whether the software *follows* rules or *learns* from patterns.
Q4. How does AI marketing software improve lead generation?
AI marketing software improves lead generation by identifying which companies are showing buying intent, scoring them against your ideal customer profile, and prioritizing the highest-value opportunities for outreach. Platforms like Factors.ai identify anonymous website visitors at the account level, track engagement across multiple channels, and surface real-time alerts when target accounts are active. This shifts lead generation from "spray and pray" toward focused, signal-driven engagement.
Q5. What AI marketing software is best for B2B SaaS companies?
B2B SaaS companies with long sales cycles and multi-stakeholder buying journeys benefit most from platforms that combine attribution, account intelligence, and ABM capabilities. Factors.ai is particularly well suited because it unifies website, CRM, LinkedIn, and G2 data to map full buyer journeys. For marketing automation, HubSpot is the most popular choice among SaaS companies from startup through mid-market. Enterprise SaaS teams often layer in Salesforce or 6sense as their scale demands it.
Q6. Is AI marketing software worth the investment?
It depends on whether you have the operational foundation to use it effectively. If your CRM data is clean, your tracking is reliable, and your team has a clear strategy, AI marketing software can significantly improve efficiency, attribution accuracy, and pipeline visibility. If your data is fragmented and your processes are undefined, even the most expensive platform will underperform. The investment pays off when the foundation supports it.
Q7. What should enterprises look for in AI marketing software?
Enterprise teams should prioritize governance and security (SOC 2, GDPR, CCPA compliance), scalable workflow orchestration, business unit support, robust CRM integration, and AI capabilities grounded in unified customer data. Platforms like Salesforce Agentforce Marketing, Demandbase, and Factors.ai at the enterprise tier offer these capabilities. Implementation support and dedicated customer success resources also matter significantly at enterprise scale, because a tool that takes six months to deploy and requires dedicated ops headcount needs to deliver proportional value.
Q8. How do AI marketing platforms integrate with CRM systems?
Most leading ai marketing platforms offer native integrations with Salesforce and HubSpot, including bi-directional data sync, automated field updates, and embedded insights within CRM records. Factors.ai, for example, syncs account-level engagement data directly into your CRM so sales teams can see a full account timeline before making outreach. The quality of CRM integration varies significantly between vendors though, so it's worth testing the actual data flow during evaluation rather than relying on "we integrate with everything" promises.
Q9. Can AI marketing software replace marketers?
AI isn't replacing marketers. It's changing what marketers spend their time on. Content drafting, data analysis, workflow management, and campaign optimization are all becoming faster with AI assistance. But strategic thinking, customer empathy, creative positioning, and cross-functional leadership remain deeply human skills. The marketers who thrive in 2026 are the ones who use AI to eliminate busywork and invest the recovered time into higher-value strategic work, not the ones who try to automate their way out of understanding their market.
AI marketing implementation: the complete transformation roadmap for B2B teams
Learn how to implement AI across your B2B marketing team, stack, and workflows with a practical roadmap focused on pipeline, scale, and ROI.
TL;DR
- Most AI marketing implementations fail because they're solving for tools, not for broken workflows, bad data, and missing visibility across the funnel.
- There's a meaningful difference between AI usage, AI adoption, and AI transformation, and most B2B teams are stuck at stage one while pretending to be at stage three.
- An AI marketing implementation plan that starts with business outcomes (pipeline, conversion, revenue) will outperform one that starts with "let's try ChatGPT for blog posts" every single time.
- The companies building an AI-first marketing stack aren't adding more dashboards. They're connecting fragmented signals across CRM, ads, analytics, and revenue data into a single operating model.
- Scaling content with AI without a human editorial layer doesn't create a competitive moat. It creates noise, and your audience already has *wayyy* too much of that.
- If your AI reporting dashboard ends at "hours saved," you're measuring inputs while your CFO cares about outcomes.
Last quarter, I sat in a leadership meeting where someone said, "We need to be more AI-first." I nodded along, like everyone else. Then someone asked the obvious follow-up: "What does that *actually* mean for us, specifically?" The silence was… eerily extraordinary. Ten WHOLE seconds of it. I'm not entirely sure anyone on that call knew what that sentence meant (including the person who said it).
That moment has become a recurring theme in almost every B2B marketing conversation I've had this year. Teams are buying AI tools, running pilot projects, building prompt libraries, and still struggling to answer the simplest question: *Is any of this making us better?*

This is a guide to AI marketing implementation that doesn't start with a tool recommendation or a vendor comparison. It starts where I think every AI marketing transformation roadmap should begin: with the system you already have, the outcomes you actually need, and the BIG gap between where you are and where you think you are.
Why are most AI marketing implementations failing?
After working with SaaS companies, startups, growth teams, and enterprise marketers, I’ve noticed that most companies have an operations problem disguised as an AI problem.
For the past two years, marketers have been acquiring tools faster than we were catching Pokemons (yes, we all remember the Pokémon Go phase).
The Content Marketing Institute found that 54% of B2B marketing teams take an ad hoc approach to AI, experimenting without applying it widely.
Only 19% reported that they've integrated AI into their daily processes and workflows.
The result is a stack full of copilots generating outputs but rarely improving business outcomes.
This is what I call "pilot purgatory." A team runs a promising experiment with an AI writing tool or an audience segmentation model. The results look decent. And then nothing happens. The experiment never connects to a repeatable workflow, a measurement framework, or a revenue outcome.
McKinsey's findings illustrate this gap, showing that only 21% of businesses have redesigned some workflows around AI.
Everyone else remains stuck in earlier stages of integration.
The core issue is that 90% of AI discussions focus on tools instead of systems. CMOs keep asking "Which AI tool should we buy?" when they should be asking "Which bottleneck are we removing?" AI simply scales whatever system already exists. If your handoffs, attribution, and reporting are broken, AI just helps you break them faster.
What does AI marketing implementation actually mean?
Using ChatGPT to write LinkedIn posts isn't ✨AI transformation✨. I need to say that clearly because a surprising number of teams genuinely believe it is.
There's a spectrum here, and collapsing the terms together creates confusion. Let me break it down: AI *usage* means individuals on your team are experimenting with tools on their own, often without coordination. AI *adoption* means the organization has started standardizing around specific tools and use cases. AI *implementation* means those tools are connected to workflows, data systems, and measurement. AI *transformation* means the operating model itself has changed: how decisions get made, how teams are structured, and how campaigns move from idea to execution.
Connecting customer data, campaign data, CRM data, intent signals, content workflows, and decision-making systems into a unified operating model is what real AI and marketing integration looks like. That's the difference between having AI in your stack and building an AI-first marketing organization.
The concept of AI-native marketing is gaining traction because it describes organizations where AI isn't layered on top of existing processes; it's woven into how those processes function from the beginning.
The dividing line will be between B2B marketing organizations that are AI-enhanced and those that are truly AI-native, where some teams manage individual tools while others will have autonomous systems generating pipeline around the clock."
The emerging trend of agent-based marketing pushes this even further.
AI agents have advanced from simple automation to becoming a strategic workforce capable of executing high-impact go-to-market strategies, acting as systems that can understand and respond to customer inquiries without human intervention.
AI is increasingly becoming part of buying journeys themselves, not just the marketing side of them.
Before you buy another AI tool: audit your marketing system
Most companies jump straight into AI content generation. Meanwhile, nobody can explain why opportunities are stalling in Stage 2 of the pipeline. That's backwards.
Before you evaluate a single new tool, you need to understand the system those tools would plug into. I break this into three layers, and I'd recommend scoring your team honestly against each one.
Data layer. Can you trust your CRM data? Is your attribution setup actually reflecting buyer journeys, or just the last click? Do you have intent data, and if so, does anyone use it? Are your first-party signals (website behavior, content engagement, product usage) connected to anything downstream?
Execution layer. How long does it take to launch a campaign from brief to live? Where do content workflows break down? Is ad management centralized or scattered across team members? Can you pull a revenue report without spending a full day building it?
Intelligence layer. Do you have any forecasting in place? Is audience segmentation based on real behavioral data, or on assumptions from six months ago? Can marketing and sales agree on what pipeline visibility actually looks like?
The questions to ask before any ai integration in marketing initiative are deceptively simple. Can we trust our data? Do teams work from the same source of truth? Where are the biggest time drains? If you can't answer these confidently, AI isn't going to fix that. It'll just automate the confusion.
The AI marketing maturity framework
I've built a five-stage model for thinking about where your team sits. Honest self-assessment matters more here than aspiration (because marketers *never* lie about how advanced they are).
| Stage | Description | What it looks like |
|---|---|---|
| Stage 1: AI curiosity | Individual experimentation, no governance | People using ChatGPT on their own, sharing prompts in Slack |
| Stage 2: AI assistance | Content generation, research, summaries | Standardized tools for drafting, but disconnected from workflows |
| Stage 3: AI automation | Workflow automation, lead routing, campaign ops | AI embedded in specific processes with clear triggers and outputs |
| Stage 4: AI orchestration | Cross-channel coordination, data-connected decisions | AI tools talking to each other, informing real-time decisions |
| Stage 5: AI-native marketing | AI embedded in operating model, agents supporting execution | Human teams focused on strategy while agents handle execution |
The state of AI in B2B marketing right now is messyyyy. What I mean is… adoption is high, but competence is low 🥀
Most teams I talk to are somewhere between Stage 1 and Stage 2, which is totally fine. The problem isn't being early. It's pretending you're at Stage 4 while operating at Stage 1. That misalignment leads to bad investments and frustrated teams.
If most enterprise marketing teams report confidence in their AI tools, but almost none have centralized intelligence or orchestrated execution, then AI satisfaction and AI maturity are two very different things.
Building your AI marketing implementation plan
An effective AI marketing implementation plan doesn't start with "more AI usage." It starts with business outcomes. What does the business actually need? More pipeline. Faster campaign launches. Better content velocity. Higher conversion rates. If your plan can't connect directly to one of those, it's an experiment, not a strategy.
Step 1: Define business outcomes. Be specific. "Increase marketing-sourced pipeline by 20% in two quarters" is a business outcome. "Use more AI" is a wish.
Step 2: Prioritize use cases. Rank every potential AI use case by three criteria: revenue impact, ease of implementation, and required integrations. The use cases that score high on impact and low on complexity should go first. The ones that require rebuilding your entire data infrastructure can wait.
Step 3: Build governance. This is where most teams skip ahead and pay for it later. Governance means prompt libraries that enforce brand consistency, approval systems for AI-generated content, security protocols for data flowing into third-party models, and clear ownership of who reviews what. Without it, you end up with ten people using ten different prompts to generate inconsistent outputs across every channel.
Step 4: Train teams. AI literacy isn't optional. Your team needs to understand not just how to use the tools, but how to design workflows around them and interpret the data they produce.
Organizations combining AI deployment with clearly defined KPIs and formally redesigned workflows achieve 2.7 times higher ROI than those using AI without structural changes.
Training is the structural change most teams overlook.
Designing an AI-first marketing tech stack
The future stack isn't about adding more dashboards. When I look at ai integrations for marketing tech stack decisions, the teams that get it right organize their stack around four layers, not tool categories.
Customer data layer. Your CRM, product analytics, and CDPs. This is where all account and user data lives. If this layer is fragmented, everything downstream is unreliable.
Intelligence layer. Intent platforms, attribution platforms, and revenue analytics. This layer answers the questions that matter: who's engaging, what influenced pipeline, and what should happen next. Tools like Factors.ai sit here as the connective intelligence layer.
Factors.ai is an AI-powered marketing intelligence and ABM platform that uncovers anonymous buyer intent, tracks the entire customer lifecycle, and connects marketing touchpoints directly to revenue by unifying data from websites, CRM, ad platforms, and intent sources.
- Execution layer. Content tools, email platforms, ad management, and marketing automation. These are the systems that actually *do* things. They create, send, publish, and optimize.
- Agent layer. This is the newest and fastest-growing layer. Research agents, reporting agents, and campaign optimization agents that can operate semi-autonomously once given clear objectives.
When evaluating AI integration options for marketing software, the question is whether it connects to your intelligence layer.
Factors.ai, for example, unifies account intelligence, web analytics, multi-touch attribution, and ad optimization, identifying which companies are engaging with your website and campaigns, mapping their journeys across channels, and helping teams prioritize high-intent accounts.
The AI stack for marketing that wins isn't the one with the most tools. It's the one with the cleanest signal flow.
How are B2B teams using AI across the funnel?
The most useful way to think about AI integration for marketing teams is by mapping AI capabilities to funnel stages, because the problems AI solves look very different at each stage.
- Awareness. AI excels at content ideation, SEO research, and social content generation. Teams use it to analyze competitor positioning, identify content gaps, and generate first drafts at scale. The time savings here are *real*, but this is also where quality risks are highest.
- Consideration. This is where personalization, audience segmentation, and dynamic website experiences come in. Unlike B2C, where personalization often targets a single consumer, B2B personalization must cater to an entire buying committee, and AI excels at analyzing firmographics, technographics, and individual engagement history to deliver personalized experiences for each stakeholder.
- Decision. Account prioritization, intent scoring, and opportunity intelligence are transforming how sales and marketing collaborate at the bottom of the funnel.
Tools like Factors.ai help teams prioritize the right accounts in sales outreach and ad campaigns using predictive scores based on intent, engagement, and fit.
Expansion, customer marketing, renewal prediction, and upsell signal detection. This is the stage most B2B teams forget about entirely, and it's where AI can quietly generate enormous value by identifying expansion opportunities before the customer even thinks to ask.
Scaling content marketing with AI (without creating junk)
The internet doesn't have a content shortage. It has a *relevance* shortage. That's the biggest misconception in marketing right now: that AI helps you publish more. The best marketers are using AI to think deeper, not louder.
When I talk to teams about how to scale content marketing with AI, I always start with what AI should and shouldn't own. AI should help you research faster, repurpose existing content more effectively, and personalize deeper for different audiences and buying stages. Humans should own positioning, original insights, strategic judgment, and the editorial decisions that determine whether content builds trust or erodes it.
AI-generated content can often feel generic, lacking the authentic voice and brand tone that builds trust, with 40% of marketers citing "robotic output" as a key downside. In other words, this is what they said:

Content volume alone is meaningless if every piece reads like it was written by the same interchangeable algorithm. When you scale marketing content with AI without a human editorial layer, you create noise, and the companies you're trying to reach are already drowning in it.
The framework I recommend is simple. Use AI for the first 70% of the work: research aggregation, outline generation, first drafts, metadata, and repurposing. Use humans for the remaining 30%: fact-checking, brand voice editing, strategic angle development, and final approval.
The efficiency gains come from AI handling research, first-draft generation, and metadata, while humans handle quality assurance and strategic decisions. Teams trying to skip the human review stage typically see quality degradation that erodes performance within three to six months.
Connecting AI across CRM, ads, analytics, and revenue data
Most B2B teams run HubSpot, Salesforce, LinkedIn Ads, Google Ads, GA4, and product analytics. But none of them actually talk to each other properly. This is the ‘connecting AI tools for marketing’ challenge that nobody wants to acknowledge because solving it is genuinely hard.
Data unification means stitching account-level engagement across every touchpoint into a single profile. Attribution means understanding which interactions actually influenced pipeline, not just which ones happened to be last. Conversion APIs mean sending real revenue signals back to ad platforms so they can optimize toward outcomes, not just form fills. Audience syncing means your highest-intent accounts are automatically flowing into your ad campaigns without someone manually exporting CSVs every week.
Factors.ai connects to your CRM, ad platforms, marketing automation, and third-party intent providers, de-anonymizing website traffic using IP resolution and identity graph technology, then aggregating all touchpoints into unified account profiles that show which companies are in active buying mode.
AI scoring ranks accounts by intent and conversion probability, automated alerts notify sales when high-intent targets engage, and ad audience sync ensures LinkedIn and Google campaigns automatically target the right accounts.
The future winner isn't the company with the smartest AI. It's the company where signals flow from the first website visit through to closed revenue without getting lost in a spreadsheet somewhere along the way.
The rise of AI-native marketing teams
The organizational chart is changing. Not because AI is replacing marketers (duh), but because the work itself is shifting.
B2B marketing operations roles are evolving from "managing tools" to "designing agent workflows."
Future roles that are already showing up include Marketing AI Strategist, Revenue Intelligence Manager, Prompt Architect, Automation Lead, and AI Operations Manager. The emerging "full-stack marketer" concept isn't really about one person doing everything. It's about individuals who understand how systems connect, how data flows, and how to orchestrate AI and human capabilities together.
Gartner predicts that by 2028, one in five marketing roles or functions will be held by an AI worker, and 65% of marketing teams already have designated AI roles.
The question that’s been long looming over our heads… “Will AI replace marketers?”. It won't. But marketers who understand systems, automation, and AI orchestration will outperform those who only execute tasks. That gap is going to get faaaar wider in the next two years.
AI marketing implementation challenges (and how to avoid them)
After working with dozens of teams on ai transformation for marketing companies, I've seen the same seven challenges show up again and again.
1. Bad data
If your CRM is a mess, your AI outputs will be a mess. Clean your data before you automate anything.
2. Too many disconnected tools
44% of SaaS licenses go unused. Adding more tools without integration creates more silos, not more intelligence. Consolidate before you expand.
3. No governance
Without clear prompt standards, approval workflows, and security protocols, AI outputs become unpredictable and inconsistent across the organization.
4. Team resistance
54% of marketers feel overwhelmed by the prospect of implementing AI tools into their processes. People resist what they don't understand. Training and transparency solve this faster than mandates.
5. Unclear ROI
Only about 29% of organizations say they can measure AI ROI confidently. If you can't prove value… budget disappears.
6. AI hallucinations
Overreliance on AI-generated content happens when teams use AI as a substitute for human judgment, publishing copy with minimal review. Say this with me… human review is NOT optional; it's the quality control layer (and filter) that protects your brand.
7. Leadership expecting instant results
The primary challenge isn't a technology problem, but an organizational one. Culture, governance, workflow design, and data strategy are the main constraints on realizing ROI.
A 90-day AI marketing transformation roadmap
This is the section I want you to bookmark. A practical, phase-by-phase ai marketing transformation roadmap that gives your team a real starting point.
Days 1-30: Audit
| Task | Details |
|---|---|
| System audit | Map every tool in your stack and identify integration gaps |
| Workflow audit | Document how campaigns move from idea to launch, step by step |
| Data audit | Assess CRM quality, attribution accuracy, and first-party signal coverage |
| Maturity assessment | Score your team against the five-stage maturity framework |
| Stakeholder alignment | Get leadership agreement on business outcomes AI should drive |
Days 31-60: Pilot
| Task | Details |
|---|---|
| Content workflows | Deploy AI for research, drafting, and repurposing with human review |
| Reporting automation | Connect campaign data to pipeline data for automated dashboards |
| Audience segmentation | Build intent-based segments using behavioral and firmographic data |
| Governance setup | Create prompt libraries, review processes, and security protocols |
Days 61-90: Scale
| Task | Details |
|---|---|
| Integrations | Connect CRM, ad platforms, intent sources, and analytics into unified account profiles |
| Governance rollout | Standardize AI workflows across the entire marketing team |
| Measurement framework | Define operational, marketing, and revenue KPIs tied to AI initiatives |
| Agent evaluation | Assess where AI agents can handle research, reporting, or campaign optimization |
The sequencing matters because each phase builds on the previous one. You can't scale integrations if you haven't audited your data. You can't measure AI's impact if you haven't defined the outcomes it's supposed to drive. (Wow, never thought I'd say "sequencing matters" in a marketing blog, but here we are.)
How to measure AI marketing success
If your AI reporting dashboard ends at productivity metrics, you're measuring the wrong thing. Executives don't buy AI for faster content. They buy it for faster growth.
I recommend tracking metrics across three tiers.
- Operational metrics
Time saved per campaign, campaign velocity (idea to live), and content production time. These prove efficiency, and they matter, but they're not enough on their own.
- Marketing metrics
MQL efficiency, pipeline influenced by AI-assisted campaigns, and cost per opportunity. These connect AI activity to demand generation outcomes. The most immediate ROI indicators from AI-assisted content are content velocity and cost per content unit, meaning total cost divided by outputs.
- Revenue metrics
Customer acquisition cost, win rate, and revenue generated from marketing-sourced pipeline. These are the numbers that keep your budget alive.
Organizations that align AI deployment with clearly defined performance KPIs report *significantly* better results than those adding AI without structural changes.
The companies that build measurement frameworks early won't just know whether AI is working. They'll know where it's working and where to invest next. That's a structural speed advantage most competitors won't have.
What will ‘AI-first B2B marketing’ look like by 2027?
Here's where I get to speculate, the fun and dangerous part (because marketers never lie about predictions either).
- Agent-assisted buying journeys are coming, where the buyer's AI interacts directly with the seller's AI. Autonomous campaign optimization will move from "AI recommends adjustments" to "AI makes the adjustments and tells you what it did." AI-generated audience models will replace static ICPs with dynamic, behavior-driven segments that update in real time.
- Revenue orchestration agents, AI-first marketing content examples and beyond, and real-time personalization across every touchpoint: all of this is moving from concept to production faster than most teams expect.
The companies that win won't be the ones using the most AI (you know that already, right? RIGHT?).
They'll be the ones that redesign how marketing works around it. Every process, every handoff, every decision point, every measurement loop. That's the difference between AI-enhanced marketing and an AI-first marketing organization. And for what it's worth, I don't think anyone fully knows how to do it yet. But the teams that start building the muscle now will be the ones that figure it out first.
In a nutshell
AI marketing implementation is an operating model shift that touches your data, your workflows, your team structure, and your measurement frameworks simultaneously. The teams stuck in pilot purgatory almost always share the same root cause: they started with tools instead of outcomes. If you take one thing from this piece, let it be the sequencing. Audit your system first. Fix your data layer. Define the business outcomes AI needs to drive. Then, and only then, build your implementation plan around specific use cases ranked by revenue impact.
The 90-day roadmap gives you a practical starting point, but the maturity framework gives you the honest lens to assess where you actually are. Most teams are at Stage 1 or 2. That's fine. What's not fine is staying there while pretending to be somewhere else. Start with the audit, pilot one or two high-impact workflows, connect your AI tools to real revenue data, and measure what actually matters: pipeline influenced, cost per opportunity, and win rate. The marketers who win the next decade won't be the ones who adopt the most AI tools. They'll be the ones who consistently make better decisions with the same signals everyone else has access to.
Frequently asked questions about AI marketing implementation
Q1. What is AI marketing implementation?
AI marketing implementation is the process of integrating AI tools, workflows, and decision-making systems into your marketing operations in a way that connects to measurable business outcomes. It goes beyond simply using AI for content drafts or research. True implementation means AI is embedded in your data layer, execution layer, and intelligence layer, informing how campaigns get built, how accounts get prioritized, and how performance gets measured against pipeline and revenue.
Q2. How do you create an AI marketing implementation plan?
Start with specific business outcomes, not tools. Define what you need AI to improve: pipeline, campaign velocity, conversion rates, or content throughput. Then prioritize use cases by revenue impact, ease of implementation, and required integrations. Build a governance framework covering prompt standards, review processes, and data security. Finally, train your team on both the tools and the workflows those tools connect to.
Q3. What is an AI-first marketing organization?
An AI-first marketing organization has restructured its operating model around AI capabilities rather than layering AI on top of existing manual processes. Decisions, workflows, and team structures are designed with AI as a core component from the start. Human teams focus on strategy, positioning, and creative judgment while AI handles execution, data analysis, and routine optimization tasks.
Q4. What are the biggest AI marketing implementation challenges?
The most common challenges include bad CRM data, disconnected tools that don't share signals, absence of governance frameworks, team resistance driven by lack of training, difficulty measuring ROI, AI-generated content quality issues like hallucinations, and leadership expecting transformation-level results in weeks rather than quarters.
Q5. How do you integrate AI into a marketing tech stack?
Think about your stack in layers: customer data, intelligence, execution, and agents. AI integration for marketing means ensuring that data flows between these layers, that your intelligence tools connect to your CRM and ad platforms, and that AI outputs feed back into decision-making loops rather than sitting in isolated dashboards.
Q6. How can B2B companies scale content marketing with AI?
Use AI for the research-heavy, repetitive portions of content production: topic ideation, first drafts, repurposing, metadata, and distribution optimization. Keep humans in control of positioning, original insights, editorial quality, and strategic judgment. Teams that skip the human review layer consistently see quality erosion within a few months, which undermines the efficiency gains AI was supposed to deliver.
Q7. What tools are needed for an AI-powered marketing technology stack?
An AI-powered marketing technology stack typically includes a CRM like HubSpot or Salesforce, an intelligence platform like Factors.ai for account identification and attribution, content and automation tools, ad platforms with AI optimization capabilities, and increasingly, AI agents for research, reporting, and campaign management. The specific tools matter less than whether they connect to each other and share data across the funnel.
Q8. How long does AI marketing transformation take?
A foundational 90-day sprint can get you through the audit, pilot, and initial scaling phases. But genuine transformation, where AI changes your operating model and team structure, typically takes six to twelve months of sustained effort across multiple functions.
Q9. What KPIs should marketers track after AI implementation?
Track metrics across three tiers. Operational metrics include time saved and campaign velocity. Marketing metrics include MQL efficiency, pipeline influenced, and cost per opportunity. Revenue metrics include customer acquisition cost, win rate, and total revenue generated from marketing-sourced pipeline. If you're only tracking the first tier, you're measuring inputs while your CFO needs to see outcomes.

How to use AI for marketing: the practical B2B marketer's playbook
Learn how to use AI for marketing across strategy, content, ads, attribution, ABM, and pipeline generation with a practical B2B framework.
TL;DR
- AI is most valuable in marketing when it's connected to revenue data, not used in isolation for content generation.
- Most teams get AI wrong by starting with tools instead of diagnosing what's broken in their workflows first.
- The highest-leverage AI use cases in B2B are account prioritization, attribution, and sales-marketing alignment, not first-draft copy.
- Integrating AI into marketing workflows requires governance, prompt libraries, and human review layers, not just subscriptions.
- AI agents are replacing AI assistants, and the marketers who will win are those who know exactly where to keep humans in the loop.
- Factors.ai is purpose-built for the B2B use cases where AI actually moves pipeline: account intelligence, intent signals, and attribution.
I've been through enough marketing trends to develop trust issues.
Marketing automation was supposed to fix demand generation. Predictive analytics was supposed to fix forecasting. ABM was supposed to fix the relationship between sales and marketing.
The technology usually worked. The humans remained stubbornly… human.
Now, AI feels wayyy bigger than those shifts. I think it probably is. But I'm noticing a familiar pattern. Teams are rushing to automate processes they haven't fully figured out yet.
Which is why the biggest AI wins aren’t from generating more content (shocking, isn’t it?!) They come from reducing bad decisions.
Knowing which accounts are actually worth pursuing. Identifying buying signals earlier. Separating genuine opportunities from expensive distractions.
The companies getting the most value from AI aren't necessarily creating more, but they're wasting less.
This blog is for marketers who are past the ‘let's try ChatGPT’ phase and want to build something that survives longer than the next hype cycle.
Good news: AI isn't replacing marketing; it's replacing marketing busywork
Here's what nobody says out loud in the AI marketing conversation: the parts of your job that AI is good at replacing are mostly the parts you weren't enjoying anyway (wohoo!).
The SERP analysis at 10 pm. The fourteenth variation of an ad headline. The manual account scoring spreadsheet that three people update inconsistently.
The parts AI is genuinely bad at replacing are the parts that require accumulated judgment: which market to enter next, which story will land with a specific buying committee, where to put budget when you have imperfect signal on all sides.
What this means practically is that AI is a force multiplier on your operational layer. It makes research faster, creation faster, optimization faster, and reporting faster. But the decisions those processes are meant to inform still require a human who understands the business context. A model that hasn't sat through your last board meeting, hasn't heard your customer call recordings, and doesn't know why you lost your three biggest deals last quarter cannot replace that judgment.
The marketers getting the most value from AI aren't the ones generating the most content. They're the ones who have been ruthless about separating "decisions that require human judgment" from "execution that can be systematized," and have moved the second category to AI as aggressively as possible.
What do most marketers get wrong about AI?
Let me be specific about the failure modes, because the usual framing of "AI isn't magic" is not actionable.
Mistake 1: Buying tools before diagnosing problems
The most common version of this I've seen is teams buying ChatGPT Enterprise before fixing attribution, or standing up an AI SDR platform before defining ICP clearly enough for a human SDR to qualify well. AI doesn't know what a good lead looks like if your team doesn't agree on what a good lead looks like.
If your conversion from MQL to SQL is 8% and you add AI to your lead scoring, you might get it to 12%. But if the real issue is that marketing and sales are working from different definitions of "qualified," AI just helps you surface that misalignment faster and at higher volume.
Mistake 2: Treating content as the whole use case
Content generation is the most visible AI use case because it's the easiest to demo. Ask a model to write a blog post and something coherent appears. This creates a distorted perception that AI for marketing means AI for writing.
Content is also, genuinely, one of the lower-leverage AI applications in B2B marketing. The highest-leverage applications are in intelligence, prioritization, and attribution, where AI can process signals at a scale and speed that changes what decisions you're even able to make. Writing a faster first draft of a blog post doesn't change your pipeline. Knowing which 40 accounts are showing buying behavior right now does.
Mistake 3: Expecting AI to compensate for bad data
"Garbage in, garbage out" has been a cliché since the mainframe era, and it is no less true because the system is now a large language model. If your CRM is a mess, your attribution is broken, and your first-party data is scattered across six tools that don't talk to each other, AI will help you be wrong faster and more confidently.
AI amplifies the quality of your systems. The teams winning with it are the ones who cleaned their data and connected their stack first, then added AI as an operating layer on top.
The 7-layer framework for using AI in marketing
This is the model I think about when evaluating where AI fits in a marketing organization. It's not a technology stack, it's an operating model.
Most teams are operating at layers 3 and 4 and calling it "AI-powered marketing." The real moat is in layers 1, 2, 6, and 7, where AI is touching decisions that affect pipeline and revenue, not just content volume.
How to use AI for marketing strategy?
Marketing strategy is where AI is both most powerful and most easily misused. The power comes from AI's ability to synthesize large amounts of information quickly, whether that's analyzing hundreds of customer reviews, mapping a competitive landscape, or identifying shifts in buyer search behavior. The misuse comes from treating AI-generated strategy as a substitute for the contextual judgment that comes from actually knowing your market.
The best strategy teams aren't replacing thinking with AI. They're using AI to eliminate spreadsheet archaeology so the thinking can start earlier.
- Market research and competitive analysis
AI is genuinely excellent at accelerating the research phase of strategy work. You can feed it earnings call transcripts, G2 reviews, competitive landing pages, and win/loss notes, and get back a synthesized view of where the category is moving faster than any analyst could produce manually. That synthesis is a starting point, not a conclusion. The strategic interpretation still requires someone who knows why your customers chose you over a competitor and what that actually means about positioning.
- ICP refinement using pipeline data
One of the highest-value applications of AI in strategy is feeding it your closed-won and closed-lost data and asking it to surface patterns. Which firmographic segments close fastest? Which deal sizes have the shortest sales cycles? Which personas appear most consistently in your best accounts? AI can identify these patterns across hundreds of deals in minutes. The output becomes input for sharper ICP definition, which then improves everything downstream: targeting, messaging, channel selection, and sales prioritization.
- Trend detection before it's obvious
Search behavior, forum discussions, and job posting patterns are all signals that can tell you where buyer attention is moving before it shows up in your pipeline. AI can monitor and synthesize these signals at a scale that's not manually feasible. If you're waiting for a trend to be obvious before you build content or positioning around it, you're already late.
How to use AI for content marketing
Content is where AI entered the marketing consciousness, and it's the area where the hype-to-reality gap is most visible. The promise was unlimited content at zero marginal cost. The reality is that AI-generated content that hasn't been shaped by genuine expertise and editorial judgment is almost immediately recognizable, and increasingly penalized, both by search algorithms and by readers who've gotten very good at spotting it.
The frame I'd suggest: AI is a capable first-draft machine for templated formats. It is a poor substitute for original thinking.
The content workflow that actually works
The workflow that produces high-quality AI-assisted content isn't "prompt and publish." It's:
- Research phase. Use AI to accelerate SERP analysis, identify content gaps, pull together existing thinking on a topic, and synthesize competitor content approaches. This alone saves hours.
- Brief and outline. Use AI to generate an initial structure, then edit it based on your own expertise and the specific angle you want to take. The angle almost always needs to come from a human who has an actual point of view.
- First draft. AI drafts the templated sections: definitions, explainer boxes, comparison tables, metadata. The sections that require genuine expertise, original data, or a strong POV should be written or substantially rewritten by a human.
- SME review and voice pass. This is non-negotiable. Someone with subject matter expertise needs to verify claims, add nuance, and inject the specific examples and stories that make a piece credible. If the AI draft and the final published piece look identical, you've published AI content with a human byline.
- Optimization. AI can run SEO optimization, suggest internal links, and generate metadata efficiently. This is a genuinely good use of AI in the content workflow.
Where human expertise is irreplaceable
The sections of a content piece that are most valuable for SEO and for reader trust are also the sections AI is worst at producing: original research references, counterintuitive takes on established wisdom, specific examples from customer conversations, and the kind of confident assertion that comes from actually knowing a space well. If your content strategy is built entirely on AI generation without that layer, you're competing on volume against every other team doing the same thing.
Also read: Will AI replace digital marketers?
How to use AI in paid advertising?
Paid advertising is one of the areas where AI has had the most measurable impact, largely because the feedback loops are faster and the outcome metrics are clearer than in content or brand marketing.
Where AI is already working
Most major ad platforms have built AI into their optimization layers. Smart Bidding on Google, Advantage+ on Meta, and LinkedIn's predictive audiences are all AI-driven, and for many teams, they outperform manual bidding once they have enough conversion data to learn from. This isn't "using AI for marketing," this is just using the ad platforms in 2026.
Beyond platform-native AI, the areas where AI adds value in paid advertising are audience creation, creative testing, and budget allocation.
- Audience creation. Lookalike modeling, intent-based segmentation, and predictive audience scoring all improve when AI has access to rich first-party data. The quality of the input data determines the quality of the audience.
- Creative testing. AI can generate headline and copy variations at scale, making systematic creative testing faster. The constraint is that the winning creative still tends to come from a genuine insight about the audience, not from random variation.
- Budget optimization. AI-assisted budget allocation, when connected to pipeline and revenue data rather than just platform metrics, can dramatically change how budgets get distributed. CPL optimization looks very different from pipeline-per-dollar optimization.
The metric problem
Most AI ad optimization is optimizing for platform metrics: clicks, conversions, cost-per-lead. These are not pipeline metrics. A CFO who cares about revenue attributed to paid channels is asking a fundamentally different question than a platform algorithm optimizing for cost-per-click. The value of AI in paid advertising compounds when it's connected to downstream revenue data, not just ad platform data.
How to use AI for ABM and pipeline generation
This is the chapter that most "AI for marketing" guides don't go deep enough on, and it's the one that matters most if you're in B2B.
Account-based marketing is, at its core, a signal and prioritization problem. There are thousands of companies that theoretically fit your ICP. There are maybe a few hundred showing meaningful buying signals at any given moment. There are probably thirty or forty where your timing, solution fit, and relationship position create a genuine near-term opportunity. AI's job in ABM is to collapse that funnel with signal rather than spray-and-pray.
- Identifying accounts that are actually in-market
Traditional ABM target lists are built from static firmographic criteria: industry, headcount, revenue, tech stack. These tell you which accounts could be buyers. They tell you nothing about which accounts are currently looking.
Intent data, web visit patterns, content engagement signals, and technographic change signals (new hires, tech additions, funding rounds) are all behavioral signals that indicate buying activity. AI can aggregate and score these signals across thousands of accounts continuously, surfacing the ones that are warming up before a sales team would ever notice organically.
- Prioritizing accounts using behavioral and firmographic scoring
The combination of firmographic fit (does this account match your ICP?) and behavioral signals (is this account showing buying behavior right now?) is what good AI-powered account scoring looks like. Either dimension alone produces noisy results. Together, they produce a shortlist of accounts that your sales team can engage with a realistic expectation of relevance.
- Personalizing at the account level
Once you've identified which accounts to prioritize, AI can help personalize outreach at a scale that would be impossible manually. Industry-specific pain points, relevant product use cases, references to the prospect's specific business context, these can all be dynamically assembled at the account level. The output still needs human review before it goes out, but the legwork of assembly can be significantly automated.
- Expanding beyond the single contact
One of the consistent patterns in B2B deal loss is single-threading: marketing and sales are engaged with one person in an account while the actual buying committee has five to eight people involved in the decision. AI can analyze engagement signals to surface other stakeholders showing interest, identify typical buying committee structures for your segment, and suggest outreach strategies for each persona.
Factors.ai is built specifically for this layer: account-level intent aggregation, buying signal scoring, and pipeline intelligence that connects marketing activity to the accounts that actually matter.
Also read: Account-based marketing metrics that actually matter
How to use AI in sales and marketing alignment?
The biggest operational AI opportunity in B2B isn't better emails. It's getting marketing and sales to finally work from the same data about which accounts matter and why.
The classic version of misalignment: marketing is reporting on MQLs, sales is complaining about lead quality, and nobody has a shared view of which accounts are actually progressing toward revenue. Both teams are technically doing their jobs. The problem is that the jobs aren't connected to the same goal.
AI can create a shared operational layer between marketing and sales by synthesizing engagement signals, scoring accounts, and surfacing next-best-action recommendations that both teams can work from.
- Lead qualification. AI can score leads against ICP criteria and behavioral signals in real time, creating a qualification layer that's consistent across both teams rather than dependent on individual judgment.
- Buying signal detection. When AI is aggregating signals across a prospect's web behavior, content engagement, intent data, and CRM history, it can surface buying signals that neither marketing nor sales would catch individually.
- Account summaries. AI can generate real-time account summaries for sales reps before calls: recent content engagement, website visit patterns, intent topics, and open opportunities. This closes the information gap between what marketing knows and what sales has access to.
- Opportunity intelligence. AI can flag accounts that are showing signs of going cold, identify timing patterns that predict deal progression, and surface competitive signals that should change the sales approach.
The north star here is a shared revenue intelligence layer that both teams trust enough to act on. That's both a technology question and a change management question.
How to use AI for attribution and measurement
Attribution is where the AI conversation in marketing gets interesting, and where most of the existing guides stop too early.
The standard treatment of AI in marketing analytics focuses on automated reporting and anomaly detection. These are useful. They're not the leverage point.
The real leverage is in connecting marketing activity to pipeline and revenue outcomes, at a signal resolution that manual analysis can't achieve. This is where AI fundamentally changes what you're able to know about your marketing.
The attribution models that matter in B2B
AI-driven attribution doesn't just automate the calculation of these models. It can identify which combination of touchpoints statistically predicts pipeline conversion, flag channels that look efficient on CPL but underperform on pipeline influence, and surface the content assets that appear most frequently in the journeys of accounts that close.
That last one is genuinely underused: most content teams have no idea which pieces of content show up in the paths of their best deals versus their worst fits.
Forecasting with AI
Once you have clean attribution data connected to pipeline and revenue data, AI can start doing meaningful forecasting: which accounts are likely to progress in the next 30 days, which channels are likely to hit or miss their pipeline targets, where budget reallocation would have the most impact. This is the layer that turns marketing from a cost center into a revenue function in the eyes of the business.
How to choose AI marketing tools?
The AI marketing tool landscape in 2026 is... a lot. There are AI writing tools, AI SEO tools, AI ad platforms, AI CRM enrichment tools, AI SDR tools, AI attribution tools, and an entire category of platforms that have added "AI" to their positioning because the market rewards it. Evaluating these thoughtfully requires a framework that isn't "what demo looked most impressive."
Questions to ask vendors before you buy
- What does your data model look like, and what integrations are required to get value?
- How does the system handle ambiguous or conflicting signals?
- What does the review and governance layer look like?
- Can you show me a customer in my segment who is six months into using this, and what does their ROI story look like?
- What happens to my data if I cancel?
The best AI tool isn't the one with the most impressive AI. It's the one your team is actually using six months after implementation, and can connect to a number on a revenue dashboard.
How to integrate AI into marketing workflows
Integration is where AI projects go to die. The demo worked. The tool is purchased. The workflows never actually change because the new tool doesn't fit how work gets done.
The integration patterns that work are the ones that slot AI into existing workflows with minimal friction, rather than asking teams to adopt entirely new workflows to get the AI value.
Content workflow with AI
- Research. AI pulls together SERP analysis, competitive content inventory, and existing internal assets. Output: a research brief that a writer can actually use.
- Brief. AI generates a structured outline based on the research brief. Human editor shapes the angle, adds the POV, and confirms the key argument.
- Draft. AI writes sections where templated structure is sufficient (definitions, comparison tables, metadata). Human writes or substantially edits sections requiring expertise or original argument.
- SME review. Subject matter expert validates claims and adds specificity. This step is non-negotiable.
- SEO and AEO optimization. AI runs optimization checks. Human confirms recommendations fit the overall piece.
- Publish and distribute. AI handles metadata, social variants, and distribution formatting.
ABM workflow with AI
- Intent monitoring. AI continuously scores accounts against ICP fit and behavioral signals.
- Prioritization. Weekly or real-time surfacing of accounts that have crossed engagement thresholds.
- Personalization. AI assembles account-specific outreach context. Human reviews and edits before send.
- Measurement. AI tracks account progression through the funnel and flags accounts going cold.
Ad workflow with AI
- Audience building. AI segments audiences based on intent signals and behavioral patterns.
- Creative testing. AI generates headline and copy variations. Human selects and refines based on brand judgment.
- Campaign launch. Platform AI handles bid optimization.
- Insight generation. AI surfaces which creative patterns and audience segments are driving pipeline, not just clicks.
How to operationalize AI inside a marketing team
This is where most playbooks end with a vague gesture toward "change management." Let me be more specific.
The companies winning with AI aren't necessarily using better models. They're building better operating systems around the models they have.
- Ownership and governance
The first question in any AI operationalization is: who owns this? Not tool-by-tool ownership, but a genuine accountability structure for how AI is used, reviewed, and improved across the team.
Without ownership, you get tool sprawl, inconsistent output quality, and zero institutional learning. Someone needs to own the prompt library, maintain the integration documentation, run the periodic audits of AI output quality, and be accountable for the team's AI literacy over time.
- Building a prompt library
One of the highest-leverage investments a marketing team can make is building and maintaining a prompt library: a shared, documented set of prompts for common use cases (content briefs, competitor analysis, account summaries, ad copy variations) that have been tested and refined over time.
The alternative is every team member reinventing the wheel every time they use an AI tool, which both wastes time and produces inconsistent output. A good prompt library is a genuine competitive asset.
- Training for AI literacy, not just AI tools
AI literacy in a marketing team isn't about knowing how to use specific tools. It's about understanding what AI is reliably good at, where it requires heavy human oversight, and how to evaluate the quality of AI output without blindly accepting it. These are judgment skills, not tool skills, and they develop through deliberate practice and shared norms, not just access to the tools.
- Measuring what matters
The right success metrics for AI adoption in marketing are not "how many AI tools are we using" or "how much content are we producing." They are: has AI reduced the time from insight to action? Has AI improved the quality of our account prioritization? Has AI helped us attribute marketing activity to pipeline more accurately? The measurement frame has to be tied to the business outcomes the team is accountable for.
Common AI marketing mistakes to avoid
The future of AI marketing: agents, not assistants
The current dominant use of AI in marketing is query-response: you ask, it answers. This is already genuinely useful. But it's the first phase, not the end state.
The shift that's happening now, and will accelerate significantly over the next two years, is from AI assistants to AI agents. An assistant responds to requests. An agent executes workflows autonomously, checks for exceptions, makes decisions within defined parameters, and surfaces outputs for human review rather than waiting to be asked.
In practice, this means marketing workflows that look like: a target account shows intent signals, AI automatically assembles the account brief, routes it to the right sales rep, queues personalized outreach, and flags it for pipeline tracking, without a human initiating each step. The human's job becomes defining the rules, reviewing the exceptions, and making the judgment calls that fall outside the model's parameters.
This is not a threat to marketing jobs. It's a redistribution of where human attention goes. The marketers who will thrive in this environment are the ones who understand how to design these systems, define the right guardrails, and recognize when AI is making a decision that needs human judgment. The ones who will struggle are the ones who are currently doing tasks that agents can do and haven't developed the judgment layer above those tasks.
The next generation of B2B marketers won't win because they use AI. They'll win because they've figured out exactly where humans need to stay in the loop and where the machine should just run.
How does Factors.ai fit into this?
Everything in this playbook converges on one core problem: B2B marketing has always struggled to connect activity to revenue. You know your MQL volume. You might know your pipeline influence. You rarely have clean, trustworthy data on which marketing activities drove which deals.
Factors.ai is built specifically for this problem. It aggregates account-level intent signals, tracks buying behavior across your website and campaigns, connects marketing touchpoints to pipeline and revenue, and gives both marketing and sales a shared view of which accounts are in-market and why.
If you're serious about moving AI from content generation to revenue intelligence, the place to start is getting your attribution and account intelligence layer right. That's the foundation everything else in this playbook is built on.
FAQs for how to use AI for marketing
Q1. How do beginners start using AI for marketing?
Start with a specific, bounded problem rather than trying to "use AI for marketing" in the abstract. Pick one workflow that's time-consuming and templated, like writing ad copy variations or generating content briefs, and build a repeatable AI-assisted process for that workflow. Once you have one working pattern, expand from there. The teams that struggle are the ones that try to transform everything at once.
Q2. How can small businesses use AI for marketing?
Small businesses often get more from AI than enterprise teams do, because the ROI of saving five hours a week on content and research is proportionally more significant. The highest-value AI uses for small B2B businesses are content production, ad creative testing, and basic competitive research. The more complex intelligence and attribution use cases require data volume that most small businesses don't have yet, so don't over-invest in that layer early.
Q3. What is the best way to use AI in B2B marketing?
The best use of AI in B2B marketing is at the account intelligence and attribution layer: identifying which accounts are showing buying signals, scoring them against ICP, and connecting marketing activity to pipeline and revenue. This requires clean data and integrated systems, which is why most teams default to content generation instead. But the revenue impact of getting account intelligence right dwarfs the impact of producing content faster.
Q4. How do you integrate AI into marketing workflows?
The integration patterns that work are the ones that fit AI into existing workflows rather than creating new workflows around AI. Map your current content, ABM, and campaign workflows, identify the steps that are templated and time-consuming, and add AI assistance at those specific steps. The goal is to reduce friction for the people who are already doing the work, not to redesign how work gets done from scratch.
Q5. What are the best AI marketing tools?
The right tools depend entirely on the problem you're solving. For content, tools like ChatGPT, Claude, and Jasper handle different parts of the workflow well. For ABM and account intelligence, Factors.ai, 6sense, and Bombora serve different segments. For attribution, Factors.ai, Bizible, and Triple Whale are common choices depending on your stack. Evaluate tools against your specific use case and data environment, not against a generic "best AI tools" list.
Q6. How can AI improve marketing ROI?
AI improves marketing ROI most reliably when it's connected to revenue outcomes, not just efficiency metrics. Producing content faster doesn't improve ROI if the content isn't driving pipeline. AI improves ROI when it surfaces accounts that are actually in-market (reducing wasted SDR time), identifies which channels are driving revenue not just leads (improving budget allocation), and accelerates the time from insight to action across the marketing function.
Q7. How do you use AI for content marketing?
The effective AI content workflow is: AI handles research synthesis, initial outlining, templated draft sections, and SEO optimization. Humans handle the strategic angle, original arguments, subject matter expertise, and final voice pass. If your AI-generated draft and your published piece look identical, you've skipped the steps that make the content worth reading.
Q8. How do you use AI for account-based marketing?
AI in ABM primarily serves three functions: identifying accounts showing buying behavior through intent data and engagement signals, scoring those accounts against ICP fit to surface the highest-priority targets, and personalizing outreach at the account level at a scale that isn't manually feasible. The integration requirement is that AI needs access to your first-party data, intent data, and CRM to do this well. Platforms like Factors.ai are built specifically for this use case.
Q9. How do you measure AI marketing success?
Measure AI marketing success against the business outcomes the team is accountable for, not against AI adoption metrics. Is account prioritization improving, meaning are SDRs spending time on accounts that actually convert? Is attribution getting cleaner, meaning can you connect marketing spend to pipeline with more confidence? Is the time from insight to campaign action decreasing? These are the metrics that translate AI investment into business impact.

AI marketing vs traditional marketing: What actually drives growth?
Compare AI marketing vs traditional marketing across ROI, personalization, attribution, and B2B growth. A practical guide for modern marketers.
TL;DR
- The AI vs traditional marketing debate is mostly a distraction. The real question is whether your team is making better decisions with the data and tools you already have.
- Traditional marketing still wins on brand building, emotional storytelling, and trust. AI marketing wins on speed, personalization at scale, and predictive intelligence.
- AI marketing and marketing automation are not the same thing. Conflating them leads to bad vendor choices and worse expectations.
- Most AI marketing implementations fail because they're layered on top of broken data foundations, fragmented attribution, and unclear strategy.
- The highest-performing B2B teams aren't choosing between AI and traditional. They're using AI as the operating system and human judgment as the decision layer.
- Machine learning marketing use cases that actually move pipeline include predictive lead scoring, intent-based targeting, and account prioritization, not just content generation.
- The future problem in marketing won't be lack of AI tools. It'll be lack of governance, clean data, and people who know how to use both.
Every few weeks, someone declares the death of traditional marketing… usually on LinkedIn… in a post written using traditional marketing, by a ‘thought-leader’.
The argument is always roughly the same. AI changes everything. Old playbooks are dead. The future belongs to marketers who automate, orchestrate, optimize, and whatever other verb is currently raising venture capital. Blah. blah. blah.
A few days later, someone else posts that AI is overhyped, brand is everything, fundamentals still matter, and marketing was better when people weren't prompting machines to write emails.
Both sides get plenty of engagement… neither side is particularly useful.
Because "AI vs Traditional Marketing" isn't really a debate. It's mostly a category error.
It's a bit like arguing whether calculators are better than mathematics or whether GPS is better than knowing how to drive. One is a tool. The other is the thing you're trying to get better at.
The companies seeing the best results from AI aren't replacing marketing fundamentals. They're applying them more effectively. They still need positioning. They still need messaging. They still need customer understanding. They still need someone capable of recognizing a bad idea before it gets automated at scale.
The companies struggling with AI usually have the opposite problem. They bought the tools before they understood the strategy. Which is a surprisingly expensive way to discover that automation doesn't fix confusion.
So instead of asking whether AI marketing is better than traditional marketing, the more useful question is this:
What parts of marketing benefit from AI, what parts still depend on human judgment, and where do the two work best together? That's what we'll unpack in this guide.
What do marketers get wrong about the AI vs traditional marketing debate?
The biggest mistake is assuming there are only two sides.
Most teams I've seen approach this as a resource allocation debate. Do we invest in AI tools or stick with what we know? But that framing treats marketing as a collection of tools rather than a system of decisions. And decisions, unlike tools, aren't either/or.
Here's what the debate usually misses: buyers don't experience your marketing strategy. They experience your content, your ads, your emails, your sales conversations. Whether those were produced by a human writer or a large language model, whether that targeting was AI-driven or manually segmented, is completely invisible to them. What they feel is relevance, timing, and quality. Everything else is internal.
The second thing it misses is that AI doesn't create demand. It improves decision-making inside existing demand generation systems. If your messaging is off, AI will scale bad messaging faster. If your ICP is wrong, AI will target the wrong accounts more efficiently. The technology amplifies what's already there, and that cuts in both directions.
The real divide in modern marketing is intelligence versus guesswork. Teams that run on gut feel and quarterly reporting cycles versus teams that have feedback loops, clean data, and the infrastructure to act on signals. AI is one of several tools that can move you toward the intelligence side of that spectrum. But it's not the only one, and it's not sufficient on its own.
AI marketing vs traditional marketing: a side-by-side comparison
Before getting into the nuances, here's how the two approaches actually stack up across the dimensions that matter most in B2B.
| Category | Traditional marketing | AI marketing |
|---|---|---|
| Targeting | Broad demographic and firmographic segments | Individual-level behavioral and intent signals |
| Personalization | Static content variants by segment | Dynamic experiences at scale |
| Optimization | Manual, campaign-by-campaign | Continuous, real-time |
| Reporting | Descriptive, historical | Predictive and prescriptive |
| Attribution | Often last-touch or incomplete | Multi-touch and revenue-correlated |
| Testing | Slow A/B cycles | Continuous multivariate |
| Scale | Human-limited | Machine-assisted |
| Cost efficiency | Variable, often front-loaded | Improves over time as models learn |
| Speed | Days to weeks | Minutes to hours |
| Brand building | Strong | Weaker without human direction |
The pattern here is worth naming directly. Traditional marketing optimizes for campaigns. AI marketing optimizes for outcomes. Those aren't the same thing, and that gap is where a lot of marketing waste lives.
How does traditional marketing actually work?
Let's be honest about something: "traditional marketing" has been used as a pejorative for so long that we've stopped acknowledging what it actually does well.
In B2B, traditional marketing rarely means TV ads and billboards. It means campaign planning on a quarterly cadence, static audience segments built from CRM data and industry research, manual optimization based on performance reviews, and human-led decisions about positioning, messaging, and budget. Most enterprise marketing teams still operate this way, and the reason isn't stubbornness. It's that traditional frameworks were built for a world with less data, longer sales cycles, fewer channels, and simpler attribution paths. Within those constraints, they worked.
The problems emerged when the world changed. Channels multiplied. Buyer journeys got longer and more fragmented. Data volumes increased faster than human capacity to process them. The systems that made sense in 2010 started showing their limits, and the response from most teams was to hire more people and buy more point solutions. Which worked, until it didn't.
Traditional marketing also deserves credit for something AI genuinely struggles with: building brand. The campaigns that people remember, the ones that shift category perception, create cultural moments, or define what a company actually stands for, those come from human craft, editorial judgment, and risk-taking. You can't A/B test your way to an iconic brand. Some things require a point of view.
How does AI marketing actually work?
When people say "AI marketing," they usually mean several different things at once, which is part of why the conversation gets muddy.
There's a useful taxonomy here. AI technologies use data analysis, machine learning, and automation to predict consumer behavior, often by interpreting customer data to guide audience decisions. In marketing, that shows up as lead scoring models that predict conversion probability, algorithms that determine which ad creative to serve to which audience segment, systems that identify which accounts are showing buying intent based on behavioral signals, and forecasting models that estimate revenue from current pipeline. These are all different applications of the same underlying concept: using data patterns to improve decisions.
Generative AI is the newer layer, covering tools like large language models that can produce content, summarize data, draft variations, and increasingly take autonomous actions. It's what most people think of when they hear "AI marketing" right now, partly because it's the most visible. But it's worth noting that the most impactful AI applications in B2B marketing aren't primarily about content generation. They're about signal detection, prioritization, and prediction.
Agentic AI systems, which can plan and execute sequences of tasks with limited human input, are early-stage in most marketing contexts but moving fast. The practical frontier for most B2B teams right now is using AI to do three things: identify high-probability accounts earlier in the buying cycle, personalize outreach and content at a scale that humans can't match manually, and surface insights from revenue data that would take days of analyst work to produce manually.
The biggest advantages of AI marketing
- Personalization at scale
Traditional marketing can reasonably support a few dozen audience segments. AI marketing can support individual-level experiences. The difference isn't cosmetic. At scale, generic messaging produces generic results. The reason Amazon recommendations feel weirdly good at predicting what you want, or why Spotify Wrapped is genuinely compelling every year, is that personalization at the individual level creates a fundamentally different experience than personalization at the segment level. In practice, personalized marketing paired with data-driven campaigns can lift engagement rates by 10-15% versus traditional methods. B2B is catching up, and the teams doing it well are already seeing better engagement, shorter sales cycles, and higher pipeline quality.
- Faster optimization loops
Traditional campaign optimization runs on a quarterly or monthly cadence, which means you're often three budget cycles behind by the time a poor performer gets cut. AI-powered systems can optimize daily or even hourly, reallocating budget toward what's working before the waste compounds. This isn't just a speed advantage. It's a compounding advantage. AI-driven marketing can also cut overhead by 12.2% and increase sales productivity by 14.5% by automating repetitive tasks. Small, frequent improvements add up faster than large, infrequent ones.
- Predictive intelligence over historical reporting
The shift from "what happened last quarter" to "what is likely to happen next quarter" is one of the more underappreciated changes AI enables. Predictive lead scoring, churn forecasting, and pipeline prediction models don't eliminate uncertainty, but they shift teams from reactive to anticipatory. That changes how you allocate resources, how you brief sales, and how you think about capacity planning. Anyone who's sat in a Q4 pipeline review with a spreadsheet and vibes knows how much this matters.
- Smarter attribution across long buying cycles
B2B attribution has always been hard because buying decisions involve multiple people, multiple touchpoints, and a lot of activity that never shows up in any tracking system. AI-powered multi-touch attribution doesn't solve the dark funnel entirely, but it gets closer to the truth than last-touch models do. More accurate measurement improves marketing ROI, and targeted, measurable programs have been shown to drive revenue gains as high as 760% compared with harder-to-track traditional approaches. When attribution is more accurate, budget decisions get better. And better budget decisions are one of the highest-leverage things a marketing leader can do.
Where does traditional marketing still win?
Here's where most AI articles get lazy, so I want to be direct about this.
AI is not winning everything. And the areas where it isn't winning matter a lot, especially for B2B companies where trust, category definition, and relationships are core to the sales motion.
- Brand building
The kind of brand that creates genuine preference, not just recognition, requires emotional resonance, a coherent point of view, and a willingness to take creative risks. AI can assist with execution, but the thinking that makes a brand matter has to come from humans. The companies with the strongest brands in B2B, think Salesforce in its early days, Hubspot's inbound era, Drift when it was actually provocative, were making bold choices about what to say and who to be. That's judgment work, and traditional strategies often build long-term loyalty, especially where community familiarity and older audiences matter.
- Emotional storytelling
There's a growing body of evidence, and honestly just common sense, suggesting that "AI slop" content is eroding trust at scale. When everything sounds like it was written by the same invisible hand, readers feel it. The content that earns attention, the founder essays, the honest post-mortems, the opinionated takes that make someone screenshot and share, still relies on traditional marketing tactics that create emotional connections through human-crafted narratives.
- Category creation
If you're trying to define a new market, educate buyers on a problem they don't know they have, or shift how an industry thinks about something, AI can't do that for you. Category creation is fundamentally a narrative and positioning challenge. It requires conviction, repetition, and credibility. That's human work.
- Trust and relationship-driven sales
Enterprise deals don't close because of a well-timed AI-personalized email sequence. They close because someone trusted someone. The handshake at the end of a deal often traces back to a conversation at a conference, a referral from a mutual connection, or a follow-up that felt genuinely thoughtful. AI can support the top of that funnel, but it can't manufacture the trust that closes it. Unlike traditional methods, conventional marketing campaigns are also harder to change once published, and traditional marketing lacks precise metrics to measure ROI accurately.
AI vs traditional marketing across the B2B funnel
The smarter way to think about this is by funnel stage. Different stages have different requirements, and the balance shifts as you move toward revenue.
| Funnel stage | Where traditional wins | Where AI wins |
|---|---|---|
| Awareness | Brand storytelling, thought leadership, category narrative | Audience discovery, look-alike modeling, media optimization |
| Consideration | Content depth, webinars, analyst relationships | Personalization, intent-based targeting, content recommendations |
| Decision | Sales conversations, executive relationships, proposals | Intent signal analysis, deal scoring, engagement tracking |
| Expansion | Customer relationships, QBRs, champion development | Churn prediction, usage pattern analysis, upsell scoring |
The pattern worth noting: the further you move down the funnel toward actual revenue, the more valuable AI signals become. At awareness, human creativity dominates. At expansion, AI prediction becomes genuinely critical. The middle stages are where the two work best together.
AI vs marketing automation: they're not the same thing
This is probably the most important clarification in this entire article, and it's the one most vendor pitches deliberately blur.
Marketing automation is rule-based. It executes workflows according to conditions you define in advance. If someone fills out a form, send this email. If a contact reaches a score of 50, notify sales. If an account visits the pricing page twice, trigger this sequence. Automation is incredibly useful for operationalizing repeatable processes, but it doesn't learn, predict, or improve on its own. You're still the brain. The system is the hands.
AI marketing learns from data and makes probabilistic decisions. It can identify which accounts are likely to convert before they fill out any form. It can predict which email subject line will get the best response for a specific contact based on their behavior history, not just a rule you set. It can surface which opportunities are at risk of going cold based on engagement patterns, without you defining what "cold" looks like.
| Capability | Marketing automation | AI marketing |
|---|---|---|
| Execution of predefined workflows | Yes | Yes |
| Learning from outcomes | No | Yes |
| Predicting future behavior | No | Yes |
| Improving without human reconfiguration | No | Yes |
| Handling novel situations | No (falls through) | Partially |
| Transparency of logic | High | Variable |
The confusion between these two categories leads to a specific failure mode: teams that buy automation platforms expecting AI-level intelligence, get frustrated when it doesn't learn, and conclude that "AI doesn't work." What they experienced wasn't AI. It was conditional logic dressed up in modern software design.
Machine learning marketing use cases that are delivering results today
Let me skip the theoretical here and talk about what's actually working in B2B teams right now.
- Predictive lead scoring. Models trained on historical win/loss data can rank inbound leads by conversion probability far more accurately than manually-defined scoring rules. The impact is practical: sales spends more time on leads that are likely to close and less on ones that aren't. When it's working well, this looks less like a technology project and more like a quiet improvement in sales efficiency.
- Intent-based targeting. Third-party intent data, combined with first-party behavioral signals, can surface accounts that are actively researching your category before they've raised a hand. Getting in front of a buying committee when they're in research mode versus after they've built a shortlist is a completely different conversation.
- Dynamic audience building. AI can continuously update audience segments based on behavioral data rather than static filters. An account that was "not ready" six weeks ago might look very different based on recent activity, and static segments don't catch that.
- Ad spend optimization. Algorithmic bidding and creative optimization have been available in paid channels for years, but the maturity of these models has improved substantially. Teams that lean into the algorithm rather than fighting it with manual overrides generally see better CPL outcomes.
- Conversion forecasting. Pipeline prediction models that account for deal age, engagement patterns, stakeholder coverage, and historical win rates give revenue leaders something better than a spreadsheet of guesses. The forecast doesn't become perfect, but it becomes less wrong.
- Account prioritization with Factors.ai. This is where it connects directly to what we build. Factors identifies which companies are on your site, tracks behavioral and intent signals across accounts, scores them against your ICP, and surfaces the accounts most likely to convert, before they become leads. That's the power of machine learning applied to the top of the B2B funnel: finding the signal in the noise before your competitors do.
The hidden problems nobody talks about in AI marketing
The enthusiasm around AI in marketing has produced a lot of content about what it can do and very little about what it gets wrong. So let me spend some time here.
- Bad data produces bad AI. This is the one that trips up the most teams. AI models are only as good as the data they're trained on, and most B2B marketing stacks have data quality problems that predate any AI implementation. Duplicate records, inconsistent tracking, missing attribution, contacts with no engagement history. All of that flows directly into your AI models and degrades their outputs. You can't fix data problems by adding AI on top of them.
- Hallucination risk in customer-facing content. Generative AI confidently produces incorrect information. That's a known behavior, not a bug being fixed next quarter. For internal drafts and ideation, this is manageable. For customer-facing content, legal documents, or anything involving specific product claims, it requires a human review layer that teams often underestimate in their implementation plans.
- Black box decision-making. When an AI system tells you to prioritize Account X, you should be able to understand why. Many AI tools in market today can't explain their reasoning in terms a marketer can act on. That makes them hard to audit, hard to trust, and hard to improve when they're wrong.
- Privacy and compliance complexity. AI systems that learn from behavioral data are operating in an increasingly complicated regulatory environment. GDPR, CCPA, and sector-specific regulations create real constraints on what data can be used, how it can be stored, and what decisions it can power. Most marketing teams aren't equipped to assess this risk independently, and most AI vendors aren't forthcoming about it.
- Tool sprawl and integration debt. The average B2B marketing stack has grown substantially in the last five years, and AI tools are being layered on top of stacks that were already struggling with integration. Every new tool is a new data silo, a new login, a new workflow, and a new source of inconsistency. The governance problem isn't coming. For most teams, it's already here.
The future problem in marketing won't be a lack of AI tools. There are already more of them than anyone can evaluate properly. The problem will be governance, data literacy, and the organizational will to slow down long enough to build the foundations that actually make AI work.
AI vs marketing agencies: replacement or evolution?
Let's address this directly because it's becoming a real conversation in agency-client relationships.
AI won't replace good agencies. But it will replace agencies that are essentially selling manual execution disguised as strategy. There's a difference, and it matters.
What agencies do well that AI can't replicate: strategic positioning, brand narrative, category thinking, creative risk-taking, stakeholder management, and the kind of contextual judgment that comes from working across dozens of companies and seeing patterns. Those capabilities have genuine value and they're deeply human.
What AI does better than traditional agency delivery models: analysis at scale, content variation, performance optimization, competitive monitoring, and the mechanical execution work that historically consumed a lot of agency hours and client budget. When an AI can do a competitive analysis in twenty minutes that used to take a junior strategist two days, that's not a threat to good agencies. It's a release valve that should free up strategists to do the work they're actually good at.
The agencies that are thriving right now are the ones who've absorbed AI into their workflows and compete on judgment, not volume. The ones struggling are the ones whose value proposition was essentially "we have people who can do the work." That's a shrinking moat.
For B2B companies evaluating agencies versus AI tools: it's usually not either/or. You probably need strategic partners for positioning and brand, AI tools for signal detection and execution, and an internal team that can connect the two. The mistake is expecting AI to replace the strategic thinking or expecting an agency to provide the data infrastructure.
The future isn't AI or traditional marketing… it's both.
The synthesis isn't complicated, but it requires honesty about what each approach is actually good at.
| Function | Human-led | AI-assisted |
|---|---|---|
| Strategy and positioning | Primary | Supporting input |
| Brand and creative | Primary | Execution support |
| Audience insights | Collaborative | Primary |
| Campaign optimization | Oversight | Primary |
| Content production | Editorial direction | Heavy execution support |
| Measurement and attribution | Interpretation | Primary |
| Sales enablement | Primary | Signal surfacing |
The highest-performing marketing teams in B2B aren't AI-first. They're judgment-first. They know which decisions require human context and which ones are better made by a model that's seen a thousand data points. That distinction, knowing what to delegate to a machine and what to own yourself, is the actual skill that matters right now.
AI becomes the operating system. Humans remain the decision-makers. That's the model, and it's a better frame than any versus debate.
How modern B2B teams are building AI-powered marketing systems
This is the part where we get practical, because frameworks are only useful if they're actionable.
1. Fix data foundations first
You can't skip this step. Clean CRM data, consistent UTM tagging, unified tracking across channels, accurate contact and account records. Every AI system you build on top of broken data will produce outputs you can't trust. This isn't glamorous work, but it's the highest-leverage thing most teams can do before touching any AI tooling.
2. Unify your revenue data
The gap between marketing data and revenue data is where a lot of companies lose the thread. Connecting campaign activity to pipeline to closed revenue requires integrations that most teams haven't fully built. This is what makes attribution credible and what allows AI models to train on outcomes that actually matter.
3. Add AI-powered insights, not just AI-powered content
The most common mistake in AI marketing adoption is treating generative AI as the primary use case, when AI marketing tools also support deeper customer analysis and more useful data-driven insights than content generation alone. Content generation is useful, but the insight layer is where the real leverage lives. These tools help interpret consumer behavior and improve campaign success through better signal detection. Tools that identify which accounts are showing purchase intent, which leads are most likely to convert, which campaigns are actually driving revenue, those have direct pipeline impact. Content generation has indirect impact at best.
4. Automate decisions, not just tasks
Once you have clean data and reliable insights, the next layer is using AI to automate repetitive tasks within campaign management: routing leads to the right sales rep based on fit and timing, triggering outreach sequences when an account hits a specific intent threshold, and reallocating budget across channels based on performance signals. For example, it can adjust audience timing and follow-ups in email campaigns as a repeatable workflow based on performance data. The goal is to get routine decisions out of human queues so that human attention goes to the decisions that actually require it.
5. Measure pipeline, not clicks
The final piece is measurement. If your marketing team is still optimizing for impressions, clicks, and MQLs without a clear line to pipeline and revenue, AI tools will optimize the wrong things faster. Set pipeline contribution as the north star metric and build backward from there. This is what forces the AI and traditional components to work together toward a shared outcome rather than optimizing separately for their own metrics.
Factors.ai is built around exactly this architecture: account identification, intent signals, ICP scoring, pipeline attribution, and predictive account prioritization. The teams using it well aren't using it to generate more activity. They're using it to make better decisions about which accounts to prioritize, where the pipeline is actually coming from, and what's likely to close.
The companies winning with AI right now aren't generating more content than everyone else. They're surfacing better signals, making faster decisions, and measuring what actually matters. That's the only version of AI marketing that compounds over time.
FAQs for AI marketing vs traditional marketing
Q1. What is the difference between AI marketing and traditional marketing?
Traditional marketing relies on human-defined segments, manual optimization, and historical reporting. AI marketing uses machine learning in digital marketing to act on customer data and real-time signals, personalize around consumer behavior, and optimize at the individual level, while traditional methods rely more on broad targeting and historical planning. The practical difference in B2B is in speed, scale, and precision. Traditional marketing plans quarterly. AI marketing learns daily.
Q2. Is AI marketing better than traditional marketing?
For specific functions, yes. Audience targeting, campaign optimization, predictive scoring, and attribution are all areas where AI demonstrably outperforms traditional approaches, while traditional marketing excels at trust-building through familiar channels and AI-driven systems improve measurable marketing effectiveness. For brand building, emotional storytelling, strategic positioning, and trust development, traditional and human-led approaches still lead. The most effective teams use AI to improve execution and decision-making while keeping humans in charge of strategy and creative direction.
Q3. Can AI replace traditional marketing teams?
No, and the teams that have tried to replace marketing judgment with AI tools have mostly ended up with more content and less strategy. What AI can replace is the manual, repetitive execution work that consumed a disproportionate share of marketing team hours. What it can't replace is the contextual judgment, creative risk-taking, and relationship-building that produce brand differentiation and pipeline quality.
Q4. What are the biggest machine learning marketing use cases in B2B?
The ones delivering measurable pipeline impact right now are predictive lead scoring, intent-based account targeting, dynamic audience building, ad spend optimization, pipeline forecasting, and account prioritization using behavioral and firmographic signals. Content generation gets the most press, but it's not where the ROI is clearest for B2B.
Q5. How is AI used in B2B marketing specifically?
In B2B, AI is primarily useful for identifying which accounts are in-market before they raise a hand, scoring and prioritizing inbound leads, personalizing outreach based on behavioral data, attributing pipeline to the right marketing activities, and forecasting revenue from current deals. It's less about content automation and more about signal intelligence and decision support across a long, complex buying cycle.
Q6. What's the difference between AI marketing and marketing automation?
Marketing automation executes workflows based on rules you define. If X happens, do Y. It doesn't learn, predict, or improve on its own. AI marketing builds models that find patterns in data, make probabilistic predictions, and improve over time without manual reconfiguration. You can have automation without AI and AI without automation, and knowing the difference prevents a lot of bad vendor decisions.
Q7. Can AI replace marketing agencies?
Good agencies with strong strategic capabilities are not at risk. Agencies whose primary value is executing deliverables at volume are under real pressure. AI handles production work faster and cheaper than a human team. What it can't do is develop a brand narrative, position a company in a crowded category, or build the kind of client relationships that produce long-term strategic partnerships.
Q8. What are the biggest risks of AI marketing?
The risks that matter most in B2B are data quality degradation flowing into AI models, hallucination in customer-facing content, compliance exposure from behavioral data use, lack of transparency in how AI systems make recommendations, and tool sprawl that creates more integration debt than business value. The governance gap is the risk most teams are underestimating right now.
Q9. How does machine learning improve campaign performance?
By replacing manual, periodic optimization with continuous learning from outcome data. A machine learning model running on ad performance can test more creative variants, optimize bidding more precisely, and reallocate budget faster than any human-managed campaign. Over time, models trained on your specific data outperform generic benchmarks because they've learned the patterns specific to your audience and offer.
Q10. Should enterprise B2B teams invest in AI marketing platforms?
Yes, but not before fixing data foundations and clarifying what outcomes they're trying to improve. AI marketing tools often have more predictable monthly costs, often around $100 to $5,000 per month, while traditional marketing methods can require very high upfront investment, including TV ad budgets that can range from about $200,000 to $7 million. AI platforms built on top of broken data produce bad outputs at scale. The right order is: clean data first, unified revenue attribution second, AI-powered insights third. Teams that skip the first two steps and start with the third spend a lot of money to get confident-sounding answers that they can't trust, and traditional marketing methods are also slower to adapt to changing market conditions.

10 best Fibbler alternatives for B2B attribution and ABM
Compare the top 10 Fibbler alternatives across features, pricing, compliance, and support to find the right fit for your GTM motion.
TL;DR
- Fibbler is a LinkedIn + Google Ads attribution tool, but it lacks SOC 2 / ISO 27001 certification (in progress as of June 2026), has no multi-source intent, and offers no native ad activation beyond LinkedIn.
- Factors.ai is the strongest full-funnel alternative, with account identification (75% coverage), person-level identification (up to 40%), multi-touch attribution, LinkedIn and Google AdPilot, and SOC 2 Type II certified.
- The right alternative depends on whether you need visibility (attribution only) or activation (intent + ads + CRM orchestration in one place).
Here is the breakdown of the top five players in the space.
| Tool | Best For | SOC 2 Certified? | Intent Scope | Ad Automation? |
|---|---|---|---|---|
| Factors.ai | Full-funnel ABM & native ad activation | Yes (Type II) | Multi-source (1st, 2nd, 3rd) | Yes (AdPilot) |
| HockeyStack | Deep buyer journey analytics | Not confirmed | Web & CRM | No |
| Dreamdata | Multi-channel revenue attribution | Yes | Cross-channel | No |
| 6sense | Predictive enterprise ABM | Yes | High (40k+ sites) | Yes |
| Demandbase | Global enterprise GTM alignment | Yes | High | Yes |
You connected LinkedIn Ads. You linked your CRM. Fibbler told you which companies clicked.
And then leadership asked: "But what happened next?"
And then, you start looking like this:

That's where most teams hit a wall. Fibbler is good at one thing… showing you which companies engaged with your LinkedIn (and Google) Ads and mapping that to pipeline. BUT the moment your GTM motion grows beyond LinkedIn-only attribution, you start running out of runway.
Fibbler tracks LinkedIn ad engagement at the account level and syncs it to your CRM, and its G2 rating also comes from a narrow user base of LinkedIn-focused marketers. When an account is clicking your LinkedIn ads while visiting your website, showing intent on G2, and has hired 5 SDRs in the last 30 days, Fibbler only sees the LinkedIn part.
This Fibbler alternatives piece covers 10 Fibbler alternatives worth evaluating in 2026, including when Fibbler is actually the right call (because I’m a very fair person) and when you need something with more depth (read: Factors.ai)
Why are teams looking for Fibbler alternatives?
The most telling complaint from G2 reviewers: they're "not totally sure how to act on the insights." Fibbler tells you which companies are engaging but doesn't give you contact data for the people at those companies.
And then there's the compliance question. From Fibbler's own security page:
“We are not yet SOC 2 or ISO 27001 certified. We started the certification process in January 2026 and expect to receive both certifications within a few months."
Fibbler's SOC 2 and ISO 27001 audits are in progress (started in January 2026, conducted by auditor Sensiba) and are expected to complete around the end of summer 2026.
For smaller teams, this might not matter. For mid-market and enterprise buyers, it often does. One internal conversation at a prospect company put it plainly: the company had evaluated Fibbler and dropped them specifically because of the missing SOC 2 certification and noted that "all mid- and large-sized companies pretty much have this as a filter."
The five most common reasons teams go looking for Fibbler alternatives:
- Limited signal coverage. Only LinkedIn Ads and Google Ads (the latter as a $59/month add-on). No website intent, no G2 signals, no CRM-based scoring.
- No native ad activation. Fibbler shows you who engaged. It doesn't auto-build LinkedIn audiences or sync Google conversions back to the platform.
- Compliance gaps for enterprise procurement. SOC 2 and ISO 27001 certifications not yet in place.
- 90-day lookback limit. The 90-day lookback window limits historical analysis for teams with longer sales cycles.
- No multi-touch attribution across channels. LinkedIn is one part of B2B buying. Fibbler only sees that part.
Now, the alternatives.
The 10 best Fibbler alternatives
1. Factors.ai: Best full-funnel alternative with SOC 2 certification and a well-rounded ABM platform
If Fibbler is the tool that shows you who clicked, Factors.ai is the system that shows you what they did before, during, and after, and then activates that account intelligence across your ads.
Factors.ai identifies more than 75% of companies visiting your website and tracks how those accounts move across pages, channels, and campaigns, giving marketing and sales teams a reliable account-level view of buyer activity even when visitors never fill out forms.
What sets Factors.ai apart from Fibbler?
SOC 2 Type II certified. ISO 27001 certified
This is NOT a minor footnote for teams that run enterprise or regulated-industry GTM motions. Factors.ai passes procurement filters that Fibbler currently cannot.
Account identification at scale
- Factors.ai uses waterfall enrichment across 4 data sources to identify accounts- not just which ones clicked your ads, but which ones visited your website, engaged on G2, showed third-party intent via Bombora, or interacted with your CRM campaigns.
Individual-Level Deanonymization:
Factors.ai now integrates RB2B to deanonymize US-based B2B website visitors at the individual level. For each identified visitor, you get details such as first and last name, job title, LinkedIn profile URL, work email, company name, industry, employee count, and revenue range.
Role-Specific Use Cases:
Also read: Factors.ai vs Fibbler: Which GTM Platform Aligns With Your Growth Motion?
- SDRs: Receive instant Slack notifications with LinkedIn URLs and work emails when decision-makers visit target pages.
- Marketing: Create and activate ICP-based audiences using firmographic data across ad platforms and outbound sequences.
- Customer Success: Monitor customer accounts to identify contacts visiting churn-related pages.
- RevOps: Analyze attribution reports using enriched, person-level data rather than anonymous account traffic.
Multi-source intent, not just ad engagement
This is where Fibbler is limited to LinkedIn and Google Ads signals; Factors.ai combines
- First-party intent - website behavior, CRM activity, product usage
- Second-party intent - LinkedIn Ads, paid search, G2 intent
- Third-party - Bombora company-level intent into a single account score.
This means you're prioritizing accounts based on actual buying signals, not just ad impressions.
LinkedIn AdPilot + Google AdPilot (native ad activation)
This is where Fibbler and Factors.ai diverge faaaar more than the feature comparison tables suggest.
- Automated Audience Management: Builds and refreshes LinkedIn audiences based on real-time ICP fit and funnel stage.
- Frequency Control: Manages ad impression frequency at the account level.
- Conversion Syncing: Sends enriched conversion events directly to LinkedIn via LinkedIn AdPilot and to Google via the Conversions API (CAPI).
- Revenue Attribution: Ties view-through attribution directly to revenue movement in your CRM.
Fibbler shows you what happened. Factors.ai acts on it.
Full-funnel analytics and attribution
Factors.ai provides full visibility into account acquisition and the customer journey:
- Multi-Touch Attribution: Tracks multiple touchpoints across web, ads, CRM, and product.
- Milestone Tracking: Maps the complete funnel from MQL to Closed Won.
- Custom Dashboards: Segment data by geography, persona, or specific campaign.
- Granular Segregation: Separates data at both the Contact and Account levels for clear, structured analysis.
What do Factors.ai customers say?
"Factors delivers us the best ROI in our tech stack. The wealth of data and granularity helps us do a lot when it comes to our marketing and demand initiatives."
- Verified G2 Review
With Factors' account identification, journey insights, and advanced filters, we can segment and target leads based on their behaviour and intent."
- Gayatri Ivaturi, Aviso.ai (G2 Review)
Factors.AI helps teams tackle the challenge of unknown website traffic by identifying which companies are visiting and surfacing their intent, giving clear visibility into high-potential accounts that might otherwise go unnoticed.
Pricing
Factors offers a free plan (200 companies/month, 3 seats), with paid tiers scaling from Basic (3,000 companies/month) through Growth (8,000 companies/month, dedicated CSM) to Enterprise (unlimited companies, LinkedIn and Google AdPilot, white-glove onboarding). Contact Factors for current pricing.
Best for
Enterprises and mid-market B2B SaaS teams that need account identification, multi-source intent, native ad activation, multi-touch attribution, enterprise-grade compliance in a single platform. Especially relevant if you're running LinkedIn and Google Ads, managing multiple buying signals, or scaling GTM into enterprise accounts.
2. HockeyStack: Best for deep LinkedIn attribution and buyer journey modeling
HockeyStack goes deeper on buyer journey modeling, AI-assisted analysis, and LinkedIn ad attribution.
HockeyStack pulls account-based ad impressions and engagement data, includes an AI assistant to help you understand your data, offers custom workflow automation for outbound sales, native lead scoring tools and buyer journey modeling based on intent signals, and a no-code report builder to visualize data.
G2 rating: 4.6/5.
Where it differs from Fibbler: HockeyStack gives you the full journey view, not just which companies engaged with ads. You can trace an account from first anonymous visit through ad impressions, SDR touchpoints, and deal progression. The AI assistant can answer natural-language queries about your pipeline data.
Where it differs from Factors: HockeyStack doesn't let you control LinkedIn ad campaigns directly or auto-build audiences. It's an analytics and attribution layer, not an activation engine.
Pricing: Not published publicly. G2 reports plans start at $2,200/month, including funnel reporting, website visitor identification, and buyer journey modeling. Significantly higher entry point than Fibbler.
Best for: B2B SaaS teams that want deep buyer journey analytics and are willing to pay a premium for that depth. Not ideal for small or scrappy teams, or anyone who needs quick LinkedIn attribution on a lean budget.
Also, read best hockeystack alternatives
3. Dreamdata: Best for multi-channel B2B revenue attribution
Dreamdata's core pitch is the complete revenue attribution timeline, every touchpoint from first interaction to closed deal, across all channels.
Also read: Factors.ai vs 6sense
Dreamdata is a B2B revenue attribution platform that maps the entire customer journey from first touch to closed-won, collecting data from your CRM, ad platforms, website, and sales tools, then stitching it into a unified timeline for every deal.
If Fibbler shows you a snapshot of who viewed your LinkedIn ad, Dreamdata shows you the entire movie. It's especially strong for teams with long, multi-stakeholder buying cycles who need to prove which channels are actually driving revenue, not just engagement.
Dreamdata integrates with CRMs like HubSpot, Pipedrive, Salesforce, and Microsoft Dynamics, provides customer journey timelines to view a lead's journey pre-purchase across multiple channels, and includes an AI engine to suggest sales trends based on attribution data. G2 rating: 4.7/5.
Pricing: Free plan available (company identification and engagement scoring). Premium features like AI signals and customer journey maps are paid.
Best for: Multi-channel B2B teams that need reliable long-cycle journey reconstruction and multi-touch attribution across every channel, not just LinkedIn.
4. 6sense: Best enterprise ABM with predictive intent
6sense is built for a different buyer than Fibbler's core audience. It's an enterprise ABM platform with AI-driven predictive scoring, third-party intent data, and a built-in advertising layer.
6sense offers third-party intent data from 40,000+ B2B websites combined with first-party signals (far broader than Fibbler's ad-engagement-only scope), predictive AI account scoring that identifies accounts in active buying cycles before they engage with ads, and a built-in advertising layer for display and LinkedIn retargeting from within the platform.
The tradeoff: 6sense is significantly more expensive than Fibbler and takes 6 to 12 weeks to implement. Teams looking for fast, affordable LinkedIn attribution will find it over-built and over-priced for that specific need. If you are currently using 6sense and are looking for alternatives, then you might be interested in reading the 6sense alternatives and competitors blog.
Pricing: Not publicly listed. Enterprise contracts.
Best for: Enterprise revenue teams (200+ employees) that want account-level buying signals across all channels, AI-predicted pipeline, and integrated ABM advertising in one platform.
5. Demandbase: Best for enterprise ABM with a global GTM team
Where 6sense competes on predictive AI, Demandbase competes on data depth and GTM alignment. It's a mature enterprise platform that unifies third-party intent and CRM data into account intelligence for large, multi-team GTM operations.
Demandbase combines third-party intent and CRM data into a high-fidelity intelligence layer at enterprise scale, with a proprietary B2B DSP that reaches buying committees across the entire open web and a "Decision Maker Journey" map to filter out false positives from simplistic ad-click scoring.
For mid-market teams that want some of this depth at a lower price point, Demandbase is often over-engineered. But for enterprise GTM teams where multiple departments need a shared source of account intelligence, it's one of the strongest options available.
Also, read Demandbase alternatives and competitors
Pricing: Not publicly listed.
Best for: Large enterprise GTM teams that need a unified intelligence layer across sales, marketing, and RevOps, with intent data depth that goes well beyond LinkedIn engagement.
6. ZenABM: Best for LinkedIn-specific ABM without Fibbler's complexity
ZenABM sits in a similar lane to Fibbler, LinkedIn-focused ABM with CRM integration, but with a stronger emphasis on audience management and campaign orchestration within LinkedIn's ecosystem.
It's worth noting that LinkedIn launched the Company Intelligence API in 2025, with a structurally different architecture that removes the ceiling on company-level reach. Partners with access see 287% more companies reached. How well ZenABM leverages this API versus older data-sampling approaches is worth verifying directly with their team.
Best for: Teams that want a LinkedIn-focused ABM with more audience-orchestration capabilities than Fibbler, but aren't ready to move to a full-stack ABM platform like Factors.ai.
7. Warmly: Best for real-time person-level visitor engagement
Warmly takes a different angle entirely. It's less about attribution and more about immediate engagement: identifying who's on your website right now at the person level and connecting your sales team to them in real time.
Warmly is an AI-powered revenue orchestration platform that identifies website visitors and takes action automatically. Its AI Chat can qualify visitors, answer questions, share resources, and book meetings without human involvement.
Where it differs from Fibbler: Warmly is outbound-first, sales-activation-first. It's not primarily an attribution tool; it's a real-time engagement engine. Where it falls short versus Factors: no native ad activation, limited multi-touch attribution models, and engagement-only analytics rather than full-funnel revenue attribution.
Also read: Factors vs warmly: which B2B GTM platform fits your playbook?
Also, read Warmly alternatives and competitors
Pricing: Annual pricing starting at $16,000/year (Nurture Agent), up to $25,000/year (Marketing Ops Agent).
Best for: SDR-heavy or sales-led B2B teams that want to act on website intent immediately, rather than analyze it post-campaign.
8. Koala: Best for product-led growth teams with strong PLG signals
Koala is purpose-built for PLG companies that want to combine product usage data with website intent and third-party signals to surface the highest-converting accounts.
Koala is an intent-based sales intelligence platform designed for product-led growth teams that combines website activity, product usage data, and third-party intent signals to score and surface the accounts most likely to convert.
This makes it a Fibbler alternative only in the narrow sense, both help sales teams identify warm accounts. But Koala's use case is fundamentally different: it's for companies where product adoption is itself a buying signal, not for teams whose primary intent channel is LinkedIn Ads.
Best for. PLG SaaS companies that want to convert product-qualified accounts (PQAs) into pipeline using behavioral data from their own product.
9. Metadata.io: best for automated paid media optimization across LinkedIn and Google
Metadata focuses squarely on making paid media more efficient. It automates campaign creation, budget allocation, and audience targeting across LinkedIn, Facebook, and Google, using account-level data to reduce wasted spend and improve conversion rates.
Where it overlaps with Fibbler: both deal with LinkedIn Ads. Where it diverges: Metadata is about optimizing ad spend, not just attributing it. It's closer to Factors.ai's AdPilot functionality than to Fibbler's attribution-first model.
If your primary bottleneck is "our LinkedIn Ads aren't performing and we need smarter automation," Metadata deserves a look. If your bottleneck is "I can't prove LinkedIn Ads drove pipeline," Fibbler or Factors serve that need better.
Pricing: Not publicly listed. Contact for pricing.
Best for: Demand gen teams running significant paid media budgets across LinkedIn and Google who want autonomous campaign optimization, not just attribution.
Also, read Metadata vs Factor.ai
10. RollWorks: Best for SMB ABM with CRM-native workflows
RollWorks is an ABM platform built for smaller teams that want account targeting and ad retargeting without the complexity (or price tag) of enterprise platforms like 6sense or Demandbase.
It integrates directly with HubSpot and Salesforce, lets teams build target account lists, run display and LinkedIn retargeting, and measure account-level engagement. The analytics are basic by enterprise standards, but the setup is fast, and the onboarding is more accessible for lean GTM teams.
Also, read: Rollworks alternatives
Pricing: Not publicly listed; significantly lower than 6sense or Demandbase.
Best for: SMB and early-stage B2B teams that want ABM capabilities beyond LinkedIn-only tools, without committing to an enterprise platform budget.
How Fibbler compares to the alternatives: quick reference
| Tool | Best for | SOC 2 certified | Multi-channel intent | Native ad activation | Starting price |
|---|---|---|---|---|---|
| Factors.ai | Full-funnel ABM + LinkedIn/Google activation | Yes (Type II) | Yes (1st, 2nd, 3rd party) | Yes (AdPilot) | Free plan available |
| Fibbler | LinkedIn + Google Ads attribution | Not yet (in progress) | No (ads only) | No | $89/month |
| HockeyStack | Deep buyer journey analytics | Not confirmed | Partial | No | ~$2,200/month |
| Dreamdata | Multi-channel revenue attribution | Yes | Yes | No | Free plan available |
| 6sense | Enterprise ABM with predictive AI | Yes | Yes (40,000+ sites) | Yes | Custom/Enterprise |
| Demandbase | Enterprise GTM alignment | Yes | Yes | Yes | Custom/Enterprise |
| ZenABM | LinkedIn ABM orchestration | Not confirmed | Partial | Partial | Not listed |
| Warmly | Real-time visitor engagement | Yes | Partial | No | $16,000/year |
| Koala | PLG account conversion | Not confirmed | Yes (PLG signals) | No | Not listed |
| Metadata.io | Paid media optimization | Yes | Partial | Yes | Custom |
| RollWorks | SMB ABM and retargeting | Yes | Partial | Yes | Not listed |
Fibbler pricing vs Alternatives: what you actually pay
Fibbler's pricing starts at $89/month (Growth plan), $129/month (Unlimited), and $159/month (Agency), with a Google Ads attribution add-on at $59/month additional.
At that price, it's genuinely one of the most accessible LinkedIn attribution tools on the market. But the question isn't just what you pay; it's what you get, and what you still need to buy separately.
With Fibbler, you still need:
- A separate tool for website visitor identification
- A separate intent data provider (Bombora, G2, etc.)
- A separate ad activation layer for building and refreshing LinkedIn/Google audiences
- Contact enrichment for the accounts you identify
- A multi-touch attribution platform if you need cross-channel revenue tracking
Factors.ai's paid plans consolidate several of these into one platform. For teams already spending on three or four point tools, the math often shifts in Factors' favor when you total actual stack cost, not just per-seat pricing.
Fibbler compliance and security: what you need to know before signing a DPA
This section exists because it matters, especially for buyers at mid-market and enterprise companies who have procurement teams reviewing vendor security before contracts are signed.
Fibbler's current compliance status (as of June 2026):
- GDPR compliant. All data is hosted in the EU on Google Cloud and Fly.io. Data never leaves the EU; operations are fully contained within European data centers.
- AES-256 encryption at rest, TLS in transit.
- Third-party security audit completed by Aikido Security in February 2026.
- SOC 2 Type II and ISO 27001: not yet certified. The audit process started in January 2026 and is expected to complete around the end of summer 2026.
For EU-based smaller teams, Fibbler's GDPR posture and EU data residency may be sufficient. For companies with strict InfoSec requirements, particularly those selling to US enterprise or regulated industries, the missing SOC 2 is a real obstacle.
Factors.ai's compliance status, for comparison:
- SOC 2 Type II certified (via GCP infrastructure)
- ISO 27001 certified
- GDPR compliant, with Standard Contractual Clauses for EU-US data transfers
- AES-256 encryption at rest, TLS in transit
- Strict IAM-based access control, formal incident response policy, dedicated Data Protection Officer
If your procurement process includes a security questionnaire, Factors clears those filters. Fibbler currently does not, though that's expected to change later in 2026.
When is Fibbler the right call?
This guide isn't a hit piece. Fibbler is genuinely useful for specific situations, and recommending the wrong tool doesn't help anyone.
Choose Fibbler if:
- Your GTM motion is primarily LinkedIn-driven, and you need clean, fast attribution without infrastructure overhead
- You're a small or early-stage team that doesn't have the RevOps bandwidth to onboard a platform like Factors or 6sense
- You're EU-based, GDPR is your main compliance concern, and SOC 2 isn't a procurement requirement
- You want to prove LinkedIn ad ROI quickly to leadership without a 4-week implementation
- Your budget is under $200/month and you need a single-channel attribution tool
Choose a Factors.ai alternative if:
- Your ICP also finds you through Google, your website, G2, or content, and you need to see all of it
- You're running LinkedIn AdPilot or Google AdPilot-style automation and need audiences that refresh automatically
- Your sales team needs to know when to reach out, not just who engaged
- Enterprise procurement requires SOC 2 Type II and ISO 27001 certification
- You need multi-touch attribution that ties ad spend to actual closed revenue
The teams that outgrow Fibbler fastest are the ones whose GTM motion grew past LinkedIn, and they suddenly need to explain pipeline influence across five channels, not one.
FAQs on Fibbler alternatives
Q1. What is the main limitation of Fibbler compared to full-stack ABM platforms?
Fibbler's core limitation is signal scope. It tracks LinkedIn Ads and Google Ads engagement at the company level, but has no visibility into website intent, G2 activity, CRM behavioral signals, or third-party intent sources like Bombora. This means it can tell you an account clicked your LinkedIn ad, but can't tell you that same account has been visiting your pricing page four times a week and is already on your target account list. Full-stack platforms like Factors.ai combine all of these signals into one account view.
Q2. Is Fibbler SOC 2 certified?
Not as of June 2026. Fibbler started its SOC 2 and ISO 27001 certification process in January 2026 and expects to complete it by the end of summer 2026. Their infrastructure providers (Google Cloud, Fly.io) are SOC 2 Type II and ISO 27001 certified, and Fibbler completed a third-party security audit with Aikido Security in February 2026. If SOC 2 is a hard procurement requirement for your company today, Fibbler cannot satisfy it yet; Factors.ai can.
Q3. What is the best Fibbler alternative for mid-market B2B teams?
Factors.ai. It gives mid-market B2B teams account identification, multi-source intent signals, LinkedIn and Google AdPilot for native ad activation, multi-touch attribution, and SOC 2 compliance, without requiring an enterprise-level budget or a 3-month implementation. The free plan also lets you start without a credit card.
Q4. How does Fibbler pricing compare to alternatives?
Fibbler starts at $89/month (Growth plan), which is among the lowest entry points for LinkedIn attribution tools. HockeyStack reportedly starts at $2,200/month. Warmly starts at $16,000/year. Factors.ai has a free plan with paid tiers available for growing teams. The key question is whether you need additional tools to fill the gaps Fibbler leaves.
Q5. Can Fibbler activate LinkedIn Ads automatically?
No. Fibbler shows you which companies engaged with your LinkedIn campaigns, but it doesn't auto-build audiences, refresh them based on live signals, or send conversion data back to LinkedIn's algorithm. Factors.ai's LinkedIn AdPilot does all three, building audiences from ICP and intent data, updating them daily, and using CAPI to feed conversion outcomes back into LinkedIn for smarter optimization.
Q6. What is the best Fibbler alternative for enterprise teams?
6sense or Demandbase for enterprise GTM teams that need predictive AI and a dedicated advertising layer. Factors.ai for enterprise teams that want full-funnel attribution, native ad activation, and SOC 2 compliance at a more accessible price point than legacy enterprise ABM platforms.
Q7. Does Fibbler integrate with Salesforce and HubSpot?
Yes, natively, via a push-only sync. Fibbler pushes LinkedIn ad engagement data into HubSpot or Salesforce as custom fields. It doesn't pull data from your CRM to inform ad targeting. Factors.ai does both: it pulls CRM data to build smarter LinkedIn audiences, and pushes enriched engagement and intent data back into your CRM with bi-directional sync.
Q8. What makes Factors.ai different from Fibbler beyond LinkedIn attribution?
Three things: multi-source intent (website, G2, Bombora, CRM, ads, not just LinkedIn), native ad activation (auto-built audiences, impression control, CAPI feedback loops across LinkedIn and Google), and multi-touch attribution that connects every touchpoint to closed revenue. Fibbler handles one stage of the GTM motion: ad engagement visibility. Factors handles the entire motion.

AI marketing ROI & business impact: how B2B teams actually measure value
Learn how to measure AI marketing ROI, reduce wasted spend, improve attribution, and scale B2B marketing efficiency with AI.
TL;DR
- Measuring productivity metrics like "hours saved" or "content volume scaled" is an operational dead end.
- True B2B AI return on investment (ROI) is defined strictly by customer acquisition cost (CAC) reduction, pipeline acceleration, and closed-won revenue impact.
- Generative AI is a static tool that requires prompt engineering and manual supervision to accelerate production.
- Agentic AI is an autonomous, closed-loop infrastructure layer designed to drastically reduce decision latency, minimizing the time elapsed between a buyer intent signal and a sales action.
- High-leverage AI ROI often surfaces silently as cost avoidance; machine learning models generate immediate returns by dynamically suppressing out-of-market retargeting, eliminating duplicate ad impressions across account-based marketing (ABM) platforms, and filtering bad-fit accounts before they reach sales.
- AI acts as an operational multiplier; it cannot engineer data maturity.
- Deploying predictive scoring or intent orchestration on top of a fragmented Customer Relationship Management (CRM) platform simply scales data inaccuracies and pipeline dysfunction faster.
AI has a funny way of looking successful.
The team is moving at the speed of light. More and more content is getting published. Workflows that used to take HOUR now take minutes. Leadership is happy. The vendor is even happier.
Six months later, someone from finance asks the deeply inconvenient question: "So what did all this actually do for revenue?"
That's usually where the confidence starts to wobble.

And suddenly the room develops a strong interest in discussing productivity metrics.
That's usually where things start falling apart.
Not because AI isn't creating value. In many cases, it is. The problem is that most teams are measuring things that are easy to count rather than things that matter. Hours saved. Content produced. Prompts generated. Workflows automated.
All useful metrics… but none of them pay salaries.🙁
Somewhere along the way, marketing convinced itself that productivity and ROI were the same thing. They're not. One is a leading indicator. The other is what your CFO keeps asking about after the third renewal invoice arrives.
The companies getting real returns from AI aren't necessarily using more AI than everyone else. They're just much better at answering a simple question:
"What happened after the AI did its thing?" Did pipeline increase? Did conversion rates improve? Did CAC come down? Did revenue move?
Because if the only thing that changed was the number of LinkedIn posts being published, congratulations. You've successfully automated the production of LinkedIn posts.
That's not necessarily a business outcome.
This guide is about measuring the outcomes that actually matter, connecting AI activity to revenue, and avoiding the awkward experience of explaining to leadership why your AI strategy is generating far more dashboards than dollars.
Why AI marketing ROI is suddenly under pressure
For about two years, "we're using AI" was a complete sentence at most companies. It implied innovation, forward-thinking, and generally got executives off your back. That era is over.
The shift happened somewhere around late 2024, when CFOs started asking for something more than productivity screenshots. They wanted pipeline impact. They wanted cost-per-acquisition movement. They wanted to see AI show up in the revenue numbers, not just the output numbers. And honestly? That's fair. At this point, most major B2B marketing teams have been running AI tools for long enough that the "we're still learning" grace period has expired.
What makes this harder is that AI spend is now significant enough to show up on a budget line. When you're spending $50K a year across AI tools, writing assistants, predictive platforms, and agentic workflows, the ROI question isn't abstract anymore. There's an actual denominator.
The pressure is compounding because most AI projects were greenlit based on productivity promises, "marketers will do more with less", rather than revenue promises. So now teams are stuck trying to reverse-engineer a business case for investments that were never framed in business terms. It's like being asked to explain the calories in a dish after you've already eaten it.
The companies navigating this well have stopped trying to justify historical spend and started building forward-looking measurement systems. The ones struggling are still looking for a single number that makes the investment look good. There isn't one. There's a framework.
What does ‘AI marketing ROI’ actually mean?
Before we can measure it, we need to agree on what we're measuring. And "AI marketing ROI" is genuinely less obvious than it sounds.
At its most literal, it's the ratio of value generated to cost incurred from AI investments in marketing. But value comes in several forms that behave differently, compound differently, and require different attribution approaches.
Here's the framework I use:
| ROI type | What it measures | Example |
|---|---|---|
| Efficiency ROI | Time and cost reduction | Campaign launch time cut by 40% |
| Performance ROI | Output quality and conversion impact | ROAS improved by 25% on ABM campaigns |
| Attribution ROI | Accuracy of marketing measurement | View-through influence identified on 30% of pipeline |
| Strategic ROI | Better decisions over time | ICP refined based on AI-scored firmographic signals |
| Revenue ROI | Direct pipeline and revenue contribution | $2M pipeline influenced by AI-personalized sequences |
The mistake most teams make is measuring only efficiency ROI and calling it a day. "We saved 200 hours of content writing time." Great. What did those 200 hours generate? If you can't answer that, you haven't measured ROI, you've measured activity.
Revenue ROI is the hardest to measure cleanly because it requires attribution infrastructure. You need to be able to draw a line from an AI-influenced touchpoint to a closed deal. Most companies can't do that today. But that's the goal worth building toward, because it's the one that makes the CFO conversation easy.
The other thing worth naming: AI ROI has a time dimension. Efficiency ROI shows up fast. Revenue ROI takes longer. Strategic ROI compounds quietly over quarters and then suddenly looks like a structural advantage. A measurement framework that only looks at quarterly returns will systematically undervalue the most durable form of AI investment.
The biggest mistake companies make when measuring AI ROI
Let me be direct: the most common mistake is measuring AI like a point solution when it actually functions as a workflow layer, which is why treating AI like an organizational change effort matters more than treating it like a simple software purchase.
When you measure a point solution, you ask: "What did this tool do?" When you measure a workflow layer, you ask: "How did this change what the entire system produces?" These are completely different evaluations.
Take a company that deploys an AI writing tool. A point-solution measurement asks: "How many posts did we publish?" A workflow-layer measurement asks: "Did content-assisted pipeline increase? Did organic traffic convert at a higher rate? Did content production bottlenecks stop blocking the sales team's outreach sequences?"
The hours-saved metric is not useless. It's just incomplete. An hour saved by a junior writer means something different from an hour saved by your best strategist. AI that frees up time for high-leverage thinking has a different ROI than AI that produces more of something nobody needed more of. Under BCG's 10/20/70 rule, 70% of resources in AI marketing go toward people and processes, which makes team training and skilled talent central to ROI.
The other major failure mode is retroactive dashboard building. Teams run AI workflows for six months, realize they didn't measure anything, and then try to reconstruct impact from whatever data is available. This produces survivorship bias at best and outright fiction at worst. You end up measuring AI ROI with the same fragmented, cookie-based, last-touch attribution that never accurately measured traditional marketing ROI either. Weak change management and missing executive sponsorship often stall AI initiatives even after successful pilots, especially when implementing AI without clear ownership.
And here's the uncomfortable truth underneath all of this: AI amplifies operational maturity. If your GTM data is clean, your attribution is solid, and your funnel metrics are trustworthy, AI will make you measurably better. If none of those things are true, AI will make your dysfunction faster, louder, and more expensive. It's the marketing equivalent of adding turbo to a car with a cracked engine.
The teams that get real ROI from AI aren't necessarily the ones with the most sophisticated tools. They're the ones who built clean data foundations first.
The 5 types of ROI AI creates in marketing
- Efficiency ROI
This is the most visible and the easiest to sell internally, which is exactly why it gets over-indexed. AI genuinely compresses time on things that used to require multiple people and multiple rounds of back-and-forth.
- Campaign briefs that took three days now take an afternoon.
- Reporting summaries that required an analyst now get drafted automatically.
- Content production for templated formats (ad copy, email sequences, landing page variants) can scale 5x without proportional headcount growth.
To track performance here, quantify efficiency ROI by monetizing hours saved on repetitive tasks at each employee’s fully loaded labor cost, while factoring in whether consolidated workflows reduce ongoing maintenance overhead.
The key is being honest about what this time compression is worth. If it frees your best marketers to do more strategic work, it's high-value efficiency. If it just means more of the same mediocre output shipped faster, the ROI is marginal. For generative AI work, time-to-market can be measured by the hours saved on copy and design tasks.
- Performance ROI
This is where AI starts earning its keep in the revenue conversation. Better audience targeting, smarter bidding, more relevant personalization, these improve the underlying performance of campaigns, not just the speed of executing them.
AI-driven predictive audience models consistently outperform manually built segments on conversion rate. Intent-based scoring shifts budget toward accounts that are actually in-market rather than accounts that look right on paper. These are performance improvements that show up in ROAS, in MQL quality, in sales acceptance rates. Performance ROI should track key metrics such as Customer Acquisition Cost (CAC), Return on Ad Spend (ROAS), and conversion rates to quantify revenue lift from AI-driven execution. Engagement signals like open rates, click-through rates, and session duration also matter when evaluating AI personalization.
- Attribution ROI
Probably the most underrated category. AI improves your ability to understand what worked. View-through attribution, multi-touch influence modeling, account-level journey mapping: these capabilities let you make better budget allocation decisions, which is its own form of ROI. Attribution ROI also depends on attribution accuracy, and with predictive analytics you can assess which touchpoints actually drive sales across the entire customer journey.
If you were previously allocating 40% of budget to a channel that appeared to drive 60% of conversions (because it owned last touch), and AI-powered attribution reveals the actual influence picture is different, the ROI from that insight could exceed the ROI from all your content tools combined.
- Strategic ROI
This one compounds quietly. AI-assisted ICP refinement, predictive churn signals, account scoring models that improve over time, these create a strategic edge that's hard to attribute to a specific quarter but very visible over a year or two. Strategic ROI often comes from actionable insights and deeper insights generated by AI solutions over time.
The companies that will dominate their categories in 2027 are probably building this ROI right now without fully realizing it.
- Revenue ROI
The hardest to isolate, the most important to track. Pipeline influenced by AI-personalized outreach, deals accelerated by predictive sales alerts, expansion revenue identified by AI churn models, and retention gains reflected in customer lifetime value and broader customer lifetime revenue impact, including changes from AI retention campaigns, are the numbers that make AI spending defensible at the board level.
Measuring this properly requires connecting marketing AI activity to CRM data, which requires clean integrations, account-level thinking, and patience. Most teams aren't there yet. But it's the north star.
AI marketing ROI metrics every B2B team should track
Here's the honest answer to "what should we actually measure": it depends on where you are in your AI maturity curve. But here are the metrics that matter across the board.
| Metric | Why it matters | AI impact |
|---|---|---|
| CAC | Core efficiency indicator | AI targeting reduces spend on low-fit accounts |
| Pipeline influenced | Revenue impact | AI-orchestrated touches show up in influenced pipeline |
| ROAS | Ad efficiency | Budget optimization and predictive bidding improve returns |
| MQL to SQL conversion | Lead quality | Intent scoring lifts conversion to sales-accepted |
| Time-to-launch | Operational efficiency | AI workflow automation compresses campaign cycles |
| Content production velocity | Team productivity | GenAI tools scale output without scaling headcount |
| Win rate | Revenue quality | Better account prioritization improves close rates |
| Sales cycle length | Pipeline velocity | AI-driven signals accelerate decision timelines |
| AI-assisted pipeline % | Attribution clarity | What share of pipeline touched an AI-influenced moment |
| Content-influenced revenue | Content ROI | Pipeline that engaged with AI-assisted content pre-close |
The most important metric most teams aren't tracking yet: AI-assisted pipeline percentage. You need to know what share of your closed-won deals had an AI-influenced touchpoint in the journey. That number tells you more about actual ROI than any productivity metric.
The other thing worth building: account-level measurement rather than lead-level measurement. B2B pipeline is an account-level phenomenon. A decision at a $500K deal involves six to ten people across multiple departments, over six to eighteen months. Lead-level attribution misses most of what's actually happening. AI ROI measurement needs to operate at the account level to be credible.
How does AI change marketing efficiency across the funnel?
Efficiency in marketing gets talked about almost exclusively in terms of output volume. More content, more campaigns, more touchpoints. But the more interesting and durable efficiency gains are in friction reduction, specifically, reducing the friction between marketing activity and revenue outcomes.
- At the top of the funnel, AI's contribution is mostly about scale and relevance. AI content tools let you produce more variations, test more angles, and cover more keyword surface area. AI audience research tools let you understand what your ICP actually cares about right now rather than what you assumed six months ago when you wrote the messaging doc. Predictive trend analysis helps you lean into conversations before they peak rather than after.
- In the middle of the funnel, AI starts doing something more interesting: it helps you treat different accounts differently without building custom workflows for each one. Lead scoring based on behavioral signals, personalized journey orchestration based on industry and stage, content recommendations that surface the right case study at the right moment, these are efficiency gains that also look like performance gains, which is why MOFU is where AI investment tends to have the highest combined ROI.
- At the bottom of the funnel, the efficiency story is about decision speed. Intent prioritization tells your sales team which accounts to call today rather than which accounts look interesting in theory. Pipeline prediction gives revenue leaders a more accurate view of the quarter without requiring manual CRM hygiene. Sales alerts based on account signals reduce the time between "account showed buying intent" and "rep acted on it" from days to hours.
The throughline: real marketing efficiency means compressing the distance between insight and action. AI does that at every stage of the funnel, but the measurement approach for each stage looks different.
How to measure ROI from generative AI in content marketing?
The ROI of AI for content marketing is more complicated than it looks on the surface, and I think a lot of teams are currently overcounting it.
Here's what's real: generative AI meaningfully improves content production velocity. Brief-to-draft timelines that used to take a week can happen in a day. Scaling from 10 pieces of content per month to 40 without adding headcount is genuinely achievable. AI-assisted SEO optimization )meta descriptions, internal linking suggestions, semantic coverage analysis) compresses what used to be a two-person job into one.
Here's what people overclaim: that velocity translates directly into traffic, pipeline, and revenue. It doesn't, automatically. The internet is currently experiencing a content volume explosion driven by AI, which means the bar for content that actually ranks, gets cited, and influences decisions is higher than it was two years ago. Publishing more doesn't help if none of it is good enough to earn attention.
The metrics that actually matter for generative AI content ROI:
- Organic traffic growth on AI-assisted content vs baseline
- Content-assisted pipeline (deals that engaged with content before closing)
- Time-to-publish on content types where AI accelerates production
- AI visibility in LLM results (answer engine optimization, increasingly relevant)
- Cost per piece of content produced
That last category, AI visibility in LLM results, is genuinely new and genuinely important. As more B2B buyers use AI assistants to research vendors and solutions, getting cited in model outputs is a real distribution channel. It requires structured content, clear authority signals, and the kind of comprehensive coverage that lets an LLM confidently attribute a claim to your brand. This isn't a vanity metric. It's an emerging acquisition channel.
The content ROI equation is NOT "publish more." It's "publish better, faster, and in formats that LLMs can cite and distribute."
How to measure ROI from AI in paid media and ABM?
This is where AI ROI gets the most concrete and the most measurable, which is probably why it's also where the best-run marketing teams are concentrating their investment.
When evaluating paid-media AI, measure the direct financial return of campaigns alongside labor costs and tech spend to understand whether ai marketing tools and ai powered tools are actually improving efficiency.
Paid media is a closed loop by nature. You spend money, you get data, you optimize. AI plugs into that loop at several points: audience building, bid optimization, budget allocation, creative testing, and conversion attribution. Each of these is measurable, which means ROI claims here are actually defensible.
The AI capabilities that move paid media ROI meaningfully:
- Predictive audience modeling. AI-built lookalike and intent audiences consistently outperform manually built segments on ROAS, because they're built on behavioral signals rather than assumptions about what your ICP looks like.
- Dynamic ICP targeting. Real-time adjustments to who gets served what message based on account-level firmographic and engagement signals.
- Offline conversion syncing. Connecting CRM deal data back to ad platform algorithms so optimization is based on pipeline quality, not just form fills. This is one of the highest-leverage changes a B2B team can make.
- Budget suppression. AI-identified accounts that are unlikely to convert get suppressed, which reduces waste and improves efficiency ratios even before improving absolute results.
For ABM specifically, the ROI picture looks like this: AI-driven ABM campaigns that use account-level engagement signals to orchestrate ads, content, and sales outreach tend to see shorter sales cycles, higher deal sizes, and better conversion rates than spray-and-pray approaches. The measurement challenge is that ABM deals take longer, so ROI timelines don't fit neatly into quarterly reporting.
On LinkedIn specifically, which is still the dominant B2B paid channel, ICP-weighted optimization using engagement data beyond clicks (impression pacing, account-level time-on-content, multi-channel touchpoint mapping) is where the real efficiency gains live. Optimizing for cost-per-click on LinkedIn in 2025 is like optimizing for page views in 2019. You're measuring the wrong thing.
Agentic AI and the next phase of marketing ROI
We need to talk about agentic AI separately from generative AI because they are genuinely different things with genuinely different ROI profiles.
Generative AI is a tool. It responds to prompts. You put something in, you get something out. The ROI comes from what you do with the output. Agentic AI is a system. It monitors signals, makes decisions, takes actions, and loops back. The ROI comes from what happens without you having to be in the room.
The productivity economics of agentic AI are different in a specific way: they don't scale with headcount. A human marketing team scales its capacity by hiring. An agentic AI system scales its capacity by running more workflows in parallel without additional cost. For high-volume, signal-driven tasks, account monitoring, campaign adjustments, alert generation, intent-to-action routing, this is a fundamentally different cost structure.
The ROI of agentic AI in B2B marketing automation comes primarily from what I'd call decision latency reduction. The time between "this account showed a buying signal" and "we acted on it" is where pipeline leaks. Human-in-the-loop systems take hours or days. Agentic systems take minutes. That gap, multiplied across hundreds of accounts, compounds into meaningful pipeline velocity improvements.
The risks are real, though. Over-automation without oversight creates brand risk. Agentic systems acting on noisy signals can poison account relationships at scale. The ROI case for agentic AI includes the cost of governance, monitoring, and periodic audits, not just the efficiency gains. Teams that ignore this will have a reckoning.
The honest ROI measurement framework for agentic AI: track the decisions it made autonomously, what actions followed, and what pipeline outcomes those actions contributed to. Compared to a baseline of human-driven response time and conversion rate, that delta is your agentic ROI.
Building an AI marketing performance dashboard
An executive-ready AI performance dashboard isn't a collection of AI tool metrics. It's a view of how AI investment connects to the business outcomes leadership actually cares about.
The structure I recommend:
| Dashboard section | Metrics to include |
|---|---|
| Pipeline impact | AI-assisted pipeline %, influenced revenue, sales cycle length by AI touchpoint |
| Campaign efficiency | ROAS by AI-optimized vs baseline campaigns, time-to-launch, impression waste rate |
| Content performance | AI-assisted organic traffic, content-influenced pipeline, LLM citation frequency |
| Audience intelligence | ICP match rate, account engagement score, intent coverage % |
| Attribution visibility | Multi-touch contribution by channel, view-through influence, offline conversion match rate |
| Spend efficiency | CAC trend, budget allocation accuracy, waste suppression rate |
Two things kill this dashboard in practice. The first is disconnected data. If your ad platform, CRM, MAP, and analytics tools don't share a common account identifier, your attribution layer is fiction and your "AI ROI" numbers are at best directionally correct. The second is measuring AI tools separately rather than measuring AI impact on outcomes. A dashboard that shows "we used AI in 47 campaigns this quarter" tells you nothing. A dashboard that shows "AI-optimized campaigns drove 2.3x the pipeline of non-AI campaigns" tells you something you can act on.
The goal isn't to prove that AI is working. It's to understand where it's working, so you can do more of that and less of the stuff that looks like AI ROI but isn't.
AI marketing budget optimization strategies
Budgeting for AI in marketing is still mostly guesswork at most companies, which is a problem because AI tools have genuinely different ROI profiles depending on how mature your data infrastructure is.
A maturity-based approach to AI budget allocation:
| Stage | AI maturity | Where to invest |
|---|---|---|
| Beginner | No attribution, fragmented data | AI content tools, basic automation |
| Intermediate | Single-platform attribution, clean CRM | Predictive scoring, paid optimization |
| Advanced | Cross-channel attribution, account-level data | Agentic workflows, autonomous optimization |
The most common budgeting mistake is spending at the "advanced" level before reaching "intermediate" maturity. Buying a sophisticated intent data platform when your CRM has 40% data hygiene issues are a waste of budget and an easy way to develop institutional skepticism about AI tools that will outlast your tenure.
The allocation principle that actually works: invest first in AI that improves your ability to measure, then in AI that improves your ability to perform. Measurement AI pays for itself by making everything else more attributable. Performance AI compounds on top of measurement infrastructure. In that order, the ROI math works. In the reverse order, you get impressive dashboards that don't connect to anything real.
Predictive spend optimization is worth calling out specifically. AI systems that can adjust budget allocation in real-time based on account engagement signals, intent data, and historical conversion patterns consistently outperform manually managed budgets on pipeline per dollar spent. The catch: they require clean conversion data flowing back to the optimization layer. Which brings us back to data infrastructure being the prerequisite for everything else.
Where does AI reduce waste in marketing spend?
This is actually where some of the most compelling AI ROI lives, and it's the part of the story that's least often told. Most AI ROI conversations focus on growth, more content, better targeting, more pipeline. But AI ROI often shows up first as waste reduction, which improves efficiency ratios before improving absolute output.
The specific waste categories AI addresses well:
- Bad-fit lead pursuit. AI scoring models reduce the percentage of MQLs that are actually poor-fit accounts dressed up in conversion behavior. Fewer bad-fit leads handed to sales means less wasted sales capacity and better SDR morale.
- Ad fatigue and frequency waste. AI-managed impression pacing and audience rotation reduces the cost of overexposing the same accounts to the same message. This shows up in CPM trends and engagement rates.
- Duplicate targeting. In multi-platform ABM programs, AI can identify and suppress overlapping audiences across channels, reducing spend on the same account across multiple platforms without coordinated frequency management.
- Low-intent retargeting. Serving retargeting ads to people who visited your pricing page once in 2023 and never engaged again is an embarrassing waste that many companies are still doing. AI-based audience suppression based on engagement recency and depth eliminates this.
- Content inefficiency. Publishing content that never attracts traffic, earns links, or influences pipeline is a form of waste. AI-assisted content strategy (keyword clustering, competitive gap analysis, SERP intent mapping) reduces the percentage of content investment that returns nothing.
The framing I'd use for this internally: AI cost avoidance is real ROI. If AI prevents $200K in wasted ad spend this year, that's as real as $200K in additional pipeline, it just doesn't show up as a revenue line. Build your ROI case to include both sides of the equation.
Common reasons AI marketing ROI fails
I've talked to enough B2B marketing teams at this point to have a pattern on this. The failures cluster around a few predictable failure modes.
- Data quality problems upstream. AI models are only as good as the data they're trained on and operating against. Dirty CRM data, unattributed conversions, anonymous web traffic, and disconnected tech stacks mean AI is optimizing toward a broken signal, a major reason ai projects fail, because data silos, poor availability, and inaccurate information break both implementation and measurement. The output looks sophisticated but isn't connected to reality.
- No attribution layer. Measuring AI ROI without attribution infrastructure is guesswork. You can't connect AI-influenced activities to pipeline outcomes if you don't know which touchpoints influenced which deals.
- Measuring productivity instead of business outcomes. Counting hours saved, content pieces published, or campaigns launched is not ROI measurement. These metrics are fine as operational indicators, but they don't tell you if AI is making the business better.
- Tool sprawl without integration. Eight different AI tools that don't share data or common account identifiers create more measurement complexity than they reduce. ROI gets lost in the seams between systems.
- AI without workflow redesign. Plugging AI into existing processes that were designed for human-speed execution often produces marginal results. The real gains come from redesigning workflows around AI's capabilities, which means slower time to value upfront and a steeper learning curve.
- Lack of human oversight on AI outputs. Teams that let AI-generated content or AI-driven decisions run without review cycles tend to accumulate brand and quality debt that eventually offsets efficiency gains.
What successful teams do differently: they start with measurement infrastructure, not AI tools. They define what "working" looks like before they buy anything, because unclear goals and hidden AI costs and AI deployment costs distort expected ROI before rollout even starts. They should also set SMART goals, so AI initiatives connect directly to business goals and are easier to track. They appoint someone accountable for AI ROI, not just AI adoption. And they're honest about what the data actually shows, including when it shows nothing.
How Factors.ai helps teams measure real AI marketing impact
The measurement challenge underlying every section of this post is an attribution and data infrastructure problem. Most marketing teams don't have clean, account-level visibility into what's influencing pipeline, which means their AI ROI measurement is built on a shaky foundation regardless of how good their AI tools are.
Factors.ai is built around the specific infrastructure requirements for modern AI ROI measurement:
- Multi-touch attribution at the account level. Rather than lead-level attribution that misses the buying committee, Factors provides account-level journey mapping that shows every touchpoint, including AI-influenced ones, that contributed to pipeline.
- Pipeline measurement connected to marketing activity. The ability to see which campaigns, channels, and content pieces influenced specific deals closes the loop between AI-assisted marketing activities and revenue outcomes.
- Company-level visitor identification. Connecting anonymous web traffic to known accounts means AI optimization signals are based on real account behavior, not demographic proxies.
- ICP scoring and engagement intelligence. AI-powered scoring that surfaces accounts showing buying signals across web, ads, and content channels, the input layer for effective predictive targeting.
- LinkedIn AdPilot and paid optimization. ICP-weighted campaign optimization that connects impression and engagement data to account-level pipeline outcomes, with offline conversion syncing to close the attribution loop on B2B ad spend.
- Scout-style autonomous workflows. Revenue intelligence and account monitoring that reduce decision latency, the core ROI driver for agentic AI in B2B marketing.
Factors is the measurement and attribution infrastructure that makes AI marketing ROI measurable. And if the argument of this entire post holds, that measurement infrastructure is the prerequisite for real AI ROI, then that's not a small distinction.
The future of AI marketing ROI measurement
The measurement challenge will get harder before it gets easier, for a few reasons.
- First, AI visibility in LLM outputs is becoming a real metric and almost nobody has figured out how to track it yet. As B2B buyers increasingly use AI assistants to research solutions, the brands that show up in model outputs gain a distribution advantage that doesn't register in Google Analytics. Measuring this requires new infrastructure, monitoring what LLMs say about your brand, tracking which content gets cited, and connecting LLM-sourced traffic back to pipeline.
- Second, agentic AI will blur the lines between marketing-driven and sales-driven pipeline in ways that existing attribution models aren't designed to handle. When an AI agent monitors account signals across marketing and sales touchpoints and autonomously routes a message, which team gets the attribution credit? This isn't a philosophy question. It's a measurement question that will affect budget allocation, team incentives, and how companies evaluate their AI investments.
- Third, the compounding nature of strategic AI ROI will start showing up at scale. Companies that have been building ICP models, training intent data systems, and refining audience models for two or three years will have a durable advantage that looks increasingly difficult to replicate quickly. Future measurement systems will also need to capture customer satisfaction scores from AI-enhanced interactions, since the time savings they create can lift Net Promoter Score and reduce customer churn, a true game changer for connecting experience metrics to ROI. The ROI from that compounding won't fit neatly into a quarterly report, but it will show up in win rates and market position over time.
The marketing teams that will win the next five years aren't necessarily the ones who adopted AI first. They're the ones building the measurement systems that make AI accountability possible, and the feedback loops that make AI investment smarter over time. The competitive moat in AI marketing isn't the AI itself… but the infra that tells you if it's working...
FAQs for AI marketing ROI
Q1. What is AI marketing ROI?
AI marketing ROI measures the business value generated from AI investments in marketing, revenue growth, CAC reduction, pipeline acceleration, and efficiency gains, relative to the cost of those investments. The important distinction is between productivity ROI (doing more with less) and business ROI (growing revenue and improving profitability). Most AI marketing ROI conversations focus on the former when the latter is what actually matters to leadership.
Q2. How do you measure ROI from AI in marketing?
Start with the business outcomes you care about, pipeline, CAC, ROAS, sales cycle length, and build backward to the AI activities that influence them. This requires attribution infrastructure that can connect marketing touchpoints to revenue outcomes at the account level. Without that layer, you're measuring activity, not impact. The practical sequence is: clean your data first, instrument your attribution layer second, then deploy and measure AI tools against that baseline.
Q3. What are the best AI marketing ROI metrics?
The metrics that matter most are pipeline influenced, CAC trend, ROAS by AI-optimized vs baseline campaigns, MQL-to-SQL conversion rate, sales cycle length, and content-influenced revenue. The most underused but most valuable metric is AI-assisted pipeline percentage, what share of your closed-won deals included an AI-influenced touchpoint. That single number tells you more about real AI impact than any productivity metric.
Q4. Does AI actually improve marketing ROI?
Yes, when implemented with proper data infrastructure, attribution, and workflow integration. AI alone does not guarantee ROI, in many cases, it accelerates dysfunction in organizations that have broken data, unclear attribution, or misaligned GTM processes. The teams reporting strong AI ROI have typically invested in measurement infrastructure before or alongside their AI tooling, not as an afterthought.
Q5. What is the ROI of generative AI in content marketing specifically?
Generative AI reliably improves content production velocity, reduces cost per piece, and enables faster iteration on messaging. The ROI on organic traffic and pipeline is more variable and depends heavily on content quality and strategy. Publishing more AI-assisted content doesn't help if the bar for content quality has risen (which it has). The emerging ROI lever worth tracking is AI visibility, how frequently AI assistants cite your content in responses to buyer queries.
Q6. How can AI reduce wasted marketing spend?
AI reduces waste through audience suppression (excluding low-intent and bad-fit accounts), predictive bidding that avoids overpaying for low-value placements, duplicate audience identification across channels, and content strategy optimization that reduces investment in content unlikely to perform. Waste reduction is often the first measurable AI ROI signal, appearing before conversion improvements because it requires less attribution infrastructure to track.
Q7. What is the difference between AI productivity and AI ROI?
Productivity measures output efficiency: how much more a team can produce with the same resources. ROI measures business impact: how that output affects revenue, pipeline, and profitability. AI productivity is a means to AI ROI, but the two are not the same. A team can be 3x more productive with AI and generate no additional ROI if the additional output isn't connected to revenue outcomes. Measuring productivity without measuring business impact is a common and expensive mistake.
Q8. What is agentic AI and why does it matter for marketing ROI?
Agentic AI refers to systems that can autonomously monitor signals, make decisions, and take actions without requiring human prompts for each step. For marketing ROI, the significance is decision latency reduction: agentic systems can act on buying signals in minutes rather than the hours or days a human-in-the-loop process requires. This compresses the time between intent and engagement, which improves pipeline conversion rates and sales cycle efficiency at a scale that traditional automation can't match.
Q9. Why does attribution matter so much for AI marketing ROI measurement?
Without attribution, you can't connect AI-influenced activities to pipeline and revenue outcomes. You end up measuring AI activity rather than AI impact. This makes it impossible to know which AI investments are working, which aren't, and how to allocate budget intelligently going forward. Attribution at the account level is specifically important in B2B because buying decisions involve multiple stakeholders and long timelines, lead-level attribution systematically misrepresents what's actually influencing deals.
AI marketing compliance: the practical guide to ethical AI in B2B marketing
Your practical guide to AI marketing compliance: covering governance, ethics, regulations, decisioning, and what B2B teams actually need to do.
TL;DR
- AI marketing compliance covers governance, ethics, legal requirements, and operational accountability across every AI-powered workflow in your marketing stack.
- The biggest risks are biased scoring models, hallucinated stats in content, opaque attribution, and consent gaps nobody audited.
- AI decisioning (when AI automatically makes or influences decisions like lead scoring, budget allocation, and audience targeting) is now embedded in most B2B stacks, and most teams have no governance layer for it.
- Responsible AI marketing isn't about slowing down. It's about building review systems that make speed sustainable.
- The EU AI Act, GDPR, and FTC guidance are converging. B2B teams that ignore the regulatory landscape now will be scrambling to retrofit compliance later.
- First-party data governance, explainable attribution, and human-in-the-loop workflows are becoming differentiators, not just checkboxes.
For a technology that's supposed to save us time, AI has created a surprising number of meetings. And usually… the meeting starts when something weird happens.
An AI tool invents a statistic. A lead scoring model ranks a student wayyy higher than a Fortune 500 prospect. An automated campaign targets customers you're actively trying to exclude. Somebody notices. Screens are shared, people start investigating.
Then comes the most dreaded bit… nobody really knows why it happened.
The vendor has an explanation. The marketing team has a theory. RevOps pulls a report. Someone says, "the model probably learned that from the data."
Eventually, the issue gets fixed, everyone moves on, and the same thing happens somewhere else a few weeks later.
That's the reality of AI adoption for a lot of companies right now.
The tools have moved from experimentation to infrastructure remarkably quickly. AI is writing content, scoring accounts, allocating ad budgets, identifying buying signals, and influencing decisions that directly affect pipeline and revenue. Yet in many organizations, the governance around those systems still looks suspiciously like "if nothing catches fire, we're probably okay."
That's where AI marketing compliance comes in.
Despite the name, it isn't just about regulations, legal reviews, or checking boxes for auditors. At its core, AI compliance is about accountability. It's about understanding how AI systems are being used, putting guardrails around them, and making sure someone can answer a very simple question when things go wrong:
"Why did the AI do that?"
Because sooner or later, somebody is going to ask.
What is AI marketing compliance all about?
AI marketing compliance refers to the set of policies, regulations, ethical standards, and governance practices that ensure AI is used responsibly across marketing workflows. It covers how AI-generated content is reviewed, how targeting and personalization systems handle personal data, how AI decisioning is audited, and how organizations stay accountable when AI outputs are wrong or harmful.
The terms get conflated constantly, so it's worth separating them clearly:
- AI governance is the internal framework: who owns AI decisions, what approval workflows exist, how models are monitored.
- AI ethics is the normative layer: what values guide how AI is used, especially around fairness, privacy, and transparency.
- AI compliance is the regulatory layer: what laws, guidelines, and standards apply and whether you're meeting them.
- AI safety is the technical layer: whether the systems behave reliably and don't cause unintended harm.
In practice, these four overlap constantly, and a failure in one usually creates exposure in the others.
Compliance applies across the entire marketing stack now. It's not just content, it touches audience targeting, attribution logic, lead scoring, AI agents, predictive analytics, personalization engines, and any AI decisioning that influences pipeline or revenue outcomes. Here's a quick reference for where risks live and what compliant teams actually do:
For GTM platforms specifically, governance matters because AI now touches pipeline decisions that used to live with humans. When the system prioritizes Account A over Account B based on a model you can't interrogate, that's not just a product design choice. It's an accountability question.
Why has AI compliance suddenly become a boardroom problem?
A year ago, AI compliance was largely a legal team concern with occasional IT involvement. Now it's showing up in procurement conversations, security questionnaires, enterprise vendor evaluations, and executive risk reviews. The shift happened because adoption outpaced oversight at exactly the wrong moment.
Generative AI tools became mainstream-grade in 2023. By 2024, most marketing teams had at least a handful integrated into daily workflows. AI SDRs were prospecting autonomously. Google's Performance Max and Meta's Advantage+ were making creative and audience decisions with minimal human input. AI agents were being handed tasks that used to require human judgment. As AI adoption accelerated, 56% of companies said they plan to use generative AI in their risk and compliance programs within the next 12 months. And somewhere in all of that acceleration, the question shifted from "can we use AI?" to "should we trust what AI is outputting?"
Legal teams got involved when they realized marketing was processing customer data through third-party AI models with unclear retention policies. IT got involved when security teams started receiving vendor questionnaires asking which AI tools were in use, what training data they were built on, and whether outputs were explainable and auditable. Procurement started asking these same questions of external vendors, which meant marketing organizations suddenly had to have answers too. In practice, 90% of risk and compliance teams using AI report positive impact, including compliance functions like automatically flagging policy violations in marketing content and scanning data use for privacy issues.
The EU AI Act made the regulatory case unavoidable. GDPR already had provisions around automated decision-making that many marketing teams were technically violating without knowing it. The FTC had started publishing guidance on AI-generated marketing content and deceptive automation. And enterprise buyers, particularly in regulated industries, started baking AI governance questions into vendor evaluations. That pressure is even stronger under growing regulatory scrutiny: 68% of financial services firms say implementing AI in risk and compliance functions is their top priority.
The risk that actually moved the needle with boards wasn't "AI will write something bad." It was "AI is making revenue-impacting decisions with no accountability trail." Black-box AI influencing which accounts get prioritized, which leads get scored, how budget gets allocated — those are business risks, not just PR risks.
The biggest ethical risks in AI marketing
Most AI ethics coverage reads like a philosophy lecture with no operational guidance. Here's what actually goes wrong in practice.
- Hallucinated claims in AI-generated content
AI language models generate confident-sounding text whether or not the underlying facts are real. In marketing, this shows up as invented statistics ("67% of buyers say..."), fabricated case study details, incorrect product specifications, or made-up citations. Exaggerated or unsubstantiated AI-generated claims can trigger compliance issues, especially when a performance claim cannot be substantiated. Any of these can become published content if there's no review layer. The model just doesn't know what it doesn't know, which is somehow… worse.
Teams running high-volume AI content workflows are especially exposed here. When the goal is output velocity, the review process often becomes the casualty. The FTC also targets AI-washing when marketers overstate ai capabilities in customer-facing claims.
- Biased targeting and lead scoring
Predictive models learn from historical data. If your historical data reflects biased outcomes (certain segments converting better because they were targeted more, or certain personas being historically de-prioritized), the model learns and replicates those patterns. The result is algorithmic filtering that systematically excludes or deprioritizes certain accounts or contacts, often without anyone noticing because the model's logic isn't surfaced.
This is one of the least-discussed risks in B2B AI marketing and one of the hardest to catch without deliberate auditing.
- Manipulative personalization
There's a meaningful difference between personalization that's useful and personalization that's exploitative. Using intent signals to show relevant content is useful. Identifying anxiety signals to time outreach for maximum psychological vulnerability is something else. The line isn't always obvious, but it's worth drawing deliberately. Personalization that makes prospects feel surveilled rather than understood creates the opposite of trust.
- Consent and privacy violations
hird-party data enrichment tools, intent data providers, and AI-powered identification platforms all operate in a consent gray zone that's getting tighter. GDPR's provisions on profiling and automated decision-making already apply to much of what modern ABM platforms do under tightening privacy rules, where valid consent and proper consent are central for AI-powered identification, enrichment, and tracking. CCPA, as amended by CPRA, adds opt-out mechanisms and “Do Not Sell My Info” links that should be reflected in consent status across AI-powered marketing workflows. Using scraped data, unverified enrichment sources, or tracking tools without proper disclosure creates real legal exposure, not just reputational risk.
- Deepfake and synthetic media risks
AI-generated spokesperson videos, cloned voices in ads, and synthetic testimonials are technically accessible to most marketing teams now. The line between "AI-assisted production" and "deceptive content" is thin and getting regulatory attention, and required disclaimers may apply when synthetic media appears in marketing materials. This isn't a far-future risk — it's a current one. Sponsored influencer content created with AI may need to disclose both the paid partnership and the AI use to avoid missing disclosures.
- Black-box AI decisioning
In AI-driven marketing, marketers are increasingly unable to explain why AI made a decision, and those black-box outputs increase compliance exposure when teams cannot explain them. Why was this account scored low? Why did the algorithm deprioritize this audience? Why did the creative perform differently? When there's no answer to those questions, there's no accountability, and no ability to course-correct when something goes wrong. That lack of explainability becomes especially risky as regulatory violations and enforcement actions increase around AI-generated marketing decisions.
AI decisioning in marketing: what it actually means
"AI decisioning" has become one of those terms that gets used in vendor decks without much operational clarity. In practice, it refers to AI systems automatically making or influencing marketing decisions, rather than just assisting humans in making them.
The distinction matters. AI-assisted content generation still involves a human reviewing and approving output. AI decisioning operates at a layer where the decision happens before the human sees it, or where human review is theoretically possible but practically impossible at scale.
Here's how this maps across common marketing workflows:
The best AI decisioning use cases in B2B marketing are the ones where speed and pattern recognition genuinely beat human capacity: ABM account prioritization based on real-time intent signals, predictive pipeline scoring across large account bases, customer journey orchestration across multiple channels, campaign pacing against conversion signals, and intent-driven audience segmentation at scale.
What makes AI decisioning compliant is explainability. Can you answer "why?" for any decision the system makes? In ABM specifically, explainable scoring matters enormously. If a revenue leader asks why Account X is prioritized over Account Y, "the model decided" is not a very useful answer… showing the specific signals that influenced the score (firmographic fit, intent spike, engagement depth, CRM stage) is.
That explainability gap is also where black-box AI platforms lose enterprise trust. The differentiation for governed AI systems isn't just accuracy. It's the ability to audit, challenge, and configure the logic.
Responsible AI marketing vs. "move fast and automate everything"
The companies that automated the fastest in 2023 and 2024 are now doing a lot of auditing. Turns out, AI-generated content at scale without review systems produces a lot of mediocre output mixed with occasional serious errors. AI-driven prospecting without governance produces a lot of outreach that feels robotic, impersonal, or off. AI-powered targeting without bias checks produces results that are hard to explain and sometimes hard to defend.
Speed was the pitch. Operational maturity is the problem. And that matters now: 35% of compliance professionals expect AI to drive substantial changes in their compliance processes within the next year, which is exactly why governance has to mature alongside usage.
The teams genuinely winning with AI aren't the ones who removed humans from the loop. They're the ones who redesigned the loop so humans are reviewing the right things instead of everything. The practical approach is phased implementation: start with high-impact use cases, keep human intervention in place, and refine workflows with feedback. Here's roughly how AI maturity looks across organizations:
Most B2B marketing teams are somewhere between stages two and three right now. The jump to stage three requires something most teams haven't built yet: an actual AI usage policy that tells people what tools are approved, what data can go into them, what needs human review, and who's accountable when something goes wrong.
The instinct to treat governance as a slowdown is exactly backwards. Without governance, you can't scale AI responsibly because you can't catch the errors before they compound.
AI transparency in marketing: what buyers expect now
Buyer behavior around AI is shifting in ways that aren't fully reflected in most marketing strategies yet. The "AI-generated" label still triggers skepticism in enough audiences that disclosure is becoming a practical question, not just an ethical one.
Enterprise buyers are increasingly asking: was this content AI-generated? Was personal data used to personalize this? How are these recommendations being made? These questions show up in procurement processes, in sales conversations, and in how prospects evaluate vendor trustworthiness.
The answer isn't "never use AI." It's "use it in ways you're willing to be transparent about."
Should marketers disclose AI-generated content?
The honest answer is: it depends on context, but the threshold for disclosure is lower than most teams think.
In regulated industries, healthcare, financial services, legal, disclosure around AI-generated content is increasingly a compliance requirement. Guidance from the FTC and emerging state-level regulations already require that AI-generated marketing content not be materially deceptive, which implicitly covers AI personas, synthetic testimonials, and fabricated endorsements.
For B2B enterprise SaaS, the ethical case for disclosure is strong even without a legal mandate. Buyers making significant purchasing decisions deserve to know if the thought leadership they're reading, the recommendations they're receiving, or the ROI projections they're being presented were AI-generated without substantive human expertise behind them. Content that presents AI output as expert opinion without disclosure is operating in the same neighborhood as ghostwriting, mostly fine, but context-dependent.
The practical guidance: disclose AI assistance in high-stakes content (analysis, recommendations, case studies) and in contexts where authentic expertise is part of the value proposition. You don't need to footnote every email subject line that was A/B tested with AI assistance. You do need to think carefully about AI-generated research reports, AI-written executive thought leadership, and AI-generated testimonials or reviews.
AI marketing compliance regulations in 2025 and 2026
The regulatory landscape is moving faster than most marketing teams are tracking. Here's what actually matters operationally.
EU AI Act
The EU AI Act came into effect in stages through 2024 and 2025 and represents the most comprehensive AI regulatory framework globally. For marketing, the relevant provisions are around transparency obligations for AI systems that interact with people (including chatbots and AI-generated content), prohibitions on certain manipulation techniques, and requirements for high-risk AI systems used in profiling and scoring. If you're operating in European markets or targeting EU-based buyers, this isn't optional reading.
GDPR and AI marketing
GDPR's Article 22 governs automated decision-making with legal or significant effects on individuals. In a strict reading, this applies to AI-driven lead scoring, audience exclusions, and personalization systems that influence what prospects see and when. Consent, legitimate interest documentation, the right to explanation, and data retention limits all apply to AI systems processing personal data. Most marketing teams have GDPR basics covered for their email and web tracking. Far fewer have applied those same requirements to AI enrichment, intent data, and predictive scoring.
FTC guidance on AI-generated marketing
The FTC has been explicit about AI-generated reviews, testimonials, and endorsements; synthetic content that presents as authentic is deceptive marketing. The guidance extends to AI-generated influencer content, AI-written reviews, and AI-generated comparative claims. This is particularly relevant for product marketing content and anything presented as user-generated or independently validated.
Emerging AI regulations globally
US state-level AI legislation is proliferating. Colorado, California, and several other states have passed or are advancing AI bills that include provisions affecting marketing and personalization. India, the UK, and Singapore each have active AI governance frameworks at various stages of maturity. For B2B teams with global footprints, this patchwork means compliance needs to be designed for the most restrictive applicable jurisdiction, not the most permissive.
What should marketers actually do?
- Audit which AI tools in your stack process personal data and under what legal basis
- Review consent mechanisms for AI-powered personalization and enrichment
- Document your AI decisioning workflows and the data inputs they rely on
- Implement human review requirements for AI-generated content that makes factual claims
- Establish a vendor evaluation process that includes AI governance questions
Ethical AI marketing best practices for B2B teams
This is the operational section with actual practices:
- Keep humans in approval workflows
Every AI system that produces customer-facing content, makes targeting decisions, or influences pipeline scoring should have a defined human review checkpoint. The frequency and depth of review should be proportional to risk: AI-generated social captions need lighter review than AI-written analyst-style reports.
- Build an AI usage policy
Without a written policy, every person on your team is making individual judgment calls about what data can go into AI tools, what review is required before publishing, and what vendor practices are acceptable. That's how you end up with someone pasting customer PII into a public AI model because nobody said not to. The policy doesn't need to be lengthy. It needs to be clear about approved tools, restricted data types, review requirements, and escalation paths.
- Validate AI-generated statistics and claims
Every quantitative claim that originates from an AI tool needs a source before it goes live. If the model can't provide a verifiable citation, the claim shouldn't be published. Full stop. This single practice eliminates most of the hallucination risk in content marketing.
- Avoid uploading sensitive customer data into public AI tools
ChatGPT, Claude, Gemini, and similar public AI tools have data handling terms that most enterprise security teams would not approve for customer data. Unless you're using enterprise API versions with documented data handling agreements, assume that data entered into these tools could be used in model training or retained beyond your session.
- Audit AI-generated content regularly
A sampling audit of AI-assisted content on a quarterly basis, checking for accuracy, factual claims, tone consistency, and brand alignment, catches drift before it becomes a problem. Models can be updated, prompts can degrade, and output quality can shift without anyone noticing unless someone's actually reading it with a critical eye.
- Monitor model drift and output quality
AI models change. Whether through vendor updates, changes in underlying training data, or shifts in your own usage patterns, outputs that were consistently strong can degrade. Building lightweight monitoring (even just a human reviewer sampling outputs monthly) is cheaper than discovering quality issues after they've been scaled.
- Create escalation systems for AI failures
When AI produces something wrong, harmful, or ethically questionable, your team needs to know what to do. Who gets notified? What gets reviewed? When does legal or leadership get involved? Having that protocol documented before you need it means you're not making those decisions under pressure.
Responsible AI marketing checklist:
- [ ] AI usage policy is documented and accessible to the team
- [ ] Approved AI tools list exists and is reviewed quarterly
- [ ] Personal and sensitive data handling rules are clear
- [ ] All AI-generated content with factual claims is reviewed before publishing
- [ ] Consent and data lineage is tracked for AI enrichment and scoring
- [ ] Vendor AI governance questionnaire is part of procurement process
- [ ] Model drift monitoring is in place for critical AI workflows
- [ ] Escalation process for AI failures is documented
AI content moderation for marketing campaigns
Content moderation is an underrated compliance lever for marketing teams running campaigns at scale. AI-powered moderation tools can help manage brand safety across ads, user-generated content in communities and events, social campaigns, and webinar comments without requiring a team of human moderators for every interaction.
The capabilities are genuinely useful: toxicity filtering, spam detection, misinformation flagging, and brand safety monitoring across large content volumes. For teams running active LinkedIn or social communities, or managing event platforms with live Q&A, AI moderation provides coverage that's practically impossible with humans alone.
The limitations are worth understanding clearly, though. AI moderation fails at cultural nuance, what reads as aggressive in one context is standard professional communication in another. It produces false positives that can alienate legitimate community members. It's bad at detecting sophisticated misinformation that sounds authoritative. And it has essentially no ability to handle context-dependent judgment calls.
The right framing for AI content moderation is that it reduces operational load on human reviewers by filtering high-confidence cases, not that it replaces human judgment. The edge cases, the context-dependent calls, and anything with potential legal or brand implications still need eyes on them.
First-party data, consent, and AI governance
Third-party cookies are largely gone at this point, and the infrastructure built around them is being rebuilt around first-party data. That shift creates both an opportunity and a compliance obligation.
First-party data strategies mean collecting richer behavioral, engagement, and intent data directly from your own properties. That data then feeds AI models for scoring, personalization, attribution, and targeting. The compliance question is whether the data was collected with appropriate consent, whether it's being used in ways users understood when they gave consent, and whether the AI systems processing it are operating within the scope of that consent.
Compliant AI enrichment looks like: transparent data sourcing with documented provenance, consent-aware systems that respect user preferences, audit trails that show what data was used in which decisions, and data retention policies that are actually enforced rather than just written down.
For ABM specifically, intent data governance is a live issue. Many intent data providers aggregate behavioral signals from networks of third-party sites. The consent basis for that aggregation varies enormously by provider. Knowing what you're buying, how it was collected, and what your obligations are as a downstream user is increasingly part of responsible GTM operations.
Visitor identification platforms, which identify anonymous web visitors based on firmographic and reverse-IP data, operate in a consent gray zone that's getting more scrutiny under the EU AI Act and evolving GDPR enforcement. If you're using these tools, understanding their data sourcing and being able to answer questions about it is table stakes for enterprise compliance conversations.
How AI compliance changes ABM and attribution
ABM and attribution are where AI compliance gets most consequential for B2B revenue teams, because these are the systems informing actual investment and prioritization decisions.
Multi-touch attribution models are AI-powered in most enterprise platforms now. They're assigning fractional credit across touchpoints, weighting channels, and producing the numbers that justify budget decisions. If those models are opaque, if you can't audit the logic, challenge the assumptions, or trace why a particular campaign got credit, then your budget decisions are built on an unverifiable foundation.
The same applies to account scoring. Dynamic AI-powered scoring models that update in real time based on intent signals, engagement, and firmographic fit are vastly more sophisticated than rule-based scoring. They're also vastly more opaque. When a model deprioritizes an account without being able to explain why, or when scoring logic shifts after a model update without anyone noticing, you lose the ability to trust the output or improve it.
Potential compliance risks in AI-powered ABM:
- Opaque scoring that can't be audited or challenged
- Attribution logic that can't be traced back to its inputs
- Automated audience creation that may inadvertently discriminate
- Personalization that uses data beyond the scope of original consent
- Pipeline forecasting that presents AI confidence as certainty
A compliant AI attribution framework has four properties: explainable signals (you can see what data inputs influenced each attribution decision), human oversight (someone can review and challenge the model's logic), configurable models (you can adjust weighting based on strategic priorities), and auditability (there's a record of decisions that can be reviewed after the fact).
AI marketing compliance software comparison
The vendor landscape here is genuinely fragmented, so thinking in categories is more useful than chasing specific tools.
When evaluating any AI marketing platform for compliance, the questions that actually matter are:
- Where does the training data come from, and is its sourcing documented?
- Can outputs and decisions be audited at the individual level?
- How is customer data retained and who has access to it?
- Is model behavior explainable to non-technical stakeholders?
- What happens when the model produces an error or a biased output?
- Is there a documented process for handling compliance concerns or regulatory requests?
Enterprise security certifications (SOC 2, ISO 27001, etc.) are table stakes now. The differentiating governance questions are the ones above.
Building an internal AI marketing policy
If your organization doesn't have an AI marketing policy, you have a policy by default. It's just unwritten, inconsistent, and ownedby no one.
A workable AI marketing policy doesn't need to be a legal document. It needs to be clear enough that someone new to the team can read it and know what's allowed. A practical structure:
- Approved tools: A list of AI tools that have been reviewed and approved for marketing use, with notes on what they're approved for and what data can be used with them.
- Restricted data types: An explicit list of data that cannot be entered into AI tools without special approval (e.g., customer PII, unpublished financial data, confidential contract details, health information).
- Human review requirements: Clear guidelines for which AI outputs require review before use. At minimum: all customer-facing content with factual claims, any AI-generated materials used in sales conversations, and any AI outputs that influence budget or pipeline decisions.
- Disclosure rules: When and how to disclose AI involvement in content creation, personalization, or recommendations.
- Vendor evaluation criteria: Questions to ask AI marketing vendors during procurement, and minimum standards for data governance, explainability, and security.
- Escalation workflows: What to do when AI produces something wrong, harmful, or ethically questionable, including who to notify and when to involve legal.
Questions every marketing leader should be asking their AI vendors right now:
- How do you handle data entered into your platform and what are your retention policies?
- Can you provide documentation of your training data sources?
- If a model update changes output behavior, how are customers notified?
- What audit capabilities exist for decisions made by your AI systems?
- How do you handle regulatory requests related to AI-processed personal data?
What does the future of ethical AI in marketing look like?
By 2026 and beyond, the trajectory is toward more AI capability and more regulatory constraint arriving simultaneously. AI agents handling campaign management, real-time budget optimization, personalized content generation at individual scale, autonomous prospecting and outreach, these aren't speculative. They're being deployed now by early-adopter teams and will become standard within a few years.
The counterweight is a buyer population that's grown increasingly skeptical about AI-generated content, regulatory frameworks that are getting more specific and more enforced, and enterprise procurement processes that treat AI governance as a vendor qualification criterion rather than a nice-to-have.
The teams that will navigate this best aren't the ones betting on AI replacing human judgment. They're the ones building what you might call trustworthy AI systems with accountable humans, where AI handles pattern recognition, scale, and optimization, while humans provide context, judgment, ethical oversight, and accountability for outcomes.
The most interesting development to watch is how transparency becomes a differentiation strategy. In a world where most marketing is AI-assisted, the teams willing to be clear about how their AI works, what data it uses, and what its limitations are will earn a trust premium that pure automation can't replicate.
Compliance is becoming a competitive advantage, here’s how…
The B2B marketing teams that will win aren't necessarily the ones who automated the most. They're the ones whose AI systems are explainable, whose data practices can survive a procurement questionnaire, whose attribution is defensible in a revenue review, and whose personalization feels helpful rather than unsettling.
Compliance started as a cost center framing. It's becoming a trust framing. And in enterprise B2B, trust is the thing that shortens sales cycles, survives competitive evaluations, protects consumer confidence, and builds the kind of customer relationships that don't dissolve the moment a competitor offers a 10% discount.
Platforms like Factors.ai are positioned in this shift specifically because explainable account intelligence, transparent attribution, and first-party data governance aren't just compliance features. They're what revenue teams actually need to make defensible decisions at scale. The governed AI workflow isn't the cautious one. It's the one that can be trusted when the stakes get real.
FAQs for AI marketing compliance
Q1. What is AI marketing compliance?
AI marketing compliance refers to the policies, regulations, ethical standards, and governance practices that ensure AI is used responsibly in marketing workflows. It covers everything from content review processes to how AI-powered targeting systems handle personal data.
Q2. Why is AI ethics important in marketing?
AI systems in marketing can introduce risks like biased targeting, hallucinated content, consent violations, and opaque decision-making. Those risks affect both the people being marketed to and the organizations doing the marketing, through reputational, legal, and operational exposure.
Q3. What is AI decisioning in marketing?
AI decisioning refers to AI systems automatically making or influencing marketing decisions such as audience targeting, lead scoring, budget allocation, and content personalization, rather than just assisting humans who make those decisions themselves.
Q4. What are the biggest ethical concerns in AI marketing?
The main ones in practice are biased targeting models, hallucinated claims in AI-generated content, consent violations in data enrichment and tracking, manipulative personalization, opaque attribution logic, and lack of explainability in AI scoring systems.
Q5. Are there regulations governing AI marketing?
Yes. The EU AI Act, GDPR (especially Article 22 on automated decision-making), and FTC guidance on AI-generated content all apply to B2B marketing workflows; where email marketing is involved, key rules also include privacy requirements such as CAN-SPAM. US state-level AI legislation is also expanding. The regulatory landscape is converging, not stabilizing.
Q6. How can B2B companies use AI responsibly in marketing?
By building human review workflows into AI-generated content, documenting AI usage policies, implementing consent management for AI enrichment and targeting, evaluating vendors on governance and explainability, and auditing AI outputs on a regular basis.
Q7. What is responsible AI marketing?
Responsible AI marketing means using AI in ways that are ethical, transparent, explainable, privacy-conscious, and accountable. It specifically means having governance structures in place so that when AI produces a bad output, there's a person responsible for catching it and a process for addressing it.
Q8. How does AI compliance affect ABM platforms?
AI compliance affects how ABM platforms handle account targeting, data enrichment, lead and account scoring, attribution logic, personalization, and customer data governance. Explainability, configurable models, and audit trails are becoming baseline requirements for enterprise ABM platform evaluation.

A B2B CMO’s Guide to the 10 Best 6sense Alternatives
Looking for a 6sense alternative? Compare Factors.ai, Demandbase, UserGems, AdRoll, ZoomInfo, Bombora, Cognism, Apollo, Warmly, and more.

Quick Summary:
- Factors.ai is my top recommendation for teams that want most of 6sense’s core capabilities at a lower cost. Based on competitive proposals Factors.ai has reviewed, it often costs around 30% of a comparable 6sense setup.
- Demandbase is the closest traditional enterprise alternative. It is particularly strong in buying-group intelligence and B2B advertising, but may not be significantly cheaper or easier to manage.
- UserGems is better suited to teams that want transparent account and contact prioritization tied closely to sales workflows.
- AdRoll ABM and Madison Logic are stronger options when paid media and content syndication are the main requirements.
- ZoomInfo, Bombora, Cognism, Apollo, and Warmly can replace specific parts of 6sense, such as company data, third-party intent, prospecting, or website follow-up. They are less suitable when you need a complete ABM platform.
6sense is one of the most capable ABM platforms available. It helps marketing and sales teams identify anonymous buying activity, predict which accounts are moving toward a purchase, run account-based campaigns, and turn intent into sales action.
Making all of those capabilities work together, however, takes considerable effort. 6sense needs clean CRM and marketing automation data, carefully configured signals and workflows, and consistent adoption across marketing and sales.
From the conversations our team has had with companies evaluating or leaving 6sense, I’ve seen the alternatives conversation come up most often when one of those pieces breaks down. Sales may not trust the scoring, teams may be using only a fraction of the platform, or the cost becomes difficult to justify.
This guide looks at the 6sense alternatives I’d consider depending on which part of 6sense you actually need to replace.
Why trust this comparison
I’m Praveen, the Co-founder and CMO at Factors.ai. Our platform is obviously included in this list, so I’m not going to pretend this is a completely neutral comparison. I think Factors.ai is the better choice for certain use cases, but there are also cases where I’d choose Demandbase, UserGems, ZoomInfo, or another tool on this list instead.
To build the comparison, we looked at current vendor documentation, pricing data, customer reviews, public discussions, and anonymized conversations between our sales team and companies evaluating or leaving 6sense.
Factors helps more than 1,000 GTM teams run their ABM programs. Here is what a few of them have to say:
“Factors is core to our stack. We use it for ads, full-funnel engagement, and giving sales clear visibility into who’s engaging and why.” Shane Poyar, Growth Marketing and Ops at Descope. Read the success story.
“With Factors.ai, we influenced 15% of enterprise pipeline via LinkedIn and saved $205K in ad spend.” Arun Pattabhiraman, Chief Marketing Officer at Sprinklr. Read the success story.
Why do companies look for 6sense alternatives?
The search for a 6sense alternative usually begins when teams cannot explain its predictive scores, sales stops using the output, or the cost becomes difficult to defend. Here is how each issue shows up in practice.
1. Predictive scoring can feel like a black box
Predictive scoring is one of the main reasons teams question 6sense. Accounts are placed into stages from Awareness to Purchase, but users cannot see exactly how much each signal influenced the result. Marketing must defend the recommendation, while sales is expected to trust it.
Adam Schoenfeld shared the experience of a $100M+ ARR company that left 6sense despite still believing in ABM and intent data. Marketing and sales had lost trust in the predictive outputs, while changes to the model reportedly took months.
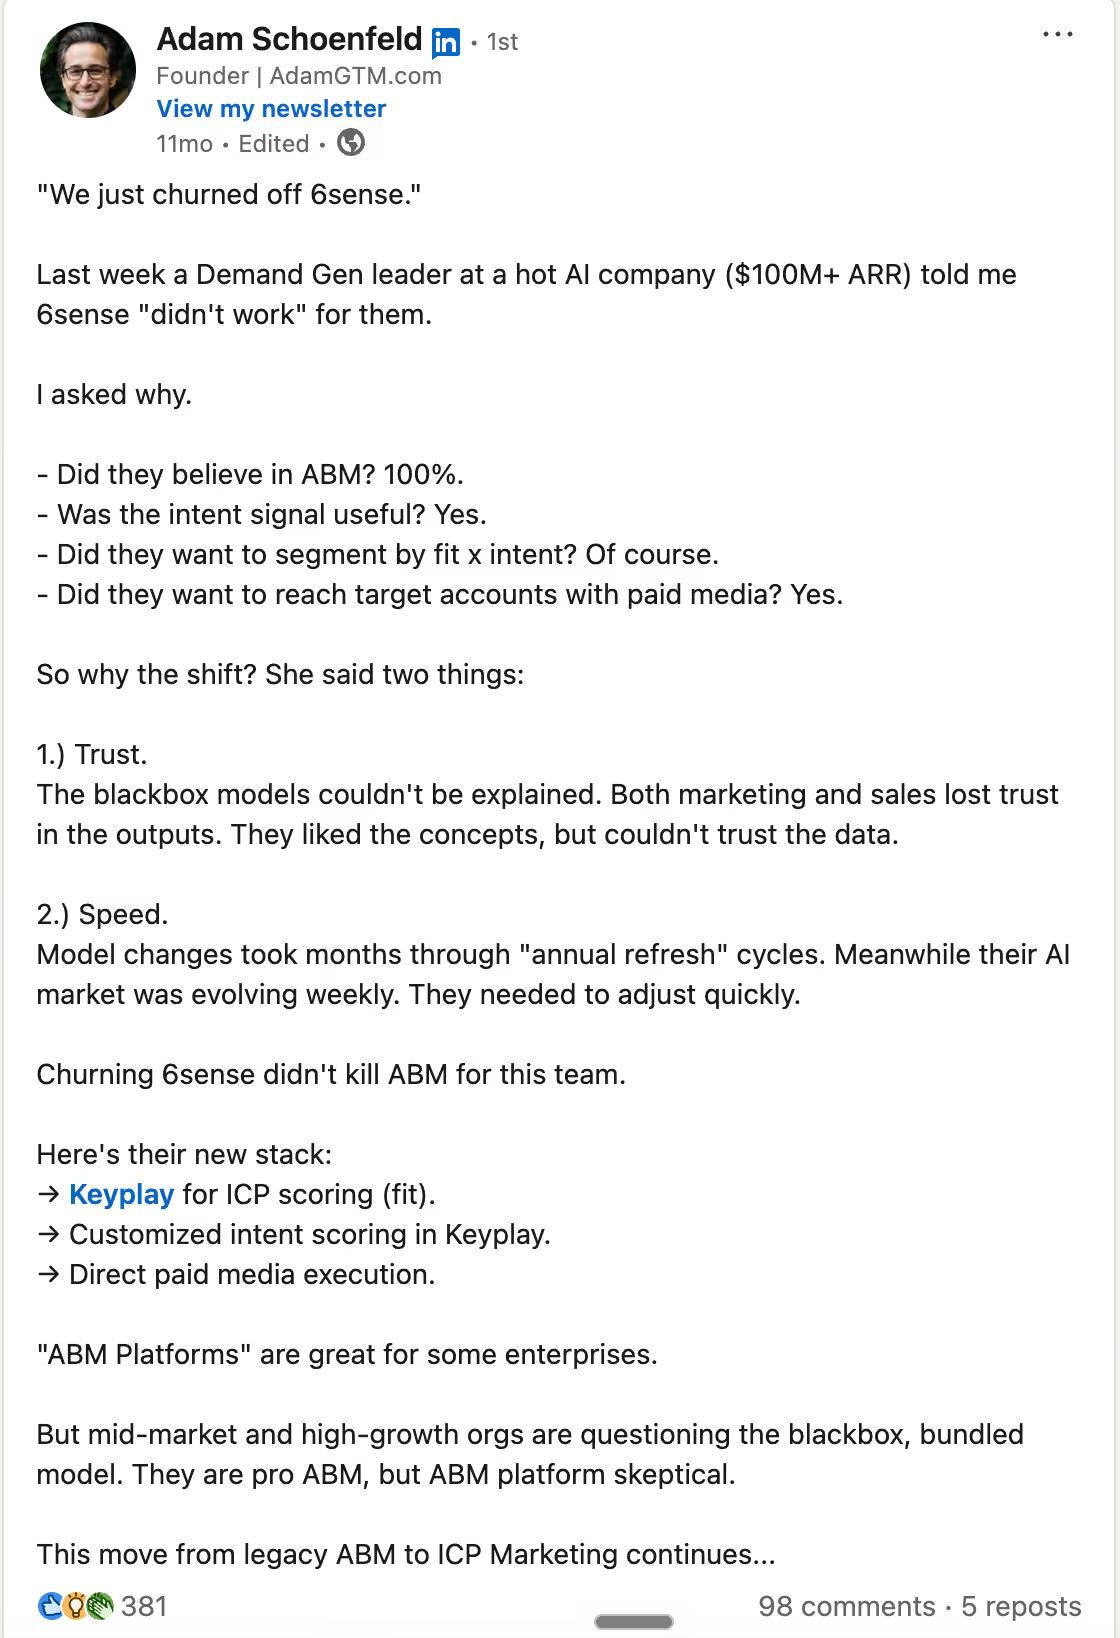
A similar problem appeared in a Reddit discussion where a sales team stopped using 6sense after an unsubscribe visit triggered a hot-account alert.
6sense’s Model Insights documentation confirms that users cannot see the explicit ranking or importance assigned to each signal.
3. Cost becomes harder to justify when usage is limited
6sense does not publish standard pricing for its Revenue Marketing platform. Vendr reports a median annual contract value of $63,199, based on 383 purchases. The price becomes difficult to defend when sales adoption is weak or teams use only part of the platform.
Several public discussions on 6sense highlight how its cost can become a bottleneck:
- A company describing a three-month pilot found the predictions useful but was quoted around $80,000 per year for eight users. Its SDRs struggled with the interface, and the contact data did not meet expectations.
- Another firm was considering a two-year renewal at $120,000. The Americas team valued 6sense, while adoption remained low in EMEA and APAC. Regional account matching was also a concern.
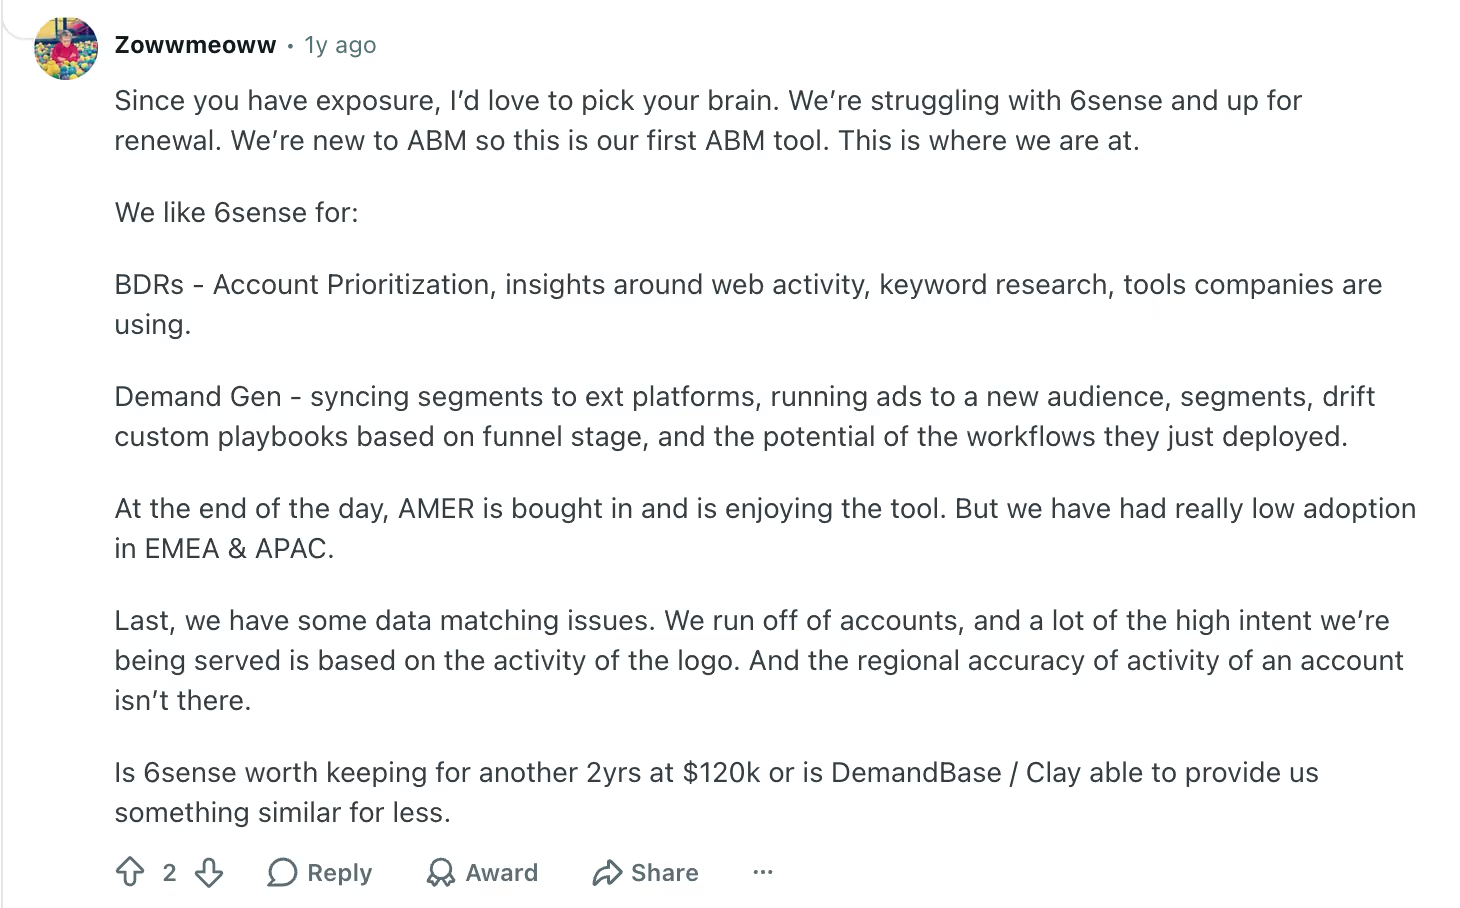
Sales adoption depends on how the insight reaches the rep
A buying stage can tell sales which account to prioritize. It does not always explain who to contact, what changed, or how to approach the account.
Based on work across hundreds of 6sense environments, Dom Colasante of 2X found that adoption suffered when keywords were too generic or the underlying signal details never reached sales. Sellers were more likely to trust the output when they helped define the signals and could see why an account had been prioritized.
Implementation requires ongoing ownership
G2 reports an average implementation time of three months for 6sense Revenue Marketing. Connecting CRM data, marketing automation, website activity, external intent, advertising, and sales workflows takes time.

The work continues after launch. Data mappings, keywords, segments, workflows, model performance, and sales enablement all need an internal owner. Without dedicated RevOps or marketing operations support, companies may struggle to use enough of the platform to justify the investment.
6sense Alternatives at a Glance
The 10 best 6sense alternatives and competitors
1. Factors.ai
Factors.ai covers much of the same operating ground as 6sense. Marketing teams can identify website visitors, bring first- and third-party intent into the account journey, prioritize accounts, activate audiences, alert sales, and measure the impact on pipeline.
Scout extends this workflow beyond dashboards and alerts. Its AI agents can use CRM records, website activity, people data, and account segments to research active companies, explain why the activity matters, and trigger the next step. Factors.ai currently supports 13 agent tools, including account research, journey summaries, contact discovery, CRM lookups, and agent chaining.
Factors.ai is also an official LinkedIn Marketing Partner and Microsoft Marketing Partner.
How much does Factors.ai cost?
Factors.ai has four main pricing plans. Lite starts at $199 per month, Basic at $6,000 per year, Growth at $20,000 per year, and Enterprise at $30,000 per year.
Key features of Factors.ai
- Company identification, with person-level identification available as an add-on
- First-, second-, and third-party intent signals
- Configurable account scoring and engagement tracking
- Account journeys and multi-touch attribution
- Audience activation across LinkedIn, Google, Bing, Microsoft, and Meta
- AdPilot controls for LinkedIn and Google
- Scout AI agents for research, alerts, and workflows
How does Factors.ai compare to 6sense?
The biggest difference is control over account scoring. Factors.ai lets marketing teams decide which signals matter, assign weights, account for recency, and inspect the activity behind a score. 6sense gives teams visibility into the signals feeding its models, but the underlying mathematical weighting remains proprietary.
Factors.ai also gives teams more flexibility in how they use AI. Its MCP makes your GTM data, saved reports, and agents available to MCP-compatible AI clients, where they can also be used alongside other connected tools. 6sense has introduced its own MCP, but the current release supports read-only retrieval.
Cost is another major advantage. Factors.ai’s Growth plan is priced at $20,000 per year and includes most of the capabilities a typical 6sense customer would use. Vendr reports a median 6sense purchase of $63,199 per year. Factors.ai can cover much of the same day-to-day ABM motion at roughly one-third of that benchmark.
To know more about 6sense and its cost, read our blog on 6sense pricing and costs in 2026
2. Demandbase
Demandbase is the closest like-for-like alternative to 6sense. Both platforms cover account intelligence, intent, predictive scoring, advertising, sales workflows, journey analytics, and measurement.
One area where Demandbase goes deeper is buying-group intelligence. It can use historical CRM and opportunity data to identify the roles typically involved in a deal, show which people from those roles are already engaged, and flag the ones that are still missing.
Marketing teams can use the same buying-group data for advertising. Demandbase’s native B2B DSP supports both account-level and person-level targeting, which means you can put more spend behind specific people inside an account instead of treating the whole company as one audience.
How much does Demandbase cost?
Demandbase does not publish standard pricing. Pricing depends on the products you choose, the number of users, data requirements, media spend, and services.
Key features of Demandbase
- Account intelligence and proprietary intent data
- AI-assisted buying-group creation and persona mapping
- Buying-group completeness and stakeholder-gap analysis
- Predictive account prioritization
- Native B2B demand-side platform
- Account- and person-based advertising
- Journey analytics and pipeline measurement
How does Demandbase compare to 6sense?
If buying-group intelligence is one of the main reasons you’re looking beyond 6sense, Demandbase is probably the first platform I’d evaluate.
You can see whether a likely decision-maker, champion, or technical evaluator has engaged, identify which roles are missing, and use that information to guide both advertising and sales follow-up.
There is a catch. Demandbase’s automated Buying Group Setup Agent requires at least 100 contacts tied to opportunities from the previous 12 months. If your CRM data is thin or inconsistent, you may need more manual setup before this becomes useful.
Demandbase is also unlikely to solve the cost or operational complexity that may have pushed you away from 6sense in the first place. Vendr reports a median annual purchase of $68,591, and both platforms need clean data and someone internally to manage them.
3. UserGems
UserGems helps sales teams decide which accounts and contacts are worth prioritizing. It uses CRM data, job changes, website activity, intent, and other signals to score both companies and individual people.
How much does UserGems cost?
UserGems starts at $40,000 per year for its Core plan. The Advanced plan is priced at $75,000 per year, while the Elite plan costs $150,000 per year.
Implementation is charged separately, and some intent and ABM capabilities are sold as add-ons on lower plans.
Key features of UserGems
- Account and contact scoring
- More than 600 fit criteria and signals
- Visible and editable scoring logic
- Job-change and former-champion tracking
- Contact-level intent
- Signal-specific emails and sequence enrollment
- Dynamic audience sync across LinkedIn, Meta, and Google
How does UserGems compare to 6sense?
UserGems puts more emphasis on contact-level prioritization and sales execution. It can identify a specific person worth contacting, show the signals that contributed to their score, and help sales act on that information.
The scoring logic is also visible and editable. Marketing and sales can see which signals are being used and change how much they matter instead of relying entirely on a predictive model.
Job-change tracking is another useful difference. If a former customer or champion moves to a new company, UserGems can flag the move and give sales a clear reason to reach out.
The trade-off is scope. UserGems does not replace 6sense across programmatic advertising, attribution, and broader account-journey analytics. It makes more sense when prioritization and sales follow-up are the parts of 6sense you care about most.
4. AdRoll ABM
AdRoll ABM, formerly RollWorks, is very strong on media execution. Its first-party DSP reaches target accounts across display, social, mobile, and connected TV, while buyer-intelligence products help marketers decide which accounts deserve more spend.
The platform is not limited to retargeting. Journey Prediction uses fit, intent, and engagement to estimate where an account sits in its buying process. Command Center recommends next steps, and ABM Workflows can coordinate actions across the CRM, Outreach, Salesloft, and Slack.
A marketer can move from an account signal to a campaign or seller task without exporting the list through several systems.
How much does AdRoll ABM cost?
AdRoll does not publish fixed pricing for its broader ABM packages.
Its Account-Based Retargeting option does not have a platform fee, with customers paying for media instead. Larger ABM packages require a custom quote based on the program and level of support.
Key features of AdRoll ABM
- First-party DSP across display, social, mobile, and CTV
- Journey Prediction using fit, intent, and engagement
- Account scoring and recommended actions
- Dynamic audience creation
- Cross-channel ABM Workflows
- CRM integration and account measurement
How does AdRoll ABM compare to 6sense?
AdRoll is worth considering if paid media is the main reason you are using 6sense.
You can identify the accounts you want to reach, build audiences, run ads across several channels, and use engagement data to decide where to put more spend. You are not paying for the same breadth of sales intelligence, predictive modeling, and revenue analytics that comes with 6sense.
The narrower scope is also the trade-off. AdRoll does not replace 6sense across contact data, sales intelligence, attribution, or broader account-journey analysis. If you use those parts of 6sense heavily, you will still need other tools alongside it.
Recommended Read: Factors.ai vs AdRoll
5. Madison Logic
Madison Logic belongs on the shortlist for B2B marketers investing heavily in media. Its channel mix extends from content syndication and display to LinkedIn, connected TV, and digital audio. Few alternatives in this list offer the same combination as a native part of the service.
Its Pipeline Insights reporting connects campaign activity back to opportunities. Using this, marketers can review account and buying-group engagement, see whether opportunities progressed or stalled, and examine how content, programmatic, and social activity contributed while the campaign was live.
How much does Madison Logic cost?
Madison Logic does not publish standard pricing. The final cost depends on the channels you use, campaign scope, target-account volume, and media spend.
Key features of Madison Logic
- Proprietary intent data
- Content syndication
- Programmatic display
- LinkedIn advertising
- Connected TV and digital audio
- Buying-group targeting
- Stage-by-stage pipeline measurement
How does Madison Logic compare to 6sense?
Madison Logic stands out if content syndication is an important part of your ABM strategy. You can run content syndication alongside display, LinkedIn, CTV, and audio, then measure how those campaigns are engaging target accounts and influencing opportunities.
It also offers managed support for campaign strategy and execution. This can be useful for a smaller marketing team that wants help running programs rather than taking on all of the day-to-day campaign management internally.
Lead quality, reporting detail, and channel performance should still be validated with the company’s own account list during evaluation.
6. ZoomInfo
ZoomInfo is primarily a sales intelligence and data platform. The company reports more than 500 million professional contacts and 100 million companies, along with 200 million verified business email addresses and 120 million direct-dial numbers.
This gives reps a large base for prospecting, enrichment, and finding additional stakeholders inside a target account.
ZoomInfo’s GTM Context Graph links this database with CRM records, sales conversations, marketing engagement, product activity, and buyer behavior. GTM Workspace can use the resulting context to prioritize accounts, recommend contacts, and help prepare outreach.
ZoomInfo pricing
ZoomInfo does not publish standard pricing for its paid plans. Vendr currently reports a median annual purchase of $33,500, based on 1,571 purchases. Its observed deals range from roughly $7,200 to $156,000 per year, which show how much pricing can vary depending on seats, products, data credits, and contract scope.
Recommended read: ZoomInfo Pricing Breakdown
Key features of ZoomInfo Pricing
- 500M+ professional contacts, including 200M+ verified emails and 120M+ direct dials
- 100M+ company records
- Organizational charts and stakeholder data
- Intent, company-event, and behavioral signals
- Company and eligible US person-level visitor identification
- CRM enrichment, segmentation, and routing
- Seller prospecting and outreach preparation
How does ZoomInfo compare to 6sense?
ZoomInfo is worth considering when the bigger problem is finding and reaching the right people, rather than deciding which accounts are in-market.
6sense may tell a seller that an account is showing intent, but the signal is only useful if the CRM has the right contacts and reliable ways to reach them. ZoomInfo gives sales the underlying company and contact data to find additional stakeholders, fill gaps in existing records, and prospect directly into the account.
There is still a meaningful difference in scope. 6sense goes further into predictive buying stages, account-based advertising, and journey measurement. ZoomInfo makes more sense when sales intelligence, enrichment, and prospecting are the parts of your stack that need the most improvement.
7. Bombora
Bombora is best known for Company Surge, one of the more established sources of third-party B2B intent data. It compares an account’s recent research activity with its usual behavior. A sudden increase in interest carries more weight than a company that regularly reads about the same topic.
Bombora currently tracks more than 21,600 intent topics. The data can be sent to your CRM, sales tools, advertising platforms, and other ABM products. Bombora also offers Visitor Insights for website traffic and Digital Audiences for building targetable audiences.
Factors.ai has partnered with Bombora to provide you with 20 high-intent accounts every month.
How much does Bombora cost?
Bombora does not publish standard pricing for Company Surge. Pricing depends on the number of intent topics, accounts, integrations, audience products, and how the data needs to be delivered.
Key features of Bombora
- Company Surge intent data
- Account-specific research baselines
- More than 21,600 intent topics
- Account- and buying-group-based Digital Audiences
- Activation through major DSPs and paid platforms
- B2beacon campaign measurement
How does Bombora compare with 6sense?
I’d only shortlist Bombora as a 6sense alternative if third-party intent is the part you actually want to keep.
Bombora is not a like-for-like replacement. In fact, Company Surge is already available inside 6sense and can be used alongside its predictive models, segmentation, and sales intelligence.
Buying Bombora directly lets you use that intent data with the CRM, advertising platforms, and sales tools you already have instead of paying for a much larger ABM platform.
8. Cognism
Cognism is a sales-intelligence product for teams that place a premium on phone data and European coverage. Its Diamond Data mobile numbers are checked by human researchers, and the company screens phone data against Do-Not-Call lists in 15 countries.
Along with company and contact data, the platform includes firmographic and technographic filters, hiring and funding events, job changes, and Bombora intent on its Pro plan.
How much does Cognism cost?
Cognism's current pricing page uses quote-based pricing, with Standard and Pro packages that each include five seats. Cognism's 2026 published content lists Standard from $12,750 per year and Pro from $17,000 per year.
Key features of Cognism
- Phone-verified Diamond Data
- Company and contact intelligence with firmographic and technographic filters
- Do-Not-Call screening in 15 countries
- UK and European data coverage
- Hiring, funding, M&A, and job-change signals
- Bombora intent on higher plans
How does Cognism compare to 6sense?
6sense helps teams decide which accounts may be moving toward a purchase. Cognism addresses the next practical problem by finding the people inside those accounts and giving sales a reliable way to reach them.
Cognism can be more useful when the target-account list already exists, but sellers are working with incomplete records, inaccurate phone numbers, or weak European coverage. Better contact data gives reps something they can use immediately.
The trade-off is that it does not replace 6sense across account-based advertising, attribution, or account-journey analytics. You would need to keep those capabilities elsewhere in your stack.
9. Apollo.io
A sales rep can find a contact, fill in missing details, add the person to a sequence, place a call, and track the response without leaving Apollo.io. This connection between prospect data and outbound execution is the main reason Apollo.io belongs in a 6sense comparison piece.
Its Waterfall Enrichment model checks Apollo and connected data sources for missing emails and phone numbers. Contact-level website identification is available for US visitors through the Inbound Add-On.
How much does Apollo.io cost?
Apollo offers a free plan. With annual billing, Basic costs $49 per user each month, Professional costs $79, and Organization costs $119 with a three-user minimum. Credits and feature allowances vary by plan. The Inbound Add-On is priced separately.
Key features of Apollo.io
- Company and contact database
- Waterfall Enrichment
- Buying-intent signals
- Lead and account scoring
- Company-level website visitor identification
- US contact-level identification through the Inbound Add-On
- Email, phone, and multichannel sequences
How does Apollo.io compare with 6sense?
Apollo.io is a very different purchase from 6sense. It gives a smaller sales-led team much of what it needs to find prospects, enrich them, spot intent, and start outreach without requiring separate handoffs between marketing operations and sales.
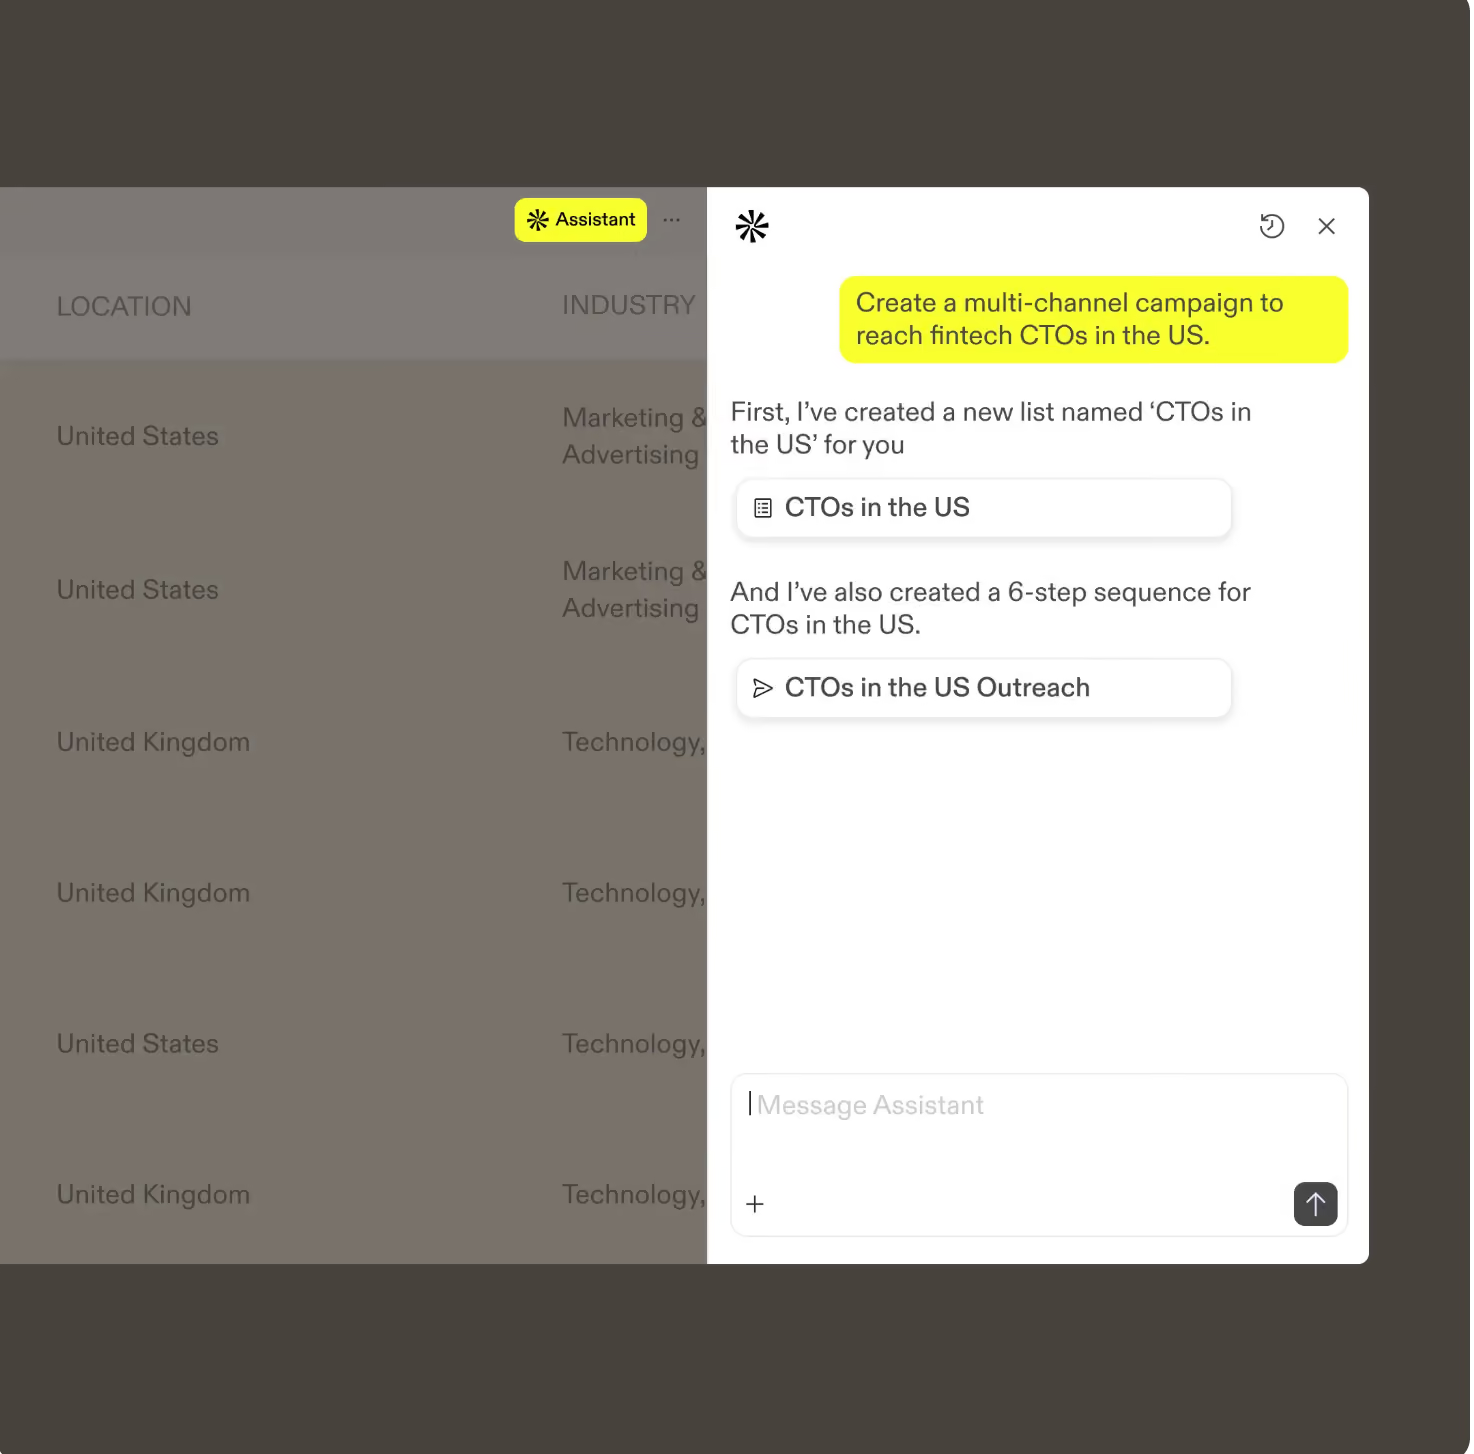
The economics are different too. You can start with a few seats and expand as the team grows rather than committing to an enterprise ABM platform upfront.
Where Apollo falls short is on the marketing side. If you rely heavily on 6sense for native account-based advertising, sophisticated predictive models, or deeper account-journey measurement, Apollo is not a full replacement.
10. Warmly
Warmly takes action on buyer signals automatically. Its TAM Agent handles account scoring, buying-committee identification, enrichment, paid audiences, and outbound, while its Inbound Agent focuses on identifying and engaging people who visit the website.
Both agents use Warmly's Context Graph, which keeps the account's activity and previous interactions available to whichever agent acts next.
How much does Warmly cost?
Warmly's TAM Agent starts at $15,000 per year, while its Inbound Agent starts at $30,000 per year. The Full GTM plan, which combines both agents with the Context Graph and additional platform capabilities, uses custom pricing.
Key features of Warmly
- Company and person-level website identification
- Transparent intent scoring
- First- and third-party buying signals
- Buying-committee identification
- Multi-provider contact enrichment
- TAM Agent and Inbound Agent working from a shared Context Graph
- LinkedIn, Meta, and outbound activation
How does Warmly compare with 6sense?
Warmly gives teams more direct control over account scoring. Unlike 6sense, where the predictive model’s internal weighting remains proprietary, Warmly lets teams see which signals are affecting an account’s score and adjust the logic themselves.
The same difference carries into execution. Instead of surfacing an account for someone to investigate, Warmly’s agents can use that account context to route a website visitor, add relevant contacts to a paid audience, or start an outbound workflow.
6sense still goes deeper in areas such as native programmatic advertising and enterprise predictive analytics.
How to choose the right 6sense alternative
If I were evaluating these tools today, this is the shortlist I’d start with:
1. Use price to eliminate options early
The pricing differences are large enough that you should use budget as an early filter, not something you discuss after the demo.
For context, Vendr reports a median 6sense purchase of about $63,000 per year. Demandbase sits in a similar range, with a reported median purchase of roughly $69,000. UserGems starts at $40,000 per year.
At the other end, Factors Growth starts at $20,000 per year, Warmly’s TAM Agent at $15,000, and Apollo starts at $49 per user per month on annual billing. ZoomInfo does not publish list prices, but Vendr reports a median annual purchase of roughly $33,500.
These are not like-for-like packages. They are useful because they tell you which vendors are worth spending time evaluating in the first place.
2. Test the shortlist with your own accounts
Once you are down to two or three tools, stop evaluating them through vendor demos. I’d put more weight on this test than on almost anything you see in a polished product walkthrough.
Give each vendor the same sample of accounts. Include some open opportunities, a few accounts your sales team already considers high intent, and a few that you know are poor fits. Then look at what comes back.
Check whether the platform identifies the right companies and contacts, why it prioritizes one account over another, and whether sales can actually use the output without asking RevOps to interpret it first.
If advertising matters, build one real audience and see how many of your target accounts or contacts can actually be reached. If automation matters, ask the vendor to build one workflow you would genuinely use, such as routing a high-intent account to sales or adding the right contacts to a paid audience.
3. Finally, calculate what it will take to run the ABM platform
The software price is only part of the decision.
Ask who will maintain the scoring model, clean the CRM data, update intent topics, build audiences, troubleshoot integrations, and train sales when the output changes.
Also include implementation fees, media spend, data credits, extra seats, and any services you will need.
A $30,000 platform that needs a dedicated operator can easily cost more than a $50,000 platform your existing team can manage.
The best 6sense alternative is not the product with the longest feature list. It is the one that replaces the parts of 6sense your team actually uses, fixes the reason you are considering leaving, and can still be run effortlessly six months after implementation.
Frequently asked questions about 6sense alternatives
1. What is the best 6sense alternative?
Factors.ai is the best fit if you want broad ABM capabilities with more control over account scoring and a lower starting price. Demandbase is the closest enterprise alternative, while tools like UserGems, ZoomInfo, and Madison Logic make more sense for narrower requirements.
2. Is Demandbase better than 6sense?
Demandbase can be better if buying-group intelligence and B2B advertising are major priorities. 6sense may be the better fit if you prefer its predictive buying stages and broader Revenue AI platform. Neither is the obvious choice if lower cost or simpler implementation is the goal.
3. How much does 6sense cost?
6sense does not publish standard pricing. Vendr reports a median annual purchase of $63,199, although actual contracts vary based on products, users, data, advertising, and services.
4. What is the difference between Factors.ai and 6sense?
Factors.ai gives teams more control over scoring, a more flexible MCP for working with data and agents, and delivers much of the same ABM capability at roughly 30% of the cost of 6sense.
5. Are there cheaper alternatives to 6sense?
Yes. Factors.ai’s Growth plan is priced at $20,000 per year, Warmly’s TAM Agent starts at $15,000, and Apollo.io is $49 per user per month on annual billing. These products do not replace exactly the same parts of 6sense, so compare them based on the capabilities you actually use.
6. How do you replace 6sense?
Start by identifying which parts of 6sense your team actually relies on, such as scoring, intent, advertising, contact data, or sales workflows. Then shortlist tools around those requirements instead of looking for another platform with the same feature count. Test the final two or three options using your own accounts and workflows before switching.
Factors.ai vs 6Sense: Which ABM platform actually moves pipeline?
Factors.ai is a 6Sense alternative. Factors.ai is a multi-channel ABM demand generation platform with rapid 2-week onboarding. 6Sense is an enterprise predictive intelligence layer for display ads. Compare ABM features, pricing, analytics, CRM integration, and support.
TL;DR
- 6Sense acts as an enterprise predictive intelligence layer optimized for programmatic display ads. Factors.ai is an agile, multi-channel ABM, demand generation, and attribution platform built for LinkedIn, Google Ads, and sales activation.
- Factors.ai goes live in under 2 weeks with a hands-on, white-glove onboarding team. 6Sense implementations frequently drag on for up to 6 months, burning two quarters of pipeline runway.
- Factors.ai offers person-level identification for US traffic (via RB2B) and custom multi-touch attribution. 6Sense focuses heavily on account-level data and rigid, pre-built reporting dashboards.
- Factors.ai features transparent, tiered pricing (including a free tier). 6Sense relies on opaque, multi-year negotiated contracts that typically start at $60,000 or more annually.
Factors.ai vs 6Sense: Quick glance table
A lot of B2B marketing meetings follow a familiar script.
The CMO wants to know what's driving pipeline. Sales says marketing's leads are cold. Marketing says sales never follows up. Someone says, "Maybe we should look at 6sense."

Six months later, half of Q1 disappeared into implementation, the dashboards look gorgeous, and everyone is still asking:
"Did any of this actually move pipeline?"
This isn't a shot at 6sense. Plenty of teams get value from it. But the gap between buying the platform and seeing results can be bigger than expected.
Factors.ai and 6sense are trying to solve the same problem: identify in-market accounts, activate them across channels, and measure what actually works.
Where they differ is in how they do it, who they're built for, and what your first ninety days look like.
This Factors.ai vs 6sense comparison should help you make that call.
Factors.ai vs 6Sense: Functionality and features
If you had to compress the difference into one sentence: 6Sense is built for enterprise display ABM at scale. Factors.ai is built for multi-channel ABM that actually connects to revenue.
Both identify accounts. Both use intent signals. Both integrate with CRMs. But the execution philosophy is different enough that they're genuinely not solving the same problem for the same buyer.
Factors.ai vs 6Sense: Comparison Table
That implementation gap deserves a moment of attention. Six months is a long time in a GTM cycle. That's an entire half-year of runway before the platform is even running. For mid-market teams where agility matters, that timeline is a deal-breaker before a single feature gets compared.
Factors.ai's functionality and features
Factors.ai is built on one principle: every signal your buyers generate should feed directly back into your campaigns and your sales team's workflow. Nothing sits in a dashboard waiting to be acted on manually.
- Account identification and visitor intelligence
Factors.ai identifies up to 75% of anonymous website visitors using a layered waterfall model that pulls from multiple data providers simultaneously. This isn't about showing you the same accounts you'd get from any single source.
On top of company-level identification, Factors now deanonymizes US-based B2B visitors at the person level through RB2B. For every identified visitor, you get first and last name, job title, LinkedIn URL, work email, company name, industry, employee count, and revenue range. SDRs get a Slack alert the moment a target-account decision-maker hits the site, with their LinkedIn URL and work email already in the payload. Marketing can build ICP-fit segments by title or firmographic and activate them directly via ads or sequences. CS can see who at a customer account is visiting churn-risk pages. RevOps can slice attribution reports by enriched person-level attributes instead of anonymous account traffic.
- Intent signals across every channel
Factors.ai captures intent from a genuinely wide range of sources: website behavior, CRM engagement, product usage, G2 intent, paid channel activity across LinkedIn, Google, Meta, and Bing, plus third-party intent from Bombora. These signals are scored at the account level by AI, taking into account ICP fit, funnel stage, and engagement intensity.
The result is a prioritized account list that updates in real time. No manually refreshed spreadsheets. No waiting for a weekly report.
- LinkedIn AdPilot: where intent meets activation
As an official LinkedIn Marketing Partner, Factors.ai's LinkedIn AdPilot automatically syncs high-intent audiences to LinkedIn campaigns based on live buying signals. Audiences update daily, so the accounts your ads reach tomorrow reflect what happened on your website and in your CRM today.
LinkedIn AdPilot’s Smartreach also controls impression frequency at the account level, which prevents your budget from burning on over-served accounts that aren't progressing. The CAPI (Conversions API) integration feeds enriched conversion events back to LinkedIn, so LinkedIn's algorithm optimizes toward accounts that actually convert rather than accounts that just click.
Organic engagement tracking is included, so you see which companies engage with your LinkedIn posts alongside your paid campaigns. Rare in this category, and genuinely useful.
- Google AdPilot
The same logic applies to Google Ads. Customer Match audience sync, Google Enhanced Conversions, and buyer-stage-specific targeting ensure your Google campaigns aren't just running in isolation. They're informed by the same account intelligence powering everything else by Google AdPilot.
- AI Agents for sales intelligence
Factors.ai's AI Agents, called Scout, handle account research, buying group mapping, post-meeting activity tracking, and closed-lost reactivation. When a high-intent account revisits your pricing page or a contact re-engages after a lost deal, the relevant sales rep gets a real-time Slack or Teams alert. The agent doesn't just flag the account. It surfaces the right contacts and provides outreach context so the rep knows why this account matters right now.
- Full-funnel attribution
Custom report builder, drag-and-drop dashboards, multi-touch attribution from first touch to closed won, lift analysis by channel and segment, ACV impact, sales cycle influence, and win rate by campaign. Factors.ai doesn't just show you what accounts are doing. It shows you what that activity is worth.
6Sense's functionality and features
6Sense is a genuine enterprise-grade platform. It pioneered predictive intent scoring in the ABM space and has years of longitudinal data that helps it identify accounts in buying cycles before they raise their hand.
Its core strength is display advertising at scale. The platform runs programmatic display campaigns targeted at intent-based account lists, which is useful for brand awareness at the top of the funnel. It connects to Salesforce and HubSpot, integrates with marketing automation platforms, and provides dashboards that enterprise teams use to report on pipeline influence.
Where 6Sense gets complicated is execution. Its pricing is negotiated through sales, with no public transparency. Its implementation timelines are long. Its Google Ads activation is limited. And its analytics customization is restricted to pre-built dashboards that don't offer the same depth as Factors.ai's custom report builder.
For a large enterprise with a dedicated ABM team, RevOps resources, and six months to get the platform running, 6Sense can be a powerful system. For a growth-stage team that needs results this quarter, the math gets harder.
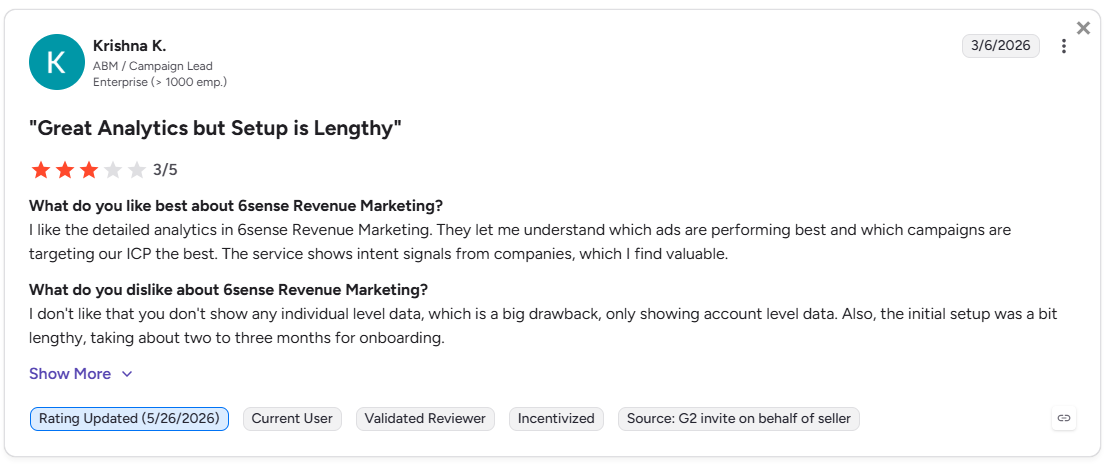
Factors.ai vs 6Sense: Verdict on functionality and features
If your GTM motion runs on LinkedIn and Google Ads, requires tight CRM integration, and needs attribution that connects campaigns directly to revenue, Factors.ai is the stronger platform. If you're running a large-scale enterprise ABM program primarily through display advertising and have the team and timeline to support a long implementation, 6Sense has the depth for that use case.
In short:
Factors.ai = multi-channel ABM activation with LinkedIn, Google, and built-in marketing attribution.
6Sense = enterprise display ABM with strong predictive intelligence and a long runway to value.
Factors.ai vs 6Sense: Pricing comparison
This is where the comparison gets stark, and honestly, where most mid-market teams make their final call.
Factors.ai vs 6Sense: How the pricing models compare
Factors.ai pricing
Factors.ai follows a structured model that grows with your GTM operation. You don't pay for the entire platform before you know if it works.
- Free plan: Identifies up to 200 companies per month. Includes visitor tracking, Slack integration, starter dashboards, and up to 3 seats. It's a real working plan, not a locked demo.
- Basic plan: 3,000 companies per month with up to 5 seats. Adds LinkedIn intent signals, advanced dashboards, GTM workflows, and integrations with Google, LinkedIn, Facebook, Bing, HubSpot, and Salesforce.
- Growth plan (most popular): 8,000 companies per month, up to 10 seats. Unlocks ABM analytics, account scoring, LinkedIn attribution, G2 intent signals, workflow automations, 100 custom reports, and a dedicated CSM.
- Enterprise plan: Unlimited companies, up to 25 seats. Adds predictive account scoring, LinkedIn AdPilot, Google AdPilot, Milestones reporting, white-glove onboarding, and advanced integrations including Segment, Rudderstack, and custom connections.
Optional Campaign management services and GTM Engineering Services are available as an add-on for teams that want Factors.ai to build out their ICP modeling, RevOps workflows, SDR enablement, and enrichment automation. It's the difference between a tool you configure yourself and a GTM system someone builds with you.
Also, read Top GTM engineering tools for 2026.
6Sense pricing
6Sense doesn't publish pricing. Based on widely reported estimates and reviews on G2 and TrustRadius, entry-level access typically starts at $60,000 or more annually, with most enterprise deployments running well above that once add-ons for data, seats, and advanced features are included. Multi-year contracts are standard.
The challenge isn't just the cost. It's the opacity. Going into a procurement process without knowing what you'll pay until you're three conversations into a sales cycle is a tax on time that mid-market teams don't have. The negotiated model also means two companies paying very different amounts for the same product, which creates real headaches when budget reviews come around.
If you are curious to know more about 6sense and its costs, read our blog on 6sense pricing and costs in 2026
Factors.ai vs 6Sense: What is the verdict on pricing
Factors.ai offers clear, scalable pricing that reflects how much of your GTM motion you want it to power. 6Sense is built for enterprise procurement cycles where negotiated contracts are the norm and budget isn't the primary constraint.
In short:
Factors.ai = transparent, tiered pricing that scales with your team.
6Sense = enterprise contract model with costs that only become clear after a sales process.
Factors.ai vs 6Sense: CRM integration and pipeline mapping
A platform that identifies intent but can't connect that intelligence back to your CRM is just a fancy list generator. The real value of an ABM tool is in how cleanly it slots into your existing sales and marketing stack.
Factors.ai vs 6Sense: Integration depth compared
Why does the bi-directional sync matter?
Most ABM platforms push data to your CRM. That's useful. Factors.ai also pulls data from your CRM to inform what happens in your ad platforms. That distinction is more important than it sounds.
When a contact moves from MQL to SQL in your CRM, Factors.ai can automatically shift that account into a different LinkedIn audience. When a deal is marked Closed Lost, that account can be suppressed from your ads or moved into a re-engagement audience. Your campaigns respond to what's actually happening in your pipeline, not just to what a third-party intent model predicts.
6Sense's integration is strong at the enterprise level, particularly with Salesforce. But it operates more as an intelligence layer above your CRM than as one tightly woven into your ad workflows. For teams where LinkedIn Ads and Google Ads are core pipeline drivers, that difference shows up in performance.
Factors.ai vs 6Sense: Verdict on CRM and pipeline mapping
Both platforms connect meaningfully to major CRMs. Factors.ai's edge lies in the real-time, bidirectional connection between CRM stages and ad audience management. 6Sense's edge is the depth of its enterprise Salesforce integration and the breadth of its marketing automation platform support.
In short: Factors.ai = CRM integration that feeds back into ad activation in real time.
6Sense = strong enterprise CRM intelligence with less emphasis on closing the ad feedback loop.
Factors.ai vs 6Sense: Intent signals and ad activation
B2B Intent signal detection is only as valuable as what you do with it. The gap between the two platforms is widest here.
Factors.ai vs 6Sense: Comparing intent and activation
Where 6Sense built its reputation...
6Sense pioneered the “dark funnel” concept: the idea that most B2B buying activity happens before a prospect ever raises their hand, and that you can predict purchase intent by watching anonymous research behavior. Its proprietary data network is genuinely impressive at identifying companies that are thinking about buying a solution before they show up in your CRM.
For brand-level display advertising: reaching accounts in the awareness stage before they know who you are, that predictive model is powerful. 6Sense's display campaigns can get your brand in front of the right accounts early in the buying cycle.
...and where the gap opens up
Where 6Sense struggles is the activation layer that follows that intelligence. Its Google Ads integration is limited. Its LinkedIn activation doesn't track organic engagement or offer the same level of CAPI feedback. And because 6Sense built its activation primarily around display, teams running heavy LinkedIn and Google campaigns often need additional tooling to bridge the gap.
Factors.ai was built with activation as a first-class capability, not an add-on. The LinkedIn AdPilot and Google AdPilot aren't integrations bolted onto an intelligence layer. They're core to how the platform operates. Intent signals immediately feed into audience updates, impression pacing, conversion feedback, and sales alerts. The loop is closed by design.
Mic drop.
Verdict on intent and ad activation
6Sense has stronger predictive modeling for top-of-funnel awareness. Factors.ai has stronger activation for teams running performance-oriented ABM across LinkedIn and Google.
In short: Factors.ai = intent that immediately activates across LinkedIn, Google, and your sales workflow. 6Sense = predictive intelligence that's strongest for display-first ABM programs.
Factors.ai vs 6Sense: Analytics and reporting
Attribution debates sometimes resemble group projects where everyone claims credit for the final result. A good analytics platform settles the debate with data instead of politics.
Factors.ai vs 6Sense: Analytics comparison
What does good attribution actually look like?
Multi-touch attribution means every campaign interaction, from the first LinkedIn impression to the last demo confirmation email, shares credit for a deal proportionally. Without it, you end up over-crediting the last touch (usually a sales email) and under-crediting every brand and nurture campaign that built the relationship.
Also, read Top 12 attribution models in B2B
Factors.ai's custom report builder lets GTM teams ask specific questions: which campaign source produces the fastest sales cycle? Which audience segment has the highest win rate? Does LinkedIn or Google produce better ACV? These aren't hypothetical questions. They're the questions CMOs ask in QBRs, and they require granular attribution data to answer confidently.
6Sense's pre-built dashboards are solid for high-level pipeline reporting but don't offer the same flexibility. Teams with specific attribution questions often find themselves exporting data into a separate BI tool, which adds friction and introduces gaps.
Verdict on analytics
For teams that need to prove ROI at the campaign level and connect every marketing touchpoint to revenue, Factors.ai's attribution capabilities are significantly more flexible. 6Sense's analytics are strong for enterprise pipeline forecasting but weaker on custom attribution and channel-specific reporting.
In short: Factors.ai = granular, customizable attribution that answers specific revenue questions. 6Sense = solid pipeline visibility without the flexibility to go deep on channel-level analysis.
Factors.ai vs 6Sense: Onboarding and support
Buying a platform is the easy part. Getting it to actually work for your team is where most ABM investments stall.
Factors.ai vs 6Sense: Support model compared
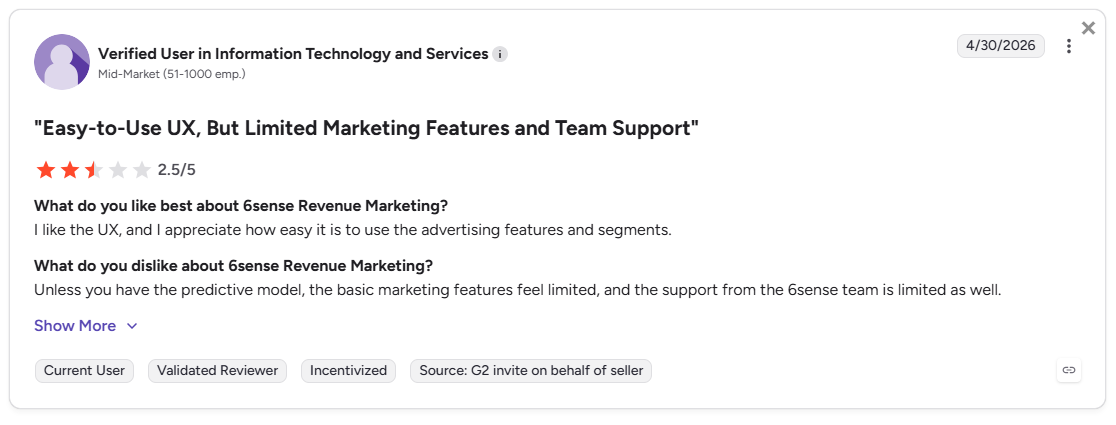
The two-week vs six-month gap… and why am I going ON and ON about it?!
That implementation gap isn't a minor detail. At six months, you're looking at two quarters of pipeline potential lost before the platform even goes live. Teams using 6Sense frequently report that the bulk of Q1 is consumed by implementation, integration cleanup, and stakeholder training.
Factors.ai's two-week onboarding is structured, hands-on… and white-glove. A dedicated CSM works through your ICP, funnel stages, and current integrations, configures alerts and workflows, and makes sure your ad platforms are connected before the weekly check-in cadence begins. There's no long setup phase where you're waiting for something to be live.
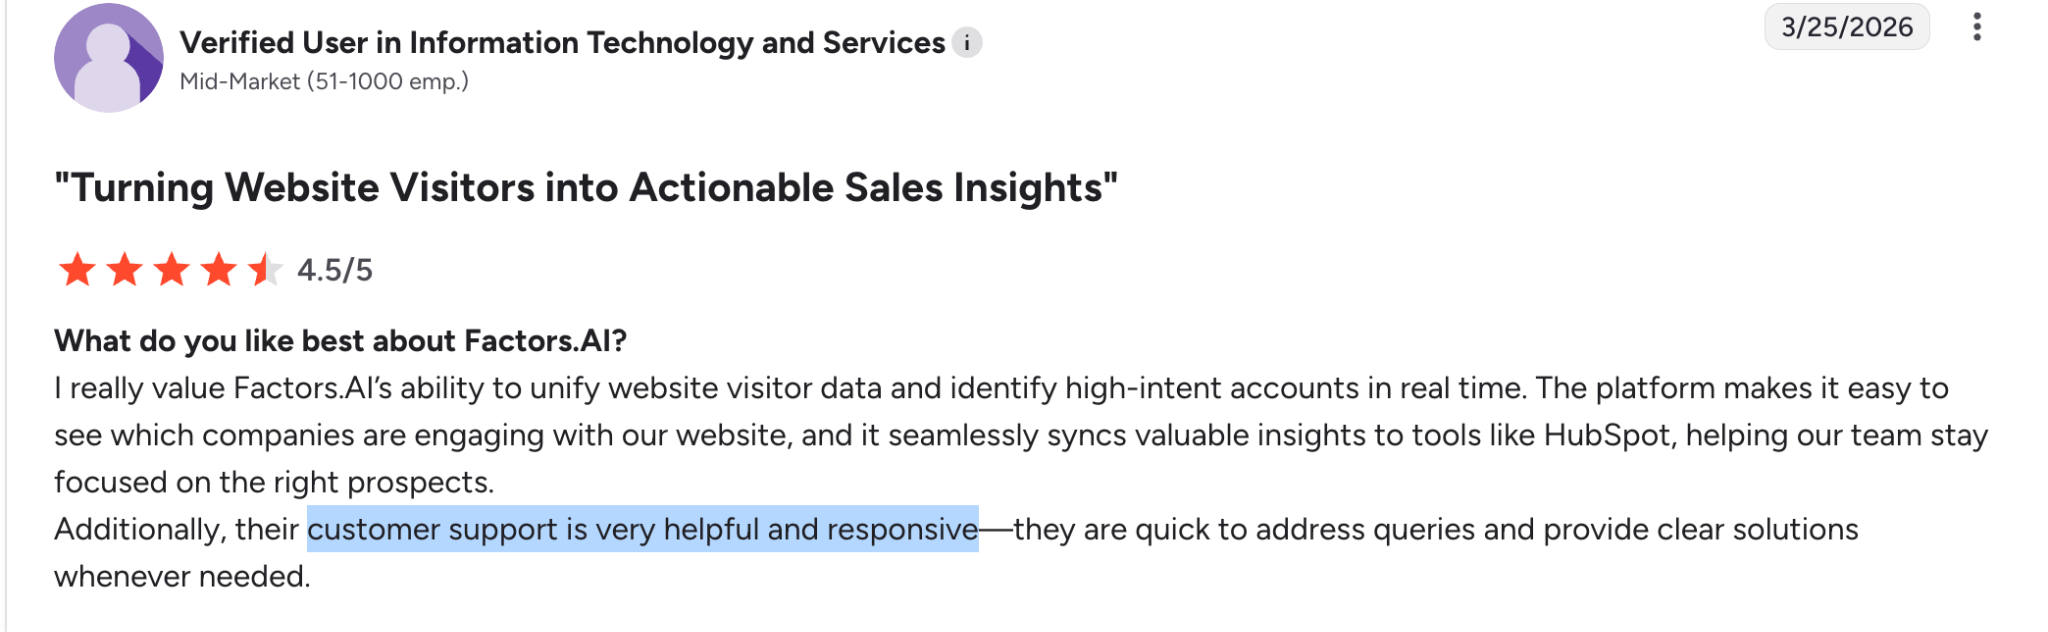
The private Slack channel is a meaningful support differentiator (no, it’s not just a nice-to-have; everybody will actually reply and help you). When something breaks during a campaign, you're talking to a real person, not submitting a ticket and waiting forty-eight to seventy-two hours for a response.
For teams that don't have in-house RevOps, GTM Engineering Services fills that gap. Factors.ai can design and build your entire GTM workflow, from ICP modeling to enrichment automation to SDR enablement, as an add-on service. 6Sense doesn't offer an equivalent.
Factors.ai vs 6Sense: Verdict on onboarding and support
If speed to value matters, and for most mid-market teams it absolutely does, Factors.ai's two-week onboarding and proactive CSM model wins clearly. 6Sense's support is appropriate for enterprise teams with dedicated implementation resources, but it's a poor fit for teams that need to show results this quarter.
In short: Factors.ai = structured, fast onboarding with a dedicated CSM from day one.
6Sense = enterprise implementation timeline with support that scales to contract size.
Factors.ai vs 6Sense: Compliance and security
Neither platform should make you nervous in a procurement review. But the details matter for teams dealing with enterprise contracts or regulated industries.
Factors.ai vs 6Sense: Compliance overview
Both platforms clear the standard bar for enterprise procurement. Factors.ai's ISO 27001 certification via GCP and the availability of signed Data Processing Agreements make it straightforward to clear vendor security reviews, even in regulated industries.
One practical note: Factors.ai hosts its data in GCP's US region, with Standard Contractual Clauses for EU-US transfers, so EU-based customers can use it without data residency complications. Teams in regulated verticals should confirm specifics with both vendors during the evaluation process.
Factors.ai vs 6Sense: Verdict on compliance
Both platforms are enterprise-appropriate from a compliance standpoint. Factors.ai's published ISO 27001 certification and formal incident response documentation give it a slight edge in detailed vendor review processes.
In short: Factors.ai = SOC 2 Type II, ISO 27001, GDPR, CCPA, with transparent DPAs.
6Sense = SOC 2 Type II, GDPR, CCPA compliant; ISO status not publicly confirmed.
What does Reddit say about 6Sense?


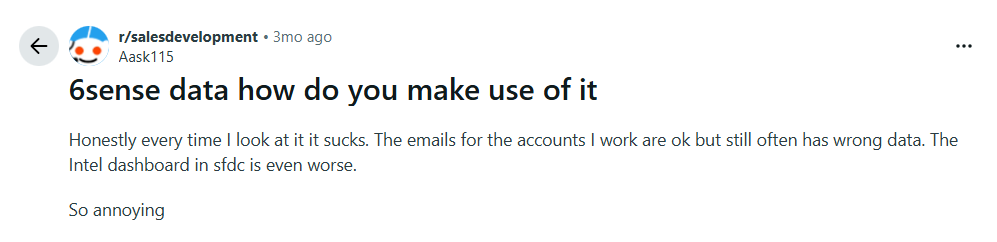
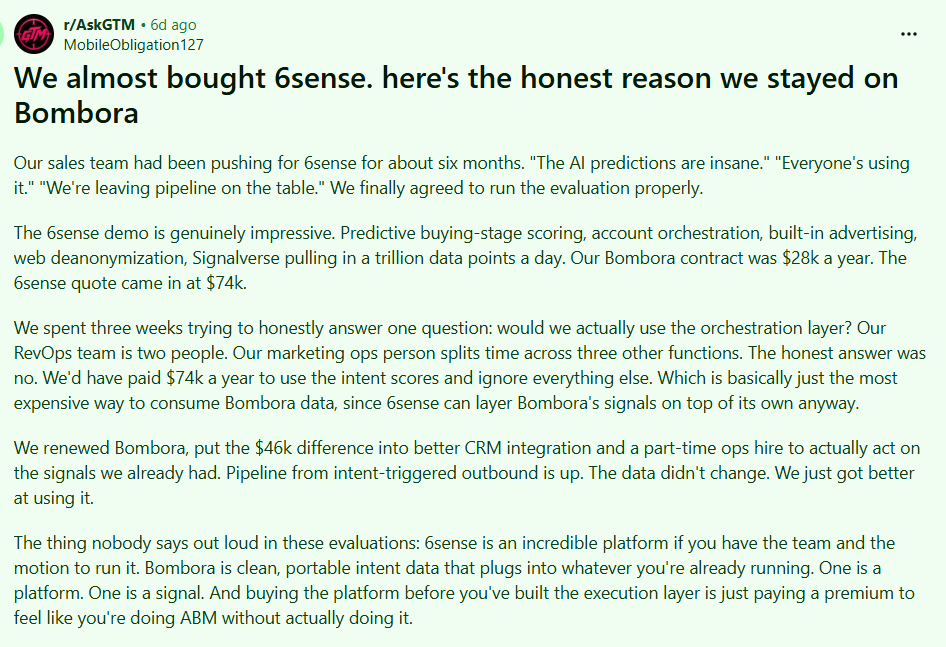
What do GTM teams say about Factors.ai?
23% higher conversions after switching to Factors.ai.
"The impact of Factors.ai on Rocketlane is that we're not just doing better, we're working smarter and more efficiently. Returns on our campaigns have improved, and our understanding of our data means we can make better decisions."
Steve Colberg, Head of Growth, Rocketlane
35% of pipeline influenced by G2 and Factors.ai signals.
"Thanks to Factors.ai's intent signals, Q1 2024 was our best quarter ever for meetings booked and conversions."
Aashima Lamba, Senior Manager Demand Generation, Upflow
25% increase in LinkedIn Ads ROI.
"Factors' value is almost impossible to quantify because of how deeply it's integrated into our stack. It's become a critical tool for building a clear understanding of our users, their actions, and their journey across our digital footprint."
Shane Poyar, Growth Marketing and Operations Manager
Factors.ai vs 6Sense: which one makes sense for your team?
6Sense built its reputation as the category-defining ABM platform for a reason. Its predictive intelligence is strong, and for a large enterprise running brand-level ABM at scale, it's could be beneficial.
But for the majority of B2B SaaS teams who are trying to get more out of their LinkedIn and Google Ads budget, connect their CRM to their campaigns, and actually prove which activities are moving pipeline, Factors.ai covers more of that ground, faster, at a lower cost, and with a support model that doesn't require a dedicated implementation project manager to navigate.
The teams switching from 6Sense to Factors.ai aren't doing it because 6Sense broke. They're doing it because Factors.ai went live in two weeks instead of six months, and the attribution actually answered the questions their CMO was asking.
FAQs for Factors.ai vs 6Sense
Q1. What's the real difference between Factors.ai and 6Sense?
The core difference is activation depth and speed to value. 6Sense is strong at predictive intelligence and display ABM for enterprise teams. Factors.ai covers multi-channel activation across LinkedIn and Google, with tighter CRM integration, more flexible attribution, and a two-week implementation timeline rather than six months.
Q2. Is 6Sense worth the price for mid-market B2B teams?
For most mid-market teams, the answer is genuinely no. The implementation timeline alone costs two quarters of potential pipeline, and the pricing is structured for enterprise procurement budgets. Factors.ai covers the core ABM use cases at a fraction of the cost and operational complexity.
Q3. Does Factors.ai replace 6Sense entirely?
It depends on your use case. If you rely heavily on 6Sense's display advertising network for brand awareness at scale, Factors.ai doesn't replicate that specifically. For LinkedIn and Google Ads activation, attribution, visitor identification, and CRM-connected ABM, Factors.ai covers more ground, more affordably.
Q4. How long does Factors.ai actually take to set up?
Under two weeks for standard implementations. The onboarding team configures integrations, sets up ad platforms, builds initial workflows, and runs the first check-in call within that window. For more complex RevOps setups, GTM Engineering Services can extend the scope without extending the timeline significantly.
Q5. Does 6Sense offer a free trial?
No. 6Sense requires a sales consultation and doesn't offer a public trial. Factors.ai offers a free-forever plan covering up to 200 companies per month, and a 14-day paid-plan trial is available on request.
Q6. Which platform has better LinkedIn Ads integration?
Factors.ai, by a meaningful margin. As an official LinkedIn Marketing Partner, it offers intent-based audience syncing, impression pacing, frequency control, CAPI conversion feedback, and organic post engagement tracking. 6Sense's LinkedIn integration handles audience syncing but lacks organic tracking and granular conversion feedback.
Q7. How does Factors.ai handle account scoring differently from 6Sense?
Factors.ai offers custom scoring models that you configure based on your ICP, plus predictive AI scoring that factors in live behavior and firmographics. It also surfaces feature-level intent signals, meaning you can see which specific product areas a prospect is researching. 6Sense's scoring is primarily based on its proprietary intent model, with less customization available below the enterprise tier.
Q8. What happens if I already use 6Sense data within Factors.ai?
Factors.ai uses 6Sense data as one of multiple enrichment sources in its waterfall identification model. You don't lose access to 6Sense's data quality. You gain additional coverage from Snitcher, Demandbase, Clearbit, and Bombora layered on top of it.
Q9. Can Factors.ai handle enterprise-scale ABM programs?
Yes. The Enterprise plan covers unlimited companies, up to 25 seats, predictive scoring, LinkedIn and Google AdPilot, and advanced integrations. GTM Engineering Services can design the RevOps infrastructure for complex multi-team programs. The platform scales; the implementation timeline doesn't.
Q10. Which platform is better for proving ROI to leadership?
Factors.ai. Its custom report builder, multi-touch attribution, lift analysis, and ACV/win rate analytics give you the specific data points that CMOs and CFOs ask for in quarterly reviews. 6Sense's pre-built dashboards are strong for pipeline visibility but don't offer the same flexibility when someone asks, "Which specific campaign created this deal?"

AI marketing terms and definitions every B2B marketer should know
Cut through the vendor hype. Learn the essential AI marketing terms and definitions, from machine learning to agentic AI and AEO.
TL;DR
- AI marketing terminology has outpaced most teams' ability to operationalize it, and vendor language makes it worse by using different words for the same thing.
- The terms that actually matter for B2B aren't the flashy ones, they're the ones that affect how you target, spend, and attribute.
- AI decisioning, agentic AI, and AEO are the three concepts most glossaries skip over, and they're the ones reshaping GTM right now.
- Most ad platforms already run on ML systems under the hood, so marketers are already "using AI" whether they realize it or not.
- The companies that build AI literacy earliest are consistently faster to operationalize new capabilities, not because they have better tools, but because they know what they're buying.
SO, Why does everyone care SO much about AI marketing terms, suddenly?
A few months ago, I was on a call where someone described their product as an "agentic, AI-powered, autonomous GTM orchestration platform."
Everyone nodded… including me.
If I'm being honest, I'm not entirely sure anyone on that call knew what that sentence actually meant.
That's become a recurring theme in AI. Every week, a new term arrives. Agentic AI. Copilots. Reasoning models. AI-native software. Autonomous agents. Decision engines. Digital workers. The vocabulary keeps expanding faster than most teams can keep up with it.
The problem isn't that these concepts are meaningless. Many of them represent genuinely useful advances. The problem is that they're often used interchangeably when they shouldn't be. A workflow becomes an agent. A chatbot becomes a copilot. A dashboard becomes an intelligence platform. A filter becomes AI. And a marketer becomes an idiot. (No, I did not say that.)
Oh! And at this point, I wouldn't be surprised if my toaster launched a thought leadership campaign about ✨autonomous breakfast orchestration✨.
The result is that B2B teams are having increasingly expensive conversations using the same words to mean completely different things. Marketing thinks they're buying intelligence. Sales thinks they're buying automation. RevOps thinks they're buying another integration project. The vendor thinks they're buying lunch for the sales team. Nobody is necessarily wrong. They're just operating from different definitions.
That's not a great place to be when you're evaluating software, planning budgets, or trying to figure out whether a new platform is actually useful or simply very good at describing itself.
Which is why I wanted to put together this glossary.
Not because the world desperately needed another AI glossary (ummm… actually they do?!). We seem to be producing those at a rate that would make venture capitalists proud.
This guide is for operators. The people sitting through demos, approving budgets, trying to connect marketing, sales, and RevOps around a shared understanding of what a tool actually does. The people who occasionally find themselves in meetings pretending they know what "multi-agent reasoning architecture" means and hoping nobody asks a follow-up question.
My goal here is to cut through the terminology, explain what these concepts mean in practice, and help you separate useful technology from marketing theatre.
Core AI marketing terms explained
Before getting into the nuanced stuff, here's a clean reference table for the foundational terms. These come up constantly and get muddled often.
AI vs machine learning vs generative AI
This is the one that trips people up most, and honestly, the confusion is understandable because the terms get used interchangeably even by people who should know better.
Here's the clearest way to think about the hierarchy:
The distinction that matters most in practice: ML predicts, GenAI creates. If a tool is analyzing your pipeline and surfacing likely-to-close accounts, that's ML. If it's writing your follow-up email, that's GenAI. Most modern platforms combine both, which is where the "AI-powered" label gets sticky.
What do vendors actually mean when they say ‘AI-powered’?
This is worth a dedicated callout because it affects procurement decisions. When a vendor says their platform is "AI-powered," they could mean any of the following things:
- Their scoring uses a regression model (basic ML)
- They have a GenAI feature that summarizes call transcripts
- They use an LLM API in the background for natural language search
- They've genuinely built proprietary models trained on your data
- They've added a chatbot to their dashboard
The questions worth asking: Is the AI trained on your data or a generic model? Where exactly in the workflow is AI making or influencing decisions? Can it explain its reasoning? What happens when it's wrong?
AI decisioning in marketing explained…
If there's one concept in this glossary that separates teams operating at the current frontier from everyone else, it's AI decisioning. And it's the section most competitor glossaries skip entirely, so let's actually do it justice.
AI decisioning refers to systems that combine real-time signals, historical data, rules, and predictive models to automatically determine what action to take, for whom, in which channel, and when. This goes well beyond automation. A classic automation workflow says "if this, then that." AI decisioning says "given everything we know right now, here's the optimal next action."
In practice, AI decisioning in marketing answers questions like:
- Which accounts should our SDRs prioritize today based on real-time buying signals?
- Should we increase or suppress LinkedIn spend for this segment based on pipeline velocity?
- Which content asset should we serve this visitor given their firmographic profile and engagement history?
- At what point in the funnel should we trigger an outbound sequence for this account?
- How should we reallocate budget mid-flight based on conversion signals?
The power of AI decisioning compounds when multiple data sources are unified into a single decision layer. When CRM data, ad engagement, website behavior, intent signals, and pipeline stage are all feeding the same system, the decisions become materially better than any single-source logic could produce.
What AI decisioning is not…
It's worth being explicit here because the term gets conflated with things it isn't. AI decisioning is not:
- Basic automation with if/then logic
- Static segmentation rules that update weekly
- A dashboard that shows you data and lets you decide manually
- Rule-based lead routing that doesn't adapt
The "intelligent" part of AI decisioning comes from the system's ability to weigh multiple variables simultaneously, update based on new signals, and optimize toward a defined outcome rather than just execute a predefined rule.
Agentic AI marketing definition
Agentic AI is the concept that's generating the most hype right now and also has the most genuine potential... once the infrastructure catches up. The definition is simpler than it sounds: agentic AI systems don't just respond to a prompt, they pursue goals. They reason through what needs to happen, decide on a series of actions, execute them, observe the results, and adapt.
The classic chatbot says "here's an answer." An agent says "here's the goal, let me figure out the steps, execute them, and tell you when it's done."
In B2B marketing, agentic AI is starting to show up in things like:
- Autonomous outbound prioritization: Agents that monitor pipeline signals, identify accounts showing buying intent, and queue them for outreach without waiting for a human to pull a report
- Campaign optimization agents: Systems that monitor ad performance, identify creative fatigue, reallocate budget, and generate new creative variants, all within defined guardrails
- Attribution analysis agents: Agents that pull cross-channel data, reconcile attribution discrepancies, and surface insights that a human analyst would take hours to find
- Pipeline monitoring agents: Real-time watchers that flag at-risk deals, suggest re-engagement actions, and alert the right people at the right time
Keep these limitations in mind tho…
The hype around agentic AI tends to skip past the parts that still require careful human oversight. These are a few things I would urge you to keep in mind:
- Hallucinations are real: Agents can confidently take wrong actions based on incorrect reasoning, especially when working with ambiguous data
- Governance matters: Autonomous systems operating on customer data or ad budgets need clear approval layers and audit trails
- Data quality is the ceiling: An agentic system is only as good as the signals it's working from. Garbage in, garbage out still applies, just faster
- Human-in-the-loop isn't a limitation, it's a feature: For high-stakes decisions (budget reallocation, outbound sequences, pricing changes), a human approval step isn't slowing things down, it's preventing expensive mistakes
AI answer engine (AEO) explained
This is the concept that's most directly reshaping content strategy right now, and most teams are behind on it. Search is undergoing a structural shift. When someone types a question into Google, increasingly they get a synthesized AI answer at the top of the page, not ten links. When someone asks ChatGPT, Gemini, Perplexity, or Claude a question, they get a single answer with source citations, not a list of results to click through.
This means the old SEO playbook, write content, rank for keywords, get clicks, is getting disrupted at the discovery layer. AEO (Answer Engine Optimization) is the practice of structuring content so AI systems can extract, summarize, and cite it accurately when generating answers.
What kind of content gets cited by AI engines?
Through a combination of testing and paying attention to how LLMs actually pull citations, the pattern that emerges is fairly consistent:
- Structured, definitional content: Clear definitions at the top, organized by entity and concept
- Tables and comparison formats: LLMs are very good at parsing and re-presenting tabular information
- Original frameworks and named concepts: When you coin a term or create a unique framework, it creates a citation anchor
- Authoritative, specific claims: Vague generalities get skipped. Specific, verifiable claims get cited
- Semantic clarity: Content where the relationship between concepts is explicit, not implied
- FAQ structures: Direct question-and-answer format is highly extractable
How to write content that LLMs actually cite?
This is the tactical piece most "AEO guides" skip over. Here's what will help you (because it’s helping me!):
- Definition-first formatting: Lead with the answer, then expand. Don't bury the definition three paragraphs in
- Entity clarity: Be explicit about what you're defining and how it relates to adjacent concepts
- Schema markup: Use FAQ schema, HowTo schema, and article schema to help AI systems parse your content structure
- Source-backed claims: LLMs prefer citing content that cites other authoritative sources, creating a trust chain
- Topical authority signals: A single well-structured glossary page on AI marketing terms signals breadth. A cluster of interconnected posts signals depth. Both matter for citability
The meta-point here is that AEO-friendly content and genuinely good content are largely the same thing. Clear structure, specific claims, original thinking, comprehensive coverage. The SEO tactics that worked by gaming keyword density are the ones that AEO disrupts. The fundamentals that always mattered, actually explaining something well, matter more now.
Predictive AI terms every B2B marketer needs to know
Predictive AI is the category that's been operational in B2B for the longest, and it's worth distinguishing it clearly from generative AI because they do very different things.
The critical thing to understand about predictive AI in B2B is that it's only as valuable as the data feeding it. A lead scoring model trained on six months of data from a single channel will miss a lot. The teams getting the most out of predictive AI are the ones that have invested in unified, clean, cross-channel data pipelines.
AI advertising and campaign optimization terms
Most B2B marketers are already running on ML-powered ad systems without fully realizing it. LinkedIn, Google, and Meta all have predictive layers built into their bidding, targeting, and delivery systems. Here's the vocabulary for what's actually happening under the hood.
Here’s what I think… a lot of what gets called "AI strategy" in advertising is really just knowing how to configure and trust the ML systems that platforms already have. Fighting against automated bidding because you want manual control is almost always a losing strategy at scale. The skill shift is from "manage every parameter manually" to "set the right objectives and constraints, then let the system optimize."
AI data and attribution terminology
Attribution is where AI gets genuinely complicated in B2B, and it's the area where terminology confusion causes the most damage.
Please remember this, and then remember me when you think of this… AI quality is downstream of data quality, which is downstream of signal quality. You can have the most sophisticated decisioning system in the world, but if your CRM is a mess, your UTM parameters are inconsistent, and your intent data is six weeks stale, the AI is optimizing garbage. Data infrastructure isn't the exciting part of AI strategy, but it's the part that determines whether the AI part actually works.
AI automation and workflow terms
There's a spectrum here from simple automation to genuinely intelligent orchestration, and knowing where your tools fall on that spectrum is important for setting expectations.
Which AI workflows are actually useful in B2B marketing today?
Cutting through the hype, the use cases where AI automation is delivering real value right now:
- CRM enrichment: Automatically pulling firmographic and technographic data into account records when new leads enter the system
- Campaign performance summaries: Generating weekly or daily performance narratives from raw platform data
- Outbound sequence prioritization: Surfacing the right accounts for SDR outreach based on real-time intent and engagement signals
- Pipeline monitoring: Flagging deal health changes and alerting the right stakeholders
- Content reporting: Automatically tracking which content assets are influencing pipeline across touchpoints
The use cases where AI automation still needs more work before going fully autonomous: anything involving direct customer communication that hasn't been reviewed, budget reallocation in live campaigns, and anything requiring legal or compliance sign-off.
AI ethics, privacy & governance terms
This section gets skipped in most AI glossaries and that's a problem, because enterprise buying decisions increasingly hinge on exactly this vocabulary. If you're evaluating AI tools and you can't ask smart questions about governance, explainability, and data privacy, you're missing the criteria that matter most for long-term risk management.
The enterprise buying trend worth tracking: procurement teams at larger organizations are now routinely asking for AI governance documentation, model explainability reports, and data residency specifications before signing contracts. If a vendor can't answer these questions clearly, that's signal.
AI terms that are mostly… hype
In the spirit of actually being useful, here's a breakdown of the terms that marketers should approach with skepticism, because not every AI term in circulation has real operational meaning.
The test worth applying to any AI marketing claim: "What specifically does the AI do in this workflow, what data does it use, and what happens when it's wrong?" If a vendor stumbles on any of those questions, file the claim under marketing language rather than product capability.
How should B2B teams actually use AI?
The most useful frame here isn't "how do we use AI" in the abstract but rather which types of AI are suited to which types of tasks, and where humans still need to remain in the loop.
The framing that's most durable: AI should handle scale, speed, and pattern recognition. Humans should own judgment, strategy, and anything where being wrong has serious downstream consequences. The companies that get into trouble are usually the ones that automate the wrong tier of decisions.
What’s coming up? The future vocabulary of AI marketing
The terms being coined right now that will be standard vocabulary in two to three years:
- AI agents: Already mainstream in technical circles, will be a default feature expectation in marketing platforms by 2026
- Agentic commerce: AI that can research, evaluate, and complete purchases autonomously on behalf of users
- Multimodal AI: Systems that work across text, image, audio, and video simultaneously, already reshaping creative workflows
- Zero-click marketing: Strategy built around getting cited in AI answers rather than earning clicks to your own site
- Synthetic audiences: AI-modeled audience proxies used for testing and forecasting before spending on real media
- AI-native analytics: Analytics designed from the ground up for AI consumption, not human dashboard review
- Memory systems: AI architectures that maintain context across sessions, enabling genuine relationship continuity
- Autonomous attribution: Attribution systems that reconcile cross-channel data and surface insights without human configuration
The through-line across all of these is a shift from AI as a tool that marketers use to AI as infrastructure that marketing runs on. The distinction matters for how you build teams, evaluate platforms, and think about where human expertise creates competitive advantage in a world where execution is increasingly automated.
The companies that build AI literacy earliest aren't just learning vocabulary. They're building the organizational muscle to evaluate claims critically, operationalize capabilities faster, and avoid the expensive mistakes that come from misunderstanding what they've bought. That's the compounding advantage that nobody puts in the press release.
How does Factors.ai fit into this picture?
Modern GTM execution requires the ability to unify first-party data, intent signals, ad engagement, and CRM activity into a single decision layer, and then act on it with enough speed and precision to matter. That's exactly the infrastructure problem that Factors.ai is built to solve.
Where these terms stop being abstract and start being operational: when your predictive scoring is pulling from unified account signals rather than just CRM fields, when your AI decisioning layer knows that an account visited your pricing page twice while a competitor's G2 review page is surging, and when attribution is connecting that activity to pipeline influence rather than just last-touch form fills. That's the difference between AI marketing as a concept and AI marketing as a competitive advantage.
FAQs for AI marketing terms
Q1. What are AI marketing terms?
AI marketing terms are the concepts and definitions that describe how artificial intelligence technologies are applied across marketing workflows, from targeting and automation to analytics and attribution. They span technical foundations like machine learning and LLMs, through to applied concepts like AI decisioning, agentic workflows, and answer engine optimization.
Q2. What is AI decisioning in marketing?
AI decisioning in marketing refers to systems that use real-time signals, historical data, and predictive models to automatically determine the optimal action, such as who to target, when to engage, which channel to prioritize, and how to allocate budget. It's distinct from basic automation in that the system adapts to new information rather than executing static rules.
Q3. What is agentic AI marketing?
Agentic AI in marketing refers to AI systems that can independently plan and execute multi-step tasks toward a defined goal, with minimal human intervention at each step. Examples include autonomous outbound prioritization, campaign optimization agents, and pipeline monitoring systems. Current implementations typically still include human approval layers for high-stakes decisions.
Q4. What is AI answer engine marketing (AEO)?
AEO is the practice of structuring content so that AI systems like ChatGPT, Gemini, Perplexity, and Claude can accurately extract, summarize, and cite it in generated answers. It's becoming a critical component of content strategy as AI-generated answers increasingly replace traditional search results as the primary discovery mechanism.
Q5. What's the difference between AI and machine learning in marketing?
AI is the broad category covering all intelligent systems. Machine learning is a specific subset where systems learn patterns from data to make predictions or decisions. Most of the practical AI capabilities in marketing platforms, lead scoring, bid optimization, intent modeling, run on ML systems. Generative AI (ChatGPT, Claude, etc.) is a different branch focused on creating new content rather than predicting outcomes.
Q6. Which AI marketing terms should B2B marketers learn first?
The highest-leverage terms to understand first are: machine learning (because it powers most of the platforms you're already using), AI decisioning (because it describes where GTM is heading), intent data (because it's the signal layer that makes everything else smarter), agentic AI (because it's the architecture that will reshape workflow automation), and AEO (because it's actively changing how content strategy needs to work right now).
Q7. What is the difference between an AI copilot and an AI agent?
A copilot assists human work by surfacing recommendations, drafts, or analysis that a human then acts on. An agent acts autonomously, taking sequences of actions to complete a goal with minimal human intervention at each step. Most current enterprise AI tools are copilots. Agentic systems are emerging but still require careful governance and human oversight for high-stakes decisions.
Q8. How does data quality affect AI marketing performance?
AI systems are fundamentally limited by the quality, completeness, and freshness of the data they operate on. A predictive model trained on incomplete CRM data will produce inaccurate scores. An AI decisioning system working from stale intent signals will make suboptimal targeting decisions. Investing in data infrastructure, identity resolution, signal unification, and enrichment is a prerequisite for AI marketing to work at its full potential.
.avif)
AI in Marketing: The operating system modern B2B teams are building
Read how AI in marketing actually works in B2B, from strategy and automation to attribution, personalization, and decision-making.
TL;DR
- AI in marketing has moved from a productivity experiment to the connective intelligence layer across the entire GTM motion.
- The fundamental shift is from campaign-led to signal-led marketing: knowing which accounts matter, which channels actually influence pipeline, and where the next dollar should go.
- Automation follows pre-set rules. AI detects patterns, infers intent, and surfaces what no human analyst would catch at scale.
- In an AI-first world, attribution becomes decision-making infrastructure, not a quarterly reporting ritual.
- Most AI adoption stalls because companies buy tooling before cleaning their data or defining the specific decisions they're trying to improve.
- The marketers who win the next decade won't be the ones who produce the most content. They'll be the ones who consistently make better bets with the same data everyone else has.
AI in marketing isn't really a ‘tool category’ anymore…
Every few years, the martech industry invents a new category and convinces everyone they need it. CRM. Marketing automation. ABM platforms. Intent data. CDP. Each one promised to solve a coordination problem, and each one created a new one. By 2024, the average enterprise marketing team was managing 12 to 15 tools, and the average marketer was spending more time stitching data between dashboards than actually using it to make decisions. And they were looking a little like this:

AI entered that environment as the ‘connective tissue’ the whole stack was missing. Most B2B teams adopted it incrementally, starting with ChatGPT for copy drafts and Jasper for blog outlines, before realizing the more valuable application was entirely elsewhere.
We've sat in enough quarterly planning sessions to know what the real bottleneck looks like… it's that nobody can answer basic strategic questions with any confidence. Which accounts should we actually prioritize? Which channels moved those deals? Why did Q2 miss despite everyone working hard? The data exists across six tools. Nobody has time to synthesize it properly before the next meeting.
AI as an operating layer means those questions get answered before the meeting, not during it. Account prioritization, budget reallocation, intent scoring, and pipeline forecasting move from analyst projects to automated outputs. The shift isn't about working faster. It's about reducing the uncertainty that surrounds every strategic decision in a B2B GTM motion.
For ABM teams particularly, this changes the economics of the entire function. Running a proper account-based motion used to require either a dedicated ops team or expensive RevOps tooling that only enterprise companies could justify. AI has collapsed that requirement. The intelligence is now accessible to a 10-person marketing team with the right stack, which is either democratizing or terrifying depending on whether your moat was "we can afford better tools."
The first generation of AI adoption was about replacing work. The second generation, which is where most mature teams are operating now, is about reducing uncertainty. Marketers don't struggle because they can't execute campaigns… that’s faaaar from true. Most of us struggle because the cost of a wrong bet in B2B is enormous, and the data to make a right one has historically been TOO fragmented to act on.
For the hundredth time, what is AI in marketing, really?
For definition's sake, AI in marketing is the application of machine learning, predictive analytics, and generative models to improve how teams collect signals, prioritize decisions, and execute campaigns. Worth unpacking what that actually means in practice, because "AI" has become one of those words that technically means everything and functionally means nothing.
Most people use it as a catch-all for four things that are genuinely distinct:
- Automation runs rule-based workflows with no learning involved. "If a lead fills out a form, send the welcome sequence." Deterministic, predictable, and exactly as smart as whoever built the workflow.
- Machine learning detects patterns in historical data to predict future behavior. Lead scoring, churn prediction, and audience segmentation fall here. The system learns which combinations of signals correlate with outcomes.
- Predictive analytics uses those learned patterns to surface probabilities. "This account has a 74% likelihood of entering an active buying cycle in the next 30 days." The guidance is directional and not certain, but it is far more useful than relying on gut feelings.
- Generative AI creates new, and email from prompts: copy, images, code, email sequences. It's the most visible layer because everyone can see it working, but it's not always where the most business-critical value lives.
In plain terms, AI digital marketing means your systems learn from behavioral and firmographic data to help you reach the right buyers with the right message at the right time, without someone manually reconfiguring campaigns every week. Here's how those layers stack in a B2B context:
The practical applications of AI in B2B marketing today include account-level intent scoring, predictive retargeting based on buying stage, dynamic landing pages that adapt to visitor profiles, pipeline forecasting from CRM activity patterns, and content recommendations driven by account engagement history. The common thread across all of them is inference rather than instruction: the system draws conclusions from patterns instead of following a script.
What’s the difference between automation and actual AI?
Traditional marketing automation is conditional logic at scale. "When X happens, do Y." A contact requests a demo, a sequence fires, a field updates in the CRM. Deterministic, predictable, and only as intelligent as whoever configured it. When the person who built the workflow leaves, no one fully knows why it works or how to change it without breaking something. (If this describes your current stack, you're in good company.)
AI-driven systems operate differently. Instead of following conditions, they make inferences: "Based on patterns, probability, and behavioral signals, here's what should most likely happen next." The system isn't executing instructions. It's reasoning about likelihood.
But I think this is where most of us have gotten a bit confused: most tools marketed as "AI" today are sophisticated automation with a thin intelligence layer on top. The workflow still fires based on rules. The "AI" helps set those rules more efficiently or adjusts them based on outcomes. That's genuinely useful. It's just not the same as a system that surfaces what you didn't know to look for.
Actual AI earns its keep when it finds what you would have missed: a cluster of high-intent accounts who never filled out a form, a content asset quietly influencing late-stage deals across multiple accounts, a channel contributing to pipeline that's getting zero attribution credit because it doesn't have a trackable click. That kind of signal discovery is what separates automation from intelligence.
Where does AI show up across the B2B marketing funnel?
AI is not a demand gen tool, or a content tool, or a sales enablement tool. But it does show up at every stage of the funnel, often in ways that are invisible until you look at what changed in the data.
- Top of funnel
At the awareness stage, AI is changing how teams find and qualify audiences. SEO topic clustering tools use NLP to identify content gaps and search intent patterns with far more precision than traditional keyword research. Google's Performance Max and LinkedIn's predictive audience targeting use behavioral signals to expand reach beyond manually defined parameters, which is either a marketer's dream or a brand safety nightmare depending on how you've set it up.
Creative testing has moved from A/B to multivariate at scale. AI tests dozens of ad variants simultaneously and reallocates spend toward top performers in real time, without waiting for statistical significance thresholds that take six weeks to hit.
What is AI content marketing at this stage? Using AI to understand what target accounts are actually searching for, what questions are unanswered in your category, and where distribution gaps exist in your content strategy. Not just faster blog writing. Smarter targeting of what to write about and where to put it.
- Middle of funnel
MOFU is where AI earns its keep in B2B. Intent-based retargeting platforms pick up third-party research signals, including review site visits, competitor content consumption, and category-specific search activity, to identify accounts actively in a buying cycle before they raise their hand. AI segmentation clusters accounts by engagement pattern and actual buying stage rather than just firmographics. Dynamic nurture journeys adapt content and cadence to where an account is in its consideration process, rather than following a fixed sequence that someone built in 2022 and nobody has touched since.
Engagement scoring at this stage goes well beyond form fills and email opens. It includes time on pricing page, return visits, LinkedIn ad engagement frequency, and the pattern of which content is consumed in what sequence.
- Bottom of funnel
At BOFU, AI crosses into revenue territory. Opportunity prioritization models surface which open deals are most likely to close based on CRM activity and engagement signals. Pipeline prediction tools give revenue teams early warning on deals at risk of stalling, before the deal review meeting where someone asks why this hasn't moved in three weeks. Buying committee analysis tracks which individuals within a target account are engaging, not just the primary contact, giving marketing and sales a more complete picture of where a deal actually stands.
Combined with multi-touch attribution modeling, this creates a closed loop: AI identifies accounts, influences the journey, and measures what worked so the model gets better with each cycle.
How is AI useful in marketing decision-making?
The real value of AI is that it changes the quality of the decisions that happen before the campaign starts.
Consider what a VP of Marketing actually decides in a given quarter: which accounts to prioritize for ABM investment, which campaigns deserve more budget, which channels are influencing pipeline versus inflating vanity metrics, which buyers are showing genuine intent right now, and which segments are consuming spend without contributing revenue. For most teams, these decisions get made using instinct, last-click reporting, anecdotal feedback from sales, and whoever speaks most confidently in the revenue review. AI changes that by surfacing probabilities instead of opinions.
The framework for how this works in practice:
Data → Signal → Decision → Action
Raw CRM activity and ad engagement get synthesized into behavioral signals. Those signals inform a prioritization decision. The decision triggers an action: an SDR sequence, a retargeting campaign, a budget reallocation. The action generates new data, which feeds the model. The loop gets tighter with each cycle.
In concrete terms, AI-driven decision-making in marketing looks like this:
- Predicting conversion likelihood so SDRs spend time on the highest-probability accounts rather than working the MQL queue chronologically
- Identifying where deals consistently stall in the pipeline and surfacing the missing engagement that precedes those stalls
- Finding high-intent accounts that haven't raised their hand but are clearly deep in a research cycle based on behavioral signals
- Detecting which channels are actually influencing closed-won deals vs. generating clicks that look good in a dashboard
- Flagging campaign fatigue before engagement metrics drop off a cliff
Platforms like Factors.ai sit at the center of this by unifying CRM activity, website visits, ad engagement, attribution data, and intent signals into a single account-level view. When those signals live in five separate tools, the intelligence you get from any one of them is always incomplete. Garbage in, garbage out, and in AI systems, garbage in means confident but wrong recommendations, which is arguably worse than no recommendation at all.
Most marketing problems are actually decision problems
There's a reframe worth making here. Most of what gets labeled a marketing problem, weak pipeline, poor conversion rates, wasted ad spend, is a decision problem upstream of execution. Which ICP should the team prioritize? Which market is ready to enter? Which campaign deserves more budget? Which accounts are showing genuine buying intent versus just clicking around out of vague curiosity?
For years, those decisions got made using gut feel, anecdotal sales feedback, and last-click attribution reports that flattered whichever channel had the longest cookie window. AI becomes genuinely valuable when it moves teams from opinions to probabilities. The future marketer won't be the one who creates the most campaigns. It'll be the one who consistently makes better bets than everyone else working with the same budget and the same data.
AI content marketing beyond ‘write me a blog post’ because we’re wayyy past that now
Most writing about AI content marketing gets stuck on copy generation. Faster blog posts, better subject lines, ad variants at scale. That's a legitimate use case, and it's also the least interesting part of what AI makes possible in content.
The real shift is happening upstream: in how teams decide what to create, where to put it, and whether it's actually doing anything for revenue.
- AI for content research
AI tools now do what used to require a full week of keyword research and SERP analysis: identify topic clusters, map search intent across the buying journey, surface content gaps that competitors haven't addressed, and flag the specific questions your target accounts are actively asking. The speed improvement is real, but the more significant change is accuracy. Models can process thousands of signals that no human analyst has bandwidth to synthesize, which means the research starts from a better place.
- AI for distribution
Content production stopped being the bottleneck a while ago. Getting the right content in front of the right account at the right moment in their buying cycle is the actual challenge. AI helps by recommending distribution channels based on audience behavior patterns, testing headlines across formats, optimizing email send timing by segment, and dynamically surfacing content to website visitors based on firmographic profile. A Series B SaaS company visiting your pricing page for the second time should see different content than an enterprise CTO reading your thought leadership blog for the first time.
- AI for revenue attribution
Which content is actually influencing pipeline? This has been the unanswerable question in content marketing for two decades, and AI doesn't fully solve it, but it gets meaningfully closer. Multi-touch attribution models can track content consumption across the account journey and identify which assets appear consistently before deals close. Account-level engagement analysis surfaces which companies are deeply engaged with content even when they've never submitted a form, which is most of the companies that eventually become customers.
The real value of AI content marketing isn't producing more content. It's reducing the distance between content and revenue.
BREAKING NEWS: The internet doesn't need more content
AI has made content creation nearly free. A technically competent 2,000-word blog post can be produced as ai generated content in twenty minutes, but teams still need human oversight to protect quality and authenticity. A full email nurture sequence takes… an afternoon. The problem is that production scaling and attention scaling are completely decoupled. Attention has become more expensive, more fragmented, and more competitive, while supply has gone exponential.
Nobody in your target market wakes up hoping there are 10,000 more AI-generated thought leadership articles in their industry. They wake up hoping someone finally says something they haven't heard before. The biggest misunderstanding in AI content marketing is that people assume the bottleneck is writing. The real bottlenecks are distribution, differentiation, genuine audience understanding, and measurement. AI can also support search engine optimization by improving keyword research, SERP analysis, and topic clustering, which helps teams create more relevant marketing content. It just requires asking the right questions of it, rather than defaulting to "write me a blog about X."
Here are some AI marketing automation workflows that actually save time
Rather than a tool roundup, here's what high-functioning AI marketing automation actually looks like when it's working well.
Workflow 1: High-intent account detection to pipeline action
An account visits the pricing page twice in one week. The AI layer cross-references that behavior with firmographic data, CRM history, and third-party intent signals. The account clears the scoring threshold. LinkedIn retargeting fires automatically with a customer case study from the same industry vertical. The SDR receives a prioritized alert with account context already summarized, including which content was consumed, which pages were visited, and any prior CRM activity. No human had to notice the visit, judge its significance, or manually route it. The whole sequence happens in under an hour.
Workflow 2: Webinar engagement to personalized follow-up
A target account attends a webinar. AI analyzes the questions submitted, the polling responses, and the account's broader behavioral history across previous touchpoints. It generates a personalized follow-up that directly addresses the specific pain point the attendee signaled. The SDR reviews, makes any edits, and sends. The difference between this and a generic "thanks for attending" email is the difference between a reply and a delete.
Workflow 3: Pipeline stall detection to content intervention
A deal that was progressing steadily has gone quiet. No buying committee members have engaged in three weeks. AI flags the stall pattern, identifies that a key technical stakeholder has never been reached, and surfaces a content asset that has shown up consistently before deals at the same stage in the same industry closed. Marketing and sales can act on that signal before the deal officially stalls and someone has to explain it in the next pipeline review.
AI marketing automation, framed this way, isn't about replacing the SDR or the marketer. It's about compressing the time between signal and action, and making sure signals don't slip through the cracks because someone was busy with something else.
Why does orchestration matter more than individual tools?
These workflows only hold together when tools share context. A LinkedIn retargeting system that doesn't know what a prospect did on the website is optimizing with partial information. An SDR alert that doesn't include CRM history is less actionable than it should be. The value of AI automation scales with the degree to which signals across the stack are unified rather than siloed.
GTM engineering is emerging as a discipline precisely because of this. Someone has to build and maintain the connective tissue between the data layer and the execution layer. It's a technical role that didn't have a name five years ago, and it's now one of the more strategically important functions in a modern B2B marketing team.
The new B2B marketing stack: AI + intent + attribution
The modern B2B marketing stack is becoming an intelligence system with activation capabilities built on top of it, rather than a collection of tools that technically do different things.
Each layer needs to feed the next for the system to function. Data without intelligence is storage. Intelligence without activation is a dashboard nobody looks at. Activation without attribution is spending in the dark and calling it a campaign.
Why is attribution becoming decision-making infrastructure?
AI is only as smart as the feedback loop it's running on. If attribution data is wrong, the AI will confidently optimize toward the wrong outcomes. It won't know it's optimizing wrong. It'll just get faster at doing it. The failure chain looks like this: bad attribution produces wrong signals, wrong signals generate bad recommendations, bad recommendations lead to misallocated budget, misallocated budget weakens pipeline, and weak pipeline creates pressure to spend more. The system doubles down on the mistake.
In an AI-first GTM motion, attribution becomes the foundational infrastructure that tells every other system what's actually working. First-party data matters here because third-party cookies are degrading, platform-reported attribution is increasingly self-serving (every platform claims more credit than it deserves, which is the digital ad equivalent of every group project member claiming they did the most work), and the only source of truth you fully own is your own behavioral and CRM data.
Buying committee tracking and account-level analytics take on new importance in this context. Knowing that "marketing" influenced pipeline tells you something. Knowing which three stakeholders from a target account engaged with which content before a deal closed tells you what to replicate.
What most companies get wrong about AI adoption…
Most AI adoption stories follow a recognizable arc. Team gets excited about a promising tool at a conference or in a Slack community. Spends six weeks integrating it. Discovers the data it needs is incomplete, inconsistent, or locked in another system. Ends up with a platform producing confident-sounding outputs that nobody fully trusts. Tool quietly stops being used within a year.
These are the patterns that lead there most reliably.
- Buying tooling before cleaning the data. AI amplifies what it's fed. Fragmented or inconsistent data doesn't become coherent because you've added a new intelligence layer on top of it. The teams that see fast ROI from AI tools are almost always the ones who invested in data hygiene first, before they invested in intelligence.
- Expecting AI to compensate for unclear positioning. If the ICP is fuzzy or the value proposition doesn't resonate, AI helps reach more of the wrong people faster. It optimizes within the constraints given to it. Poorly defined constraints mean meaningless optimization.
- Using AI to hit content volume numbers. Producing more content isn't a useful goal. Using AI to publish more frequently without improving the quality, relevance, or distribution of what's created is adding noise to a category that's already overwhelmed with it.
- Integrating tools without integrating workflows. A platform that requires manual exports to share output with the rest of the stack isn't saving time. It's moving the bottleneck one step to the right.
- Chasing autonomous GTM before the fundamentals are solid. The industry has a lot of excitement right now about agentic marketing systems that can run campaigns end to end with minimal human oversight. Some of this is genuinely real and worth watching. Most of it is premature for teams that don't yet have reliable attribution or a consistent ICP definition, because an autonomous system optimizing toward the wrong goal gets there faster.
Fun fact: AI doesn't create competitive advantage by itself
Everyone has access to the same foundation models. ChatGPT, Claude, Gemini, Perplexity. These are commodities. Using them doesn't differentiate you. The advantage comes from proprietary data, customer understanding, distribution, positioning, and execution quality. The companies winning with AI aren't using different models. They're feeding those models better context: richer first-party behavioral data, cleaner CRM history, more precise ICP definitions built from actual deal data rather than assumptions.
AI amplifies operational maturity. A team with sharp positioning, clean data, and a well-defined ICP gets dramatically more from AI tooling than a team with better tools but weaker fundamentals. The maturity model tends to look like this:
Most teams are somewhere between Stage 1 and 2. Stage 3 is where ROI starts compounding in ways that become hard to argue with in budget reviews. Stage 4 is real but requires a foundation that very few marketing teams have built yet.
Let’s build an AI marketing strategy that won’t collapse in 3 months
An AI marketing strategy isn't a list of tools to adopt. It's a defined approach to using AI to reduce the uncertainty in the most important marketing decisions being made each quarter.
- Step 1: Identify revenue bottlenecks before buying anything. Where specifically is the pipeline breaking? What are the account identification, MQL-to-meeting conversion, deal progression, and attribution gaps? AI should solve a specific expensive problem, not be a general investment in "we need to do more with AI."
- Step 2: Centralize first-party data. CRM, website behavior, product usage, and ad engagement need to reach a state where they can be queried together. This is unglamorous work compared to buying a new intelligence platform, but it's the foundation everything else depends on.
- Step 3: Map the highest-value signals. Which behavioral and firmographic patterns are most predictive of pipeline? Pricing page revisits, champion-level engagement, content consumption in the late buying stage, repeat visits from high-ICP accounts. Define these explicitly before asking an AI system to detect them automatically.
- Step 4: Connect activation channels to the intelligence layer. The intelligence layer needs to trigger actions across LinkedIn Ads, email sequences, SDR workflows, and content delivery. If the signal can't reach the channel, nothing happens with it.
- Step 5: Measure influence rather than vanity metrics. MQLs and click-through rates don't indicate whether AI is improving GTM outcomes. Pipeline influence, deal velocity, conversion rate by segment, and budget efficiency do. Build the measurement framework before building the stack.
Quick wins worth prioritizing early: account scoring from intent signals, SDR alert automation from high-value website behavior, and multi-touch attribution to understand which channels are actually moving deals. These produce visible results within 30 to 60 days and build organizational trust for more ambitious investments.
How does Factors.ai fit into an AI-driven GTM motion?
The challenge most B2B teams face isn't access to AI. It's that the context AI needs to work effectively is scattered across too many systems that weren't built to share it.
Website activity in one tool. Ad engagement in another. CRM data somewhere else. Third-party intent signals in a separate dashboard with a login that three people share. When those systems don't share context, the intelligence each one produces is partial. Partial intelligence produces partial recommendations.
Factors.ai unifies account-level behavioral signals, including website visits, ad engagement, CRM activity, and intent data, into a single view of the buyer journey. That unified context becomes the foundation for intent-based targeting, pipeline attribution, account scoring, and AI-assisted campaign optimization.
The capabilities that matter most for an AI-driven GTM motion include visitor identification and account-level analytics (knowing which companies are engaging with your content even without form fills), LinkedIn AdPilot (connecting ad engagement to account-level pipeline impact rather than click metrics), multi-touch attribution modeling (understanding which channels and content assets are influencing deals across the full journey), intent signal tracking (surfacing accounts in active research cycles before they self-identify), and GTM workflow integration (routing high-intent signals to the right activation channels without manual intervention).
The positioning isn't "AI platform." It's unified account intelligence: the context layer that makes every other AI tool in the stack smarter.
The future of AI in marketing: agents, predictions, and autonomous execution
The debate that emerges with every major technology wave is whether it will replace the people who currently do the work. It's the same debate that surrounded spreadsheets replacing accountants, word processors replacing secretaries, and search replacing research librarians. The pattern is consistent: some tasks get automated, the role evolves, and the capabilities that were previously rare become the new baseline expectations.
As AI gets better at analysis, reporting, summarization, workflow execution, and content production, the human marketer's value concentrates increasingly in judgment, creativity, strategic positioning, and taste. These aren't soft skills or secondary concerns. They're what determine whether the AI is optimizing toward the right outcome in the first place.
Agentic AI, systems that plan and execute multi-step tasks with minimal human input, is moving from early experiment to real production in some GTM contexts. AI SDR workflows are handling initial outreach qualification at scale. Content distribution systems are beginning to make channel and timing decisions autonomously. Budget allocation tools are adjusting spend in real time based on performance signals rather than waiting for monthly reviews. The trajectory toward more autonomous execution is clear, but the decisions that precede execution remain stubbornly human: what story to tell, which problem to solve, which market to enter, what actually matters to the buyer.
What actually becomes scarce
When AI makes content production nearly free, the bottleneck shifts from creation to originality. The scarcity that emerges is genuine point of view: a specific perspective on a problem your market hasn't heard framed that way before, expressed in a way that actually changes how someone thinks rather than confirming what they already believed.
Scarce things tend to become more valuable over time. The marketers who will compound are the ones investing in developing real perspective, not just AI fluency. AI fluency is table stakes by 2026. Having something worth saying is still rare.
In a nutshell…
The teams that are winning with AI right now share a few characteristics that have nothing to do with which tools they're using. They invested in clean, unified data before buying intelligence tooling. They defined the specific decisions they were trying to improve rather than the workflows they wanted to automate. And they measure AI impact through pipeline influence and decision quality, not through content volume, tool adoption rates, or how many things in the stack have an AI badge on them.
AI amplifies what's already there. Sharp positioning, a well-defined ICP, and coherent data infrastructure become dramatically more effective when AI is layered on top. Weak fundamentals become dramatically more efficient at producing the wrong outcomes.
The biggest mistake in AI marketing adoption is treating it as an efficiency play. Efficiency is a fine outcome but a poor goal. Nobody gets promoted because they shipped 20 campaigns instead of 10. They get promoted because they generated more pipeline, made better bets, caught opportunities earlier, and allocated budget where it actually compounded. That's where AI becomes interesting: not when it helps you do more work, but when it helps you do more of the right work.
FAQs for AI in marketing
Q1. What is AI in marketing?
AI in marketing is the application of machine learning, predictive analytics, and generative models to improve how teams collect signals, prioritize decisions, and execute campaigns. In practical terms, it means systems that learn from behavioral and firmographic data to help marketing teams reach the right buyers at the right moment, without manually reconfiguring every campaign. It covers everything from account intent scoring and lead prioritization to content personalization and pipeline forecasting.
Q2. How does AI marketing automation work?
AI marketing automation layers intelligence on top of traditional workflow execution. Rather than following fixed conditional logic, AI-powered automation detects behavioral patterns, scores accounts dynamically, and triggers personalized sequences based on inferred intent. The meaningful difference from traditional automation is that AI systems improve over time as they process more data. Traditional automation stays exactly as smart as when it was originally configured.
Q3. What's the difference between automation and AI?
Automation executes rules. AI makes inferences. A traditional automation workflow fires when a predetermined condition is met. An AI-driven system detects patterns in historical and real-time data to predict what should happen next. Most tools marketed as AI today exist somewhere on a spectrum between these two, which is worth understanding before signing a contract. Asking a vendor where their product actually sits on that spectrum is a useful qualifying question.
Q4. How is AI used in B2B marketing?
In B2B, AI most commonly appears in account and lead scoring, intent-based retargeting, pipeline forecasting, multi-touch content attribution, buying committee analysis, and budget optimization. The highest-ROI applications tend to be the ones that improve prioritization decisions: helping teams focus time and budget on the accounts most likely to convert rather than treating all pipeline with equal urgency.
Q5. What is AI content marketing?
AI content marketing is using AI not just to produce content faster but to make smarter decisions about what to create, where to distribute it, and whether it's contributing to revenue. This includes topic research and search intent mapping, firmographic-based content personalization, pipeline contribution attribution, and identifying which content assets appear consistently in the buying journey before deals close.
Q6. Can AI improve marketing decision-making?
Yes, and it's arguably where the highest-value applications sit. AI improves marketing decision-making by replacing opinion-based prioritization with probability-based prioritization. Which accounts are most likely to convert? Which campaigns are influencing pipeline versus inflating click metrics? Which segments are consuming budget without producing revenue? These questions used to require analyst hours or educated guesses. AI can surface answers in near real time.
Q7. What are the best AI marketing tools for B2B companies?
The most impactful AI marketing tools for B2B tend to be intent intelligence platforms, multi-touch attribution tools, AI-assisted ad platforms, and CRM-integrated scoring systems. The right tools depend entirely on which specific decisions need to improve. The better starting point is identifying the revenue bottleneck first, then finding tooling that addresses it, rather than adopting platforms and hoping a use case emerges.
Q8. How does AI impact attribution and pipeline measurement?
AI makes attribution more granular by processing signals at a scale and speed that human analysts can't match. It tracks multi-touch influence across channels, identifies content contributions that never triggered a direct conversion event, and surfaces account-level engagement patterns that predict deal progression. In an AI-driven GTM motion, attribution isn't just a reporting function. It's the feedback loop that tells every other system in the stack what's actually working.
Q9. Is AI replacing marketers?
It's replacing specific tasks: manual reporting, basic content production, workflow execution, and routine data analysis. The work that compounds in value, deciding what story to tell, which market to enter, what buyers actually care about, and why a competitor's positioning is winning, requires judgment that models can't replicate at the level of someone with genuine domain expertise and market context. The marketers most at risk are those whose entire output is executing tasks that AI now does faster and cheaper.
Q10. What data does AI marketing need to work effectively?
First-party behavioral data (website visits, content engagement, product activity), CRM data (deal history, contact activity, stage progression), ad engagement data (impressions, clicks, view-through patterns), and firmographic data (company size, industry, tech stack, and buying signals). Clean, unified data consistently outperforms sophisticated AI built on fragmented or inconsistent inputs. Auditing the quality of existing data before purchasing AI tooling is almost always worth doing.
AI marketing case studies: real examples, campaigns, and lessons for B2B marketers
Read about real-world B2B AI marketing case studies. See how top revenue teams use predictive models, intent signals, and agentic workflows to drive pipeline.
TL;DR
- AI in marketing has moved from creative experimentation to operational infrastructure, and the teams winning aren't the ones posting the most AI-generated content.
- The most valuable AI marketing implementations connect signals to revenue: intent data, attribution, audience targeting, and pipeline intelligence.
- B2C campaigns like Spotify Wrapped and Sephora's beauty advisor get the press, but the B2B playbook looks more like Gong, 6sense, and Factors.ai than Coca-Cola's holiday ads.
- Most AI implementations fail not because of the technology but because of weak data quality, no attribution visibility, and zero governance.
- The teams that'll win long-term are building AI as infrastructure, with humans firmly in the strategy seat.
Most AI marketing case studies are basically the same story wearing different clothes. A brand uses ChatGPT. A marketer generates 47 LinkedIn posts before breakfast. Someone creates an AI image of a dinosaur eating tacos.
The campaign gets featured in three newsletters, two podcasts, and one conference presentation titled How We Reimagined Marketing With AI.
Wonderful!!!
Meanwhile, somewhere else, a RevOps team quietly figures out which accounts are actually ready to buy, an attribution model uncovers a hidden revenue pattern, and a campaign automatically shifts spend away from people who love clicking ads and toward people who occasionally enjoy purchasing things.
One of those stories gets a standing ovation… the other one gets a budget increase. Guess which one I'd rather have.
The problem with most AI coverage is that it focuses on the visible stuff. Content generation. Images. Videos. Copywriting. Those are useful applications, sure. They're also the easiest ones to spot.
The more interesting AI stories tend to happen behind the scenes.
They show up when a sales team calls the right account at the right moment. When marketing finally figures out which channels are creating pipeline instead of just creating dashboards. When buying signals get detected early enough to matter. When decisions happen faster because someone connected the dots before a human had to.
That's where most of the value lives.
And that's what makes AI marketing case studies worth studying.
Not because they show us what's possible.
Because they show us where the money actually is.
In this guide, we'll look at AI marketing examples from both B2B and B2C companies, unpack what they did, what worked, what didn't, and why some AI projects become revenue engines while others become conference talks.
What counts as an AI marketing ‘case study’?
I know this is a weird section in the blog, but stay with me.
There's a BIG difference between "we used AI" and "AI changed how we operate." The first camp includes every company that ran a copy batch through ChatGPT and called it a workflow. The second camp is much smaller, much more interesting, and frankly much harder to find good writing about.
For the purposes of this article, a real AI marketing case study means a company identified a problem, deployed an AI system or workflow to address it, changed something operationally as a result, and produced a measurable outcome. The bar isn't high, but it does rule out "we made an AI ketchup ad and it went viral on Twitter."
There are four types of ai technologies doing meaningful work in marketing right now. Generative AI handles content creation, ad creative, and personalization at scale, and it can produce text, visuals, audio, video, and code to support marketing content, including image generation, personalized ad copy, and automated service responses. Predictive AI powers lead scoring, churn modeling, and demand forecasting through data analysis that can analyze vast amounts of customer data, reveal individual behaviors and preferences, improve customer segmentation, and drive personalized recommendations. Conversational AI shows up as chatbots, qualification flows, and real-time sales assistance, where it can also mirror some guidance traditionally handled by human support during customer interactions. Agentic AI is the newest category, where AI systems execute multi-step workflows autonomously, from audience building to campaign orchestration, with minimal human intervention.
Most of the flashy case studies you'll see are generative. Most of the money being made is predictive and agentic.
Here’s why you should care about AI marketing case studies
The experimentation phase is over (not sure if I should say, thankfully?! or unfortunately?!... you decide).
AI budgets have moved from the ‘innovation fund’ line item to the operational budget, which means teams are now accountable for ROI, not just novelty. According to a CoSchedule report, marketers using AI are 25% more likely to report measurable success than those who don't. CMOs aren't asking "should we try AI?" anymore. They're asking "why isn't our AI investment showing up in pipeline?"
The pressure has stacked up, and HOW. Teams are expected to produce more content with the same headcount, personalize buyer journeys that span weeks and multiple channels, prove attribution on every dollar across their marketing efforts, and reduce CAC in a market where CPCs keep climbing. Deployed well, AI can improve marketing efficiency and drive a 10-25% increase in return on advertising investments. AI was supposed to solve all of this. For some teams, it has. For many, it's just created a new category of mess.
Gartner has tracked AI's growing share of marketing budgets for several years now, and the numbers keep moving upward. But what's more telling than the budget allocation is where AI is actually being embedded: inside CRM workflows, inside ad platform bidding systems, inside attribution dashboards, inside the customer journey itself. The question has shifted from "are you using AI?" to "how deeply is AI woven into how you go to market?"
The rise of AI agents in B2B GTM is probably the biggest shift of the last 18 months. These aren't chatbots. They're systems that can identify a high-intent account, trigger a personalized outreach sequence, update the CRM record, adjust LinkedIn bid strategy, and flag the account for SDR follow-up, all without a human making each individual decision. The real value isn't in shaving five minutes off a task. It's in compressing the gap between a signal appearing and a revenue action happening.
The most common use cases of AI in marketing
Before getting into individual case studies, it's worth mapping the landscape clearly. Here's where AI is actually being applied, what it does, and where you'd see it in the wild:
For B2B teams specifically, the highest-leverage applications tend to cluster around three things: knowing which accounts are ready to buy, reaching those accounts with precision across channels, and connecting your marketing activity directly to pipeline so you know what's working. Platforms like Factors.ai are built around exactly this combination, bringing visitor identification, account intelligence, attribution, and ad activation into one connected workflow.
AI marketing case studies and campaign examples
- Factors.ai: multi-touch attribution and AI audience activation
This one gets its own deeper treatment because the workflow is instructive rather than just impressive.
The problem most B2B marketing teams face is that the data lives in disconnected systems: ad platforms, website analytics, CRM, product usage, intent tools. You can't see the complete buyer journey because no single system has the full picture.
Factors.ai connects those systems and then adds two capabilities that change what's possible. The first is account-level attribution, understanding which channels, campaigns, and content pieces are actually contributing to pipeline, not just last-click conversion. The second is AI-powered audience activation, using behavioral signals from your own data (which accounts are visiting high-intent pages, which companies are engaging with your LinkedIn content, which firms match your best customer profile) to build dynamic ad audiences that update automatically.
In practice, this looks like: a target account visits your pricing page twice in one week, Factors.ai detects the signal, adds that account to a LinkedIn campaign targeting the buying committee, the SDR gets a notification to prioritize outreach, and the attribution model records how the marketing touches contributed when the deal eventually closes. All of this happens as a connected workflow rather than a series of manual processes.
The positioning that resonates here is simple: AI is only as useful as the data and workflows it's connected to. A standalone AI tool producing content or scoring leads in isolation is dramatically less valuable than AI that's wired into your attribution, your ad activation, and your pipeline visibility.
AI-powered ABM campaign orchestration
This is a composite example based on how the most sophisticated B2B teams are running account-based campaigns in 2026, and it's worth walking through because it illustrates what agentic AI actually means in practice.
The workflow starts with intent signal detection: which target accounts are showing elevated research activity, visiting competitor sites, or engaging with content in your category. That signal triggers an account enrichment process that pulls in firmographic data, identifies the likely buying committee, and segments accounts by ICP tier and buying stage.
From there, the system builds dynamic LinkedIn audiences from the identified buying committee contacts and pushes them into active campaigns. Simultaneously, it triggers personalized outreach sequences from SDRs, pre-populated with account-specific context. The CRM records are updated in real time as engagement happens. When a campaign's performance drops for a specific audience segment, the system adjusts bids, refreshes creative, or shifts budget automatically.
A human designed the workflow and approved the guardrails. The AI executes the individual steps. The result is a campaign that responds to signal in near real-time rather than waiting for a quarterly review cycle.
- HubSpot's AI content assistant
HubSpot embedded AI writing assistance directly into its marketing and CRM tools, allowing users to generate first drafts of emails, landing pages, social posts, and blog content within the platform they already work in.
The adoption curve here was notably different from standalone AI tools. Because the AI was embedded in the existing workflow, the friction to use it was near zero. Teams didn't need to switch contexts or learn a new tool. They just had a "generate" button where they used to start from scratch.
Takeaway for marketers: AI adoption at scale requires workflow integration, not just capability availability. If your team has to open a separate browser tab to use the AI, most of them won't.
- Salesforce Einstein
Salesforce has been investing in AI under the "Einstein" umbrella for nearly a decade, but the more recent versions are doing genuinely useful things in areas like opportunity scoring, forecasting, and automated CRM data enrichment.
The forecasting capability is probably the highest-value use case for B2B revenue teams. Instead of reps manually updating pipeline confidence, Einstein analyzes activity patterns, historical data, and deal characteristics to produce more accurate forecast numbers. Which is useful, because if you've ever sat in a forecast call where everyone is eyeballing their own deals, you know how unreliable that process is.
Takeaway for marketers: AI's value in the revenue stack isn't always customer-facing. Some of the best applications are internal, making your own team's judgment more accurate and your pipeline more predictable.
- LinkedIn's AI ad optimization
LinkedIn has built increasingly sophisticated AI into its Campaign Manager, including predictive audience expansion, which automatically finds additional accounts likely to convert based on your existing campaign performance.
This matters for B2B marketers specifically because LinkedIn's audience data is uniquely valuable: firmographic data, job titles, seniority, company size, and professional interests that other platforms can't match. When AI works with that data to optimize targeting, the efficiency gains compound quickly.
The quality of LinkedIn data is also why first-party data syncing matters so much. If you can push your own high-intent account lists into LinkedIn for targeting, using something like Factors.ai's audience sync, you're not just relying on LinkedIn's targeting alone. You're combining your behavioral signal with their network reach.
- Adobe Firefly for enterprise creative production
Adobe Firefly brought generative image and video creation directly into the Creative Cloud ecosystem, giving enterprise creative teams the ability to generate on-brand assets at scale without going outside their existing toolchain.
For large organizations managing dozens of campaigns simultaneously, with different regional versions, A/B tests, and channel-specific formats, the production efficiency gains are substantial. Creative teams can spend more time on strategy and less on resizing banners.
Takeaway for marketers: At enterprise scale, creative production is often the bottleneck between a good idea and a live campaign. AI that integrates directly into production workflows removes that bottleneck without requiring a change in how teams think about creative work.
- Drift's conversational marketing
Drift essentially created the conversational marketing category and has remained one of the more interesting case studies in AI-powered pipeline acceleration. The core use case is replacing static forms with dynamic conversations that qualify visitors in real time and route them to the right next step.
The shift from form to conversation matters more than it might seem. Forms are a commitment. A conversation is a dialog. The psychological friction of filling out a form versus answering a few questions is meaningfully different, and the data quality from a conversation tends to be higher because you can ask follow-up questions based on what the person just said.
Takeaway for marketers: Pipeline velocity is often a qualification and routing problem. AI can compress the time from first visit to first qualified conversation considerably.
- Gong's AI revenue intelligence
Gong processes recorded sales calls and uses AI to surface patterns, deal risks, and coaching opportunities. It's one of the clearest examples of AI creating a genuine competitive advantage in B2B sales.
Before tools like Gong existed, sales leaders had essentially no visibility into what was happening in conversations. You'd see CRM notes, which were often incomplete or biased, and you'd know whether deals closed. Gong closes that gap by analyzing what's actually being said, which competitor keeps coming up, which objections are recurring, and which reps' language patterns correlate with higher win rates.
Takeaway for marketers: The signal you need to improve your marketing messaging is often sitting in your sales calls. AI analysis of conversation data is one of the fastest ways to close the gap between what marketing thinks customers care about and what they actually say they care about.
- 6sense's predictive intent targeting
6sense built its platform around a core bet: that buying intent can be detected and predicted before an account ever fills out a form or talks to sales. The platform aggregates third-party intent signals, first-party behavioral data, and firmographic information to identify accounts that are in an active buying cycle.
For B2B demand generation, this changes the game considerably. Instead of running broad awareness campaigns and hoping the right people see them, you can concentrate budget on accounts that are demonstrably in-market right now. The math on that is significantly better.
Takeaway for marketers: Timing is probably the most underrated variable in B2B marketing. Reaching the right account at the wrong moment in their buying journey is nearly as ineffective as reaching the wrong account entirely.
B2B AI marketing case studies we should look at closely
B2C campaigns get more coverage because they're more visible and more shareable. But the operational intelligence built into B2B AI implementations is often considerably more sophisticated.
AI-driven personalization is one of the clearest patterns across high-performing B2B and B2C examples.
The pattern across the strongest B2B implementations is consistent: they don't treat AI as a ‘content tool’. Instead, it’s being treated as a signal processing and activation layer that sits between data and revenue action. McKinsey reports that companies using this approach capture 5 to 15 percent incremental revenue and improve marketing-spend efficiency by 10 to 30 percent. The same research also found that fast-growing companies generate 40% more of their revenue from personalization than slower-growing competitors.
What does successful AI marketing campaigns have in common?
Looking across these examples, five patterns emerge consistently in the implementations that actually moved metrics.
- Strong first-party data. Every high-performing AI implementation in this list was built on top of well structured data, not just a large volume of first-party inputs. The AI is only amplifying what your data knows. If your data is weak, your AI outputs will be too.
- Clear, defined workflows. The teams that succeeded didn't deploy AI as a general capability and hope for the best. They identified specific processes, mapped the workflow, and built AI into specific steps. "Use AI for marketing" is not a workflow. "Use AI to identify high-intent accounts daily and update LinkedIn audiences automatically" is a workflow.
- Human oversight at the strategy layer. In every case study that worked, humans remained in control of the creative brief, the strategy, the ICP definition, and the messaging framework. AI executed within those parameters, with human expertise and human creativity guiding the decisions, not just human oversight. The teams that got into trouble were the ones that tried to automate the strategy itself.
- Direct connection to revenue metrics. The implementations that earned continued investment were the ones that could show pipeline influence, CAC improvement, campaign effectiveness, or higher conversion rates. Vanity metrics didn't survive the budget scrutiny. Pipeline impact did.
- Fast experimentation loops. The best AI marketing teams are running considerably more experiments than their competitors, because AI reduces the cost of each experiment. But they're also reviewing results more frequently, updating their approach, and building a culture of continuous improvement. In practice, companies that use AI-driven personalization capture 5 to 15 percent incremental revenue and 10 to 30 percent efficiency in marketing spend, while dynamic personalization can cut content creation costs by up to 30-50%, reduce launch time by half, and lift sales conversions by more than 20-30%. The advantage is speed of learning.
Here’s where most AI marketing implementations fail
Here's the part that most "AI is amazing" articles skip over. Most AI marketing implementations underperform or fail entirely. Understanding why is at least as useful as studying the successes.
- Using AI without a strategy. AI can generate a hundred LinkedIn posts in an hour. That's not a marketing strategy. Teams that deployed AI primarily to increase output volume without clarifying what they were trying to achieve ended up with more content that performed worse because it lacked the specificity and strategic intent that makes content actually convert.
- Producing AI content without editing. The volume of low-quality AI-generated content online has reached a point where readers have developed a fairly reliable detector for it, even if they can't always articulate why something feels off. "AI slop" is a real category now, and publishing it unedited damages brand credibility in ways that are hard to recover from.
- No attribution visibility. Running AI-optimized campaigns without attribution tracking is a common mistake. You don't actually know if the AI is making the right decisions if you can't trace outcomes back to the specific inputs. Without attribution, AI optimization can look like it's working when it's actually chasing proxy metrics.
- Too many disconnected tools. The average B2B marketing stack has grown considerably over the last five years. Adding AI tools on top of an already fragmented stack without integrating them into a coherent workflow creates more complexity without more clarity. The data still lives in silos. The outputs still need to be manually assembled.
- Weak data quality feeding into AI systems. If your CRM has inconsistent firmographic data, your AI lead scoring will reflect those inconsistencies. If your attribution model has significant gaps in the buyer journey it can track, your AI spend recommendations will be biased toward whatever touchpoints are visible. Garbage in, garbage out is not a new concept, but AI makes the consequences more visible and more consequential.
- No governance. This is particularly relevant for content-producing AI applications. Teams that don't have clear guidelines about what AI can generate, what requires human review, and what can be published directly are accumulating quality risk that eventually shows up as a brand problem.
How B2B teams can build their own AI marketing workflow
A practical sequence for implementing AI in a way that actually connects to revenue:
Step 1: Centralize first-party data so you can integrate AI into existing marketing processes. Before adding any AI tool, make sure you can actually see your buyer journey instead of layering tools on top of silos. That means connecting your website analytics, ad platforms, CRM, and any product usage data into a system where you can track account-level behavior across touchpoints. Centralized customer data also makes customer segmentation and personalized recommendations more useful. Tools like Factors.ai are designed specifically for this.
Step 2: Define your ICP and buying signals clearly. What does a good account look like at firmographic, technographic, and behavioral levels? What actions on your website or with your content indicate genuine buying intent? AI can help you identify these patterns once you have enough data, but you need to start with a hypothesis.
Step 3: Layer AI into the repetitive, rules-based parts of your marketing processes. Audience updates, lead scoring refreshes, bid adjustments, content briefs, first-draft emails — these are all good candidates for AI automation because they follow consistent patterns and have measurable outputs, and they can be automated without replacing creative direction.
Step 4: Connect AI outputs to attribution. Every AI-driven action should feed into your attribution system so you can evaluate what's actually contributing to pipeline. This is how you separate AI implementations that are working from ones that are generating activity without revenue impact.
Step 5: Build human QA into the workflow. This step is about spot-checking regularly, having clear escalation paths when AI outputs fall outside expected parameters, maintaining editorial standards for anything that goes externally, and using quality control backed by human expertise.
Step 6: Measure pipeline impact, not activity. MQL volume, content downloads, and ad impressions are proxies. Pipeline influenced, CAC by channel, and revenue attributed to specific campaigns are the metrics that tell you whether your AI investment is compounding or just running in place, and this measurement discipline gives the marketing organization a competitive edge.
How Factors.ai fits into AI-driven marketing operations
The modern B2B marketing stack has a structural problem: the data about who's engaging with your brand lives in one place, the data about what's happening in pipeline lives in another, and the tools you use to activate audiences in paid media live somewhere else entirely.
Factors.ai was built to close those gaps. The platform identifies anonymous website visitors at the account level, which means your marketing team can see which companies are engaging with your site even before they fill out a form. It layers in multi-touch attribution that traces account engagement across paid, organic, and direct channels so you understand what's actually influencing pipeline, not just what's getting last-click credit.
The AI-powered account scoring uses your own first-party behavioral data to identify which accounts are showing genuine buying intent, updating dynamically as behavior changes. And the audience activation capability syncs those intent-based audiences directly to LinkedIn and Google, so your paid campaigns are always targeting the accounts most likely to convert.
In the agentic workflow example described earlier, Factors.ai is effectively the intelligence layer that makes the orchestration possible. It's where the signal lives, where the audience logic is defined, and where the attribution gets tracked. Just so you know… the AI isn't replacing your marketing team's judgment. It's giving that judgment better information to work with and automating the execution of decisions already made.
Here’s what the future of AI marketing campaigns looks like…
The trajectory is reasonably clear even if the timeline isn't. AI agents that can execute complete GTM workflows autonomously, adjusting strategy based on real-time performance data, are coming for the manual parts of demand generation. Conversational search is changing how buyers find vendors, which means discovery on every major ai platform and content optimized for LLM citation are becoming as important as content optimized for Google ranking. At the same time, ai assistants will handle more of the repetitive work inside marketing systems. Synthetic audience testing, running creative and messaging experiments against AI-simulated segments before spending real budget, is emerging as a capability at the enterprise level.
That also means media coverage and authoritative mentions will matter more for brand visibility across AI-driven discovery surfaces.
I’d say that the interesting prediction is that the job description will shift considerably. Campaign execution becomes system configuration. Channel management becomes workflow architecture. Marketing teams will increasingly rely on ai assistants for execution while people retain strategic control. The marketer who understands how to design and govern an AI-driven GTM system will be more valuable than the one who's manually executing the same tasks faster.
What won't change is the premium on strategic judgment, creative thinking, and genuine customer understanding. AI can optimize toward a metric. It can't decide which metric matters, understand why a customer actually buys, or generate the kind of insight that comes from sitting in a room with a prospect and really listening.
The Original Tamale Company showed how fast this can move by using AI to create a viral video that generated more than 22 million views and 1.2 million likes in three weeks.
Trust will also become a differentiator as AI-generated content becomes more common and easier to identify. The brands that maintain genuine human perspective and intellectual honesty in their marketing will stand out more, not less, as the baseline quality of AI content increases.
In a nutshell…
The winning AI marketing teams in 2026 aren't necessarily the ones using the most AI tools. They're the ones that connected AI to first-party data and actual revenue metrics, built feedback loops that update fast, kept humans in the strategy seat, and resisted the temptation to automate the parts of marketing that require genuine judgment.
The teams that are struggling are often the ones that treated AI as a content factory, measured output volume instead of pipeline contribution, and skipped the data infrastructure work that makes AI actually accurate.
Just to reiterate… AI is NOT replacing marketing strategy (PLEASE). It's making it more obvious which teams had a real strategy to begin with... and which ones were mostly hoping that more activity would eventually turn into revenue.
FAQs for AI marketing case studies
Q1. What are the best AI marketing case studies in 2026?
The most instructive ai marketing case studies for 2026 are the ones built around operational artificial intelligence rather than creative stunts. Factors.ai's account-level attribution and audience activation, 6sense's predictive intent targeting, Gong's revenue intelligence, and Spotify Wrapped's data storytelling represent different dimensions of what high-performing AI marketing actually looks like. For B2B teams specifically, the 6sense and Factors.ai examples are most directly applicable.
Q2. Which companies are using generative AI for marketing?
Practically every major brand at this point, but with varying degrees of strategic depth. Coca-Cola, Adobe, BMW, HubSpot, and Heinz have run notable generative AI campaigns or integrated generative capabilities into their marketing workflows, and common use cases also include generating product descriptions much faster for SEO and content operations. In B2B, HubSpot's AI content assistant and Adobe Firefly's integration into enterprise creative workflows are the most widely adopted examples.
Q3. What are the most common use cases of AI in marketing?
The highest-adoption use cases are AI ad bidding and optimization (Google Performance Max, Meta Advantage+), AI-assisted content creation, predictive lead scoring, and personalization engines. For B2B specifically, the fastest-growing use cases are intent data and account scoring, AI-powered attribution, and audience automation for paid campaigns.
Q4. How is AI used in B2B marketing?
B2B AI marketing is predominantly about intelligence and efficiency rather than creative production. The most common applications are identifying which accounts are in-market through intent signals, automating audience building for ABM campaigns, improving attribution visibility across long and complex buyer journeys, using conversation intelligence to improve messaging and sales coaching, and reducing the manual work involved in campaign management and CRM maintenance. In practice, AI is embedded across daily B2B workflows and supports core marketing processes such as targeting, personalization, and data analysis.
Q5. What are examples of successful AI marketing campaigns?
Spotify Wrapped is arguably the most effective annual AI marketing moment across any industry. In B2B, 6sense's approach to predictive demand capture and Factors.ai's account intelligence platform represent successful operationalized AI. For brand campaigns, Heinz's AI ketchup experiment generated disproportionate earned media for its simplicity, and Nutella's unique packaging generated both earned media and immediate sellout.
Q6. How are companies using AI for personalization?
Personalization applications range from Netflix's recommendation engine (80% of content watched is recommendation-driven) to Starbucks' behavioral prediction for loyalty offers to B2B website personalization that shows different content to different account types. The common thread is using behavioral data to infer what each individual user or account is most likely to want next, and then serving that proactively.
Q7. What is an AI-driven marketing campaign?
An AI-driven marketing campaign is one where AI influences decisions throughout the campaign lifecycle, not just at the content creation stage. That means AI is informing audience selection, bid strategy, creative testing, personalization logic, attribution measurement, and optimization in near real-time. The campaign adapts based on data rather than waiting for human review at fixed intervals.
Q8. Can AI improve marketing ROI?
Yes, with caveats. The teams seeing the strongest ROI from AI are the ones with clean first-party data, clear attribution systems, and AI embedded in specific high-leverage workflow steps. Teams that deployed AI without those foundations often found that it increased activity volume without improving conversion quality or pipeline contribution.
Q9. What are the risks of using AI in marketing?
Brand risk from low-quality AI content published without human editing, attribution risk from AI systems optimizing toward visible metrics while missing the full buyer journey, data quality risk from AI amplifying existing CRM or audience data errors, and governance risk from moving too fast without clear review processes. The legal and compliance dimension is also evolving, particularly around AI-generated content disclosure and data privacy in personalization systems.
Q10. How does AI help with attribution and pipeline tracking?
AI improves attribution by processing signals across more touchpoints than manual methods can handle, identifying statistical patterns that predict conversion, and updating attribution models dynamically as buyer behavior changes. Platforms like Factors.ai use AI to connect account-level behavioral data across your website, paid channels, and CRM to give you a more complete view of what's actually contributing to pipeline, not just what's generating clicks.
Q11. What tools are commonly used for AI marketing?
The tools vary significantly by use case. For content, HubSpot AI, Jasper, and Adobe Firefly are widely used. For demand generation and intent, 6sense and Bombora are the category leaders. For attribution and account intelligence, Factors.ai is the platform most specifically designed for the B2B GTM use case. For revenue intelligence, Gong and Clari are the established players. For conversational marketing, Drift and Intercom's AI capabilities are the most mature.
Q12. How does Factors.ai use AI in marketing workflows?
Factors.ai applies AI across three main workflow areas: identifying anonymous website visitors at the account level and scoring them by buying intent, connecting touchpoints across paid channels and owned properties to produce accurate multi-touch attribution, and activating AI-built audiences directly to LinkedIn and Google for paid campaigns. The platform is designed specifically for the B2B use case where the buyer journey is long, multi-stakeholder, and often invisible until late in the cycle. Organizations tend to get better results when the system is ai trained on their own data and workflows, and marketers using AI are 25% more likely to report measurable success.

We don’t just write about demand gen. We deliver it.
Our AI Agents help you uncover high-intent accounts, run campaigns that actually convert, and keep your GTM motion in sync.
1000+ GTM teams have already scaled their pipeline with Factors.
*Includes built-in peace of mind. And fewer late-night funnel audits.

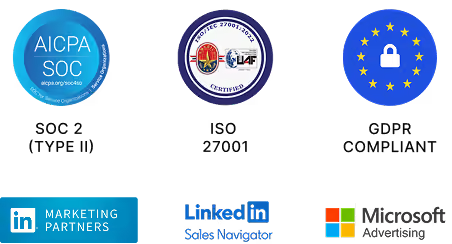
.svg)



.avif)


