.svg)


HockeyStack Pricing, Overview & Comparison
Looking to learn more about HockeyStack’s pricing, features, and comparisons? You’re in the right place. This article is the product of raiding the internet to highlight everything you need to know about HockeyStack. Let’s jump in.
What is HockeyStack?
HockeyStack is a B2B analytics & attribution platform that integrates with your ads, website, CRM, and more to identify how campaigns and content are influencing conversions across the customer journey. Here’s a quick breakdown of what HockeyStack offers:
- Multi-touch attribution
- Website analytics
- Predictive analytics
- IP-identification
- Unified tracking across campaigns, website, CRM, etc
- Goals, funnels, and segment tracking
- Account-based customer journeys
- Custom dashboards and reports
- Surveys
- LinkedIn Impression tracking
HockeyStack Pricing
[December 2023 Update] HockeyStack has recently revised its pricing to $1399/mo for up to 10,000 unique visitors. Here's a breakdown of what HockeyStack's growth plan includes on time of writing:

[Aug 2023 Update] HockeyStack’s pricing plans start at $949/mo for up to 10,000 unique website visitors and 10 seats. This starting price is somewhere between Dreamdata ($599/mo) and Infinigrow’s ($1,500/mo) starting plans. Not the cheapest or the most expensive attribution solution out there.
As with most products in this category, HockeyStack pricing is based on the volume of traffic or users you’re tracking. You’ll have to request a demo to find the exact commercials for your business.

{{INLINE_CTA_A}}
HockeyStack Reviews
Generally, HockeyStack is well rated for its wide range of customization but a few reviews find HockeyStack marginally unintuitive and relatively unrefined.


HockeyStack Alternatives
Here’s a quick list of leading HockeyStack alternatives for your consideration. Looking for an in-depth analysis of the strengths and limitations of these options? Read on here: Top 7 HockeyStack alternatives
- Factors.ai
- Dreamdata
- Adobe Marketo Measure (Bizible)
- Attribution App
- Ruler Analytics
- Calibermind
- FullCircle Insights
HockeyStack Comparison: Why Factors Over HockeyStack
HockeyStack is great at what it does. It provides robust attribution functionality, a wide range of customizations and integrations, and well-reviewed customer support. That being said, when compared to a similarly priced attribution product like Factors, HockeyStack seems to fall short in terms of features, usability, and cost-effectiveness.
Accordingly, here are three reasons why Factors may make more sense for you:
1. Product features
In addition to the standard attribution and analytics features shared by both solutions, Factors delivers a wide range of features to help GTM teams refine customer journeys and drive conversions. Mainly:
1. LinkedIn and G2 Intent signals: While both tools offer IP-based account identification, Factors captures intent signals across website, LinkedIn impressions, AND G2 engagement. This means that you can identify anonymous accounts and track their cross-channel engagement more holistically.

In addition, Factors integrates with MAPs, LinkedIn, and more via Webhooks to activate trigger-based actions. This includes automated LinkedIn matched audience list building, automated mail sequence activation based on engagement and intent signals & more.
{{INLINE_CTA_A}}
2. Path analysis for aggregated customer journey mapping

3. Account scoring Factors empower tailor-made account scoring configurations based on engagement across website, LinkedIn impressions, and G2 so teams can qualify and prioritize high-intent accounts accurately.
4. Anomaly detection and real-time alerts via mail, Slack or MS Teams

2. Usability
Factors and HockeyStack are both among the most customizable B2B attribution solutions out there. The ability to customize KPIs, properties, dashboards, and events is extremely valuable for teams looking to tailor their reporting for their business-specific requirements.

That being said, users find Factors to be user-friendly and conducive to self-service. Fortunately, both solutions provide comprehensive onboarding support and customer success management, so you should still be able to derive great value from either one. Still, user experience and product usability is something to keep in mind when making a purchase decision.

3. Cost-effectiveness
Finally, we arrive at cost. While HockeyStack plans start at $950 [As of Dec 2023, HockeyStack pricing has been revised to $1399/mo] for up to 10,000 monthly visitors, Factors offers a much lower barrier to entry with paid plans starting as low as $99/mo. Moreover, Factors provides a free plan to get you started with our basic offerings.
Learn more about Factors pricing here: www.factors.ai/pricing
Overall, Factors is the more cost-effective option for early-stage teams looking to start out their marketing analytics and attribution journey. Given the additional features discussed above, it's more bang for your buck than other alternatives, including HockeyStack.
Looking to see if Factors would make the right fit for your attribution needs? Book a demo with us today!
{{INLINE_CTA_A}}
HockeyStack is a robust B2B analytics and attribution platform known for features like multi-touch attribution, website analytics, predictive analytics, and unified tracking across platforms. As of December 2023, its pricing begins at $1,399 per month for up to 10,000 unique visitors. While it's appreciated for its high level of customization, some users report that the platform can be less intuitive compared to others. For businesses exploring alternatives, options include Factors.ai, which offers revenue attribution and account intelligence; Dreamdata, known for customer journey insights; Adobe Marketo Measure (formerly Bizible), which emphasizes touchpoint-based modeling; and Attribution App, focusing on multi-channel attribution. Other noteworthy alternatives are Ruler Analytics, integrating marketing and sales data; Calibermind, offering buyer journey analytics; and FullCircle Insights, which aligns marketing and sales performance metrics. These platforms cater to varying business requirements in terms of features and pricing.
Pixel vs Account-based LinkedIn Retargeting
B2B marketing teams invest significantly across campaigns and content to drive qualified website traffic. However, benchmarks find that only about 2% of this traffic actually converts, with the majority of visitors simply bouncing off or browsing anonymously on the website.
Retargeting the remaining 98% of visitors via LinkedIn has proved to be an effective strategy to recapture interest from anonymous website traffic. While we won’t cover the specific benefits of LinkedIn retargeting here, this case study summarizes how Sage successfully leveraged LI retargeting to:
- Generate 700,000 impressions in 6 weeks
- Improve lead generation by 4x
- And reduce cost-per-lead (CPL) by 80%
Simply put, LinkedIn retargeting works.
LinkedIn retargeting relies on the LinkedIn Insight tag (aka LinkedIn Pixel) to match website visitors with LinkedIn audiences.
The LinkedIn insight tag is a simple piece of code placed on a website to help optimize campaigns. While the LinkedIn Pixel serves many functions, including conversion tracking and demographic insights, it’s challenged by shortcomings around website retargeting.
While LinkedIn Pixel works to some extent, we have found an alternate approach that can take your retargeting campaigns to the next level, also known as account-based retargeting. Account-based retargeting works by identifying, qualifying, and targeting anonymous accounts, as opposed to individual users visiting a website. Using a combination of identifiers, account-based retargeting has been shown to deliver:
- Larger, account-level audiences
- Improved match rate accuracy
- Better segmentation and targeting
And the results? Well, they speak for themselves:
While the LinkedIn Pixel is a must-have solution given its wider functionality, we explore the limitations of Pixel-based retargeting and why Account-based retargeting is an effective alternative ⬇️
Limitation #1 - Match rates
The LinkedIn Pixel works by placing a cookie in visitors’ browsers, so when a LinkedIn user lands on your website, they may be identified and retargeted on LinkedIn. Note that this cookie-based identification takes place at a device and browser level for individual users. This means that, for the Pixel to match a website visitor to a LinkedIn user, the visitor must meet all 4 of the following criteria:
- Be an active member of LinkedIn
- Explicitly accept cookies on the website
- Use the same device (phone/laptop/tablet) to visit the website and LinkedIn
- Use the same browser (chrome/firefox/safari) to visit the website and LinkedIn
While a few visitors will probably fit this criteria, audience match rates via the Pixel are limited by the fact that the majority of traffic either doesn’t use LinkedIn, rejects cookies, or, most commonly, uses different devices/browsers for product research and LinkedIn browsing.
In fact, only about 42% of B2B product research involves mobile touch points — with the majority of B2B buyers choosing to conduct their research on desktops. On the other hand, a whopping 80% of LinkedIn engagement is via mobile. This is not surprising, given that LinkedIn is primarily a social networking app.
And so, despite the fact that LinkedIn Pixel works as designed, its match rates tend to be relatively poor, given the practical realities of B2B user behavior.
The limitation: Low match rates as a result of limited, cookie-based matching mechanisms by the LinkedIn Pixel.
How Account-based Retargeting helps
The LinkedIn Pixel relies exclusively on cookie-based tracking to create its matched audiences. Factors, on the other hand, leverages a combination of three identifiers — IP address, advertising ID, and cookies, to triangulate a data connection and match anonymous traffic to a company.
Factors connects with over 4.2B+ IP addresses and 65M+ company profiles (in addition to cookies and ad IDs) to accurately identify which accounts are visiting your website. Note that this is regardless of whether the visitor in question is a member of LinkedIn, uses different browsers, etc.
In fact, Factors can also identify remote companies by initially cookie-ing people using their corporate IP address to then re-identify them when they work remotely. To further explain how Factors achieves industry-leading match rates, here’s Viral from 6sense, one of our data partners:
“As a person moves around, their IP address changes. The platform adjusts for these changes by pulling in several additional markers to help match signals to an account. Now, with more variations in IP address data as remote working spreads across industries, our Graph deploys available secondary marker information, like cookies and mobile advertising IDs, to triangulate data connections. The Graph uses additional markers to sift through the noise so that confidence in the match rate remains consistent. Given the amount of signals we track, we don’t map every signal all the time, but we have observed accuracy over 85%.”
- CTO Viral Bajaria, 6sense, Data Partners
💡Build Better LinkedIn Retargeting Audiences with Factors
Limitation #2 - User-level targeting
B2B buying decisions are rarely made by a single person. The typical buying committee comprises almost a dozen people from multiple departments and time zones. Selling a SaaS product today might involve gaining buy-in from multiple C-suite executives, individual stakeholders from operations to sales to marketing, and a chief revenue officer – along with legal and implementation teams.
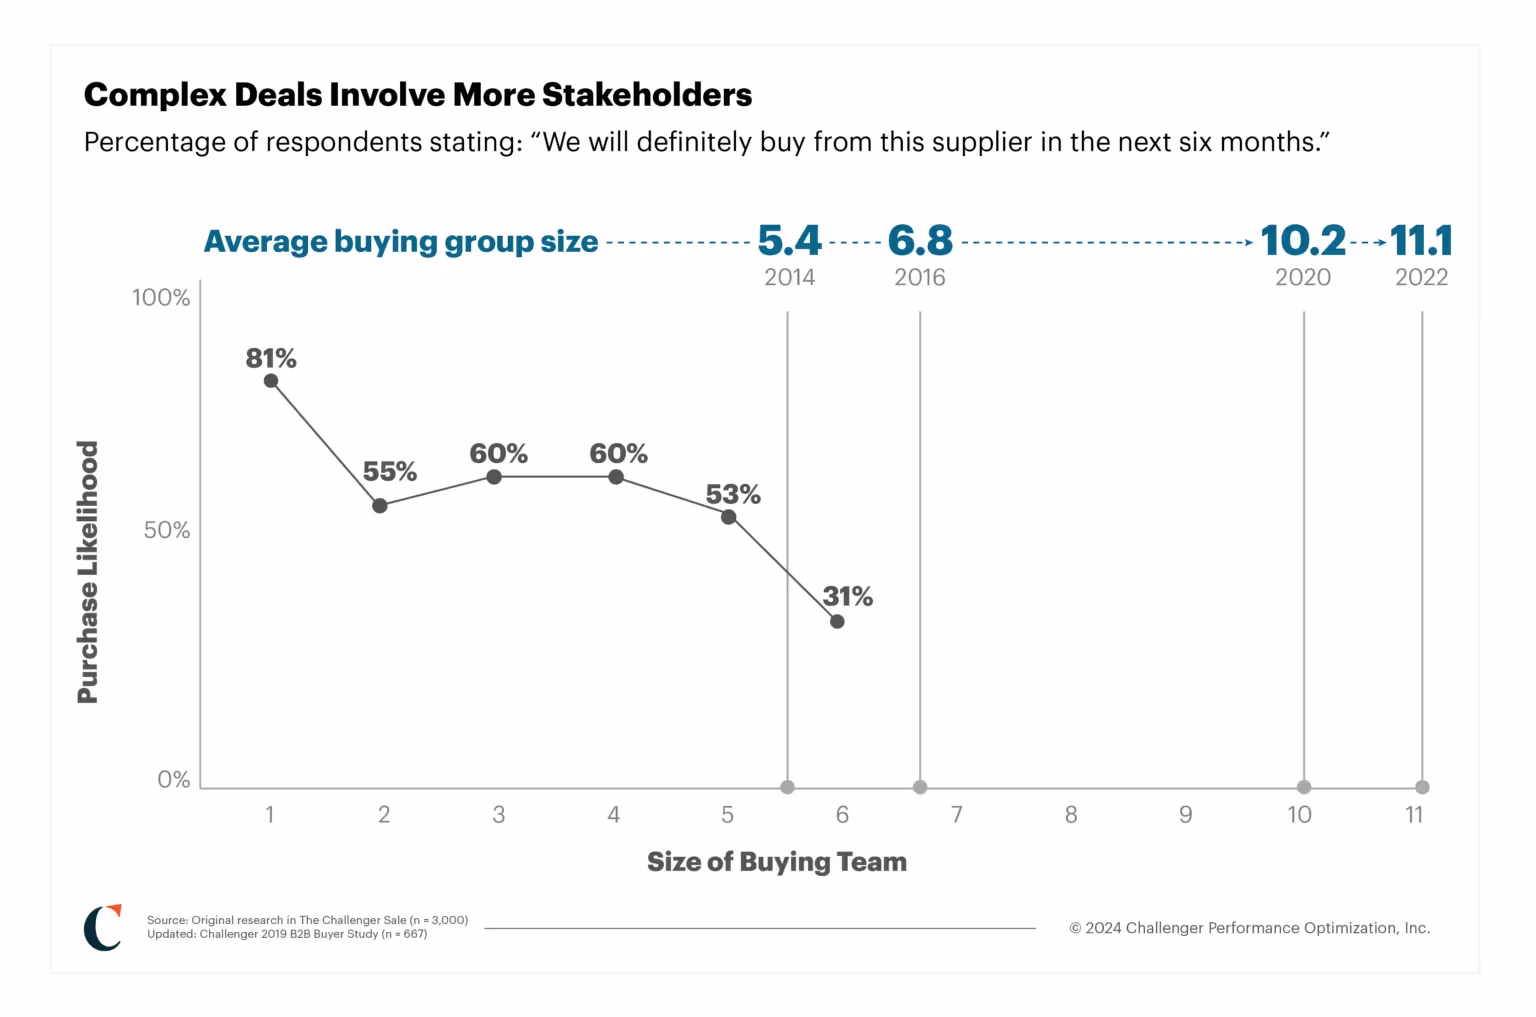
Source: Challenger
Given that the Pixel focuses on individual, single users visiting your website, it fails to capture the wider buying group from each account those users are from. This shrinks your total matched audience size considerably, but more importantly, it inhibits your marketing efforts from reaching key stakeholders and decision-makers who may not have been the ones visiting your site.
For example, if a junior marketer visits Factors.ai and is retargeted by the LinkedIn Pixel, the junior marketer alone will receive ads — with other stakeholders from the target account being ignored. As a result, this approach relies on the junior marketer being independently influential enough to convince the rest of the team to move forward with the deal. Definitely a tough sell.
The limitation: User-level targeting, as opposed to account-level targeting, results in fewer stakeholders targeted per account and smaller audience sizes.
How Account-based Retargeting Helps
While LinkedIn is best for targeting buying groups, it’s important to remember that there is no initial intent to buy on a social media platform. You need to layer in intent signals from multiple sources, such as your website and review sites like G2, to understand how you can best retarget relevant accounts.
Factors identifies intent signals and re-targets anonymous website traffic at an account level. This means that multiple decision-makers and stakeholders from the same company will be targeted on LinkedIn, regardless of which user actually visits the website. This bodes well for multiple reasons:
- Increases audience size without compromising on the quality of accounts
- Creates brand awareness at a company level rather than at an individual level
- Improves odds of targeting the right decision-makers within each account
Even assuming that account-based targeting finds the same 100 accounts as Pixel-based targeting, the former would generate an audience size of 300-500 users (3-5 people from each account), while Pixel-based targeting would only target 100 users (1 from each account). More importantly, a larger audience will improve the odds of targeting decision-makers, ultimately resulting in more leads and conversions. Accordingly, account-based retargeting solves for the practical limitation of LinkedIn campaigns struggling to scale due to poor audience size.
Limitation #3 - Audience segmentation
The previous two points discussed the LinkedIn Pixel’s limitations in terms of audience quantity. This third limitation highlights why the Pixel tends to fall short in terms of audience quality. In reality, a significant portion of your website traffic wouldn’t make a good fit for your business. Even within the subset of ICP accounts visiting your website, only a fraction would be “sales-ready” at any given moment (with the remaining accounts having to be nurtured until they’re prepared to buy).
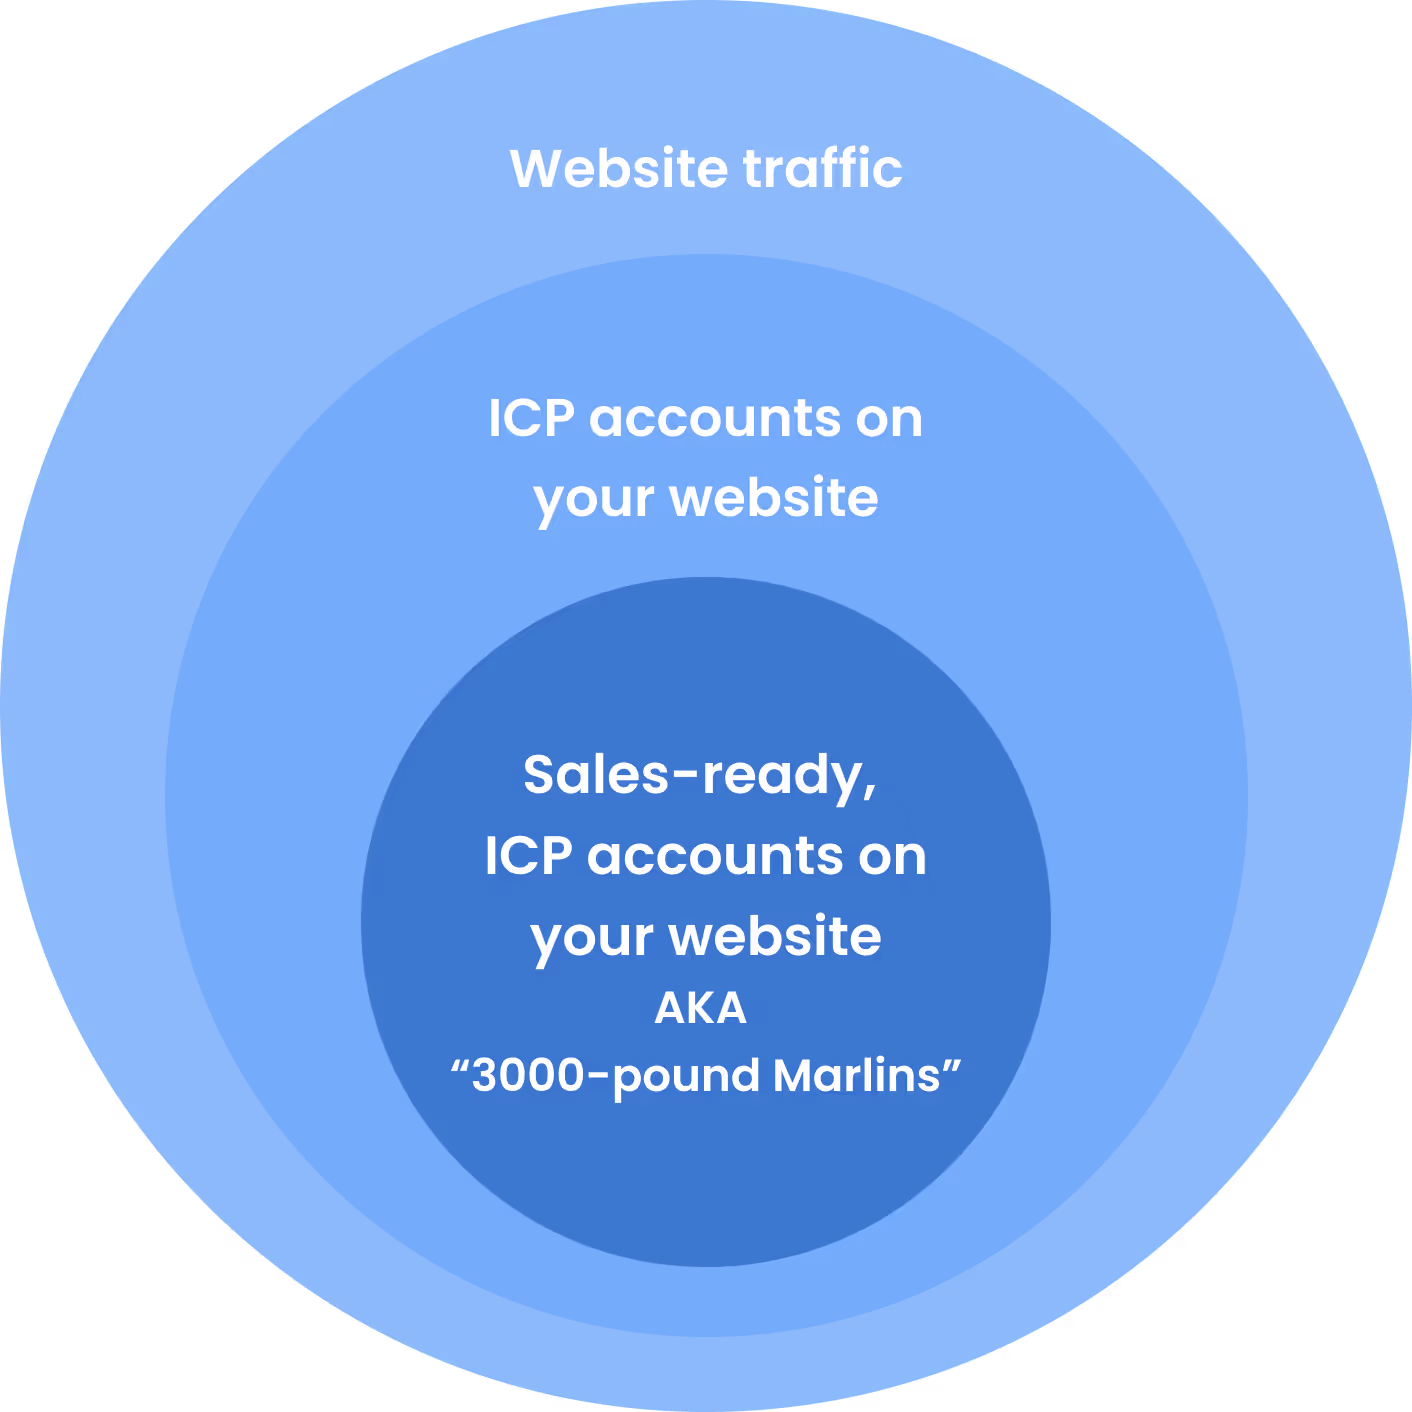
As important as having a large audience is, the quality of this audience plays a key role in determining conversions and RoAS as well. In an ideal scenario, marketing teams should only retarget this subset of sales-ready “3000-pound marlin” accounts.

The LinkedIn Pixel limits audience segmentation based on intent and engagement. With the Pixel, website traffic can only be segmented based on page views. While this is definitely a good starting point, it lacks granularity.
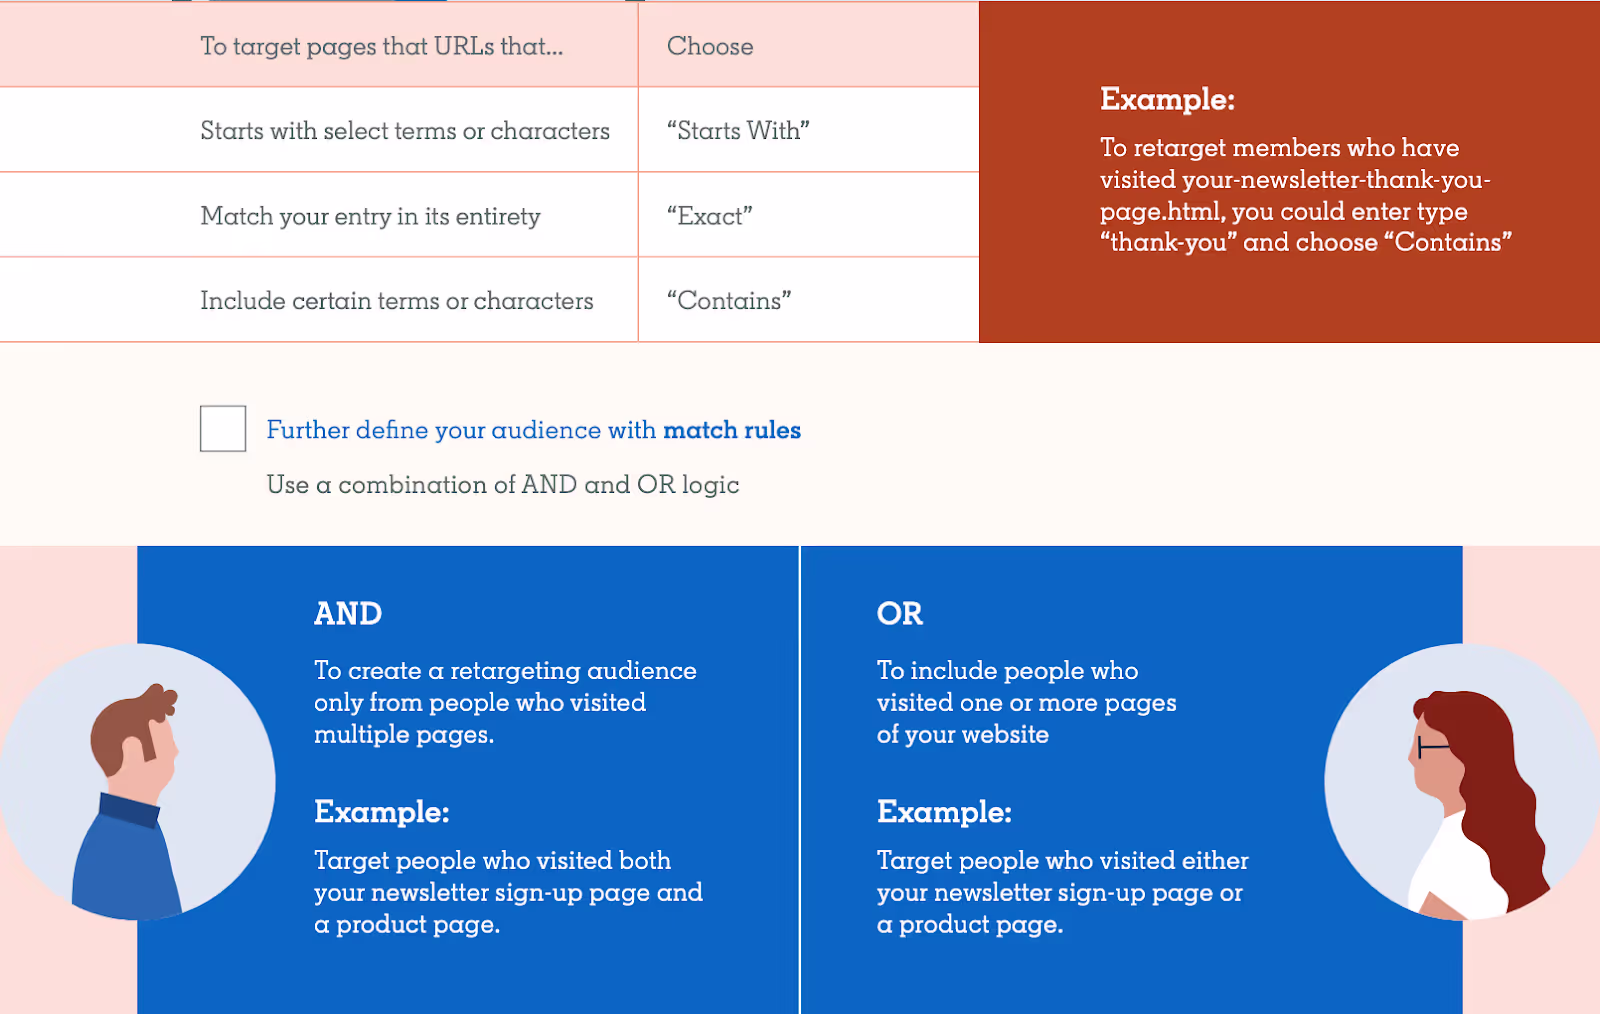
With Pixel, filtering out accounts that don’t match your target geographies, industries, sizes, or engagement levels can be challenging. This also translates to limited personalization options, as you can only segment campaigns by page views rather than by account and engagement properties.
The limitation: Limited segmenting & filtering options resulting in subpar audience quality and limited scope for personalization.
How Account-based Retargeting helps
Account-based retargeting with Factors supports granular segmentation based on a wide range of firmographics and engagement criteria. For example, with Factors, you can identify and retarget a list of accounts that meet the following rules:
“US-based Software companies with 100-500 employees visiting our pricing page & G2 profile for at least 10 seconds with a scroll-depth of 20% or more”
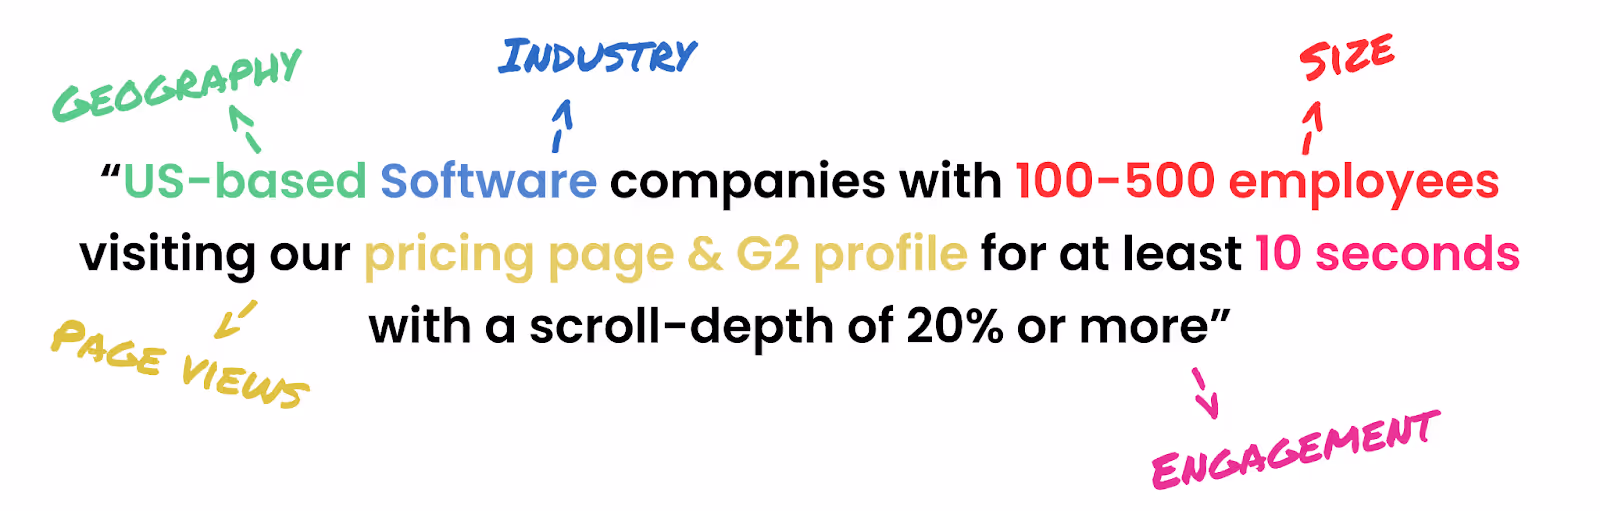
Here are a few ways in which Factors helps segment traffic data (in addition to regular old page views):
- Country
- City
- Industry
- Size
- Revenue range
- Time spent on page
- Scroll-depth
- Button clicks
- And a combination of all of the above
This level of filtering results in a list of precisely targeted ICP accounts that would make a great fit for your business. Additionally, by integrating your CRM, you may also include/exclude specific accounts, such as existing customers and competitors.
And guess what? We found the solution to fix your list-building problems once and for all!
Factors has launched Audience Builder, which allows marketers to automatically segment based on their preferred criteria, push these segmented audience lists to LinkedIn, and activate personalized, targeted advertising.
For example, you may choose to show accounts that visit high-intent pages such as factors.ai/pricing an ad creative offering a free trial. On the other hand, you can show accounts reading your competitor comparison blogs a “comparative” ad creative. The possibilities are endless.

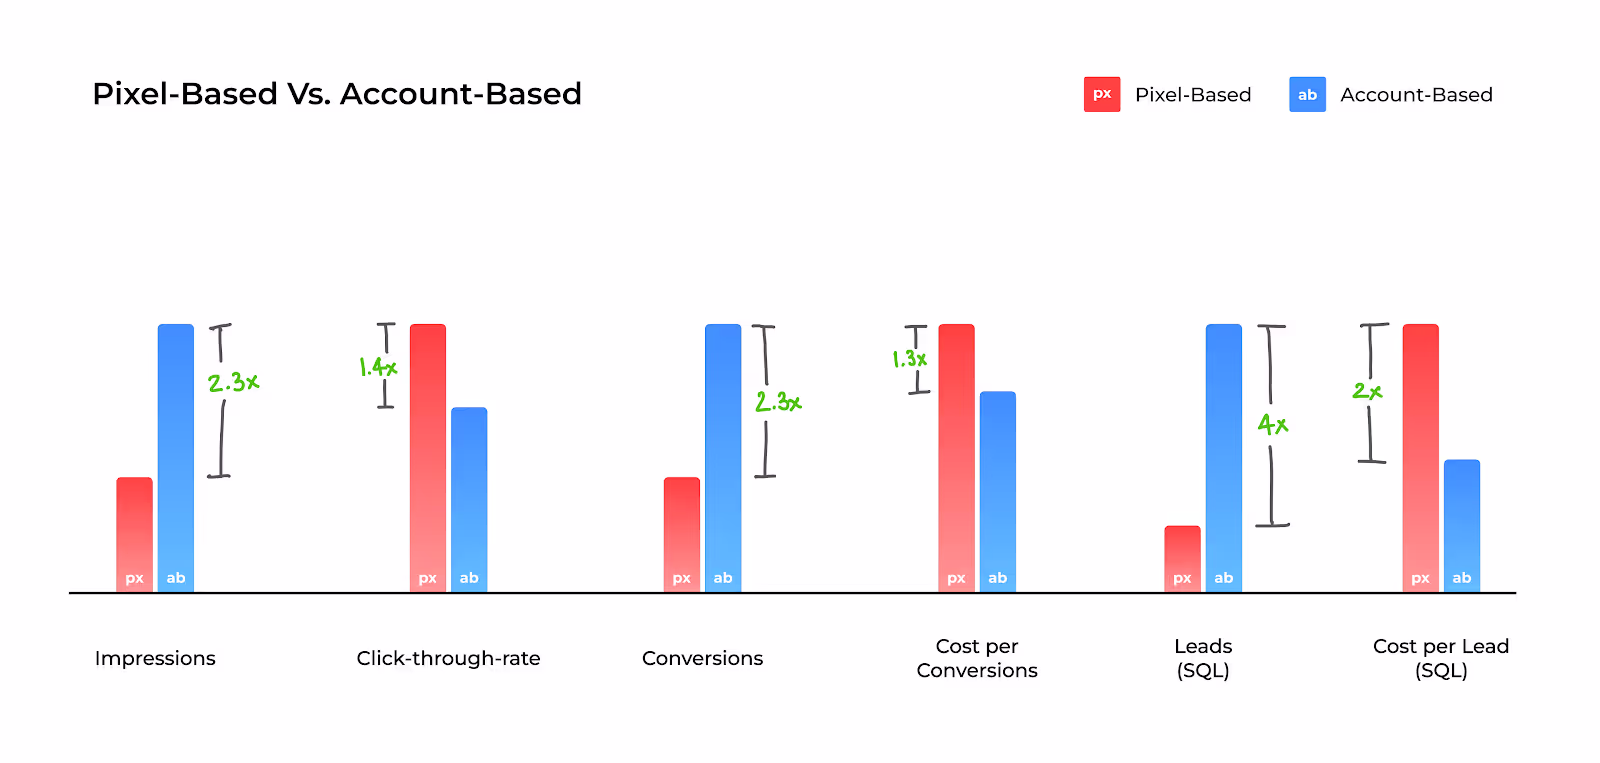
Real-life comparison: Pixel vs Account-based retargeting
We’ve talked the talk - now we’ve got the numbers to back it up. Here’s how two campaigns, one that’s Pixel-based and another that’s Account-based, compare to each other. Note that all else (duration, budgets, creatives, copies) has remained the same through the course of this experiment.
Over the same period, we find that CTR is higher under Pixel-based retargeting, likely because this approach targets exact users visiting the website. That being said, Account-based remarketing significantly outperforms Pixel-based retargeting in every other key metric, including leads generated.
And there you have it.
Solve your ad targeting woes with AdPilot
If you want to maximise ROI for your LinkedIn ads, look no further than our latest offering: LinkedIn AdPilot! We offer a wide range of features that allow you to segment audiences based on intent data, implement exposure control for your campaigns and determine the true ROI for your ads.
Speak to our team today to understand how you can use AdPilot to improve your LinkedIn retargeting efforts.
LinkedIn's Pixel-based retargeting and account-based retargeting differ in their targeting approach and benefits. The LinkedIn Pixel, a code snippet placed on websites, tracks visitor interactions using browser cookies to retarget individuals. However, its effectiveness can be limited by users not accepting cookies, using different devices, or being logged out of LinkedIn. On the other hand, account-based retargeting targets entire organizations, identifying anonymous accounts visiting your site, which allows for better audience segmentation and higher match accuracy. While the Pixel is useful for general retargeting, account-based retargeting is more effective in B2B contexts, offering precise targeting and engaging multiple stakeholders in decision-making processes.

The Complete Guide To Customer Journey Mapping
Customers are complex. What drives them? What bothers them? What encourages them? And what convinces them to choose you over your competitors? Without a clear framework in place, answers to these questions remain nuanced and theoretical.
Here’s where customer journey mapping can help.
A customer journey map visualizes the entire customer experience with your company — from awareness to deal won, and sheds light onto why your customers behave the way they do at every stage of the sales cycle.
As we will see, customer journey mapping proves to be beneficial in acquiring more customers, faster — and retaining them for longer durations of time.
Here’s what this guide to customer journey mapping covers:
- What is customer journey mapping?
- How does customer journey mapping work?
- Why do B2B companies need to map out their customer journeys?
- What should you include in your customer journey map?
- Steps to create a customer journey map
- Customer journey map vs user experience map: what’s the difference?
- How does Factors.ai help with customer journey maps?
What is customer journey mapping?
Especially in B2B deals, customers rarely make purchase decisions on an impulse. Instead, they spend significant time identifying pain-points, researching solutions, comparing alternatives, and freeing up budgets before finally becoming paying customers.

Customer journey mapping can be defined as the visualization of interactions that a buyer has with a company across the entire sales cycle — from awareness to deal won to retention. Customer journey mapping provides valuable insights to refine the overall customer experience, drive conversions, and improve customer retention rates.
In short, the customer journey map encapsulates this buyer experience. This journey can be broadly divided into: pre-conversion, onboarding, and post-conversion.
Each of these segments can be further broken down into granular customer touchpoints that the marketing, sales, customer success, and product team are responsible for.
How does customer journey mapping work?
There’s no one right way to go about customer journey mapping. But at its core, customer journey mapping works by consolidating and visualizing an otherwise complex, non-linear sales cycle.
With this framework, go-to-market teams can identify how customers behave, what their preferences are at each stage of the sales cycle, and what helps or hurts conversions.
As you might have guessed, plotting this customer journey map involves compiling data from a wide range of touch points across the sales cycle.
Without the right tools and techniques, tracking these touch-points across channels, campaigns, offline events, website, CRM and more can be a daunting task. More on how Factors.ai can ease this process later.
What should you include in your customer journey map?
While every business involves its own unique customer journey, a few key elements remain constant across the board. Here’s a breakdown of what you should look to include in your customer journey map.
1. Sales Cycle
Firstly, connect the dots between relevant data sources across campaigns, website, MAPs and CRM. This is to understand where your customers are coming from and how they’re engaging with your brand across the sales cycle.
The average B2B sales cycle can be broken down into the following stages:
- Awareness (ToFu marketing, branding, etc)
- Consideration (BoFu marketing, sales discovery, trials, etc)
- Decision (Effective sales and customer success)
2. Customer Behavior
Based on the data collected from the previous point, gauge how customers behave at different stages of the sales cycle.
Let’s say that the data suggests that during the awareness stage, buyers look to learn more about the problem they’re facing. At this stage, educational material such as ebooks or webinars may be more relevant to customers as compared to bottom of the funnel material such as comparison articles or case-studies.
3. Sentiment
B2B deals tend to be perceived as unemotional, objective transactions. However, at the end of the day, B2B businesses still sell to people — buyers and users — within a business. Accordingly, it’s important to consider the sentiment of leads and buyers during every stage of the customer journey.
For instance, the problem-awareness stage may involve frustration or confusion that we should look to minimize with useful content and personalized outreach. The solution-decision stage may involve feelings of relief or happiness which should be maximized with reliable customer support and relevant documentation.
4. Problems
Carrying on from the previous point: For any negative sentiment, there’s probably a pain-point or problem behind it. Identifying these pain-points at various stages of the customer journey will help create pointed, relevant customer experiences that look to solve user problems.
5. Solutions
As previously mentioned, we can look to solve challenges and paint-points along the customer journey to reduce or eliminate any points of friction. This will ensure smooth sales conversions.
Why do B2B companies need to map out their customer journeys?
Creating a customer journey map, especially without the right tools, can be an unintuitive and daunting task. Why then should businesses care to go through all this effort?
The overarching reason for B2B teams to create customer journey maps is because of its positive impact on customer experience, conversion, and retention. Breaking down the customer journey into broad stages with individual objectives simplifies, and ultimately improves, an otherwise convoluted customer journey.
Here are a few specific ways in which customer journey mapping benefits the customer experience, which in turn benefits your businesses’ bottom line metrics.
1. Identify what resonates with your audience
Customer journey mapping helps identify how different messaging, content, topics and themes resonate with your target audience. While marketers tend to have a hunch about this, qualifying a hypothesis with data helps scale efforts confidently.
2. Refine personas and improve targeting
Targeting a broad audience isn’t effective or scalable in the long run. Customer journey mapping sheds light onto which customers are actually interested in the value of your product. This helps refine the characteristics of ideal customer profiles and allows marketing teams to go after targeted, high-intent audiences.
3. Improve customer retention rate
The customer journey map charts a course all the way into the product and its end-users. This provides valuable insights into who the product is helping most, and how it’s helping them.
With this end-to-end view of the customer journey, it’s clear to see where to improve the customer experience, even within the product. This is invaluable information given that a third of Americans consider switching to an alternative after a single poor experience.
Ultimately, improving the customer experience means improving customer retention. Which in turn lends itself to stronger pipeline and up-selling opportunities.
Steps to Create a Customer Journey Map
Here’s a step-by-step breakdown of creating a customer journey map from scratch.
1. Define customer journey objectives
The first step is to determine why you’re constructing a customer journey map. What’s the objective? Whose customer experience are you looking to improve? Based on this information, define 1-3 hypothetical buyer personas that represent your ideal customer profile.
Buyer personas should be based on a combination of firmographic features like industry, revenue, and headcount as well as user-specific characteristics like role, department, tech-stack, etc.
2. Survey prospects and customers
After defining your hypothetical “perfect customer”, it’s time to survey your actual prospects and buyers. This is mainly to close the gap, if any, between how you believe your customers think and how they actually think.
Here are a few questions to ask prospects and customers:
- How did you hear about us?
- What are you looking to solve for? What’s your biggest pain-point?
- How would you rate our onboarding process on a scale from 1-10?
- How do you think we can improve our website content?
3. Track customer journey touchpoints
While asking customers where they found us and how they like our product is all well and good — it’s rarely sufficient. For one, B2B sales cycles last several weeks, if not months. It’s hardly fair to expect customers to remember the exact social media post that drove them to your website.
For another, subjective interviews are often riddled with bias and leading questions. To avoid inaccuracies in data, it's crucial to independently track touch-points across campaigns, websites, MAPs, CRM, and other relevant sources for objective analytics. With this, we can find answers to questions like:
- Which channel is driving the most traffic to my website?
- Which blog topics lead to the most conversions?
- What percentage of the pricing page are visitors scrolling through?
- How are customers progressing from an ad campaign, to website, to demo, to deal won?
Consider the sentiment, pain-points, and solutions that are associated with every customer action in order to understand motivations and tailor marketing efforts efficiently.
For example, if a page on “Identifying website visitors” seems to be driving a lot of conversions, this may be a pressing pain-point or use-case to your audience. In this case, tailoring outbound efforts and organic social with more content on visitor identification may be fruitful.
4. Allocate resources across the customer journey
So far, we’ve defined who we want to sell to, identified what current customers are thinking, and tracked how these customers are interacting with our brand.
Based on this goldmine of information, we receive a rough idea as to how we can better allocate resources. For instance, maybe mapping out this data reveals that webinars seem to perform disproportionately better than paid social at driving high-intent visitors.
Alternatively, this customer mapping exercise may also reveal a dearth in specific tools that could help accelerate sales velocity – email automation, customer service management, etc.
The reallocation of resources that follows these insights will ultimately result in the first iteration of the customer journey map. A design that encapsulates who your ideal buyers are and the ideal path they’ll take to become paying customers.
5. Analyze the customer journey
At this stage, we’ve crunched a whole lot of customer data and allocated resources to optimize the customer journey. But this is just one half of the puzzle. Analyzing and iterating based on real-life results is crucial to the success of a customer journey map.
Look to answer questions like:
- Where are customers dropping off disproportionately?
- Which touch-points are driving higher-than-average conversions?
- How does the quality of leads differ from one channel to another?
This is where the customer journey map graduates from theory to practice.
6. Iterate. Iterate. Iterate.
Using learnings from the analyses of the customer journey, run a wide range of experiments to test specific hypotheses at every stage of the sales cycle.
Perhaps reworking ad copies, repositioning CTAs on the website, investing in a customer service tool, updating the onboarding flow result in improved customer experience and conversions.
Rather than relying on intuition or guesswork, use the customer journey map to identify and iterate on strengths and limitations with data-driven insights.
Ideally, the customer journey map should be revised every month or quarter to stay aligned with every-changing customer behavior.
Customer Journey map vs User Experience map: What’s the difference?
In short, a customer journey map considers every measurable interaction that a customer has with your business from awareness to consumption. A user experience map, on the other hand, only considers how customers use the actual end product.
It’s important to distinguish between the two because, especially in B2B deals, the buyer is often different from the end-user. While there’s generally significant overlap between the two concepts, user experience is a subset of customer experience.
For example, a CMO reads a blog and attends a demo through a website before purchasing your software for her content marketing team. While the CMO might be thoroughly impressed with the material she’s interacted with, the content marketing team may actually be disappointed with the software.
While a customer journey map will consider this case end-to-end, a user experience map will only highlight the limited usage of the software by this content marketing team.
How does Factors.ai help with customer journey mapping?
Here are four ways in which Factors.ai can help map out your customer journey:
1. Account and User timelines
Factors unifies customer journey data across campaigns, website, and CRM to present an interactive timeline of touchpoints at a user and account level. This is an especially powerful tool for account-based marketing teams to track how users from their target accounts are progressing through the sales cycle.

2. Account Identification
Factors uses industry-leading IP-look up technology to identify up to 64% of anonymous website traffic.. This provides valuable insights into which accounts are visiting your website and how they’re interacting with pages and content.

This firmographic and intent-data helps shape the buyer personas for your customer journey map as it sheds lights onto how different types of companies interact differently with your brand.
3. Attribution
As previously mentioned, measuring the right touchpoints and tying it back to revenue manually is, to say the least, a chore. Multi-touch attribution on Factors helps connect the dots between conversions and pre-conversion touchpoints. Compare a range of attribution models based on the nature of your business to quantify the impact of marketing effort on pipeline and revenue.

4. Path analysis
Path analysis is similar to timelines in that it provides an intuitive visualization of various accounts and users traveling through different paths along the customer journey. The difference is that path analysis reflects aggregated user behavior rather than a specific account’s journey.
This is helpful when testing hypotheses, running experiments, or gauging customer behavior on a larger scale.

And there you have it! A complete guide to customer journey mapping — and how Factors.ai can help construct your customer journey map.
This guide emphasizes the importance of understanding the customer journey for effective marketing. It explains how to visualize and analyze buyer interactions from awareness to post-purchase. By mapping these touchpoints, businesses can pinpoint areas for improvement, enhance customer experiences, and boost retention rates.

6sense & Factors.ai Partnership Announcement
We’re thrilled to announce our partnership with industry-leading account-based marketing platform, 6sense.
With this deep-rooted collaboration, Factors.ai now delivers state-of-the-art account identification, firmographics, and intent data along with our existing ABM analytics and attribution capabilities.
Users can expect to tap into 6sense’s extensive databases with Factors.ai to discover upto 64% of anonymous companies visiting the website — including account-level website behavior, purchase intent, and timelines.
Account Identification + Account Analytics = ABM Magic
This article highlights what the partnership means for our users, along with a few use-cases and testimonials. If you can’t already tell, we’re really excited for the immense value this collaboration brings to our customers.
.avif)
A few common questions
Why partner with 6sense over other alternatives?
Rigorous comparative testing with over 20,000 IPs reveals that 6sense is far ahead of the game in terms of data quality, volume, consistency, and pricing. The infographic below highlights 6sense's ability to identify up to 27% more accounts than the closest alternative. Also, it doesn't hurt that 6sense is one of the leading ABM platforms in the market today.

Do users need a separate 6sense account to use account identification with Factors?
Nope! you do not have to be a 6sense customer to use account identification with Factors. Simply reach out to our team to enable this integration within your Factors project — without signing up or paying independently for a 6sense account.
If you are an existing 6sense customer, simply integrate your 6sense account to Factors using the API key.
Can Factors identify email IDs or phone numbers of anonymous website visitors?
No. Factors is a privacy-first, GDPR compliant solution. It only discovers IP-to-Company-level data. Factors does not identify individual website visitors or personal information like phone numbers or mail IDs unless the user chooses to share this information through form submissions.
How does pricing work?
Read more about our pricing details here: factors.ai/pricing
6sense & Factors.ai: What’s in it for you?
As B2B go-to-market teams continue to adopt account-based marketing strategies, there’s a growing demand for both account analytics and account intelligence. Here’s how the 6sense x Factors.ai partnership helps with both:
.avif)
Factors's real-time Slack Alerts for accounts identified via 6sense's visitor identification technology have helped our Sales Team be proactive. Roughly 25% of last month's new revenue for Clearfeed is due to the outbound outreach done by the SDRs based on Factors data.
1. Account Identification
B2B companies invest significant resources towards driving high-intent website traffic. Unfortunately, only about 4% of this traffic comes to light through forms or signups. With 6sense, Factors.ai can identify up to 64% of anonymous companies using industry-standard IP-lookup technology!
As we’ll cover in following sections, this provides sales and marketing teams with the ability to identify and target the right opportunities, personalize the customer experience, and measure the impact of campaigns.
2. Firmographics + Advanced Analytics
In addition to identifying company names, 6sense enriches visitor data with detailed firmographics such as domain, industry, headcount, location, and more. This information is continually optimized with proprietary machine learning and human QA. Firmographic data, in conjunction with Factors.ai’s advanced website analytics — button auto captures, page time spent, scroll percent, etc — helps effectively identify high-intent accounts, well-resonating website content, and points of friction along the customer journey.
The cherry on top: configure real-time Slack alerts when target accounts land on specific web pages to reach out to leads while the iron’s still hot. Research finds that contacting leads quickly significantly improves the odds of conversion. Our early adopters have been seeing real value delivered to their sales reps and ABM marketers.
3. Account Journeys & Timelines
A crucial element of account-based marketing is tracking how target accounts are progressing along the customer journey. Upon identifying companies visiting your site, Factors.ai creates an intuitive account-level timeline of the journey in real-time — across campaigns, website, and CRM.
On one hand, this provides retrospective insight into what campaigns and assets drive conversions. On the other hand, it provides forward looking inputs to optimize retargeting efforts and personalize sales pitches based on the account’s previous interactions.
Struggling to identify more than 5% of your anonymous traffic? See how Factors.ai can help your business reveal upto 64% of website traffic over a personalized demo.
Use-cases: Account Identification, Firmographics, and Intent Data
1. For Demand Gen
With this partnership, demand gen teams can see which marketing initiatives and assets are driving high-intent accounts to their website. Rather than relying on expensive spray and pray tactics, teams can reallocate resources to targeted efforts that bring in the right kind of buyers.
On the flip side, demand gen folk can reveal companies visiting the website and retarget the right, ICP accounts based on firmographic and intent. In a time when teams are asked to do more with less, Factors offers to optimize marketing ROI and make tight budgets go a long way.

A game changer for B2B Marketers for Account Analytics. Factors' advanced analytics combined with 6sense visitor identification allows us to build a complete understanding of the Account Journey including the dark funnel. We are now able to plan our marketing campaigns and content efforts with clear visibility into what is driving conversions and pipeline.
2. For Content Marketers
B2B companies tend to invest heavily in content without actually knowing who the end consumers are. With Factors, content marketers can pin-point who’s reading ungated assets such as blogs and case studies.
For one, this helps discern what content resonates with different audiences. Content teams can guide their strategy based on what resonates best with their target personas. For another, content marketers can tie their efforts back to bottom line metrics like pipeline by showcasing timelines as buyers progress from blogs, to demos, to trials, and finally, to deals.

Combining 6sense visitor identification with Factors' advanced analytics has unlocked insightful views for our product and content marketing teams. We now have a clear view of how our content performs across key audience segments — and the opportunities to optimize user journeys and conversions further.
3. For Product Marketers
Product marketers continually iterate on messaging for core pages such as the home page, pricing page, and features page. While standard web analytics and A/B testing tools provide insight into whether a certain message is working for overall traffic, this partnership empowers product marketers to experiment and tailor messaging for known visitors.
For instance, account identification and firmographics may reveal that larger companies are more interested in privacy compliance material while smaller teams may care about transparent pricing. Based on who the PMM is looking to target, they may alter messaging accordingly.
4. For Sales
The benefits of account identification and analytics is especially apparent in the case of sales teams. For one, sales reps can tap into a net-new pool of business from existing website traffic with zero additional spend. Within this set of accounts, sales can target the right ones based on intent and engagement insights. Finally, rather than spending hours trying to contact cold prospects, sales reps can improve direct engagement by reaching out to accounts while they’re on the site through real-time Slack alerts.
Overall, the workflow encouraged by the 6sense x Factors partnership dramatically improves sales productivity.
.avif)
A dream solution for B2B marketers to unfold user journeys. When we chalk plans for a campaign, we love valuable insights. Even better when I have it diced & sliced. We get it all here & engage with our audience. The granularity of data is perfect & the mining engine of Factors with 6sense has unbelievable match rates for de-anonymizing accounts.
Curious to see 6sense and Factors.ai in action? Book a personalized demo here!
Related reading:
Factors.ai has teamed up with 6sense to boost its account-based marketing (ABM) features. This partnership enables Factors.ai to provide advanced visitor identification, firmographic data, and intent signals, helping users identify up to 64% of previously anonymous website visitors. With these insights, B2B teams can focus on high-intent accounts, tailor their outreach, and refine marketing strategies. The integration is seamless, with no need for a separate 6sense account, and it complies with GDPR by using IP-to-company data instead of personal identifiers.

HubSpot Analytics Vs. Factors.ai – Features, Limitations, Integrations & More
All our homies LOVE HubSpot. No doubt, it's a reliable CRM and marketing automation platform. In fact, Factors.ai integrates seamlessly with HubSpot to deliver full-path analytics and attribution across campaigns, website, and CRM. That being said, HubSpot’s own in-platform analytics and attribution engine, is fraught with serious limitations. The following article highlights these issues with HubSpot — and how you can overcome them with Factors.ai. Ultimately, we find Factors.ai to be a far better fit for data-driven B2B marketers.
Before we jump into the limitations of HubSpot analytics and attribution, it’s only fair to address a couple of positives. Although premium reporting (advanced analytics, revenue attribution, etc) is only available on HubSpot’s enterprise plans, it delivers a robust range of multi-touch attribution models in a simple, user-friendly framework. Additionally, if your company uses HubSpot CRM, MAP, and life cycles stages religiously, HubSpot could possibly be an effective all-in-one solution for reporting. As we shall now see, however, most teams do not use HubSpot in the dedicated manner that’s required for it to function well.

Limitation #1: Rigidity & Inaccuracy
1.1. Fixed Lifecycle Stages
One glaring limitation with HubSpot’s in-platform analytics solution is its rigidity around the sales funnel — and especially its life cycle stages. HubSpot analytics only offers fixed definitions for events and stages along the customer journey — Subscriber, Lead, MQL, SQL, Opportunity, Customer, and Evangelist. Now, this set of stages may fit in perfectly with your organization’s funnel structure; but in reality, most B2B teams follow unique customer stages based on the nuance and particulars of their business model. B2B SaaS firms for example, may care about including a “Demo Done” stage to flag high intent leads. HubSpot’s analytics engine does not provide the flexibility to include, or even edit lifecycle stages to match this preferences.
If your team does not adhere to HubSpot’s predetermined structure, Factors.ai may be the right fit for you. On Factors, users have limitless flexibility to set, track, and analyze their own internal life-cycle stages.

1.2 Inaccurate Lifecycle Stage Tracking
In continuation with the previous point — not only is HubSpot’s lifecycle stage tracking rigid, it’s also blatantly inaccurate. Rather than considering the leads in lifecycle stage “B” to be a subset of the previous lifecycle stage “A”, HubSpot only counts the contacts in a particular stage at that point in time. Here’s an example to illustrate:
Say you have 50 leads tagged MQLs. 20 of them become SQLs. This, of course, does not mean that you now only have 30 MQLs. Rather, it means that the set of 20 SQLs are a subset of the total set of 50 MQLs.
This is a major issue with HubSpot analytics — leading to inaccurate readings, insights, and ultimately; marketing decisions. Rest assured, Factors.ai ensures no such fallacies in logic. You can also guarantee a far wider range of filters, breakdowns, and visualization techniques on Factors.ai as compared to HubSpot analytics.

Limitation #2: Attribution Troubles
2.1 Campaign Attribution
It’s impossible to create attribution reports on HubSpot at a keyword level across campaigns and ad groups. If you want to look at keyword level attribution reports on HubSpot, you’ll need to examine keywords within a specific ad group from a specific campaign. Why is this an issue? Well because a specific keyword can (and usually does) belong to multiple campaigns
On Factors, you can do what HubSpot attribution does AND look at keyword attribution reports across campaigns and ad groups for granular, and more importantly, accurate insights.

2.2 Attributing Offline Events
Offline touchpoints are those touchpoints along the customer journey that cannot be tracked digitally. These include outbound emails, webinars, in-person events, corporate gifts, etc. While HubSpot does enable you to document these “events”, it is not possible to analyze or visualize them within HubSpot analytics. As a company scales, it’s likely to have a good combination of digital and offline touchpoints, making it imperative to account and analyze for both in union.
Factors.ai makes it possible to track, analyze, and attribute offline touchpoints by fetching contact tags and UTMs. These touchpoints are also completely customizable with no-code. Needless to say, unlike Factors.ai, HubSpot does not enable users to attribute custom properties, events, or KPIs.

2.3 Comparing Attribution Models
Factors.ai is one of the few attribution solutions that allows users to compare attribution models against each other. B2B sales cycles can be complex, and the ability to compare results across first-touch and multi-touch models gives marketers an unequivocal advantage in identifying trends accurately. Unlike Factors.ai, HubSpot does not offer the ability to compare attribution models.
Limitation #3: Lack of Granularity
Another major drawback with HubSpot analytics & attribution is that it considers lead source only at a channel level. That is, lead sources may be viewed as “Organic”, “Paid ads”, “Social” and so on. We all know that the devil’s in the details — and channel level data simply will not cut it in this day and age. How is one to know which campaigns or content to scale, if they are unable to view performance data for the same? Factors.ai is all about granularity. We ensure detailed analytics at a channel, campaign, ad group and keyword level to help you make the best possible marketing decisions. Our extensive line of no-code integrations across the most popular ad platforms guarantees a proper data-driven marketing experience.

Limitation #4: Data Integration Woes
So here’s the thing: you can integrate HubSpot with third-party data-sources, including other CRMs like Salesforce — but it’s no easy task. It requires tedious onboarding, strict vigilance, and developer dependency. You need to make sure all your sales data is either on or linked to HubSpot. If you use a combination of HubSpot and Salesforce or LeadSquared or Marketo, a platform like Factors.ai would make your life a lot easier. IF, however, you religiously use HubSpot exclusive products — CRM, MAP, Website, etc, then HubSpot may be a more convenient option for you.
Limitation #5: It’s The Little Things…
By design, Factors.ai is a robust, intuitive marketing analytics, attribution, and journey mapping platform. Above all, we pride ourselves on delivering the best possible experience to our users. This entails end-to-end onboarding support, sustained customer success management, and smooth, reliable performance. The same, unfortunately, cannot be said about HubSpot analytics.


Here’s why Factors.ai has the edge over HubSpot when it comes to user experience:
- HubSpot imposes limited users or seats per hub. Factors grants unlimited seats, free of charge.
- HubSpot requires tedious, developer dependent onboarding and training over several weeks, if not months. You can get started with Factors.ai in 30 minutes.
- HubSpot charges an independent fee for tech support. Factors.ai is an extension of your team — with dedicated customer success management guaranteed.
- HubSpot aggressively up-sells its features to nickel and dime existing customers. Factors.ai recommends tailor-made plans based on the scale and growth of your team.
And there you have it. Still curious to learn why Factors.ai would be better suited for your B2B team over HubSpot Marketing Hub? Book a personalized demo here to see our work in action.
HubSpot Analytics is known for its user-friendly interface and basic multi-touch attribution, making it a solid option for teams already embedded within the HubSpot ecosystem. It’s especially helpful for straightforward reporting and marketing workflows.
However, several limitations can hinder scalability for data-driven B2B teams:
- Rigid lifecycle stages that don’t always align with nuanced buyer journeys
- Limited customization options for reports and dashboards
- Difficulties integrating external data sources, leading to siloed insights
Factors.ai steps in to fill these gaps with:
- Customizable lifecycle stages tailored to your sales funnel
- Seamless integrations across diverse CRM, ad, and marketing tools
- Advanced analytics and attribution features that go beyond surface-level reporting
For B2B marketers seeking deeper insights, greater flexibility, and a holistic view of the customer journey, Factors.ai offers a more robust and scalable alternative to HubSpot Analytics.

Top 10 Dreamdata Alternatives and Competitors to Look For in 2025
TL;DR
- Factors.ai – Excellent for B2B teams wanting full-funnel multi-touch attribution, ABM analytics, predictive scoring, GTM intelligence services and real-time journey tracking, all with no-code setup.
- HockeyStack – Strong choice for marketers who need visual funnels, CRM-based segmentation, and simple implementation.
- Marketo Measure (Bizible) – Best for large enterprises seeking advanced attribution inside Adobe’s ecosystem, with flexible modeling options.
- Ruler Analytics – Practical for teams that need a mix of predictive analytics, marketing mix modeling, and transparent visitor-level tracking.
Dreamdata helps analyze marketing expenditure, measure ROI and optimize campaigns to maximize marketing efforts. Some of the key features of Dreamdata are
- Digital analytics
- Revenue analytics
- Performance attribution
- Customer journey mapping
The tool easily integrates with marketing automation and CRM platforms. However, even with all these benefits, it also has some drawbacks.
In this article, we will evaluate the limitations of the tool and also highlight the best 7 Dreamdata alternatives that businesses can consider. We will discuss key features, customer reviews, and pricing of each alternative.
Let's dive in.
Why are marketers looking for Dreamdata alternatives
Upon evaluating customer reviews on platforms like G2, Capterra, and Trustradius, we find that Dreamdata
- Is difficult to set up
- Has a steep learning curve for users
- Does not have an intuitive UI
- Can’t gather granular insights on campaigns

Dreamdata is priced higher than its competitors. Also, the available features are very limited in their free version.
All the above factors have led users to look for an efficient alternative.
Read on to learn about the best Dreamdata alternatives and how to choose the right one for your business.
{{INLINE_CTA_A}}
An overview of Dreamdata alternatives and competitors
-1.avif)
Top 10 Dreamdata alternatives
Here are some Dreamdata alternatives that you can check out for your business’s analytics and attribution needs:
1. Factors.ai
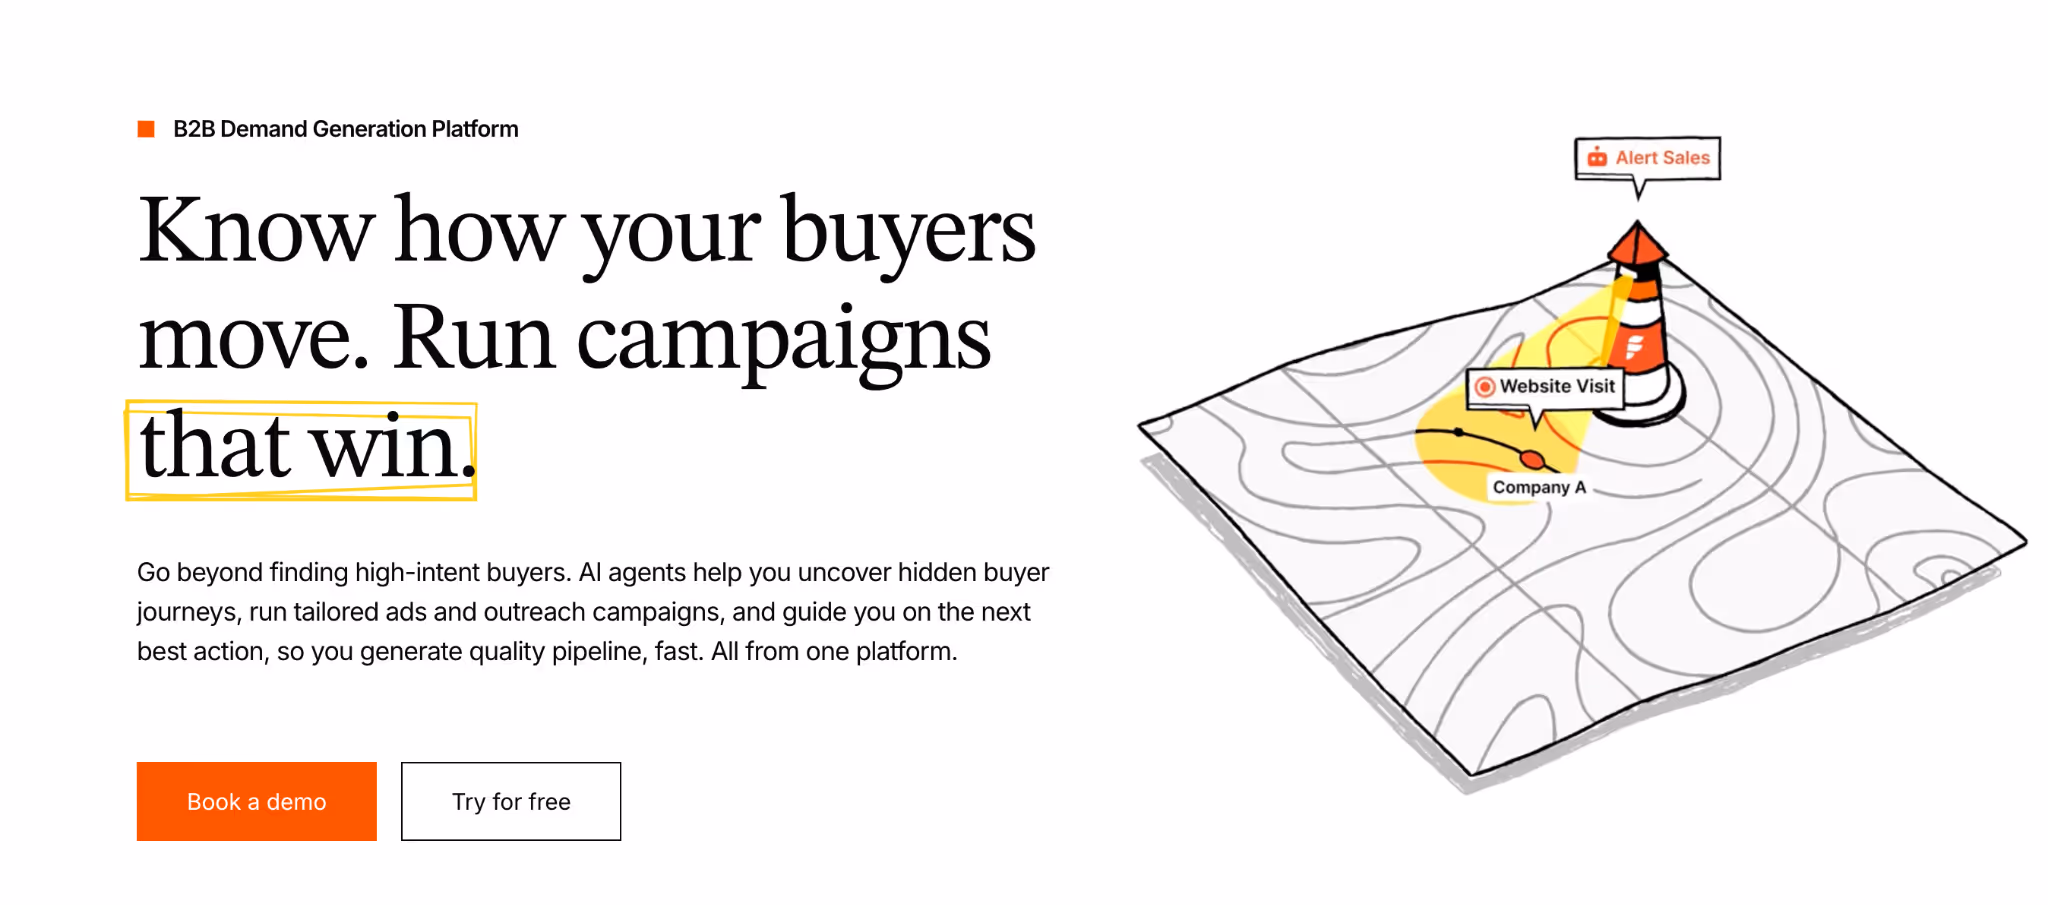
First in the list of Dreamdata alternatives is Factors. It is an AI-powered B2B Demand Generation Platform that offers marketing analytics and attribution services specifically designed for B2B marketers.
The tool is easy to implement with itRule Analyticss no-code capability. Once set up, Factors can automatically track all events on the website and also offers retroactive data capturing.
Factors allows easy and no-code integration with CRM, Clearbit, Google Search Console, LinkedIn, Google Ads and other necessary tools. These integrations help centralize customer data and provide actionable insights across departments. Factors also allows users to create customizable dashboards, which help them visualize customer data at a glance.
Also, Factors has a dedicated customer success management team to attend to each business’s unique requirements and objectives.

Key features
Account Identification
This feature enables teams to identify anonymous accounts across website, ad impressions and product reviews. It helps understand where the visitors are coming from and analyze details like revenue range to segment their target customers.
Full-funnel multi-touch attribution for tracking revenue
If you only track last-click conversions, you’re flying half-blind. Most of your buyer’s journey, the ads that warmed them up, the content that earned trust, the SDR touch that nudged them forward, never gets credit. With Factors’ multi-touch attribution (7+ attribution models to match your sales cycle), you’ll capture every touch across ads, website, and CRM, then drill into each stage of your funnel to see what actually drives revenue.
Result: You finally get a clear attribution to real pipeline and revenue, so you can double down on what actually works.
View-through attribution for LinkedIn
Clicks only tell you who raised their hand last. The quiet stuff, the LinkedIn and display impressions that warmed up your accounts, rarely gets credit.
That’s where view-through attribution earns its keep.
We stitch ad views to web sessions and CRM activity so every touch lives on one timeline. Dial in lookback windows and model weights to fit your ICP and buying cycle.
Result: Attribution to real pipeline and revenue, so you can fund what actually works.
Check our LinkedIn Adpilot page to read more around identifying the true ROI of LinkedIn Ads.
Custom reports for deep buyer journey insights
This lets you slice and dice performance with filters for channel, campaign, audience, geo, and funnel stage, so patterns jump out fast. Group results by account, segment, or persona and display them exactly how you want (tables, charts, cohorts). Build the precise view you need to uncover granular drivers of awareness, velocity, and revenue, and share it with the team in a click.
Result: You get fast, shareable insight into the granular drivers of awareness, velocity, and revenue, so you can scale what works.
Run intent-driven ABM across LinkedIn & Google and measure using ABM analytics
Identify in-market ICP accounts by unifying signals from your marketing stack. Auto-build and refresh account lists, then launch hyper-targeted campaigns across LinkedIn and Google Ads.
Use predictive scoring and impression control to prioritize sales-ready accounts and stretch budget further. Feed back high-quality, value-weighted conversions so the platforms optimize for pipeline, not just clicks. Measure every view, click, and CRM touch with deep ABM analytics to prove lift by stage and revenue.
Result: Tighter targeting, smarter spend, and measurable impact on the deals that matter.
For a practical walkthrough, take a look at running targeted ABM campaigns on Google and LinkedIn
GTM engineering and sales intelligence services
GTM Engineering services by Factors is a fully managed service that turns intent signals into revenue, fast. We wire your stack so high-intent visitors trigger real-time alerts, automatic enrichment, and ready-to-send outreach.
Custom ‘agents’ (Website Visitor Identification, Contact Relevance, Account/Contact Tiering, Meeting Assist, Closed-Lost Alerts) prioritize the best next action for your reps. With up to 75% account identification and Apollo-verified contacts, your team gets clean data and context in minutes.
Result: Fewer manual tasks, more meetings per rep, and a clear lift in pipeline, without extra headcount.
Book a demo to see it live on your data.
Read our latest blog on website visitor identification to warm outbound play using GTM engineering services.
2. HockeyStack

HockeyStack is another Dreamdata competitor that provides attribution solutions. The tool is intuitive and easy to implement.
In addition to attribution, HockeyStack also offers a range of functionalities that help marketers;
- Visualize customer journeys with funnels.
- Optimize Ideal Customer Profile (ICP) by using CRM properties like companies and contacts to segment metrics.
- Collect customer feedback through surveys.

Key features
- Revenue Attribution:
By attributing revenue to each aspect of marketing, HockeyStack can help understand which channels or campaigns bring more ROI. As a result, it enables marketers to prioritize and focus their efforts and drive more conversions.
- Funnel Analytics:
This powerful feature from HockeyStack allows users to visualize different sales stages in detail. Marketers can understand how their customers move down the sales funnel and improve the stages that are not performing well.
- Account-Level Journey:
HockeyStack tracks customers' pre- and post-conversion journeys with touchpoints, including website visits and demo calls. It also visualizes the account journey showing the different journey stages and the actions users take at each stage. Therefore, it enables marketers to understand the customer journey comprehensively.
Pricing

HockeyStack’s pricing starts from $949 per month. Book a demo with their team to get a detailed quote for your needs. HockeyStack also has a live demo that gives you a sneak peek into the platform.
3. Marketo Measure (Bizible )

Bizible or Marketo Measure is Adobe's attribution solution. It has a touchpoint-based data model that can collect data at each touchpoint, offering insights into the customer journey. This allows marketers to identify the high-performing touchpoints at each stage and improve those not performing well.
Even Though the tool has all these features and benefits, it is difficult to set up and has limited integration capabilities.

Key features
- Attribution:
This feature enables marketers to leverage attribution models that align with their business goals. It helps attribute revenue to influential campaigns and boost conversion rates. The fact that Bizible can run multiple attribution models in parallel makes it stand out from the rest.
- Intuitive Dashboards:
Bizible’s dashboard reports insights on marketing KPIs in a highly visual and intuitive format. The KPIs include ROI, pipeline velocity, marketing expenditure, and more. As a result, marketers can easily understand the campaigns' effectiveness and optimize them.
Pricing
The pricing details of Bizible are available upon request.
4. Rule Analytics

Ruler Analytics is a marketing attribution tool that tracks online and offline touchpoints. Its attribution feature automatically links revenue with channels and campaigns.
On top of customer journey tracking, Ruler Analytics also delivers insights into how quality leads behave. This further helps marketers optimize their campaigns and target high-quality leads.
The tool is intuitive, easy to set up, and provides good customer support. Also, Ruler Analytics allows users to leverage various attribution models to build reports on all essential data.

Key features
- Marketing Attribution:
Ruler Analytics’s attribution feature automatically attributes revenue to the most influential touchpoints. They track all visitor touchpoints, match leads to marketing data, and attribute revenue to appropriate campaigns.
- Predictive Analytics:
The feature uses statistical modeling and machine learning to analyze historical data and forecast business outcomes. It can interpret and make sense of the sales and marketing data and identify patterns and trends. This helps marketers optimize marketing strategies to yield better results.
- Marketing Mix Modelling (MMM):
This feature uses statistical modeling to understand how marketing activities impact sales results. It also makes marketing reporting easier and provides view-through attribution.
Pricing

Ruler Analytics’ pricing plans are as follows.
- Small/Medium Business - £199 per month (0 - 50K visits)
- Large Business - £499 per month (50K - 100K visits)
- Enterprise - £999 per month (100K+ visits)
It also has an Advanced plan with pricing available upon request (POA).
{{INLINE_CTA_A}}
5. Singular

Singular is another marketing platform that provides attribution solutions. With singular, marketers can
- Measure and report on all channels
- Analyze ROI by combining attribution with cost aggregation
- Track and analyze the customer journey
- Monitor a single-managed pipeline for analysis-ready marketing data.
Its open integration framework enables marketers to measure performance across apps, web, SMS, referrals, email, and TV. The tool is easy to set up and delivers robust support for server-side integrations.

Key features
- Mobile Attribution:
It offers marketers a complete view of ROI and performance and analyzes the impact of every dollar spent. It allows marketers to set up attribution settings for each channel. The feature can prioritize touchpoints based on their impact on the users' decision to install or engage with the app. The attribution methods include multi-touch, UTM tracking, and website-to-app attribution forwarding.
- SKAdNetwork Attribution:
This is specifically for improving ad performances on iOS devices. This feature helps marketers save time and effort by automating the conversion value decoding process. In addition, it provides more accurate insights into ad performance on SKAN.
- Cross-Device Attribution:
This feature can track and analyze user engagement and acquisition across multiple devices. These devices can be desktops, smartphones, or tablets. Thus, this feature gives marketers a comprehensive view of customers' journeys and interactions.
Pricing

Singular offers a free version and a free trial for their paid plans. Contact their team for details on plans - Growth and Enterprise.
6. Full Circle Insights

Full Circle Insights is another marketing analytics and attribution platform that can help optimize marketing efforts. The tool is built on the Salesforce App Cloud, ensuring seamless integration between the two platforms.
It provides various features, including funnel metrics, camping attribution, and performance reporting. It also offers customizable dashboards and reports to meet each business's unique needs and goals.

Key features
- Pipeline analysis:
This feature helps users identify influential touchpoints at each stage of the customer journey. In addition, the tool’s detailed reporting enables businesses to optimize and improve their marketing efforts with ease.
- Out-of-the-box Attribution Models:
Marketers can choose from various attribution models and customize them to track and analyze their GTM efforts. This helps marketers make data-driven decisions for allocating marketing resources.
Pricing

Full Circle Insights’ pricing plans are not transparent. Contact their team to get more details.
7. LeadsRx

LeadsRx is a SaaS platform that provides attribution solutions. It helps marketers and agencies measure the performance of their marketing efforts.
LeadsRx can track and measure the impact of touchpoints across multiple channels (online & offline). It enables marketers to understand how each channel drives conversion and revenue and optimize their campaigns accordingly to maximize ROI.
It has a responsive and intuitive UI and gives excellent customer support. And it also enables easy set-up.

Key features
- Radio and Television Attribution:
LeadsRx is able to attribute radio and television along with other marketing channels. Its flexible attribution window allows users to change the period from hours to seconds. Additionally, the tool also allows users to monitor decay curves and arbitrate station overlap.
- Attribution for Podcast, Audio Streaming, and Video Streaming Advertising:
LeadsRx supports multi-touch attribution for all audio and video streaming platforms. It also provides insights into how well podcast ads perform and helps optimize them to improve ROAS. LeadsRx is the first-ever marketing analytics company to measure real-time podcast ad performance.
Pricing

Contact the LeadsRX team for details.
8. Improvado
Improvado is a marketing and sales intelligence platform that automates data integration, reporting, and insights, with AI agents to help teams monitor KPIs and simplify analytics.
It centralizes data from marketing sources and produces analysis-ready, cross-channel reporting for your business intelligence tools.
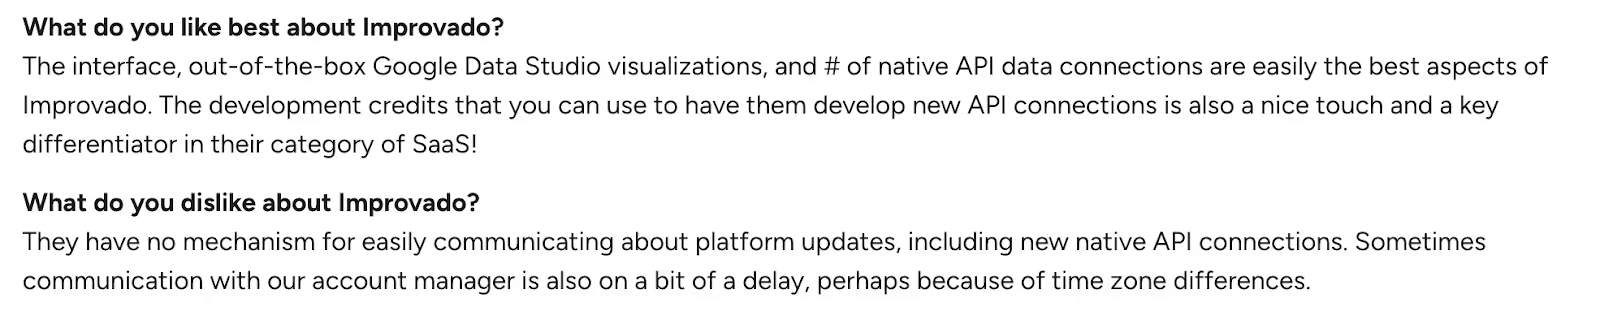
Improvado reviews
G2 reviewers commonly highlight ease of use, ease of connecting new APIs and seamless integrations.
Key features
Unified Marketing Data Pipeline:
Centralize data from ad, analytics, eCommerce, and other sources, then pipe it to your sales/marketing tools stack (e.g., Tableau, Looker) with automated connectors.
Data Harmonization & AI Insights + Governance:
Generate analysis-ready cross-channel reports, get automated AI insights, and operate under SOC 2, HIPAA, and CCPA compliance (data transformation guidance included).
Pricing
Public pricing is unavailable.
9. CaliberMind
CaliberMind is a B2B GTM intelligence and multi-touch attribution platform that unifies marketing and sales data, tracks buyer touchpoints, and ties programs to revenue so teams can prove what’s working.
It offers engagement-driven funnels, customizable attribution models, and role-ready insights, with native connectors for systems like Salesforce, HubSpot, and Marketo.
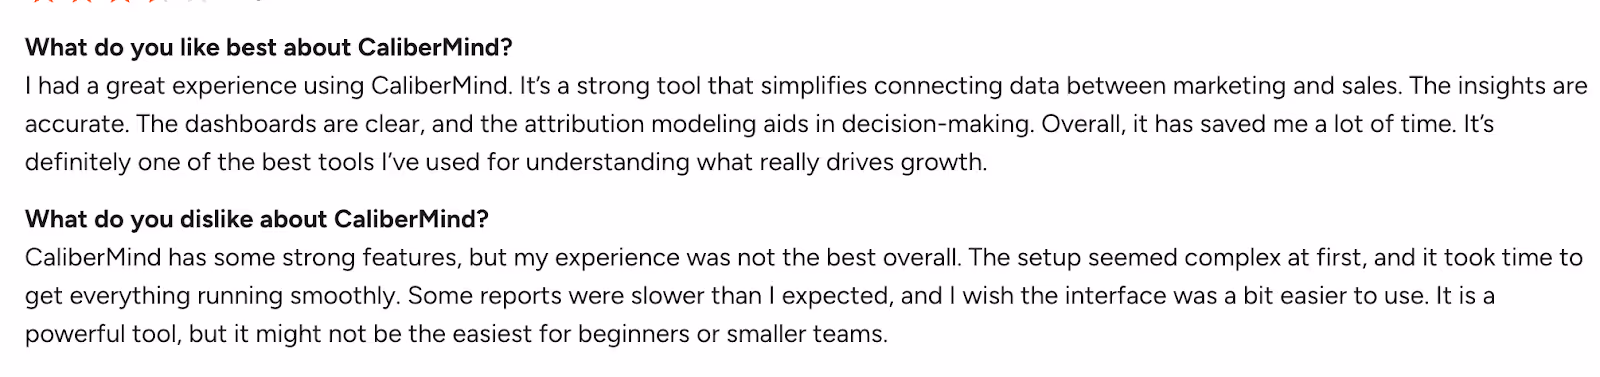
CaliberMind reviews
Users describe CaliberMind as powerful for attribution and data unification, and frequently call out helpful customer support.
Source: G2
Key features
Multi-Touch Attribution:
Build and compare models (e.g., W-shaped, chain-based, even-weighted) side-by-side to reflect your real buyer journey and explain marketing’s impact.
Unified data warehouse & data pipeline:
Every plan includes an enterprise-grade unified data warehouse, an end-to-end data pipeline for consolidation, and full-funnel tracking.
Pricing
Public pricing is unavailable.
10. Funnel
Funnel is a marketing data hub that collects, prepares, and delivers marketing and sales data so teams can analyze performance and build reliable reporting. It pulls data from multiple sources into one place, standardizes metrics and dimensions, and routes analysis-ready data to your tech stack.
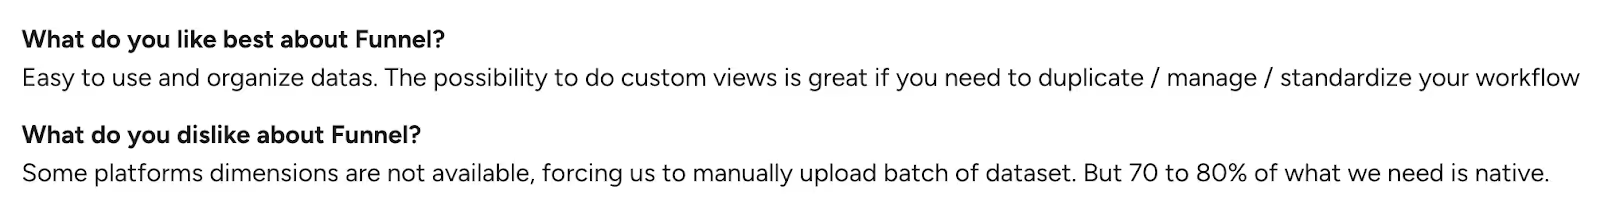
Funnel Reviews
Users often highlight Funnel’s easy-to-use interface and how it streamlines multi-source reporting.
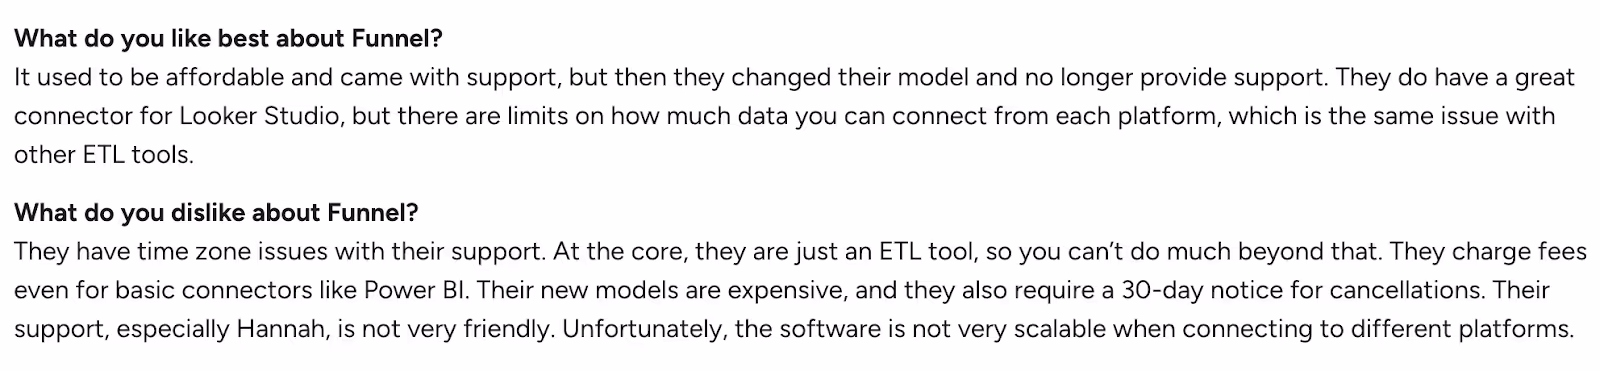
Source: G2
Pricing
Public pricing is unavailable.
Best Dreamdata Alternatives and Competitors: Smarter Attribution Tools That Drive Revenue
If you’re swimming in B2B data but still guessing which touchpoints create pipeline, you’re not alone. Dreamdata is a solid entry point for attribution, yet many teams hit the same walls: steep setup, premium price, and limited drill-down when you need granular answers.
Good news: you’ve got options.
The above 10 standout tools make attribution clearer, faster, and more actionable, so your team can spend less time stitching spreadsheets and more time accelerating revenue.
Why these shine: They lean into usability, deeper analytics, and clear ROI visibility, without the hair-pulling setup.
Top Leadfeeder Alternatives
Businesses seeking cost-effective and feature-rich website visitor identification tools can explore various alternatives.
1. Leading Alternatives: Factors.ai for advanced analytics and attribution, Visitor Queue for affordability and effective lead tracking.
2. Key Features: Pricing flexibility, seamless integrations, high data accuracy, and real-time visitor insights.
3. Decision Factors: Evaluate based on budget, integration needs, and business-specific requirements.
Selecting the right platform enhances lead generation, improves marketing efficiency, and drives better conversion rates.
How to pick your best-fit
Match the platform to your reality:
- GTM architecture: Where does your data live today (and tomorrow)?
- Data maturity: Do you need plug-and-play or deep modeling control?
- Reporting expectations: Board-ready attribution? Ops-level diagnostics? Both?
Do this next:
- Shortlist 3 vendors that match your stack reality today, not your wishlist tomorrow.
- Run a 30–45 day pilot with the same campaigns and conversion definitions.
- Score on four things: model fit (touchpoint accuracy), time-to-value, CRM cleanliness, and exec readability.
- Back-test against closed-won to sanity-check lift, not just clicks.
Remember, attribution isn’t the finish line, repeatable revenue is.
{{INLINE_CTA_A}}
Dreamdata is a popular B2B revenue attribution platform that helps businesses analyze marketing spend, measure ROI, and fine-tune campaigns. However, many marketers have pointed out its complex setup, steep learning curve, and limited functionality in the free version as significant hurdles.
This has prompted businesses to seek more agile and user-friendly alternatives that offer intuitive interfaces, faster implementation, and deeper analytics out of the box.
Factors.ai stands out as a top contender—offering:
- No-code integrations with CRM and marketing tools,
- Automatic event tracking, and
- Retroactive data capture, all in one seamless platform.
Other strong alternatives to consider include:
- HockeyStack – for rapid insights and flexible dashboards,
- Demandbase One – great for ABM-focused attribution,
- Constant Contact Advanced Automation – simple automation with robust support,
- HubSpot Marketing Hub – all-in-one with a strong CRM backbone,
- Salesforce Marketing Cloud Account Engagement – ideal for enterprise-level marketing teams,
- Usermaven – a privacy-friendly, lightweight analytics solution.
Whether you're a startup or an enterprise, choosing the right attribution tool depends on your goals, team size, and technical requirements. Tools like Factors.ai are helping bridge the gap between ease of use and powerful analytics, making revenue attribution more accessible than ever.

