

Lead Forensics Pricing, Reviews & Overview | 2024
Looking to learn more about Lead Forensics pricing, features, and more? The following article provides a comprehensive overview of everything you need to know about Lead Forensics pricing.
Lead Forensics is a popular B2B website visitor identification tool that reveals anonymous companies visiting a website and surfaces relevant contact details (Email, Phone numbers, etc) within those companies for outreach and targeting. Lead Forensics is used primarily by B2B marketers, sales folk, and agencies to leverage existing website traffic to drive sales revenue and marketing ROI.

Lead Forensics Pricing & Plans
Lead Forensics offers two plans: Essential and Automate. Essential is designed for small to medium sized businesses to identify anonymous businesses viewing your website, unlock relevant contact data (phone numbers, mail ID, etc) and manage existing leads. Automate offers all this, plus additional features such as custom workflows, sequence actions (or as they call it, The Orchestrator), advanced CRM integrations and Fuzzy matching algorithm to maintain data hygiene.

Here’s a detailed feature overview of how the two plans compare to each other:
Note that:
- Lead Forensics offers a 7-days free trial
- Lead Forensics does not offer a free plan
Unfortunately Lead Forensics does not openly reveal its pricing details. You’ll have to reach out to their sales team for an accurate quote based on your requirements and scale. That being said, we’ve dug deep to find what we can about Lead Forensics’ pricing:
Anecdotal evidence suggests that Lead Forensics pricing runs between around $250 to several thousand per month, depending on the volume of website traffic. Multiple reviews also highlight that obtaining contact data (phone numbers, email addresses, etc) cost an additional fee on top of the monthly platform subscription fee


To be fair, the few reviews that do provide hints into Lead Forensics pricing are…well, unhappy customers. Ignoring their not-so-great opinions of the product, we can see that Lead Forensics charges these users approximately £209 + vat per month (or $260/mo) and $500 per month respectively.


“To ensure a right sized solution for each of our clients, our pricing model is based upon relevant B2B traffic to a website or specified web pages. We offer a free trial period to ascertain the traffic volumes over a one week period. After which time, we will produce a bespoke proposal tailored to your business and your visitor traffic levels. We are committed to producing the right package and proposal for your business, which is why we don't have an off the shelf pricing model.” - Lead Forensics
Lead Forensics Reviews
Lead Forensics claims to maintain one of the world’s largest B2B IP-databases. But how do Lead Forensics customers find the platform to be on a day-to-day basis? Here’s what reviews have to say about user experience with Lead Forensics:
In Summary
Lead Forensics Benefits:
- Intuitive onboarding
- Customer support
Lead Forensics Drawbacks:
- Data inaccuracy
- Cost
Lead Forensics Rating:
- G2: 4.3/5
- Capterra: 3.4/5
- TrustRadius: 2.6/10


Lead Forensics Alternatives
There are several account identification and intelligence solutions out there. Here are a few common Lead Forensics alternatives to consider:
- Factors.ai - for data-accuracy and advanced analytics, scoring, and attribution
- Leadfeeder (Now Dealfront) - for EU-centric account intelligence
- Clearbit - for accounts and contact level intelligence

Factors is a leading account intelligence solution that helps B2B teams identify, qualify, and convert anonymous website traffic. Factors works with industry-standard data partners to provide accurate, cost-effective account intelligence. Why Factors over Lead Forensics?
- Better data: Factors identifies up to 64% of anonymous traffic — that’s 27% more accounts than the closest alternatives.
- Better intent signals: Factors stands out from alternatives in that it captures intent signals (ad views, impressions, page views) from LinkedIn and G2 in addition to website activity for holistic account engagement tracking.
- Better deals: While Lead Forensics doesn't openly reveal prices, internal demos reveal that Factors provides far more cost-effective plans. Learn more here: factors.ai/pricing
- Better analytics: Factors is built upon strong analytics and attribution foundations. As a result, it provides granular website tracking, path analysis, timelines, and more.
Lead Forensics Pricing Plans
Lead Forensics offers flexible plans tailored to different business sizes and needs.
1. Pricing Tiers:
- Essential: For SMBs, includes visitor identification, contact details, and lead management.
- Automate: For enterprises, adds CRM integration, customizable workflows, and AI-driven sequencing.
2. Key Features:
Anonymous visitor tracking, advanced lead insights, and automated engagement workflows.
3. Pricing Estimates:
Ranges from $200 to $2,000+ per month based on traffic and feature requirements.
For accurate pricing, businesses should contact Lead Forensics directly to receive a customized quote.
FAQ
1. What does Lead Forensics do?
Lead Forensics tracks business IPs to identify anonymous website traffic at an account-level. Once a visiting company has been identified, Lead Forensics also shares relevant contact information such as mail IDs and phone numbers to streamline outreach and targeting.
2. What is the lead forensic code?
The Lead Forensics code is a tiny piece of code placed on a business website. It’s this code that enables users to identify websites visitors’ business IP addresses. This IP is then matched with an IP database to reveal business names and properties.

Pipeline Velocity: Definition, Formula & Strategies
There’s no doubt that B2B sales is increasingly being conducted in a methodical, scientific manner. Using a wide range of metrics and KPIs, this data-driven sales process ensures minimal revenue leakage and optimized pipeline performance. You may have heard of a few common sales metrics: customer acquisition cost, customer lifetime value, average revenue per user, etc.
This article focuses on a lesser known, yet enormously important metric to monitor & improve the overall health of sales: pipeline velocity. Let’s explore everything you need to know about pipeline velocity; what it is, how to calculate it, and most importantly, how to improve it.
What is pipeline velocity?
In short, pipeline velocity is the speed at which qualified opportunities move through the sales pipeline.
In other words, pipeline velocity is used to measure how quickly leads are being converted into paying customers. This helps understand the efficiency of the sales process and identify areas of improvement.
Think of a literal pipeline: if it’s chock-full of debris and leaks, the flow of water will be limited and inefficient. On the other hand, if it’s squeaky clean, a large volume of water can flow uninterrupted at maximum speed.

Similarly, a high-velocity sales pipeline results in a consistent, voluminous flow of leads and ultimately, revenue. You can see why it’s so important to keep track of this metric.
How to calculate pipeline velocity?
Pipeline velocity is calculated using 4 other metrics:
- Opportunities - how many qualified opportunities are in your pipeline?
- Deal size - what is the average contract value of deals in your pipeline?
- Win rate - what percentage of opportunities will likely convert successfully?
- Length of sales cycle - on average, how many days does it take to close a deal?
Here’s the most commonly accepted pipeline velocity formula:
Pipeline velocity = (Opportunities x average deal size x average win rate) ÷ length of average sales cycle (in days)

Let’s take an example. Say we have 60 qualified opportunities at various stages along the pipeline. The average deal size of these opportunities is $5000. Historically, we’ve observed a win rate of 20% and sales cycles of around 30 days. Accordingly, our pipeline velocity may be calculated as follows:

Extrapolating this, we arrive at a figure of $2000/day x 30 days for $60,000 per month.
You may notice from the pipeline velocity formula that there are a few ways to improve pipeline velocity:
- Increase number of opportunities
- Increase average deal size
- Increase win rate
- Decrease length of sales cycle
Each variable is a lever that may be pulled to ramp up pipeline velocity. Of course, the most obvious way is to increase the number of opportunities/leads and deal size (easier said than done!). That being said, improving the buyer experience is a low-hanging fruit that results in dramatic improvements in win rates and quicker sales cycles.
But what makes improving the pipeline velocity so important anyway? Here are a few benefits of tracking and optimizing pipeline velocity:
Why is pipeline velocity important?
As HubSpot’s director of sales, Dan Tyre, puts it:
“Sales managers live in fear that their pipeline is a bunch of fluff. In today’s world of instant gratification, uncovering a sense of urgency and establishing sales pipeline velocity is important because it uncovers a slow-moving, or worse, stagnant pipeline”.
1. Understand the overall health of the sales pipeline
Understanding your pipeline velocity helps keep tabs on the overall health of your sales pipeline. By knowing what works and what needs improvement, you can bring iterative, targeted changes to the sales engine. More revenue, less costs — win, win!
2. Ensure accurate sales forecasting
Measuring your pipeline velocity on a regular basis helps with accurate sales forecasting. For instance, taking the previous example, we have a pipeline velocity of $2000 per day, which can be expanded to $60,000 per month or $180,000 for the quarter. Using pipeline velocity is accurate as it’s based on real-time sales data, not estimates.
3. Improve attribution & ROI
A powerful use-case is realized when pipeline velocity is used in tandem with attribution modeling. Picture this: each of your pipeline sources, broken down by qualified opportunities, deal size, win rate, and of course, pipeline velocity:
In combination with attribution, pipeline velocity can provide valuable insight into the most effective channels — which in turn can help guide marketing decisions and resource allocation. In this case, we see that even though paid social brings in more opportunities, it’s paid search that results in the most ROI given its larger deal size and better win rate.
Sales cycle benchmarks for SaaS
Pipeline velocity itself varies significantly based on the nature and size of the company in question. Instead, here’s a breakdown of the benchmark of length of sales cycles in SaaS
Length of sales cycle:
- Deals < $2000 ACV: 14 days
- Deals < $5000 ACV: 30 days
- Deals < $25,000 ACV: 90 days
- Deals < $100,000 ACV < 90-180 days
- Deals > $100,000 3 - 9 months
Depending on the nature of your business, your win rate should be anywhere from 5-20%. Of course, the number of opportunities and deal size is specific to your product, marketing & sales efforts. It wouldn’t make sense to maintain or refer to benchmarks in this case.
How to improve pipeline velocity?
In short, improving pipeline velocity involves eliminating points of friction along the customer journey and aligning workflows and stakeholders to ensure smooth sailing. Here are a few tactics and strategies to do so:
1. Make the most of existing traffic
Your website is a goldmine of hidden opportunities in the form of yet-to-be-converted accounts. Use an IP-based account intelligence tool (like Factors) to reveal anonymous accounts already engaging with your website, review pages, and ad campaigns.
Given that these accounts are already familiar with your brand, they’re far more likely to convert: thereby increasing your “number of opportunities” and “win-rate”.
2. Let visitors experience your work
As companies increasingly move towards product-led growth, it’s becoming all the more important to show, not tell. While not all products (especially those at early stages) can adopt PLG models, it’s really quite simple and effective to put up an interactive product tour on your website. This gives visitors a chance to know a little more about your work before choosing to book a demo, rather than having to go in blind.
{{CTA_BANNER}}
Again, this likely increases the number of opportunities, reduces average sales cycle length, and improves your win rate.
3. Document. Everything. Always.
There’s no doubt that sales demos and discovery calls are important. But more often than not, buyers don’t have the time to sit through another 30-min. Make life easier for your sales reps, CS team, and of course, the customers themselves by introducing comprehensive documentation on everything they might need to know.
Use-cases, How-tos, Implementation, etc, etc, etc should be easily accessible to anyone interested in your work — to mitigate the risk of unnecessary back-and-forth friction. This will certainly help reduce the length of the sales cycle.
4. Align relevant stakeholders
A vital, yet often overlooked step is ensuring alignment across marketing, sales, CS, and the customers. This involves timely handoffs, relevant communication, straightforward pricing and product details, and clear PoCs across every stage of the customer journey. This helps both the customer and internal departments streamline the sales process end-to-end.
5. Stay on top of data & metrics
The accuracy of your pipeline velocity metrics (and any other metric, really) relies heavily on the quality of your data. Ensure you’re regularly maintaining numbers on qualified opportunities, deal size, and length of sales cycle in your CRM so the same may be leverage for pipeline velocity measurement.
How Factors help monitor & improve pipeline velocity
As important as it is, it can be a tedious, unintuitive chore to measure pipeline velocity — unless you have the right analytics solution, of course :)
Factors is an AI-fuelled intelligence & analytics platform that helps teams identify, score, and track accounts across the customer journey. We’re talking about automated sales velocity calculations, flexible conversion funnels, IP-based account identification, multi-touch attribution, and more — everything you need to kickstart and refine your ABM process and…pipeline velocity!

Accelerate B2B Sales with Pipeline Velocity Optimization
Pipeline velocity is a crucial metric that measures how quickly qualified leads convert into customers, enabling businesses to refine their sales process.
It’s calculated using four key factors:
1. Opportunities: The number of deals in your pipeline.
2. Deal Size: The average value of each deal.
3. Win Rate: The percentage of deals successfully closed.
4. Sales Cycle Length: The time it takes to close a deal.
Improving pipeline velocity enhances sales forecasting, boosts ROI, and ensures a healthy pipeline. Strategies include optimizing existing traffic, effectively showcasing products, and aligning stakeholders for smoother deal progression. AI-driven tools like Factors streamline tracking and analysis, making it easier to refine your sales process and drive faster conversions.
Clearbit + Factors: Partnership Announcement
We’re delighted to announce our partnership with leading B2B marketing intelligence platform, Clearbit!
With this partnership, users can leverage Clearbit’s extensive intelligence database in tandem with Factors’ proven analytics platform to identify, qualify and convert accounts like never before.
Not a Clearbit customer yet? No worries! You’ll still be able to enrich anonymous accounts with over 100+ firmographic & technographic attributes through Factors at no additional cost.
If you’re already using Clearbit, you can simply connect Factors to your Clearbit account using an API key.

We’re super excited for the immense value this partnership brings to our customers. Here are a few ways in which you can expect to make the most of Clearbit + Factors.
What’s in it for you?
Factors is a tried and tested analytics & attribution solution loved by 200+ high-growth SaaS teams. This partnership with Clearbit complements our core features — web analytics, multi-touch attribution, account scoring, path analysis, and more — with robust IP-based intelligence and account enrichment. Here’s what’s in it for you:
1. Identify, qualify & convert
It’s commonly accepted that only about 4% of website traffic actually reveals itself through form submissions or sign-ups. This means that the majority of accounts engaging with your brand, remain anonymous! Now, with IP-based intelligence & enrichment, you can accurately identify hidden accounts visiting your website, engaging with product reviews, or simply viewing ad campaigns. Once identified, you can configure custom scoring criteria to qualify high-intent accounts based on their firmographics, technographics, and engagement.
This is tremendously valuable to marketing and sales teams as it’s far more effective to prioritize in-market, brand-aware accounts as opposed to cold accounts from generic ICP lists.

With Factors x Clearbit, you can accurately identify up to 50% of anonymous accounts already engaging with your brand. These accounts may then be filtered down to ICP accounts based on firmographic and technographic properties such as industry, size, geo, techstack and more.
Now, it’s probably unlikely that all ICP accounts on your website are ready-to-buy. Some may be further along the funnel than others. Factors helps qualify sales-ready accounts based on their engagement across websites, product reviews, and ad impressions.
Let’s take 5 milestones to explain:
- visits pricing page
- visits G2 review
- reads blog for > 30s
- views LinkedIn ad
- opens sales email
On Factors, you may configure your scoring model to tag accounts that complete all 5 milestones as “hot”, accounts that complete none as “ice”, and accounts that complete 2-3 milestones as “warm”. Note that this scoring model is completely customizable within Factors based on the touchpoints you care about most.
Ultimately, this combination of intelligence and analytics empowers teams to go after the right accounts at the right time to drive markedly more conversions.
But don’t just take our word for it…

2. Build workflows, effortlessly
Go-to-market teams should spend less time worrying about operations and logistics and more time iterating on strategy to drive pipeline. To support this approach, Factors can push relevant account data to nearly any other platform (CRMs, MAPs, internal comms, etc) in the world using Webhooks (Zapier, Make, etc).

For example, let’s say your ICP looks something like this: US-based software companies with 500-1000 employees using HubSpot. With Factors, you can configure trigger alerts so when an account that matches this criteria visits a high-intent page (like factors.ai/pricing), Factors can automatically:
- Push this data to a retargeting list in your CRM
- Notify the relevant SDRs on Slack
- Initiate a sequence on your mail automation tool
This way,
- The marketing team can retarget warm accounts with relevant ad campaigns
- SDRs can reach out to relevant prospects while the iron’s still hot
- And known prospects can be placed in a nurture sequence
All without any manual intervention.
In short, Factors can automate a lot of the heavy lifting, so teams can focus on what they do best.
Learn more about how customers use Factors for intent-based outreach and retargeting.

3. Make the most of marketing
If you’re like most B2B teams, you’re investing significantly in paid ads, content & seo, events & webinars, and other marketing efforts. For the most part, however, it's challenging to measure the impact of these efforts.
Let’s take content, for example. Without the right tools, marketing teams have little visibility into which anonymous accounts are reading blogs, how accounts are engaging with case-studies, and what the bottom-line impact of content assets are.

As a solution to this, Factors and Clearbit complement each other seamlessly to:
- Identify anonymous organic traffic to monitor traffic quality
- Measure engagement with metrics such as time spent & scroll-depth
- Attribute the impact of ungated content assets on conversions & pipeline
There are several other ways in which our customers are leveraging Clearbit’s intelligence with Factors’ analytics and attribution. If you’re curious to learn more, schedule a demo with our team here:
{{CTA_BANNER}}
Why Clearbit?
While it’s true that there are several B2B intelligence platforms and alternatives out there, Clearbit stands out as one of the best when it comes to accuracy, technology and value. As a leader in this space, Clearbit is home to one of the largest, most reliable IP databases & infrastructure in the market.
We believe that this partnership will further empower our customers to discover otherwise hidden buyer intent, build robust audience lists, analyze the impact of content and campaigns, and improve customer experience and conversions across the board.
FAQ
1. Do users need a separate Clearbit account to use this?
Nope! You do not need to be a Clearbit customer. Our partnership allows users to leverage Clearbit data as part of Factors for no additional charge. Learn more about how this works over a quick chat with our team!
2. How does pricing work?
Access to Clearbit data is part and parcel of our pricing plans at Factors. You won’t have to pay extra or purchase Clearbit separately. Instead, our pricing is based on the volume of accounts identified and monthly unique visitors. Learn more about our pricing here: factors.ai/pricing
3. Can Factors identify email IDs or phone numbers of anonymous website visitors?
No. Factors works with data partners to discover account-level information such as company name, industry, size, technographics, and much more. Factors does not identify or distribute anonymous user level information such as phone numbers or mail IDs.
4. Is Factors privacy compliant?
Absolutely! Factors is aligned with GDPR & PECR privacy standards. Factors is also SOC2 Type II certified. Rest assured, your data is yours alone — and is protected vigilantly with industry-standard security practices. Moreover, Factors only de-anonymizes IP data at an account-level. We do not identify or distribute anonymous user-level data (personal phone numbers, mail IDs, etc) whatsoever.
5. How does IP-based identification work?
Read more about how IP-based account identification works here.

Linkedin Ads For Early-Stage Teams: Framework & Priorities
With over 750 million users, LinkedIn is by far the largest professional network in the world.
What started off as a simple platform for like-minded business people to connect, has transformed into a social media behemoth. Today, LinkedIn offers everything from algorithmic news feeds, LinkedIn groups, live streaming, and of course, a wide range of advertising mechanisms.
What does this mean for us B2B marketers? Opportunity.
LinkedIn’s massive database of professionals, companies, and industries may be leveraged by marketers to reach out to the right audience with the right message and drive high-quality opportunities.
But there’s no hiding behind the fact that paid marketing on Linkedin can be expensive and competitive — especially for Seed/Series A companies looking to make limited budgets go a long way.
As a result, early-stage teams generally prefer spending on Search Ads over LinkedIn. The former is believed to drive more high-intent leads and in turn, better return on ad spend. Conversely, LinkedIn is thought to be better suited to bigger companies for expensive, top of the funnel branding campaigns.
This is not necessarily true.
When executed well, LinkedIn ads can be an effective channel to generate high-quality leads and bottom-of-the-funnel pipeline — even for smaller teams. This chapter of our no-nonsense guide explores the Linkedin ads framework we’ve crafted over months of wins, mistakes & learnings as an early-stage start-up.
We won’t be discussing the basics of Linkedin Ads given that there’s loads of resources available on this as is. Instead, you can expect to find practical guidelines to pick off low-hanging fruit and drive RoAS.
Linkedin Ads For Series A: Framework & Priorities
Quick results with limited spend and minimal effort is at the core of our LinkedIn ads framework. With that in mind, we suggest using LinkedIn ads to target the following audiences:
- Retarget prospects that are already engaging with your company
- Target customers of your competitors
- Target top of the funnel ICP audience with ABM
Given that not all accounts are equally likely to convert, It’s important to prioritize the right set of audiences. Here’s an order of priority we’ve been seeing growing success with:
1. Your first priority should be to retarget accounts that are already interacting with your brand — visiting high-intent pages, engaging with G2 reviews, or viewing previous LinkedIn ads. Given that these accounts already know about your product/company in some capacity, we can safely assume that they’re problem, solution AND brand aware.
This audience is at a stage where they’re researching solutions (including yours!) to solve a challenge that they’re actively facing. This set can also include lost and churned accounts that have returned to engage with your brand.
In short, this audience is relatively further along the sales funnel and accordingly, will require the least effort (and spend 😉) to convert.
2. Next, look to target customers of your competitors. While this set of audience may not be aware of your brand, they’re certainly aware of the problem and are in fact already using an alternate solution. This implies that they’re ready to buy and may consider switching to your solution if it’s a better fit. In terms of ideal customer profile, it doesn't get much better than this. Use sales intelligence tools like Builtwith or Slintel to generate competitor customer lists.
3. Finally, target your general ICP audience with account-based marketing (ABM). This consists of the set of accounts that fit your ideal customer profile criteria (based on size, industry, revenue range, technographics, etc). Although this set of audience would make great customers, they’re unaware of your brand as well as the problem your product is solving for. Accordingly, these accounts will require the most effort (and spend) to convert.
With this priority framework established, let’s explore how to build these audience lists, run ads that convert, and optimize paid LI ads.
I. Build Audience Lists
For Retargeting…
Here’s a 3 step process on creating an audience list for LinkedIn retargeting
Step 1. Identify accounts from your website, reviews, and ad impressions

Use LinkedIn’s website tracking pixel in tandem with IP-based account identification tools to discover anonymous companies engaging with your website, G2 reviews, and previous LinkedIn ads.
Tactical Tips: LinkedIn’s website tracking pixel is limited to the number of visitors who actually accept cookies upon landing. This may be an issue for smaller teams with limited traffic because visitors accept cookies only 11% of the time. This may dramatically shrink your audience list. Luckily, there’s a quick fix:
Use an “opt-out” cookie policy instead of an “opt-in” policy everywhere outside the EU to have cookies accepted by default. Both policies are privacy compliant outside the EU, but an “opt-out” policy will result in far more accounts identified by the LinkedIn pixel.

Step 2. Filter down your targets
Depending on the size of your website, you may identify hundreds or thousands of unique accounts every week. It’s probably unrealistic to go after each and every one of them. Instead, refine your list by only targeting accounts that visit high-intent pages (Pricing, Landing pages, Comparison blogs, G2 reviews etc) and fit your ideal client profile based on geography, industry, technographic, revenue range, etc. Once complete, you’ll be left with a list of high-fit, high-intent ICP accounts.

Tactical tips: In order to launch a campaign on LinkedIn, you must target at least 1,000 members. (Or 300 members, with Matched Audience — but we strongly discourage the use of MA). Given that you’re likely targeting multiple people from the same company, a final list of 500 accounts is a good starting point.
3. Build a target member list:
At this stage, we have a brand-aware and possibly in-market set of ICP accounts ready for targeting. Use a sales intelligence tool like Apollo, Zoominfo, or LinkedIn Sales Navigator to create a list of at least 1,000 relevant members to target based on their roles, seniority, etc.
Tactical tips: We find that it’s valuable to create awareness across the entire company you’re targeting. Accordingly, we strongly recommend targeting at least 2-3 employees from every account: final users, their managers, and the final purchase decision makers.
For Competitor Customers & ABM
The process for creating audience lists in these cases is straightforward. Skip straight to building target member lists using sales intelligence tools like Builtwith, Zoominfo, Slintel, etc. Construct lists of competitor customers and ICP accounts by apply the right filters (technographics, firmographics, roles) so you’re left with the right contacts from the right companies.

Now, we’re all set to run highly targeted ads that drive conversions.
II. Run ad campaigns
At this stage, we have a primed list of high-fit, high-intent audience fit for targeting. It's safe to assume that every member we’re targeting would find the product/service we’re marketing to be, at the very least relevant, if not of explicit interest to them.
So now, we run great ads! Here are a few point to keep in mind:
Define objectives
The objective and approach of your LinkedIn ads should differ based on the audience you’re targeting. For instance, retargeting ads should look to convert brand-aware accounts and accordingly can be far more direct as compared to ABM ads targeted towards brand-unaware accounts. Here’s how to think about it:
With retargeting ads, ads you’re targeting members that have already visited your website, interacted with your review pages, or viewed a previous ad. We needn’t create brand awareness from scratch. Instead, we should aim for these ads to generate sign-ups. Accordingly, use straightforward lead-gen forms instead of content assets or website redirects here. In this case, leads generated and conversion rate will be the two key objectives. You may also track cost per conversion and cost per lead. Targets for these will vary based on your budget and ACV.

Tactical tips: Keep the number of form fields to a minimum. Work mail and phone number are plenty.
With ads targeted towards competitors' customers and ICP audience in general, it’s better to use a 2-stage funnel: the first stage involves running comparison ads or branding ads to create awareness about your solution. The second stage involves converting target accounts with standard lead gen forms. While this is a more elaborate process than a simple lead gen form, it’s sure to drive better conversions as the target audience will be aware of your work, and thus more likely to submit a form.

Make a mark with messaging
You do not want to run pesky ads and have people mute your campaigns. It’s vital to incorporate customer research into your ad copy and designs to capture positive attention. Even little things like line breaks and emojis can make or break your campaign.

Remember to sell on every element of the ad: the intro text,headline, in-image text, description, etc. Most users won’t consume every part of the ad in its entirety — so ensure that each element is persuasive in its own right:

Depending on the target audience, you’ll want to use different messaging. The two examples shared above are relatively more direct with a clear objective — “let us give you a free trial”. This will probably be better suited to retargeting campaigns.
{{LINKEDIN_BANNER}}
For ads targeted towards competitors, however, comparative ad creatives are likely to perform better. That being said, it’s also important to stay on the right side of the law and respect copyright and trademark policies. Here are a few competitor ad creatives we’ve found success with:


Experiment. Experiment. Experiment.
Continue to experiment with different ad formats, messaging, and creatives until you identify what clicks. Here are a few examples of ads we’ve found success with:
1. Testimonial ads:

2. Before/After ads:

3. Ads with a hook or questions:

And there you have it! Advertising on LinkedIn, when done right, can be a highly effective channel to drive pipeline and revenue. To conclude, here are a few common mistakes to avoid while running LinkedIn ads:
- When using LinkedIn targeting, ensure that job titles are set in inverted commas so LinkedIn only targets users with those specific titles as opposed to related ones. Eg: ‘CMO’, ‘PMM’, etc.
- Do not use the audience network on LinkedIn as it generally targets irrelevant members resulting in wasted spends.

What is Content Analytics and How Should You Approach It? Here’s What 10 Experts Have to Say
As digital marketing takes on new complexities, it’s essential for your marketing plan to incorporate content analytics. This will help you have a more detailed understanding of how customers interact with your company. You’ll be able to make more informed, data-driven decisions to effectively reach and convert your target audience.
What is content analytics?
Content analytics, or content intelligence, is a set of technologies that analyzes digital content in order for you to understand which content is performing well with your target audience. This enables you to create the most effective digital content possible to drive more conversions.
How does content analytics work?
B2B companies often offer highly specialized solutions. Accordingly, businesses must target their niche audiences with dedicated marketing initiatives and content that address relevant paint-points and use-cases.
You can generally figure out which content works best for your clients by analyzing certain metrics for the unstructured content your business has put out. Analytics and attribution tools like Factors.ai help marketing teams with granular insights into content performance and bottom line impact.
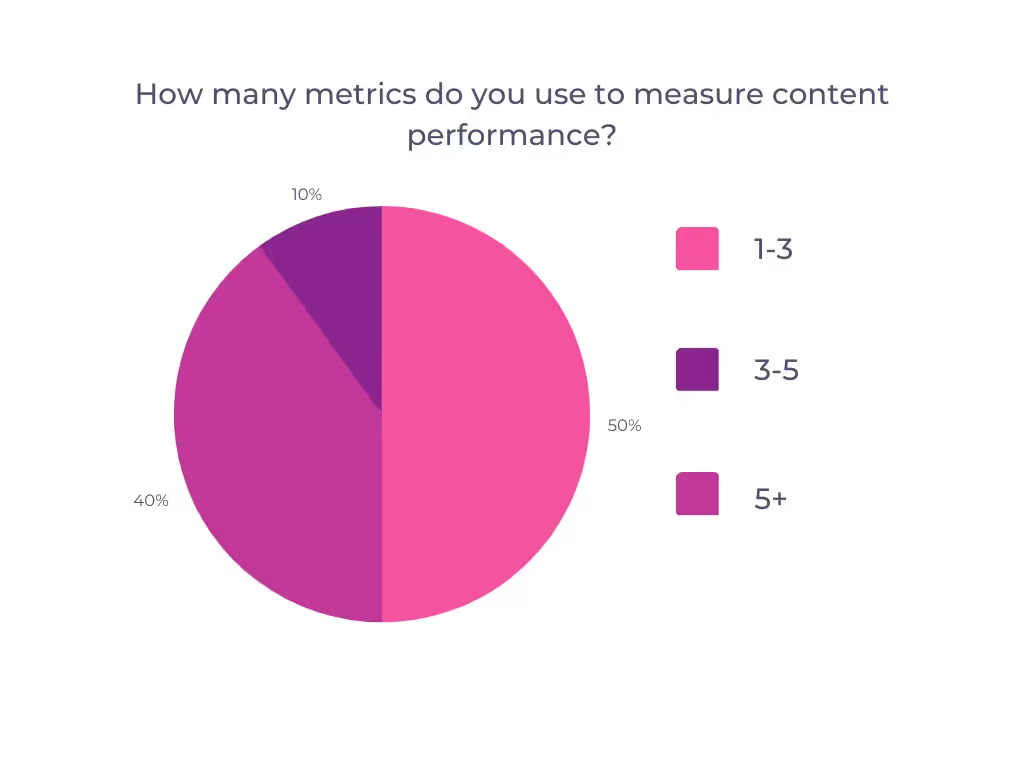
It’s important to remember that content analytics and attribution isn’t a linear process. We got in touch with B2B content industry leaders to ask how many metrics they use to measure content performance. Here’s what they had to say:
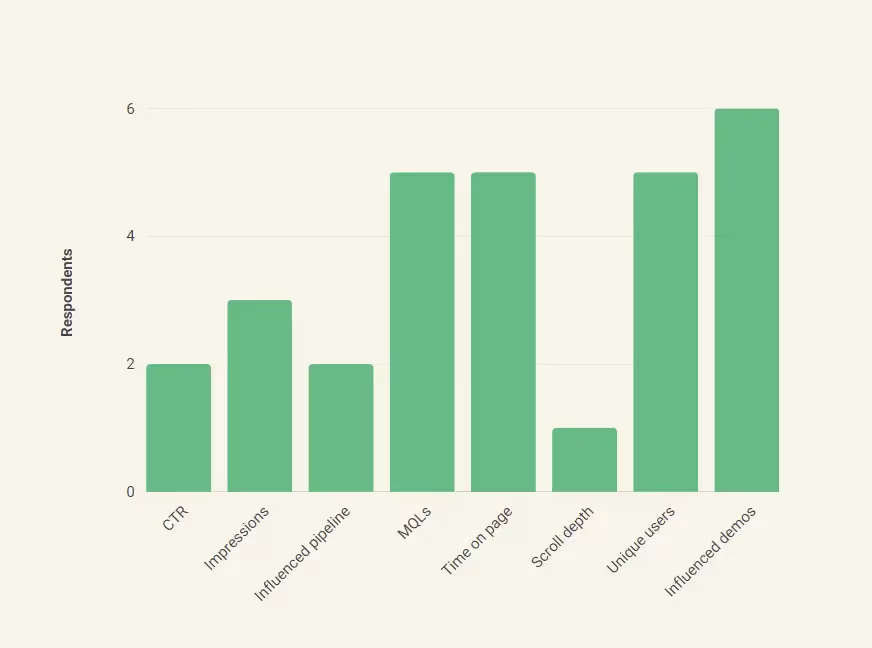
We also asked them which metrics they think are the most important in measuring the effectiveness of content. Here’s what they had to say:
- Clickthrough rate (CTR): Sophia Madhavan at GrowthMakerz and Vitaliy at Videowise include the CTR in the list of metrics they use to evaluate how well their content is doing. The CTR allows you to see how many times visitors to a certain page organically search for your content or click on your ad as a ratio to the total number of visitors to that page.
- Impressions: Impressions give you insight into the level of engagement your content is generating. This content could be a web page, advertisement, or blog post, for instance. Madhiruma Halder at Recruit CRM lists impressions among the metrics they use to understand how their social media campaigns and search engine marketing are performing.
- Marketing qualified lead (MQL): Not all leads are created equal. A lead that takes any high intent actions like scheduling a demo or signing up for a trial is far more likely to convert than others. Karishma Chopra at Hiver believes that the effectiveness of content should be measured in terms of its influence in driving MQLs.
- Time on page: The time a prospect spends on a particular page is indicative of their interest in the solution you’re offering. Praveen Das at Factors then uses these insights to create marketing campaigns informed by the content their prospects and clients are interested in.
- Scroll depth: Scroll depth is a measure of how far your website visitors scroll down a certain page. As a general rule of thumb, if most of your website visitors are scrolling at least halfway down the page, it indicates that your content has substantial value.
- Unique users: Chelsea Downing-West at The Martec finds unique users a crucial metric. The number of unique users may be challenging to calculate. Effective visitor identification allows you to see how many unique visitors your website receives by counting each visitor only once, no matter how often they visit the website.
- Bounce rate: The bounce rate of your website indicates the ratio of visitors who access your website and leave instead of clicking on and going through other webpages.
- Engaged Accounts: Understanding which specific accounts are consuming the content is another intuitive way for content marketers to analyze its effectiveness. Visitor Identification softwares like Factors can help marketers identify the account and its properties (employee range, industry) even if the user does not fill up a form. This helps Content Marketers plan content efforts tailored to specific industries or scale of employees.
Why is content analytics important?
Your website content is the first thing that prospects see when they’re evaluating your company. It creates a lasting impression about your services. Content analytics helps you understand the types of content that perform well among your target audience, which in turn is crucial to designing a successful customer experience.
Moreover, marketing teams spend a substantial amount of time and budget to create content that prospects find valuable. A few of the experts we surveyed responded that they hire in-house teams for content creation and distribution. This indicates how valuable creating effective marketing content is to increasing overall revenue; B2B companies are willing to invest in salaries, 401(k)s, and insurance to generate engaging content. Respondents stated that they spent anywhere between $1000 and $10,000 a month towards content creation and distribution.
This expense makes sense when you consider how much content contributes to the overall pipeline. Respondents stated that the monthly investments they make towards content creation reaps significant rewards. Although responses varied greatly, most of the experts cited that around 30-40% of the pipeline is influenced by content creation and distribution.
Creating valuable content for prospects is almost entirely dependent on content analytics. Content analytics offer your sales and marketing teams multiple benefits:
- Helps marketers redefine their strategy based on how current content is performing
- Calculates the ROI for each piece of content, which in turn guides future content strategy and content repurposing.
- Superior prospect experience by focusing on the most relevant content and elimination of guesswork
- Quicker and easier conversion for prospects by offering them content that is relevant and important for them at each stage of the funnel
- Cuts down on redundant content by immediately finding out when certain pieces are underperforming
How can content analytics contribute to a better customer experience?
Understanding each interaction a prospect or customer has with your website and other marketing collateral enables you to improve your content offerings. You’ll be able to offer customers a far better experience by analyzing and iterating based on content data. Content analytics helps you:
Offer relevant content
You can offer clients valuable content depending on where they are in the conversion process. Content analytics help you anticipate which content is relevant at every stage of the funnel, thereby streamlining communication with prospects and clients alike.
Address specific client needs
You can also create a 360-degree buyer persona for existing clients. An integrated analytics software like Factors allows you to have a holistic overview of each client so you can see every interaction they’ve had with your company. You have access to each touchpoint and all their past behavior, thereby enabling you to make educated guesses about their pain points.
For instance, let’s say you run a company that creates CRM software. You could find through trends in content analytics that customers from the tourism industry are interested in the customer service features it offers. On the other hand, customers in the tech industry are more interested in its customization and workflow automation features. You can then use these trends to offer them content that best fits their needs.
Hyper-personalize your content
Prospects today expect a highly customized experience tailored to their needs. It’s essential to curate a personalized experience in order to create a lasting client relationship. Understanding which channels your client base uses, the keywords they’re interested in, and the time they spend trying to solve a pain point on a webpage are all crucial to personalization.
Make better decisions
Content reporting can help you make deeply informed decisions with respect to pricing, sales, organizational goals, and communication. You’ll never have to rely on guesswork again; all you need to do is gather user data through an analytics tool and leverage it relentlessly.
Your clients have needs that are continuously evolving, so you have to continuously utilize real-time data to create adaptive strategies that help you get the most out of your investment.
What are the biggest challenges of content analytics?
Customers’ preferences and expectations from content are constantly changing. Jess Cook from LASSO puts it best: content analytics isn't an exact science. Here are the biggest challenges that marketing and sales teams encounter in the process of analyzing content data:
Data silos
Your sales and marketing teams need access to a unified customer data infrastructure. End-to-end account journeys are of the utmost importance when you’re streamlining the sales and marketing processes. If your sales and marketing teams work independently of each other, there’s a huge chance that they have access to disconnected data.
Data silos lead to an underwhelming customer experience. The sales team should have access to all the marketing touchpoints the user has been through to avoid repetition, tedium, and misunderstandings in the sales process.
Visitor identification
De-anonymization is crucial to effective analytics, since you need to see how many unique visitors your website is drawing and the firmographic characteristics of these users such as company name, industry, employee range and revenue range. However, all users on the internet want anonymity, and there are laws to protect user data from illegal tracking.
Free content analytics tools have limitations
Tools like Google Search Console (GSC) offer users limited insight. Saffia Faisal at Userpilot believes that GSC is inadequate for dedicated content analytics and reporting. B2B companies require an in-depth analysis of how their content is performing. GSC’s algorithm limits accuracy in reporting, providing just a signal of how content performs. GSC also imposes limitations on the number of rows of data that can be exported at a query level.
How content analytics works in Factors
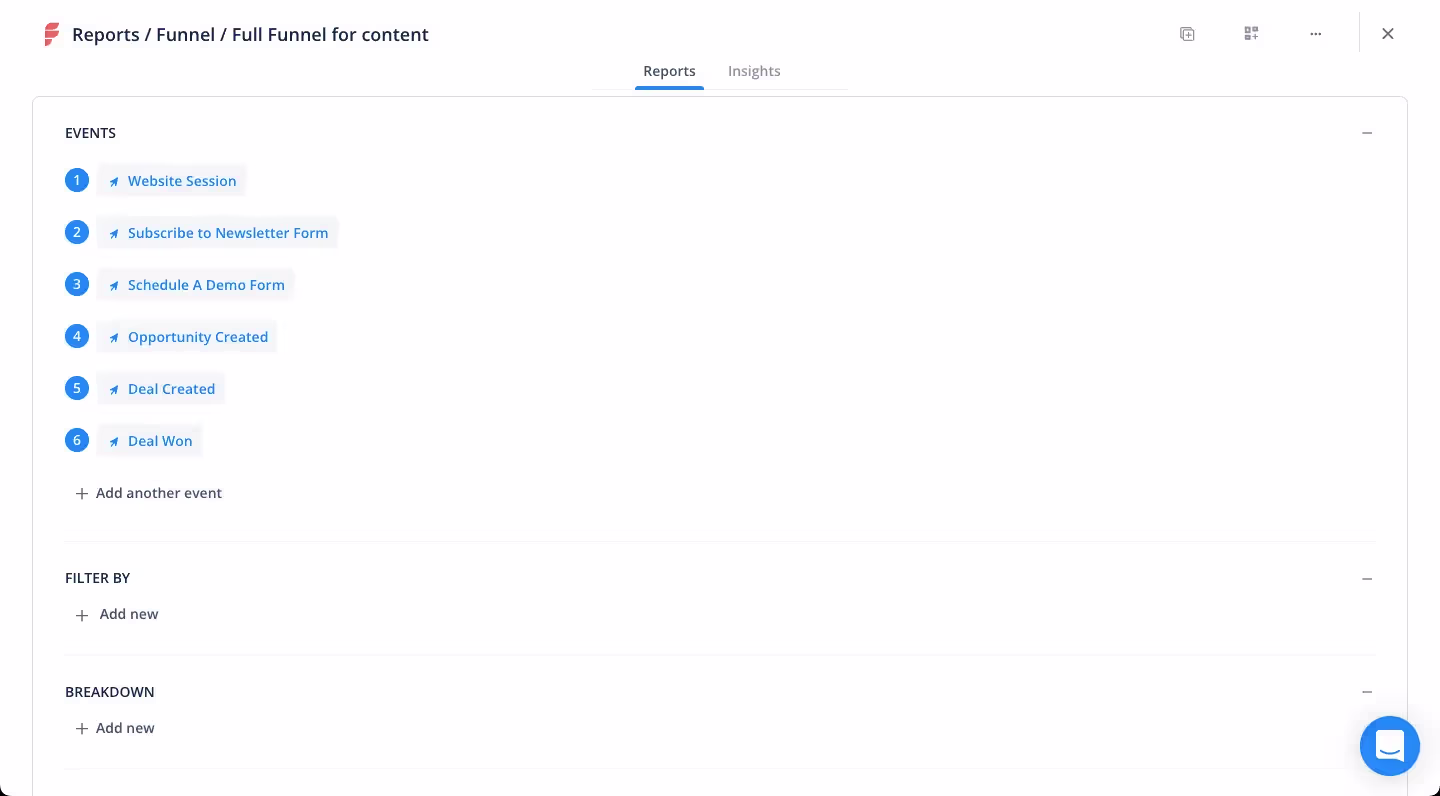
Factors.ai connects the dots between web sessions and CRM events to answer this question through automated form captures, customer journey funnels, and AI-powered inflection analysis to determine what content is helping/hurting larger objectives
“How are my website resources driving form submissions, MQLs, SQLs, Opportunities, Deals, and ultimately, Revenue?"
Content marketers and sales strategists need access to real-time, relevant data that provides a holistic overview of content and customers alike. These insights can help tailor new content based on what works, thereby driving greater revenue.
Automated insights to determine web content's impact on custom conversion goals
Customizable dashboards
Remember the data silos we mentioned earlier? They slow down the progression of the accounts into the sales funnel and may lead consumers to drop out of it altogether. With Factors, however, you have all your customer information present on the same dashboard. Your sales and marketing teams will have access to consistent information, and will be able to see all your clients’ touchpoints. You can choose which metrics you want to view on the dashboard.
Easy account identification
With Factors’ reverse IP lookup, you’ll be able to identify which companies are interested in your solutions through their website visits. If an individual in a company visits your website, Factors will match its IP address within its existing database and identify the company name and domain, industry, annual revenue, and employee headcount. Since the database relies on publicly available data and the data you draw from your website, this process is fully compliant with user privacy protections.
You’ll also be able to see which stage of the funnel a particular prospect is at by the type of content they consume. Once you know the identity and needs of your prospects, you can target them in a personalized manner.
Automated analytics and attribution
Your sales and marketing teams won’t need to crunch numbers or look for missing information. Factors provides all the data you need, such as time on page, page load time, button clicks, scroll percentage, and page views. By automating the process of content data collection, your teams can focus their energies on strategizing and creating quality content for clients.
Factors’ multi-touch attribution model helps your company understand the customer journey and give credit to the touchpoints involved in the conversion process. It provides more detail with respect to user behavior when compared to single-touch models. A multi-touch attribution model aims to highlight which touchpoints have the greatest influence in the account’s journey, and how they work together.
Adaptation based on new insights
Your customers’ requirements are constantly evolving. It’s necessary for your analytics and attribution systems to respond to these nuances. Factors allows you to obtain instant insights about which content assets are redundant or performing well. You can use these content performance reports to refresh older content and push pieces that are doing well across more channels.
Get in touch with us today to find out how Factors can help your company improve its content analytics and reporting.
____________________________________________________________________________________________
Dive in Deep with Factors
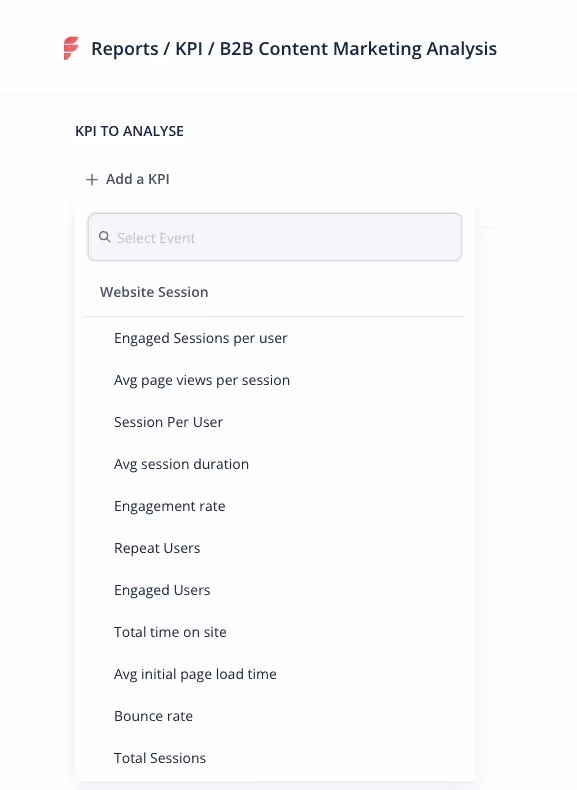
Factors.ai takes content analytics one step further with extensive breakdowns + filters, custom dimensions + KPIs, and Content Groups.
As a content marketer, you may be interested in granular insights into your resources. “What geographies are consuming most of my work?”, “Is my blog being read more frequently on a phone or on a desktop? Should I optimize accordingly?”, “What campaigns, channels, and sources is web traffic originating from? “What about my SEO efforts and organic traffic?”.
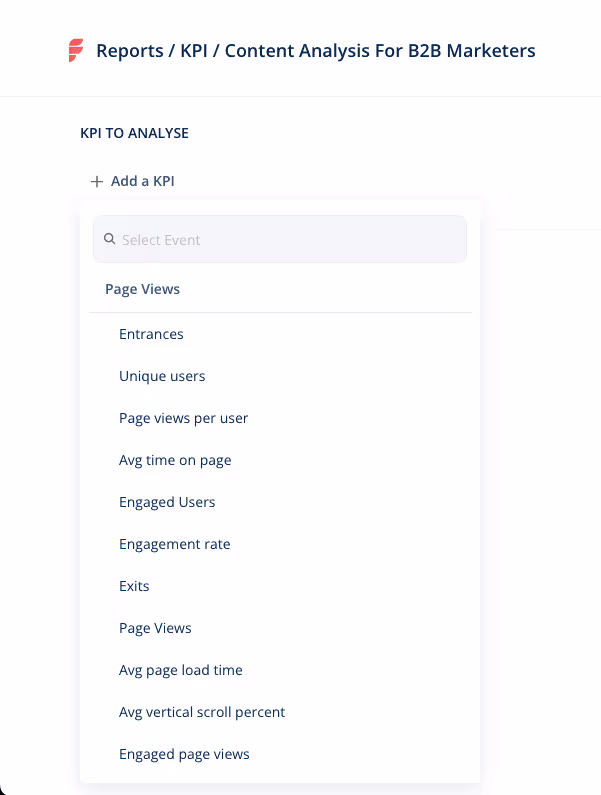
Factors.ai answers these questions and more with an extensive range of filters and breakdowns. Additionally, there’s ample flexibility to create your own custom events and KPIs if you’d like to track tailor-made metrics.
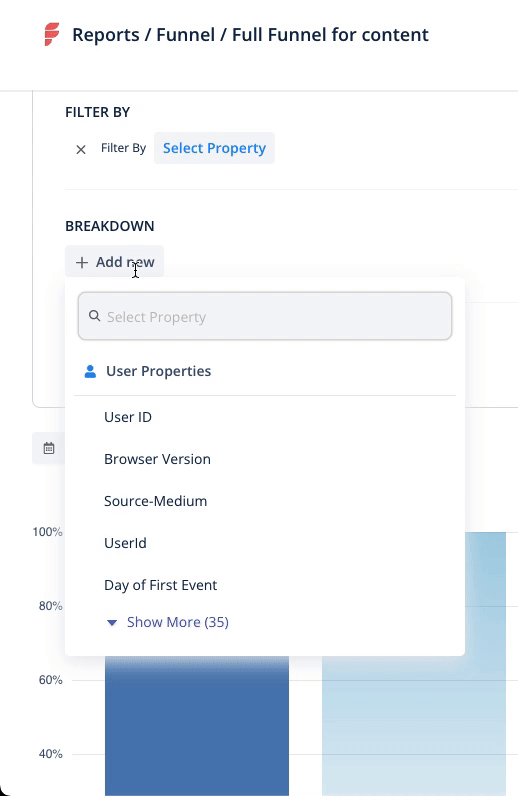
Finally, with Content Groups, you can group a collection of logically related URLs that make up your overall website content. For example, core web pages like “features” “pricing” and “product” may be defined under one group to measure holistic performance. Similarly, blog articles written with specific intent can be analyzed all in one go. No doubt, a handy feature for content marketing analytics.
FAQs
How do you use analytics in content marketing?
Content analytics include reporting on website, marketing, and sales metrics. Understanding how customers interact with your content allows you to personalize your marketing campaigns in order to drive more conversions. Measuring these metrics also helps you address specific pain points and therefore improve the overall consumer experience for your solution.
Which metrics should I measure for content performance?
We asked experts about the metrics they keep track of to ensure high content performance. Their responses included clickthrough rate, impressions, marketing qualified leads, scroll depth, time on page, unique visitor identification, downloads, funnel movement, influenced demos, and bounce rate.
And there you have. Our customers regularly use Factors.ai to make sense of their content performance and guide their B2B content marketing strategy with the help of granular web page analytics, end-to-end customer journey insights, and flexible content reporting. If you’d like to learn more about our work at Factors, schedule a personalized demo today.

The Complete Guide To Customer Journey Mapping
Customers are complex. What drives them? What bothers them? What encourages them? And what convinces them to choose you over your competitors? Without a clear framework in place, answers to these questions remain nuanced and theoretical.
Here’s where customer journey mapping can help.
A customer journey map visualizes the entire customer experience with your company — from awareness to deal won, and sheds light onto why your customers behave the way they do at every stage of the sales cycle.
As we will see, customer journey mapping proves to be beneficial in acquiring more customers, faster — and retaining them for longer durations of time.
Here’s what this guide to customer journey mapping covers:
- What is customer journey mapping?
- How does customer journey mapping work?
- Why do B2B companies need to map out their customer journeys?
- What should you include in your customer journey map?
- Steps to create a customer journey map
- Customer journey map vs user experience map: what’s the difference?
- How does Factors.ai help with customer journey maps?
What is customer journey mapping?
Especially in B2B deals, customers rarely make purchase decisions on an impulse. Instead, they spend significant time identifying pain-points, researching solutions, comparing alternatives, and freeing up budgets before finally becoming paying customers.

Customer journey mapping can be defined as the visualization of interactions that a buyer has with a company across the entire sales cycle — from awareness to deal won to retention. Customer journey mapping provides valuable insights to refine the overall customer experience, drive conversions, and improve customer retention rates.
In short, the customer journey map encapsulates this buyer experience. This journey can be broadly divided into: pre-conversion, onboarding, and post-conversion.
Each of these segments can be further broken down into granular customer touchpoints that the marketing, sales, customer success, and product team are responsible for.
How does customer journey mapping work?
There’s no one right way to go about customer journey mapping. But at its core, customer journey mapping works by consolidating and visualizing an otherwise complex, non-linear sales cycle.
With this framework, go-to-market teams can identify how customers behave, what their preferences are at each stage of the sales cycle, and what helps or hurts conversions.
As you might have guessed, plotting this customer journey map involves compiling data from a wide range of touch points across the sales cycle.
Without the right tools and techniques, tracking these touch-points across channels, campaigns, offline events, website, CRM and more can be a daunting task. More on how Factors.ai can ease this process later.
What should you include in your customer journey map?
While every business involves its own unique customer journey, a few key elements remain constant across the board. Here’s a breakdown of what you should look to include in your customer journey map.
1. Sales Cycle
Firstly, connect the dots between relevant data sources across campaigns, website, MAPs and CRM. This is to understand where your customers are coming from and how they’re engaging with your brand across the sales cycle.
The average B2B sales cycle can be broken down into the following stages:
- Awareness (ToFu marketing, branding, etc)
- Consideration (BoFu marketing, sales discovery, trials, etc)
- Decision (Effective sales and customer success)
2. Customer Behavior
Based on the data collected from the previous point, gauge how customers behave at different stages of the sales cycle.
Let’s say that the data suggests that during the awareness stage, buyers look to learn more about the problem they’re facing. At this stage, educational material such as ebooks or webinars may be more relevant to customers as compared to bottom of the funnel material such as comparison articles or case-studies.
3. Sentiment
B2B deals tend to be perceived as unemotional, objective transactions. However, at the end of the day, B2B businesses still sell to people — buyers and users — within a business. Accordingly, it’s important to consider the sentiment of leads and buyers during every stage of the customer journey.
For instance, the problem-awareness stage may involve frustration or confusion that we should look to minimize with useful content and personalized outreach. The solution-decision stage may involve feelings of relief or happiness which should be maximized with reliable customer support and relevant documentation.
4. Problems
Carrying on from the previous point: For any negative sentiment, there’s probably a pain-point or problem behind it. Identifying these pain-points at various stages of the customer journey will help create pointed, relevant customer experiences that look to solve user problems.
5. Solutions
As previously mentioned, we can look to solve challenges and paint-points along the customer journey to reduce or eliminate any points of friction. This will ensure smooth sales conversions.
Why do B2B companies need to map out their customer journeys?
Creating a customer journey map, especially without the right tools, can be an unintuitive and daunting task. Why then should businesses care to go through all this effort?
The overarching reason for B2B teams to create customer journey maps is because of its positive impact on customer experience, conversion, and retention. Breaking down the customer journey into broad stages with individual objectives simplifies, and ultimately improves, an otherwise convoluted customer journey.
Here are a few specific ways in which customer journey mapping benefits the customer experience, which in turn benefits your businesses’ bottom line metrics.
1. Identify what resonates with your audience
Customer journey mapping helps identify how different messaging, content, topics and themes resonate with your target audience. While marketers tend to have a hunch about this, qualifying a hypothesis with data helps scale efforts confidently.
2. Refine personas and improve targeting
Targeting a broad audience isn’t effective or scalable in the long run. Customer journey mapping sheds light onto which customers are actually interested in the value of your product. This helps refine the characteristics of ideal customer profiles and allows marketing teams to go after targeted, high-intent audiences.
3. Improve customer retention rate
The customer journey map charts a course all the way into the product and its end-users. This provides valuable insights into who the product is helping most, and how it’s helping them.
With this end-to-end view of the customer journey, it’s clear to see where to improve the customer experience, even within the product. This is invaluable information given that a third of Americans consider switching to an alternative after a single poor experience.
Ultimately, improving the customer experience means improving customer retention. Which in turn lends itself to stronger pipeline and up-selling opportunities.
Steps to Create a Customer Journey Map
Here’s a step-by-step breakdown of creating a customer journey map from scratch.
1. Define customer journey objectives
The first step is to determine why you’re constructing a customer journey map. What’s the objective? Whose customer experience are you looking to improve? Based on this information, define 1-3 hypothetical buyer personas that represent your ideal customer profile.
Buyer personas should be based on a combination of firmographic features like industry, revenue, and headcount as well as user-specific characteristics like role, department, tech-stack, etc.
2. Survey prospects and customers
After defining your hypothetical “perfect customer”, it’s time to survey your actual prospects and buyers. This is mainly to close the gap, if any, between how you believe your customers think and how they actually think.
Here are a few questions to ask prospects and customers:
- How did you hear about us?
- What are you looking to solve for? What’s your biggest pain-point?
- How would you rate our onboarding process on a scale from 1-10?
- How do you think we can improve our website content?
3. Track customer journey touchpoints
While asking customers where they found us and how they like our product is all well and good — it’s rarely sufficient. For one, B2B sales cycles last several weeks, if not months. It’s hardly fair to expect customers to remember the exact social media post that drove them to your website.
For another, subjective interviews are often riddled with bias and leading questions. To avoid inaccuracies in data, it's crucial to independently track touch-points across campaigns, websites, MAPs, CRM, and other relevant sources for objective analytics. With this, we can find answers to questions like:
- Which channel is driving the most traffic to my website?
- Which blog topics lead to the most conversions?
- What percentage of the pricing page are visitors scrolling through?
- How are customers progressing from an ad campaign, to website, to demo, to deal won?
Consider the sentiment, pain-points, and solutions that are associated with every customer action in order to understand motivations and tailor marketing efforts efficiently.
For example, if a page on “Identifying website visitors” seems to be driving a lot of conversions, this may be a pressing pain-point or use-case to your audience. In this case, tailoring outbound efforts and organic social with more content on visitor identification may be fruitful.
4. Allocate resources across the customer journey
So far, we’ve defined who we want to sell to, identified what current customers are thinking, and tracked how these customers are interacting with our brand.
Based on this goldmine of information, we receive a rough idea as to how we can better allocate resources. For instance, maybe mapping out this data reveals that webinars seem to perform disproportionately better than paid social at driving high-intent visitors.
Alternatively, this customer mapping exercise may also reveal a dearth in specific tools that could help accelerate sales velocity – email automation, customer service management, etc.
The reallocation of resources that follows these insights will ultimately result in the first iteration of the customer journey map. A design that encapsulates who your ideal buyers are and the ideal path they’ll take to become paying customers.
5. Analyze the customer journey
At this stage, we’ve crunched a whole lot of customer data and allocated resources to optimize the customer journey. But this is just one half of the puzzle. Analyzing and iterating based on real-life results is crucial to the success of a customer journey map.
Look to answer questions like:
- Where are customers dropping off disproportionately?
- Which touch-points are driving higher-than-average conversions?
- How does the quality of leads differ from one channel to another?
This is where the customer journey map graduates from theory to practice.
6. Iterate. Iterate. Iterate.
Using learnings from the analyses of the customer journey, run a wide range of experiments to test specific hypotheses at every stage of the sales cycle.
Perhaps reworking ad copies, repositioning CTAs on the website, investing in a customer service tool, updating the onboarding flow result in improved customer experience and conversions.
Rather than relying on intuition or guesswork, use the customer journey map to identify and iterate on strengths and limitations with data-driven insights.
Ideally, the customer journey map should be revised every month or quarter to stay aligned with every-changing customer behavior.
Customer Journey map vs User Experience map: What’s the difference?
In short, a customer journey map considers every measurable interaction that a customer has with your business from awareness to consumption. A user experience map, on the other hand, only considers how customers use the actual end product.
It’s important to distinguish between the two because, especially in B2B deals, the buyer is often different from the end-user. While there’s generally significant overlap between the two concepts, user experience is a subset of customer experience.
For example, a CMO reads a blog and attends a demo through a website before purchasing your software for her content marketing team. While the CMO might be thoroughly impressed with the material she’s interacted with, the content marketing team may actually be disappointed with the software.
While a customer journey map will consider this case end-to-end, a user experience map will only highlight the limited usage of the software by this content marketing team.
How does Factors.ai help with customer journey mapping?
Here are four ways in which Factors.ai can help map out your customer journey:
1. Account and User timelines
Factors unifies customer journey data across campaigns, website, and CRM to present an interactive timeline of touchpoints at a user and account level. This is an especially powerful tool for account-based marketing teams to track how users from their target accounts are progressing through the sales cycle.

2. Account Identification
Factors uses industry-leading IP-look up technology to identify up to 64% of anonymous website traffic.. This provides valuable insights into which accounts are visiting your website and how they’re interacting with pages and content.
This firmographic and intent-data helps shape the buyer personas for your customer journey map as it sheds lights onto how different types of companies interact differently with your brand.
3. Attribution
As previously mentioned, measuring the right touchpoints and tying it back to revenue manually is, to say the least, a chore. Multi-touch attribution on Factors helps connect the dots between conversions and pre-conversion touchpoints. Compare a range of attribution models based on the nature of your business to quantify the impact of marketing effort on pipeline and revenue.

4. Path analysis
Path analysis is similar to timelines in that it provides an intuitive visualization of various accounts and users traveling through different paths along the customer journey. The difference is that path analysis reflects aggregated user behavior rather than a specific account’s journey.
This is helpful when testing hypotheses, running experiments, or gauging customer behavior on a larger scale.

And there you have it! A complete guide to customer journey mapping — and how Factors.ai can help construct your customer journey map.

