.svg)


LinkedIn Intent Data: The Missing Ingredient in Your B2B Sales Strategy?
LinkedIn Intent Data: The Missing Ingredient in Your B2B Sales Strategy?
With over 900 million members across 200 countries and 4 out of 5 members driving business decisions, LinkedIn is a crucial platform for B2B sales and marketing teams. 97% of B2B marketers use LinkedIn for lead generation. But how can you ensure that your LinkedIn ads and marketing efforts are influencing conversions?
Enter LinkedIn intent data.
LinkedIn intent data shows if a prospect has interacted with or shown interest in your LinkedIn ads, allowing you to gauge their likelihood of converting. In this article, we'll discuss how this data can benefit both marketing and sales teams, and how Factors can help you make the most of this valuable information.
TL;DR
- LinkedIn intent data reveal prospects' level of interest and engagement with ads.
- It helps illuminate the "dark funnel" of hidden interactions and potential leads.
- Benefits include audience segmentation, ad optimization, retargeting, and lead scoring.
- Marketers can use intent data to optimize campaigns and improve targeting.
- Sales teams can use intent data to prioritize high-intent accounts and personalize outreach.
- Factors is a tool that integrates LinkedIn intent data with CRM data for deeper insights.
What Is LinkedIn Intent Data?
LinkedIn intent data is a crucial piece of information that reveals the level of interest and engagement prospects have with your LinkedIn ads. By analyzing this data, you can gain valuable insights into the buyer's journey and identify potential leads who are more likely to convert.
This information is vital in today's competitive B2B landscape, where understanding the preferences and needs of your target audience can significantly improve your sales and marketing efforts.
Why Is LinkedIn Intent Data Important?
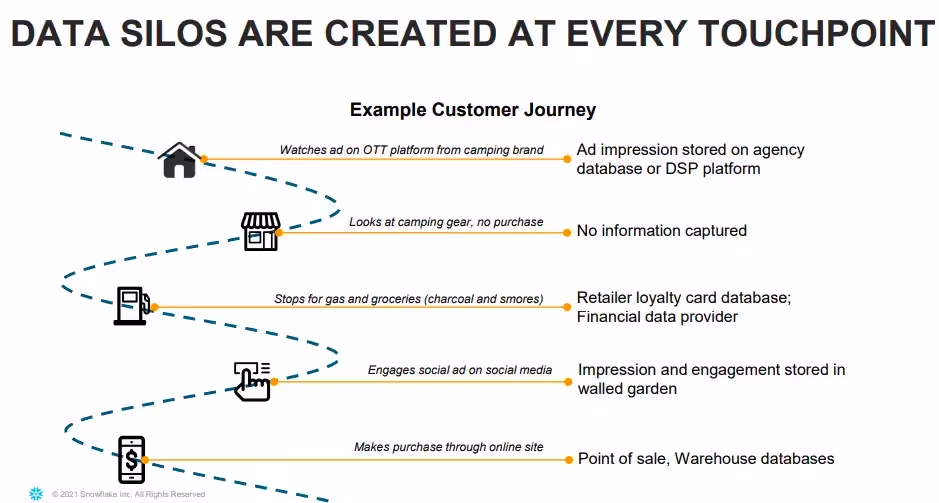
In B2B, the buyer's journey is often complex and multifaceted. Prospects interact with various touchpoints before making a purchase decision. Unfortunately, not all of these interactions are visible or easily tracked, leading to the existence of a "dark funnel."
What is the dark funnel?
The dark funnel is part of the buyer's journey where prospects have been exposed to your LinkedIn ads, content, or other marketing materials but haven't directly engaged with them or converted immediately.
These “hidden” interactions can make it challenging to assess the true impact of your marketing efforts and identify valuable leads who may convert later in their journey.
How does Linkedin intent data help?
LinkedIn intent data illuminates the dark funnel by providing insights into prospects' level of interest and engagement with your ads, even if they haven't directly interacted with them. Here are a few ways in which it can help you gain a deeper understanding of the dark funnel:
- Segment your audience based on their intent data: By analyzing LinkedIn intent data, you can segment your audience into different categories based on their level of engagement and interest in your ads. This will help you create tailored account-based marketing campaigns that address the unique needs and preferences of each segment, increasing the chances of converting these prospects. For instance, if you run an e-learning platform, you can segment users who have engaged with your ads about coding courses and target them differently than users who’ve shown interest in a writing course.
- Optimize your ad creatives and targeting: Understanding the preferences of prospects within the dark funnel can help you optimize your LinkedIn ad creatives and targeting strategies to better resonate with your audience. Then, fine-tuning your ads based on intent data insights can improve the overall effectiveness of your marketing efforts. For example, if you find that prospects in the dark funnel are engaging more with video ads than image-based ads, you can allocate more budget to video ad campaigns and optimize targeting to reach more people likely to be interested in your product.
- Retarget potential leads: With this data at hand, you can retarget prospects with tailored content and offers. If a prospect has engaged with content about a particular product or service on your website, but didn't complete a purchase, you can retarget them with a special discount or offer, encouraging them to revisit your site and complete the transaction.
- Enhance lead scoring and prioritization: By incorporating intent data, you may find that a group of people have engaged heavily with your ads and content, but haven't reached out directly yet. For instance, if you're a B2B software company, your sales team can reach out to prospects who've shown a high level of engagement with specific features of the software. They can demo the tool while keeping the focus of the conversation on the feature of interest.
LinkedIn Intent Data For Marketers: Unlock The Potential Of Your Ads
As marketers, we aim to reach the right audience, deliver a message that resonates with them, and ultimately drive conversions. Linkedin buyer intent data is highly valuable in achieving these objectives and gaining valuable insights into audience engagement. With this, you can optimize your LinkedIn marketing strategy in several ways:
- Know if ads are reaching the intended audience: Linkedin’s intent data gives you insights into who is interacting with your ads. This information is then curated in an account-level format so your ABM teams can filter accounts with the highest interest in buying your product or service.
- Optimize LinkedIn ads based on engagement: Analyzing LinkedIn intent data can tell which ad formats, visuals, and copy resonate most with your audience. You can then make data-driven decisions to optimize your ads, boosting engagement and conversion rates.
- Know which kind of ad copy resonates with the audience: By examining the intent data from different ad variations, you can identify the messaging that best captures your audience's attention. This empowers you to tailor your ad copy and creatives to better appeal to your target audience, leading to more clicks, higher engagement, and ultimately, more conversions.
- Combine LinkedIn intent data with third-party intent data for a holistic approach: By integrating this data with third-party intent data (from sources like G2, TrustRadius, etc.), you can create a more comprehensive understanding of your prospects' needs throughout their buying journey. This enables you to deliver targeted, relevant content and ads that address their pain points and move them closer to conversion.
How To Use LinkedIn Buyer Intent To Improve Pipeline Velocity
Pipeline velocity is a key performance indicator (KPI) for sales teams, as it measures the speed at which leads move through the sales funnel and ultimately convert into customers. Leveraging LinkedIn buyer intent data can significantly improve pipeline velocity by helping you prioritize high-intent accounts, personalize outreach, and align sales and marketing efforts. Here's how:
- Prioritize high-intent accounts for account-based marketing (ABM): LinkedIn buyer intent data can help sales and account-based marketing (ABM) teams identify high-intent accounts, those that have shown significant interest in your LinkedIn ads, and are more likely to convert into customers. By prioritizing these high-intent accounts, your team can focus its efforts on the most promising leads, increasing the chances of closing deals and improving overall pipeline velocity.
- Use intent data and deanonymization to personalize outreach: Using LinkedIn buyer intent data, you can tailor your sales outreach to the specific needs and interests of your prospects. Adding Factors to the mix, you can also deanonymize website traffic and know about the company and industry that they work in. With this, you can gain deeper insights into their pain points, preferences, and points of friction. This allows your sales team to craft personalized messages that address these concerns and demonstrate the value of your product or service, helping to move prospects through the sales funnel more quickly.
- Align sales and marketing based on intent data: Regularly analyzing LinkedIn buyer intent data can help you identify trends and patterns in your prospects' behavior, allowing you to optimize your sales and marketing tactics accordingly. This is also good for reporting on the effectiveness of campaigns. For example, you may discover that certain types of content or ad formats resonate better with your target audience, leading to higher engagement and faster movement through the sales funnel.
- Add intent data into CRM and marketing automation platforms: Integrating LinkedIn buyer intent data into your CRM and marketing automation platforms can help automate lead scoring, segmentation, and nurturing efforts based on prospects' engagement and intent. This allows your sales and marketing teams to efficiently focus their efforts on high-intent leads, ultimately improving pipeline velocity.
- Enhance Account Scoring: Incorporating LinkedIn buyer intent data into your account scoring methodology can provide a more accurate assessment of a prospect's likelihood to convert. The combination of data from multiple sources allows your sales and marketing teams to better score leads. Add to that Factors’ account scoring features, and you can automate your prioritization process for the teams too.
Make The Most Of Your LinkedIn Intent Data with Factors
Leveraging buyer intent data from LinkedIn effectively can help you identify the users with the highest interest and modify your approach to better target the accounts. Factors enables you to maximize the potential of this data to drive results. Here's how:
1. Integrated data analysis
Factors helps combine Linkedin intent data with data from other sources, such as CRM platforms, ads, website, and more. This integrated approach enables you to gain a holistic understanding of your prospects' buyer journey, helping you identify high-intent accounts and optimize your marketing and sales strategies accordingly.
2. Visual user timelines for enhanced attribution
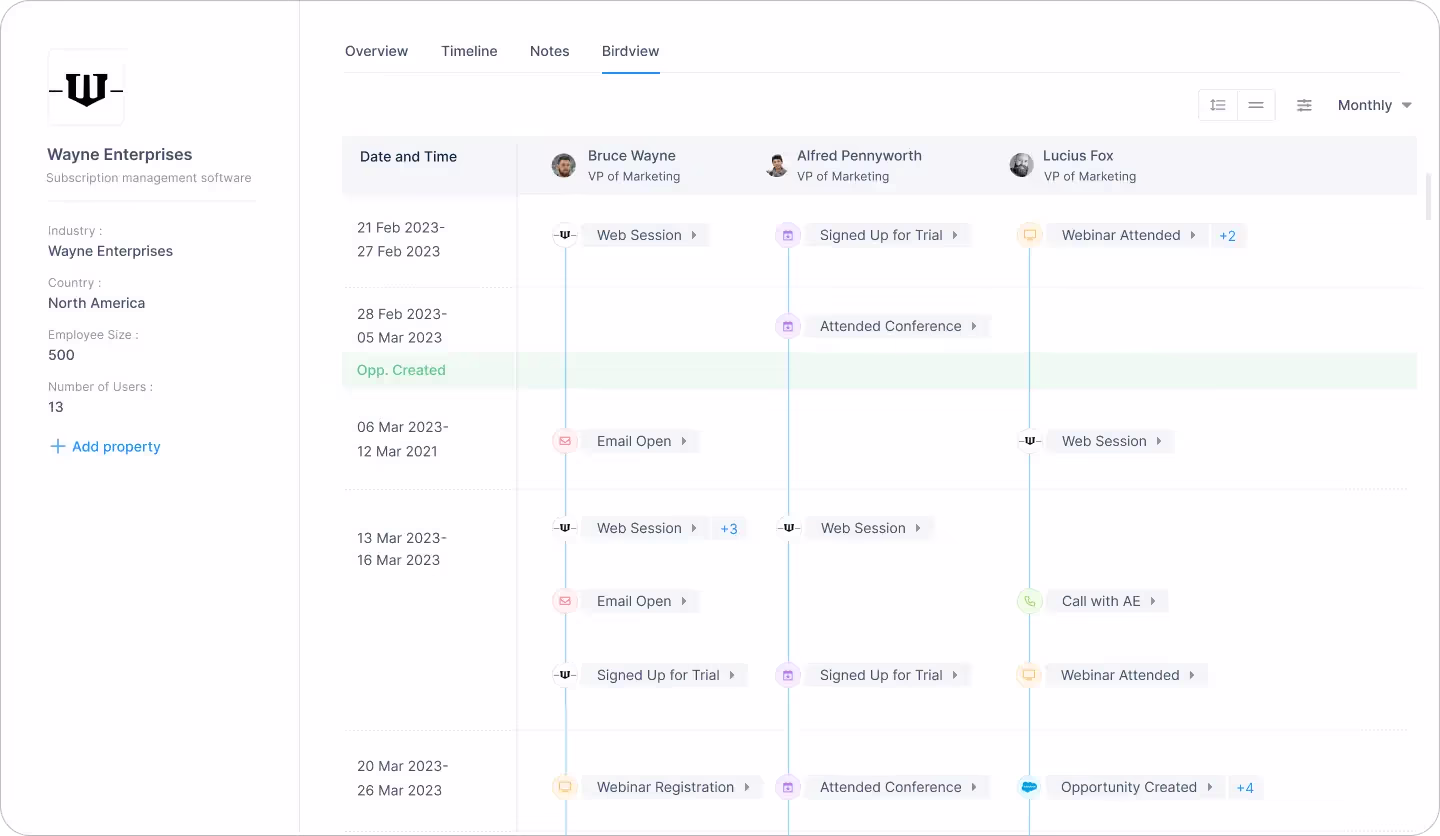
Factors offers a visual user timeline that lets you track and analyze your prospects' interactions with your LinkedIn ads over time. You can also view if the same user has interacted with your brand over other platforms or campaigns that you already track. This gives you a holistic view of an individual user's journey and engagement with your brand across multiple touchpoints.
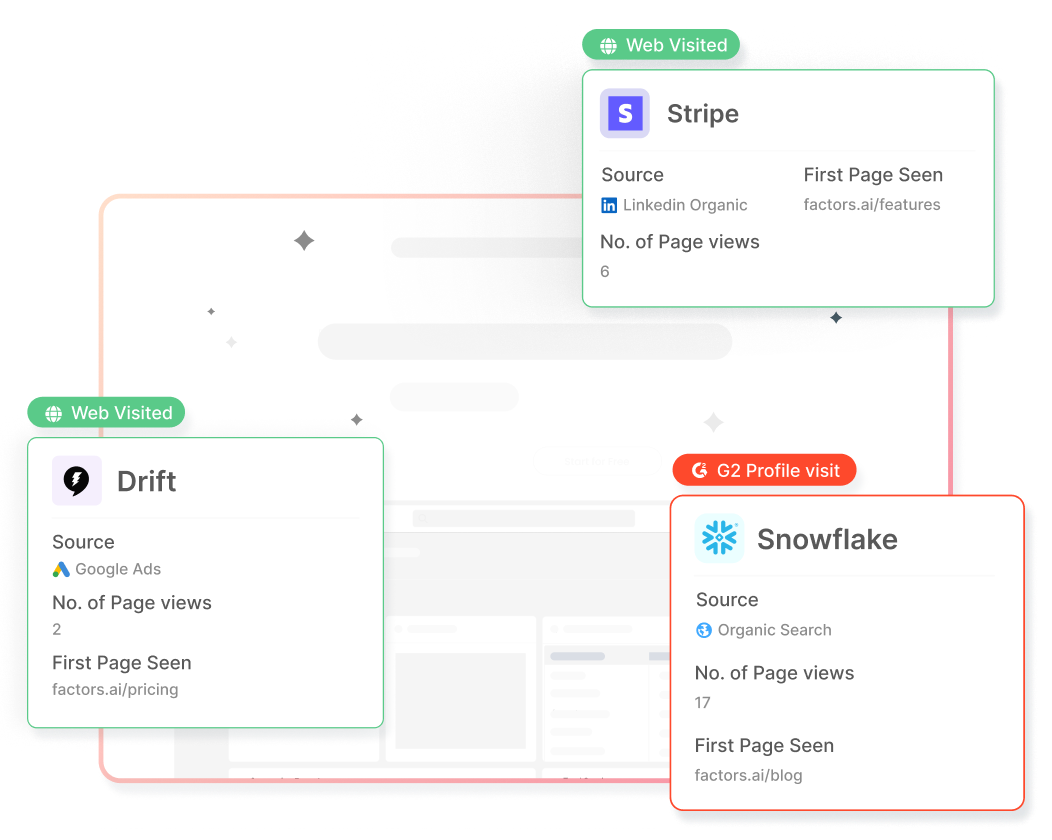
3. Account intelligence
Factors' account intelligence capability allows users to identify anonymous companies visiting your website, along with their intent and firmographics. Your ABM teams can then personalize outreach by understanding their interactions with your content and ads to improve conversions.
4. Optimize ad engagement and performance
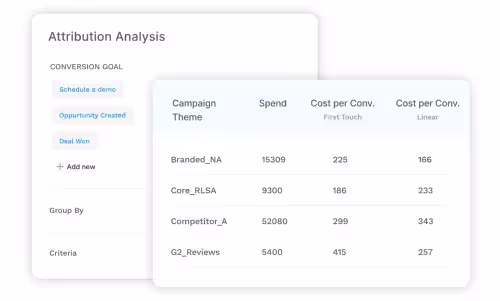
Factors uses Linkedin ad engagement data and audience insights to help you optimize your Linkedin ad campaigns. Knowing which ads resonate with your target audience and generate the most engagement can help you refine your campaigns to maximize returns and drive conversions. You can also uncover the ad formats, content types, and messaging that resonate best with your target audience and increase the likelihood of conversions.
5. Account scoring
Factors' account scoring feature helps prioritize prospects based on their engagement and intent, enabling sales teams to focus their efforts on high-value targets. By combining intent data with firmographics, technographics, and engagement history, you can create a comprehensive account score that helps your sales team prioritize their efforts and focus on the most promising opportunities.
FAQs
1. How does LinkedIn calculate buyer intent?
LinkedIn calculates buyer intent by analyzing user engagement with your company's ads, content, and other interactions on the platform. This includes factors such as clicks, likes, comments, shares, and time spent viewing your content. By tracking these interactions, LinkedIn can identify which users are genuinely interested in your products or services, signaling potential buyer intent.
2. How can you use intent data for sales?
Intent data can be used by sales teams to prioritize high-intent accounts, personalize outreach efforts, align sales and marketing initiatives, optimize sales tactics, and enhance account scoring. By leveraging intent data, sales teams can focus their resources on the most promising leads, creating more targeted and effective sales strategies that drive revenue growth and improve pipeline velocity.
Bring the Power of LinkedIn Buyer Intent Data to B2B Sales
Leveraging LinkedIn buyer intent data can revolutionize your sales and marketing efforts, enabling you to prioritize high-intent accounts, personalize outreach, and align your teams for maximum impact.
By using powerful tools like Factors, you can gain a comprehensive view of buyer journeys and make data-driven decisions to boost pipeline velocity and drive revenue growth. Don't miss out on valuable opportunities – uncover the potential of LinkedIn buyer intent data and elevate your B2B sales strategy today.
.webp)
The Ultimate Guide to Marketing Analytics for SaaS Companies
Marketing analytics has become an integral part of any successful marketing strategy.
The industry is expected to grow at a CAGR of 14.8% between 2023 and 2028. Meanwhile, businesses of all sizes must spend the time to upgrade their in-house tech and employee skill-set to stay ahead of the curve.
But with the industry peppering buzzwords and jargon, marketing analytics can seem more complicated than it actually is.
In this guide, we’ll work to make the complex simpler. We’ll discuss what marketing analytics is, why it is necessary, which teams and people in a company should look into it, common limitations and pitfalls, and more. Let’s get started.
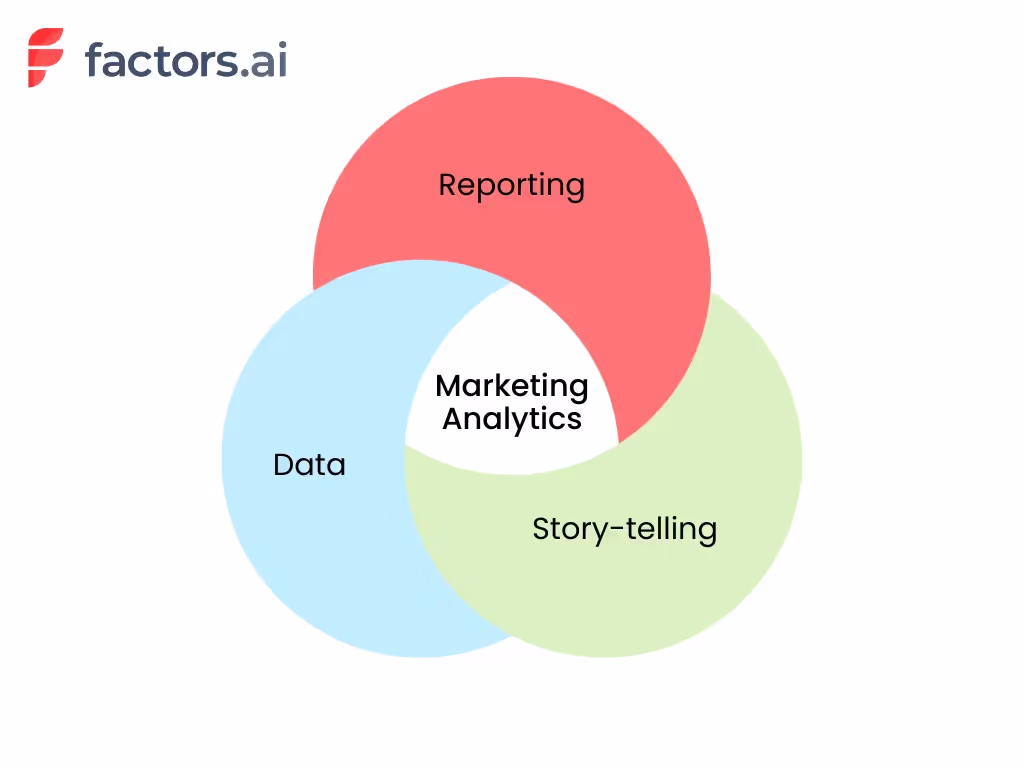
What is Marketing Analytics?
Marketing analytics refers to the analysis of data to gain insights into the performance of marketing campaigns and activities. It relies on the number of leads generated, conversion rates, customer acquisition cost (CAC), and customer lifetime value (LTV). Analyzing these metrics can help marketers and founders pave the way for marketing campaigns.
For instance, marketing analytics can help businesses understand which marketing channels or strategies are generating the most leads or conversions, and which ones may need improvement. It can also help identify trends and patterns in customer behavior, preferences, and buying habits, enabling businesses to make more informed decisions about their marketing efforts.
This is done through the use of tools like Google Analytics, Looker Studio, Factors.ai, and others for data visualization, statistical analysis, and predictive modeling.
The data is analyzed from various sources, such as website traffic, social media platforms, email campaigns, and Customer Relationship Management (CRM) systems.
The Benefits of Marketing Analytics
Marketing analytics offers multiple benefits in a B2B context. It helps businesses with interpreting data and making the most accurate and informed decisions. But that’s just one aspect of it. Let’s take a look at some other benefits of marketing analytics:
Improves Targeting
Marketing analytics enables you to identify the most relevant and receptive audience for your product or service. Then combining demographic, psychographic, and behavioral metrics, you can create a detailed customer persona that represents your ideal target audience. This data-driven approach allows you to tailor your messaging, offers, and content to resonate with these individuals, ultimately leading to higher conversion rates.
For instance, suppose your marketing analytics reveals that your most engaged customers are millennial entrepreneurs in the tech industry. In that case, you can fine-tune your marketing campaigns by focusing on the channels they frequent—such as LinkedIn and Twitter. Then begin creating content around industry trends, tips for startup growth, or case studies of successful tech entrepreneurs while subtly pitching your product or services.
Reduces Cost of Acquisition
The cost of acquiring a new customer can often exceed the expenses related to retaining an existing one. The average customer acquisition cost (CAC) including all SaaS industries is $704. Marketing analytics helps businesses identify the most cost-effective channels and methods for customer acquisition by studying metrics like cost-per-click, cost-per-lead, and return on ad spend.
.avif)
Let’s take an example here. Say your marketing analytics data shows that LinkedIn ads are generating a lower cost per acquisition (CPA) and higher conversion rate compared to Facebook ads. In this case, you can shift a larger portion of your ad budget to LinkedIn, driving down your overall cost of acquisition.
Improves the Customer Experience
86% of buyers are willing to pay more for brands that offer great customer experience. And SaaS companies doing $1 billion annually can expect to earn an additional $1 billion with just 3 years of investing in customer experience.
Analyzing customer feedback data can help SaaS marketers identify areas of improvement in their products or services. This leads to a better overall experience for customers. Marketing analytics can also help companies understand customer touchpoints, identify gaps in their communication strategies, and improve customer support.
Helps with Customer Retention
As time goes by, fewer and fewer customers stick around. This can be clearly demonstrated with the retention curve.
.avif)
However, spending money to retain existing customers is often more cost-effective than acquiring new ones.
Existing customers are 50% more likely to buy a product and spend 31% more on average than new customers. Marketing analytics can help businesses identify patterns and trends in customer behavior that may indicate potential churn or dissatisfaction.
For instance, if your marketing analytics reveals that customers who don't engage with your email campaigns are more likely to churn, you can modify your campaigns to launch a re-engagement strategy. You can target these at-risk customers with personalized content and offers to reignite their interest and loyalty. Sometimes, special pricing or preferential rates go a long way for customers.
Unveils Upselling Opportunities
Upselling is a powerful strategy in the B2B SaaS world. An average SaaS business generates 16% of its annual contract value (ACV) from upselling to customers. Companies doing $40 to $75 million annually can attribute twice as much revenue to upselling. With marketing analytics, you identify existing customers who are most likely to benefit from and be receptive to upgrading their current plans or purchasing additional products or services.
For instance, with marketing analytics data you may notice a few high-usage customers that could benefit from improved speed or better service offerings in your higher plans. Personalizing an upsell for those businesses and accounts can help you better improve your bottom lines in the long run.
What’s the Difference Between Product Analytics and Marketing Analytics?
Product analytics and marketing analytics are two important types of analytics that businesses need to use for making informed decisions. Unfortunately, these terms are used interchangeably and can cause confusion. Let’s look at the differences between product analytics and marketing analytics.
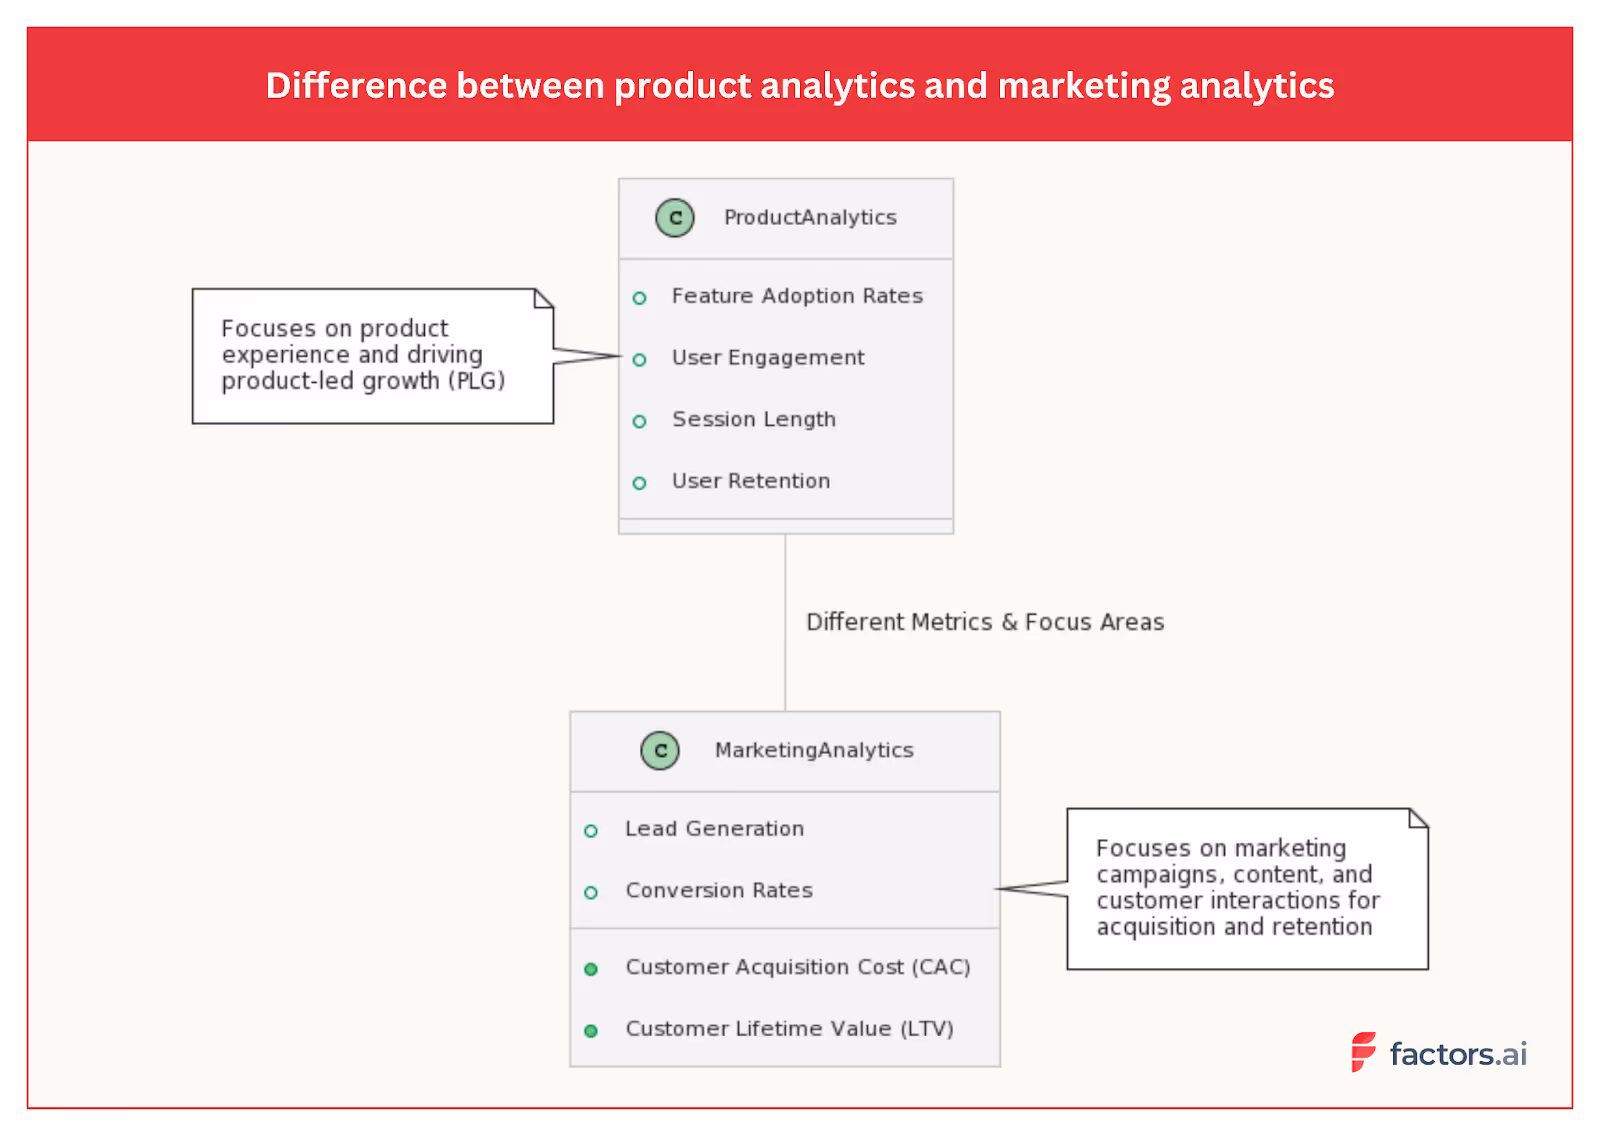
Product analytics analyzes the product experience. This type of analytics is generally performed on the data of users already using the product. It focuses on understanding how users interact with a product, including feature adoption, engagement, and product usage. With product analytics, the goal is to drive product-led growth by identifying areas for improvement, prioritizing feature development, and optimizing user experience.
Marketing analytics, on the other hand, helps identify how effective your marketing campaigns are. It helps identify how easily customers can find your product or website, what channels are working best for your marketing, and how many users are converting into paid users through the journey. Metrics for marketing analytics include lead generation, conversion rates, customer acquisition cost (CAC), and customer lifetime value (LTV).
For B2B businesses, both product and marketing analytics are important for driving growth. Product analytics helps businesses optimize product offerings and user experience. Marketing analytics helps companies improve their marketing strategies, target their audience more effectively, and allocate resources better.
Are Marketing Analytics and Marketing Attribution the Same Thing?
Marketing analytics and marketing attribution are complementary, yet distinct, disciplines within the realm of digital marketing. While both are essential for evaluating and optimizing marketing efforts, they serve different purposes and bring unique insights to the table. In this article, we will delve into the nuances of each concept, highlighting their primary focus, use cases, metrics, tools, and more.
Marketing Analytics vs Marketing Attribution - Quick Comparison
Marketing Analytics
Marketing analytics encompasses the measurement, management, and analysis of marketing performance data to optimize marketing effectiveness and maximize return on investment (ROI). Its primary focus is to provide a comprehensive understanding of marketing efforts, from the impact of individual campaigns to the overall health of a marketing strategy.
Use Cases:
- Identifying high-performing marketing channels
- Calculating customer acquisition cost (CAC) and customer lifetime value (LTV)
- Evaluating marketing ROI
- Tracking customer engagement and retention
- Analyzing data to inform marketing strategy and decision-making
Metrics:
Here are some of the marketing analytics metrics that you must keep a watch on.
- Customer acquisition cost (CAC): This metric helps you identify the cost of acquiring a new customer. It accounts for all the marketing and promotional costs involved in reaching and converting the customer.
- Lifetime value (LTV): Once a customer is converted, how long do they remain a paying customer? To find this value, note the length of time that each customer has stayed with your business and the total revenue generated by each. Then, multiply the average revenue per customer by the average length of time (lifespan). For example, if you have 100 customers paying, on average, $300 per month for 6 months, your customer lifetime value will be $300 x 6 = $1800.
- Churn Rate: How many of your customers are dropping off after they turn into paying customers? In fact, you can even count the churn rate for your free users as this can help you start digging deeper into the reasons why they don’t sign up for one of your paid plans.
- Retention Rate: This is the opposite of the churn rate. Here we check how many customers stick around for a specific period of time and more. For example, you may want to consider a customer as a retained one if they continue to pay for your SaaS for longer than 3 consecutive months.
- Return on investment: This metric is a must for businesses, no matter the industry. In the case of B2B SaaS businesses, this metric lets you understand how much money you are making based on the marketing spend.
Tools:
- Google Analytics: This is the most popular tool for marketing analytics—majorly because it’s free of cost. Google Analytics provides a wealth of information about traffic, user behavior, and much more.
- Factors: Factors is a powerful marketing analytics platform that specializes in B2B visitor identification, account analytics, and more. It integrates with your existing marketing stack and helps businesses reveal anonymous website visitors, decode customer journeys, and drive marketing ROI.
- Adobe Analytics: Adobe Analytics has a range of tools for tracking customer behavior, segmenting users, and identifying trends to improve overall marketing performance.
- Mixpanel: Mixpanel is more focused on product analytics. It enables businesses to monitor user interactions within web and mobile applications.
- Tableau: Tableau helps marketers transform raw marketing data into interactive visualizations that are easy to understand and share.
- HubSpot: HubSpot provides businesses with a holistic view of their performance and the tools necessary to optimize their strategies. From tracking website traffic and user behavior to measuring the effectiveness of email campaigns and social media outreach, it enables companies to make smarter marketing decisions and achieve better results.
Marketing Attribution
Marketing Attribution is the process of determining the value and impact of various touchpoints along the customer journey, helping marketers understand which channels, campaigns, and tactics are most effective in driving conversions and other desired outcomes. Attribution primarily focuses on assigning credit to specific marketing efforts that contribute to a conversion, sale, or other predefined goals.
Use Cases:
- Evaluating the effectiveness of individual marketing channels and campaigns
- Identifying the most influential touchpoints in the customer journey
- Optimizing marketing spend and resource allocation
- Informing marketing strategy and tactics based on attribution insights
- Tailoring messaging and targeting to maximize conversion potential
Attribution Models:
There are several attribution models available that help businesses assess the impact of their marketing efforts. Here is a breakdown of some of the most common types:
- Single-Touch Attribution: Assigns credit to a single touchpoint, either the first touch or the last touch. Common single-touch models include First-Touch Attribution, Last-Touch Attribution, and Last Non-Direct Touch Attribution.
- Multi-Touch Attribution: Distributes credit across multiple touchpoints throughout the customer journey. Examples of multi-touch models are Linear Attribution, U-Shaped Attribution, and Time Decay Attribution.
- Position-Based Attribution: This attribution model allocates credits based on the position of a touchpoint in the customer journey. For instance, it gives 40% of the credit to both the first and last ad interactions and corresponding keywords. The remaining 20% is spread across the other ad interactions on the user journey.
- Custom Attribution: Utilizes data and machine learning algorithms to create custom attribution models tailored to the unique needs of a specific business or industry. This approach allows for a more accurate representation of the customer journey and the impact of various marketing channels and tactics.
Tools:
- Factors: Factors is an AI-driven marketing attribution platform that provides detailed insights into the impact of each touchpoint on your customer journey. With its advanced modeling capabilities, Factors helps businesses make informed decisions on marketing spend and resource allocation.
- Adobe Marketo Measure: A part of the Adobe Marketo suite, Measure offers powerful marketing attribution and revenue planning features. By connecting marketing and sales data, Measure enables businesses to accurately attribute revenue to specific marketing efforts.
- Dreamdata: Dreamdata is a B2B revenue attribution platform that allows you to track and analyze the performance of your marketing efforts across all channels. By unifying data from various sources, Dreamdata provides a holistic view of your customer journey and helps optimize your marketing strategy.
- Ruler Analytics: Ruler Analytics is a marketing attribution platform that connects closed revenue data with the customer journey. It provides insights into which marketing channels are driving conversions, allowing businesses to optimize their efforts and improve ROI.
Who Should Be Thinking About Marketing Analytics at SaaS Companies?
Marketing analytics helps businesses measure the effectiveness of their marketing campaigns, optimize strategies, and make data-backed decisions to drive growth. But who should be thinking about marketing analytics at SaaS companies? Generally, it is CMOs, marketing executives, and CROs who stay updated with this information.
But, there's more to the story.
While it's essential for top-level executives and decision-makers to understand marketing metrics, it's not practical for everyone involved to monitor every single metric. Requiring the marketing team to constantly share their progress is counter-intuitive to progress as well. That’s where dashboards help teams stay in sync and keep tabs on what’s happening within marketing.
Dashboards offer a streamlined and efficient way to stay on top of the effectiveness of marketing strategies. They present data in a visually appealing and easy-to-understand format, allowing for quick insights and adjustments when needed. Here are a few benefits of dashboards.
- Enhanced collaboration: A well-designed dashboard helps teams across the board to stay updated with the changes in marketing. It also reduces the communication required to get data from individual teams as everyone can directly pull data from the dashboards. This increases transparency between teams.
- Increased accountability: Because of the increased transparency, teams, and individuals have accountability for the tasks assigned to them. This allows for greater productivity across teams and helps things progress faster.
- Customization: Dashboards are designed to be completely customizable. You do not need to showcase the same verbose data to everyone involved. Dashboards can help you summarize and visualize the required data based on who you want to demonstrate or showcase the data to.
If you want to implement a marketing dashboard within your company, we have an in-depth article on CMO dashboards. This will guide you through the process of designing a dashboard that serves the unique needs of your SaaS app development company.
Addressing Common Marketing Analytics Challenges
As businesses continue to evolve and adapt to the digital era, marketing analytics has become a vital aspect of marketing success. However, there are several common challenges that marketers face when trying to harness the power of data analysis.
Siloed data
The importance of seamless data integration cannot be overstated. With various marketing tools and platforms being used simultaneously, data can become fragmented and difficult to consolidate. Apart from that, customer data can get siloed at each of the touchpoints as well.
This siloed data can lead to an incomplete view of your marketing efforts and hinder your ability to make data-driven decisions. Marketing attribution tools like Factors combine data from multiple platforms and create a unified timeline that helps you view all the touchpoints of your customers in a single place.
Not knowing what to track
Identifying the right metrics to track is essential for marketing success. Focusing on the wrong metrics or not tracking them at all can lead to misguided decision-making. In fact, tracking a metric incorrectly can lead to worse outcomes than not tracking it at all.
For example, if you incorrectly attribute the success of your conversions to your paid ads, you may end up spending more on the wrong channel and wasting your marketing efforts.
Incorrect understanding of metrics
Metrics should be analyzed in tandem with other data to gain meaningful insights. For example, if the cost of acquisition in one quarter is dramatically lower than that of the previous two quarters, it could be the direct result of pausing a poor-performing marketing campaign.
But only looking at the CAC may lead to incorrect conclusions—CAC is going lower and thus your profits are going up.
Lack of automation and limited visualizations
Manual data analysis can be time-consuming, and error-prone, and ultimately limit your ability to make the most of it. Automating data collection and analysis processes is essential for maximizing efficiency and accuracy. Also, visualizing data through intuitive dashboards and reports enables easier understanding for everyone involved.
Factors address these common challenges by offering a powerful marketing analytics platform featuring seamless integrations, automation, and advanced visualization capabilities. Comprehensive marketing analytics and attribution solutions like Factors help overcome these challenges and ultimately achieve better results from your marketing efforts.
Top Marketing Analytics Use Cases for SaaS Companies
Marketing analytics can provide valuable insights and drive growth in various aspects of a SaaS company’s marketing efforts. The three key use cases for marketing analytics include acquisition and conversion tracking, campaign performance analysis, and customer segmentation and personalization. Here’s what each of them means:
1. Acquisition and Conversion Tracking
Acquisition and conversion tracking allows SaaS businesses to monitor how efficiently their marketing efforts are attracting and converting customers. For example, a SaaS company offering project management software might use acquisition and conversion tracking to analyze the sources of their website traffic. This could include social media platforms, search engines, and email marketing campaigns. They can then determine which channels are most effective in driving new users to sign up for their software. If the analysis reveals that content and SEO are generating a high number of sign-ups, the company can allocate more resources to that platform to capitalize on its success.
2. Campaign Performance Analysis
Campaign performance analysis evaluates the effectiveness of marketing campaigns and helps improve the campaigns through data. This involves monitoring click-through rates, conversion rates, and cost per acquisition, to determine the overall success of each campaign.
Imagine a SaaS company specializing in human resources software launches a Google Ads campaign targeting HR managers.
Campaign performance analysis can be used here to evaluate the effectiveness of the ads. If the data indicates that one type of ad is outperforming the others, the company can optimize the campaign by allocating a higher budget to the more successful ad. This constant analysis and improvement can lead to more efficient marketing campaigns and higher ROI.
3. Customer Segmentation and Personalization
Customer segmentation and personalization involve grouping customers based on shared characteristics and tailoring marketing messages and offers to meet their specific needs.
For instance, a SaaS company that provides email marketing software could segment its customers into groups based on their industry, company size, or the frequency of their email campaigns.
They could then create content and offers targeted at each segment. A small e-commerce business might receive tips on how to maximize its email open rates during the holiday season. A large enterprise client, on the other hand, might receive a case study showcasing how their email marketing success has successfully scaled email campaigns for similar organizations.
Grow your business with streamlined marketing analytics
Marketing analytics is a powerful tool for driving growth and improving marketing performance in B2B companies. Focusing on key use cases, such as acquisition and conversion tracking, campaign performance analysis, and customer segmentation and personalization, will enable you to make data-driven decisions and optimize your marketing efforts.
As a result, you'll attract more customers, improve customer satisfaction, and ultimately, increase your company's revenue. Don't miss out on the potential that marketing analytics can unlock for your SaaS company—start harnessing the power of data with Factors.ai today.
FAQs
Why is marketing analytics important?
Marketing analytics makes marketing effective. It offers deep insights into the preferences and behavior of your customers. It allows you to shape the marketing campaigns in accordance with your customer’s expectations and helps you make data-backed decisions rather than relying on intuition and experience.
What are the three types of analytics that can be used in marketing?
Descriptive analytics, predictive analytics, and prescriptive analytics.
- Descriptive analytics analyzes historical data to understand past performance.
- Predictive analytics uses data and statistical algorithms to forecast future outcomes
- Prescriptive analytics provides recommendations on how to optimize marketing efforts based on data-driven insights.

SaaS Marketing Reporting Done Right: 5 Tips for Extracting Actionable Insights from Your Reports
In today's data-driven world, marketing teams are well aware of the importance of collecting and analyzing the right data to inform their strategies.
But, the sheer volume of data available can be both a blessing and a curse. It can lead to an abundance of insights or overwhelm teams while letting the right data go unused. 60% to 73% of all data in an enterprise is left unused when running analytics.
To ensure that your marketing team doesn't fall into this trap, you need proper marketing reporting in place. In this guide, we’ll talk about how you can create top-notch marketing reports specifically tailored for your company.
tl;dr:
- Marketing reports help with decision-making in SaaS marketing
- Before creating a report, know your primary goal, target audience, relevant metrics, report actionability, and reporting frequency
- Avoid common pitfalls like lack of data collaboration between teams, over-reliance on vanity metrics, and ignoring context when creating or analyzing reports
- Use visually engaging elements like graphs and charts for better and faster comprehension of complex data sets and trends
- Three important SaaS marketing reports—marketing attribution, campaign performance, and content marketing reports
- Use a powerful analytics platform like Factors to streamline your reporting process and gain valuable insights for data-driven decision-making
Marketing reporting basics: Questions to ask before you make your reports
Before diving headfirst into creating marketing reports, let’s take a step back and consider some critical questions. These questions will ensure that your report is not only comprehensive but also specifically tailored to the unique needs and objectives of your team and organization.
1. What is the primary goal of this report?
Before you begin creating a report, you must have the primary objective in place. This gives your reporting the necessary direction and will also make it easier to pick the right metrics for the report.

For instance, if you're creating a report on lead generation for your B2B SaaS company, you'll want to include metrics related to website traffic, lead conversion rate, cost per lead, and qualified leads generated.
2. Who is the target audience for this report?
Once you know the goal and pick the metrics according to the requirements, you need to think about the person reading the report. Not all metrics are important for everyone on the team.
For example, if you’re reporting to the upper management teams, focus on high-level metrics, such as revenue, overall performance, and other growth indicators. This audience wants to see the big picture and how a project or campaign aligns with the company's overall objectives.

For team leaders or project managers, including conversion rates, task completion rates, and individual performance indicators. Team leaders want to understand the team's performance along with the goal achievement.
Finally, we come to individual team members. For this set, focus on metrics relevant to their roles and responsibilities. This might include individual performance metrics, task progress, and any feedback or suggestions for improvement.
3. Which metrics should we be tracking?
Depending on the goals of your marketing efforts and the specific channels utilized, different metrics will be relevant to measure success. Here are five of the nine most important SaaS marketing metrics you need to track.

- Conversion rate: Measure the percentage of visitors who take a desired action, such as signing up for a trial or making a purchase.
- Marketing Qualified Leads (MQLs): Track the number of leads generated by your marketing efforts who are more likely to become customers.
- Customer Acquisition Cost (CAC): Calculate the average cost to acquire a new customer, including marketing and sales expenses.
- Customer Lifetime Value (CLV): Estimate the total revenue a customer will generate over the entire duration of their relationship with your company.
- Retention & Churn: Monitor the percentage of customers who continue using your SaaS product and those who cancel, to understand customer satisfaction and inform retention strategies.
We’ve covered these and other top SaaS marketing metrics in detail that can be valuable in your reporting.
4. How can we make these reports more actionable?
To maximize the utility of your reports, consider incorporating clear visualizations such as graphs or charts that showcase trends over time or performance benchmarks against industry standards.

This way, decision-makers can quickly grasp key insights without sifting through endless rows of raw data.
5. How frequently do we need to create and analyze these reports?
The frequency at which you create and analyze marketing reports depends on the specific goals and needs of your B2B SaaS company. However, here are some general guidelines on report frequency:
- Weekly: Weekly reports help you track short-term performance and make data-driven decisions. These reports often focus on metrics like website traffic, leads, and conversions.
- Monthly: Monthly reports provide a more comprehensive view of your marketing performance and allow you to analyze trends and patterns over a longer period. These reports typically include a broader range of metrics, such as customer acquisition cost (CAC), lifetime value (LTV), and churn rate.
- Quarterly: Quarterly reports help evaluate the effectiveness of your campaigns and make adjustments as needed. Quarterly reports often include a mix of high-level KPIs like revenue growth and more granular metrics related to specific campaigns and channels.
- Annually: Annual reports offer a big-picture view of your marketing performance and are important for strategic planning and goal setting. These include a thorough analysis of the key metrics, as well as an evaluation of your overall marketing strategy in terms of its alignment with the company’s goals.
5 marketing reporting mistakes to avoid in B2B marketing
As important as it is to create insightful marketing reports, you must avoid common mistakes that can diminish the value and impact of these reports. Here are some prevalent pitfalls in marketing reporting and examples of how they manifest in a B2B context.
1. Lack of data collaboration
In many B2B organizations, marketing data is siloed within individual teams. This leads to a fragmented and incomplete view of marketing performance. Without input from the sales team, the marketing team may be unable to determine lead quality or measure the efficacy of lead nurturing efforts accurately.
To solve this, you need to foster a culture of data collaboration and sharing. Businesses can ensure that all relevant stakeholders have access to the information they need to make informed decisions. A tool like Factors can help bring together data from various analytics and CRM platforms to give a complete 360-degree view of the marketing performance.
2. Not tying metrics to business outcomes
When creating marketing reports, prioritize metrics that directly impact revenue generation, customer acquisition, and retention. For instance, if one goal is increasing annual recurring revenue (ARR), make sure you're tracking metrics such as customer lifetime value (CLV) or churn rate alongside standard campaign performance indicators.
Also, track the number of marketing-qualified leads (MQLs) that convert to sales-qualified leads (SQLs) and ultimately close deals. This will give your readers a better understanding of how your marketing efforts have helped the company achieve its goals.
3. Over-reliance on vanity metrics
Vanity metrics may appear impressive at first glance, but they often fail to provide meaningful insight into marketing success. Instead of fixating on surface-level stats, dive deeper and examine how these figures impact crucial factors like lead generation, conversion rates, or sales pipeline growth.
Suppose you see an increase in social media following and engagement in a particular month. Looking at just the vanity metric, it may seem like the company is growing in the right direction. But if you dig deeper to find that the audience engaging with your content isn’t moving further down the funnel, the vanity growth adds no value to the company.
4. Disregarding context when creating or analyzing reports
Without context, interpreting marketing data can be misleading and result in poor decision-making. B2B marketers should consider industry trends, seasonal fluctuations, and competitor activities when analyzing their marketing reports.
For instance, in the case of a company that sells tax preparation software as a service (SaaS), there might be a significant uptick in subscriptions in the months leading up to the tax filing deadline. If this seasonal trend is not considered, the sudden increase could be misinterpreted as the success of a recent marketing campaign. Similarly, a drop in subscriptions after the tax season shouldn't automatically be seen as a failure in marketing efforts.
5. Overlooking actionable insights
Effective marketing reporting should provide not only data but also actionable insights that drive improvement. This requires a thorough understanding of the target audience, marketing goals, and key performance indicators (KPIs). As you craft your reports, add and present information such that it can be turned into specific actions or strategic decisions.
For example, a B2B software-as-a-service (SaaS) company can analyze its website's user behavior data, such as time spent on specific pages or click paths, to identify areas where potential customers may be dropping off during the sales process. After identifying the important areas, the company can make targeted improvements to its website layout, content, or calls to action, ultimately increasing conversion rates and driving more sales.
Tips to extract actionable insights from your marketing reports
To maximize the impact and utility of your marketing reports, it's essential to focus on extracting actionable insights that can drive decision-making and strategy optimization. Here are five tips to help you achieve this:
1. Define clear objectives
Start by outlining specific, measurable goals for each report. Are you looking to optimize your ad spend, improve customer engagement, or identify your most successful marketing channels? Knowing the objectives will help you focus your analysis and extract the most relevant insights.
For instance, if you’re looking for ways to increase sales, you may want to analyze your marketing channels and identify the most effective channels that drive conversions. Then, pinpoint the best-selling products that appeal to your target audience. With this, you can allocate your resources more effectively and make well-informed decisions on marketing strategies.
2. Understand the context of your data
Before making major changes to your marketing, consider external context that may influence performance. This can include industry trends, competitor actions, seasonal fluctuations, or even global events like economic downturns or pandemics.
Suppose there's a decrease in your trial sign-ups during a trade show. When you take that in context, potential customers may be busy attending sessions which can affect your marketing campaigns. Recognizing this helps avoid unnecessary changes to your strategies and helps you optimize your efforts around the event instead.
3. Segment your reports
Your customer-base is diverse. And understanding this diversity can help deliver the right information to the right group. Start by segmenting your marketing reports based on demographics, geography, behavior, or other relevant details. This will help you uncover trends, patterns, and preferences that can inform your marketing strategies.
For example, suppose you operate a project management SaaS. Through segmented reports, you discover that:
- small tech startups frequently use the platform for sprint planning
- larger corporations use it more for long-term project tracking
With this knowledge, you can now tailor the marketing messages to highlight the exact features and benefits that resonate with each segment—enhancing the relevance of your communications and positively impacting your conversion rates.
4. Improve visualizations
A well-designed visualization can make a world of difference in how easily you can understand and interpret your marketing reports. Use charts, graphs, and other visuals to present your data clearly and compellingly to your audience. People are more likely to consume and leverage visual data. Also, it’s easier to identify trends, spot anomalies, and draw accurate conclusions from visual plots compared to reading through tables of data.
To make visualization easier, use tools like Factors, PowerBI, or Google Looker Studio to create interactive dashboards that allow you to explore your data from multiple angles and extract valuable insights.
5. Embrace data storytelling
Data storytelling means weaving a narrative around your data, making it easier to understand, remember, and act upon. This can connect marketing data points with broader business objectives while keeping the presentations easy to digest. Stories can also help stakeholders better understand the significance of your marketing efforts.
For example, if your data reveals that a targeted content marketing campaign significantly boosted trial sign-ups and subsequently increased monthly recurring revenue (MRR), showcasing this storyline in your report will emphasize the strategic value of content marketing efforts.
3 types of marketing reports SaaS companies should be creating
To fully understand the impact of your marketing efforts and make informed decisions, you need to create and analyze various types of marketing reports. Here are three types of marketing reports that SaaS companies should be focusing on:
1. Marketing attribution reports
These reports help you understand which marketing channels or touchpoints contribute the most to achieving specific goals like lead generation or customer acquisition. By accurately attributing success to different initiatives, you can allocate resources more effectively and optimize strategies based on performance.

Suppose your marketing attribution report shows that LinkedIn advertising has consistently generated a high number of qualified leads at a low cost per acquisition (CPA). In that case, you may want to increase your ad budget for LinkedIn while reducing spend on lower-performing channels.
2. Campaign performance reports
Campaign performance reports are vital for measuring the effectiveness of individual marketing campaigns and initiatives such as email series, content promotions, or product launches. These reports typically include metrics like click-through rates (CTR), conversion rates, return on investment (ROI), and customer feedback.
For instance, if you recently launched a webinar series targeting C-level executives in the FinTech industry, your campaign performance report could assess registration numbers, attendee engagement levels, post-webinar survey responses, and any subsequent sales pipeline growth attributed to this initiative.
3. Content marketing reports
Content marketing is often an integral part of B2B SaaS companies' overall strategy. Monitoring the effectiveness of your content assets can provide valuable insights into what resonates with your target audience and drives desired outcomes such as increased website traffic or lead generation.

A comprehensive content marketing report may track metrics such as page views, time spent on a page, bounce rate, or social media shares for individual blog posts or e-books. Additionally, assessing how specific pieces of content impact broader business outcomes like trial sign-ups or revenue growth can further refine your understanding of your content's value.
When it comes to streamlining your marketing reporting process and gaining valuable insights, leveraging a powerful tool like Factors can be a game-changer. Factors’ comprehensive analytics platform offers an efficient way to generate marketing attribution, campaign performance, and content marketing reports, allowing you to make data-driven decisions that drive business growth in the B2B SaaS space.
Unlock the power of data-driven decision-making with stellar marketing reports
The modern data-driven world presents a double-edged sword for SaaS marketing teams. On one hand, it offers access to an abundance of data to inform strategies and drive growth. On the other, it poses the risk of overwhelming marketers, leading to valuable data being left unused.
To unlock the full potential of your data, you need to craft tailored, insightful, and actionable reports that address your unique business needs and objectives. Central to the process of marketing reporting are reporting and analytics tools that streamline and enhance your reporting efforts.
Enter Factors. Factors is an advanced B2B account analytics, attribution, and account intelligence platform that aims to help businesses drive more pipeline with less spend. By revealing anonymous companies visiting the website, decoding customer journeys, and providing valuable insights, Factors gives companies the data they need to make the right decisions and optimize their marketing strategies.
Don't let valuable insights slip through the cracks. Embrace data-driven decision-making and upgrade your B2B SaaS marketing game with powerful marketing reporting today.
FAQs
To further enhance your understanding of marketing reporting in the B2B SaaS context, here are some frequently asked questions with concise answers:
1. What are the main components of a marketing report?
A typical marketing report may include:
- An executive summary highlighting key findings and insights
- Data visualizations like charts, graphs, or tables for clear presentation of the conversion rates, traffic, session data, and leads and revenue generated
- Analysis of performance/results aligned with business objectives
- Actionable insights and recommendations for optimization or improvements
- Appendices with raw data or supplementary information as needed
2. How do you run a marketing report?
To create an effective marketing report, follow these steps:
- Set clear objectives and goals for the report
- Determine which metrics are most relevant to your campaign or initiative
- Collect data from various channels (e.g., Factors, Google Analytics, CRM, social media platforms)
- Analyze the data within the context of your goals and industry landscape
- Present findings through clear visualizations and concise narratives
- Include actionable insights that guide decision-making or strategy adjustments
3. What is the objective of marketing reporting?
The primary goal of marketing reporting is to give in-depth insights into the performance of different campaigns or projects. It helps make decisions based on data by providing actionable suggestions for optimization or enhancement.
Marketing efforts are aligned with wider business goals in these reports. They can help discover growth opportunities and improve overall efficiency. This leads to achieving desired results such as generating leads or acquiring customers in B2B SaaS companies.

5 Mistakes To Avoid When Measuring Content Marketing ROI
Did you know the content market industry is projected to reach an astounding $107 billion by 2026? With such high stakes, almost half of the marketers have planned to increase their content marketing budgets this year.
But here's the catch: while everyone wants to jump on the bandwagon, measuring content marketing ROI is where many marketers trip.
In this article, we'll discuss 5 of the most common mistakes marketers make when measuring content marketing ROI.
What is Content Marketing ROI?
Content marketing return on investment (ROI), is a metric that measures the revenue a business earns from its content marketing efforts compared to the cost of those efforts. It's a way to quantify the effectiveness of your content marketing strategy in terms of financial returns.
Calculating content marketing ROI might seem daunting, but it's quite straightforward. Here's a simple formula:

This formula gives you a percentage that represents your return on investment.
For example, if you spent $1000 on content marketing and earned $3000 in revenue, the profit is $2000. This means your ROI is 200%---you made $2 for every $1 spent.
Why is Measuring Content ROI Important?
Here are some of the major reasons why every marketer must measure the ROI from content marketing:
Streamline Budget and Resource Allocation
Content marketing is a broad field that includes various types of content—from blog posts and social media updates to podcasts and videos.
Each of these content types requires different resources and has a different impact on your audience. When you measure the ROI of each content type, you can understand which ones are delivering the best results and allocate higher budgets to that type of content.
Let's consider an example. Suppose you have a budget of $10,000 for content marketing. You decide to split it equally between blog posts and video content, spending $5000 on each.
A few months in, you find that:
- Your blog posts generated $10,000 in revenue, giving you an ROI of 100% (10,000 - 5,000) / 5,000 * 100
- Your videos generated $20,000 in revenue, giving you an ROI of 300% (20,000 - 5,000) / 5,000 * 100.
Along with revenue, your attribution model shows that while blog posts are often the first touchpoint, videos are the last touchpoint before a customer makes a purchase.
This data suggests this—blog posts are important for attracting customers and videos are more effective at converting them. As a result, you decide to allocate a higher budget to video production in the future.
This kind of data-driven decision-making can help you optimize your content marketing strategy and ensure that your resources are being used effectively.

Helps with Executive Buy-In
We've all heard of a CEO or CMO who redirected their marketing budget from organic to paid ads. Why does this happen? The answer—content marketing does not offer an immediate or direct conversion, unlike paid marketing.
However, a comprehensive tracking and analytics system like Factors makes attributing revenue and sales to content marketing easier. All the data is displayed in the form of a user timeline in chronological order. You see all the touchpoints all the way from the first one right up to the conversion, helping you set up attribution and get executive buy-in for increased budgets.

Can Reduce Churn
When tracking ROI, you tend to notice gaps within your existing content. This could be a lack of knowledge base, FAQs, video tutorials, or other content pieces.
If you notice that your customers interact and use your existing knowledge base a lot, you can double down on the content there to help them make the most out of your product or service.
As customers become more invested in your products through these efforts, sunk cost fallacy comes into play and your customers are less likely to switch.
Improve Collaboration Between Sales and Marketing
Measuring content ROI also requires collaboration between the sales and marketing teams. During sales calls, your sales team can identify which content a user viewed before booking the demo. They can then correlate the conversion rates with the type of content to identify what performs best.
For instance, if whitepapers or webinars are effective in moving leads further down the sales funnel, your marketing team can double down on these pieces. This can also help the sales team close more leads and bring in more revenue.
Mistakes to Avoid When Measuring Content Marketing ROI
When it comes to measuring the return on investment (ROI) of your content marketing efforts, there are several common mistakes that marketers often make. Avoiding these pitfalls can help you gain a more accurate understanding of your content's performance and its impact on your bottom line.
1. Not Understanding the True Cost of Content Production and Distribution
Most marketing teams do not track the true cost of content production and distribution.
This cost includes both
- direct costs: such as the cost of hiring writers or purchasing content
- indirect costs: such as the time spent by your team to manage, edit, and distribute the content.
According to a Forbes article, content is the gasoline that fuels the entire marketing engine. Just like gasoline, there are different grades of content and each grade comes at a different price. Knowing the collective costs of creating and distributing content is the best way to start identifying the ROI from your content marketing efforts.
2. Relying Exclusively on Vanity Metrics
Vanity metrics make you feel good about your marketing efforts. They include website page views, the number of subscribers on your newsletter list, the number of likes or followers on social media, and email open rates.
However, vanity metrics tell you nothing about your business performance.
For example, a million monthly page views might sound impressive. But if they do not translate into sales, they are not contributing to your bottom line. Similarly, having a large number of email subscribers is meaningless if they do not engage with your content and take the desired actions.
Instead, focus on actionable metrics like:
- website conversion rates
- click-through rates of email campaigns
- customer acquisition costs
- positive brand mentions on socials and other websites
These metrics help you better understand how your content is impacting your bottom line and make data-driven decisions to improve your content marketing ROI.
3. Ignoring Micro-Conversions
Micro-conversions are the smaller actions that website users take on the path to macro-conversions.
Micro conversions can include actions such as:
- signing up for a newsletter
- downloading a whitepaper
- brand mention on social media
While these actions may not directly lead to a sale, they are important indicators of user engagement and can provide valuable insights into the customer journey.
Ignoring these micro-conversions can lead to missed opportunities for optimization and improvement. But tracking and analyzing these small actions helps you better understand your customer's behavior and make impactful decisions for your content strategy.
4. Relying only on self-attribution
Self-attribution is the source of conversion as reported by the customers themselves. This could be through surveys, feedback forms, or other direct communication where the customer tells you how they found out about you or what influenced their decision to convert.
A study by Google mentions that customers have an average of 2.8 touchpoints before making a purchase. This means that if you're only attributing success to the last touchpoint, you're missing out on considering the impact of the other 1.8 touchpoints.
Consider a customer who discovered your brand through a blog post. They also engaged with your social media content before making a purchase through a promotional email. If you ask this customer what influenced their purchase, they may mention it was the promotional email. But that undervalues the role of other pieces of content within the buyer journey.
To avoid this mistake, complement self-attribution data with other methods of tracking customer interactions. This means, using analytics tools like Factors to track customer behavior on your website and across platforms, and implementing various attribution models to consider all touchpoints in the customer journey.
For example, a linear attribution model would give equal credit to all touchpoints, while a time-decay model would give more credit to the touchpoints closer to the conversion.
Let’s now look at how we can calculate the content marketing ROI with an example.
Calculating Content Marketing ROI With An Example
Let's take a look at an example to better understand how to measure the ROI of a content marketing campaign.
Suppose one of your blog posts started ranking on Google through SEO and was also promoted on social media and email campaigns.
By the end of the month, the blog got 800+ unique visitors – 500 through search engines and 300 through promotional efforts. Of these 800 visitors, 60 signed up for the product.
You earn around $5000 from these 60 customers
If the cost of producing and promoting the blog post was $1000—which includes the cost of writing and repurposing the content across platforms, what’s our ROI on this piece of content?
Using the content marketing ROI formula:
ROI = ($5000 - $1000) / $1000 * 100% = 400%

This means that for every $1 spent on the blog post, you earned $4 back.
And because SEO content keeps bringing in visitors, long after the work is done, you continue to reap the benefits from these efforts.
Measure your content efforts with Factors
Let’s get started with a practical setup of how you can leverage Factors for content marketing ROI measurement.
Step 1: Define Your Goals and Metrics
Before you start measuring your content performance, you need to determine what success means for content marketing.
For you, it could mean increasing website traffic, generating leads, improving conversion rates, or boosting customer engagement. Determining your metrics and key performance indicators (KPIs) will help you measure your progress toward these goals.
Factors provide Attribution tracking which helps you create reports that attribute your marketing efforts to specific goals and metrics.
Here's how you can build an event report in Factors.ai:
- Log in to Factors and click on Reports > Analyse

- Next, click Attribution Reports. These reports keep track of all the touchpoints through the platforms that Factors has connected with and UTM data to identify the source of conversion.

- Next, we need to identify the specific goals that signify a successful conversion.
Step 2: Set Up Tracking/Attribution
If you haven’t set up events, you can do so by clicking on the configure icon beside your profile picture and clicking Events.

- Factors also automatically track events across all the pages of your website. You can simply set a page as your conversion goal (for ex. Demo page). Let’s take this as an example and create an attribution report.
- The conversion goal is set to the /schedule-a-demo page.

- Marketing touch points are the type of marketing campaigns that you want to track within these reports. Tactics are outbound marketing campaigns like Google ads. Offers are inbound marketing tactics like landing pages and content that you create to bring in visitors.
- We then pick the Property as a Campaign here so we can attribute the marketing efforts to specific campaigns. You can pick a source if you want to identify which of your channels is bringing in the most conversions.
- Then, we move to Criteria. This helps you configure how a conversion is attributed to a specific campaign. We’ll start by configuring it to the first touchpoint. This means all conversions are attributed to the first touchpoint.

We also set the time window to 30 days. This ensures that even if a visitor converts after 30 days, you can attribute it back to the first touchpoint.
- Once done, click Run analysis and you’ll have a complete visual report specifying exactly what campaigns bring in your leads.

Step 3: Understanding Campaign Costs and ROI
Scrolling down the report will give you a breakdown of individual campaigns that bring in leads.
- Factors can also bring in the ad spends for each campaign on a single dashboard. This means you can identify how much money was spent on a campaign vs. the return.

- Scroll below the chart to see the breakup. This breakup will give you insight into how your content marketing performs and the number of conversions it brings in.

With that, you have a fundamental understanding of how to attribute business success to your content marketing efforts and showcase the impact to the stakeholders.
However, it’s just the beginning. Factors integrates with 6signal by 6sense, Hubspot, Zapier, Ads platforms, Slack, and many other tools to bring data from across platforms under a single dashboard. This lets you create comprehensive reports and also gives you a holistic view of all your marketing campaigns, no matter the platform.
Leverage The Factors Advantage for Content Marketing ROI Optimization
With content marketing, you're juggling multiple tasks—creating content, tracking performance, and more importantly, measuring return on investment (ROI). But, measuring ROI isn’t straightforward. It involves setting clear goals, tracking the right metrics, understanding your costs, and connecting the dots to get a holistic view.
That’s a lot to handle. But Factors is here to simplify things for you.
It makes tracking and understanding your content marketing efforts a breeze. With its analytics and attribution tools, you can easily track user behavior, identify key touchpoints, and optimize your sales process. Plus, Factors’ customizable dashboards give you a real-time view of your key metrics, helping you make data-driven decisions on the fly.
So, are you ready to unlock the full potential of your content marketing? Then it's time to take the next step. Book a demo with Factors and start your journey towards content marketing success, today!
.webp)
6 Account-Based Marketing Tactics To Drive Conversions
Are you generating lots of leads but not enough conversions? That’s the story of many startups as well.
Enter Account-based marketing — a strategic approach that personalizes marketing efforts for individual accounts to increase the likelihood of conversion.
In this guide, I'll share 6 battle-tested account-based marketing tactics that personalize marketing, and turn targeted accounts into happy customers, without draining your team.
We’ll cover tactics including:
- Building personalized landing pages addressing your ideal customer's pain points
- Small, industry-focused webinars to engage key accounts
- Tailored ads optimized for different buying stages
Let's dive into the ABM tactics that deliver real results.
6 account-based marketing tactics + examples
Here are 6 of our favorite ABM marketing tactics that businesses have seen great success with.
1. Personalized landing pages: A personal touch for your target accounts
Personalized landing pages speak directly to your target accounts, addressing their unique needs and pain points.
This isn't about simply changing the company or industry name on a generic landing page — it's about creating a tailored experience that resonates with your ideal customer profile.
Take Procurify, a Vancouver-based spend management company. They were in full-on growth mode, having secured Series B funding and expanded their teams. But with growth came increased pressure on the marketing team to accelerate customer acquisition.
Procurify's solution? An innovative strategy that involved creating 50 super-personalized landing pages that spoke to the exact needs of the industry they catered to.
The result — 38% overall demo rate, a testament to the power of personalization.

The key to Procurify's success was understanding their target accounts' needs. All the landing pages, though following a similar template, were unique in what they said. The copy spoke to only one person/industry and no one else. That’s what made this work.

But these pages also need to be seen by the right people. Procurify paired their landing pages with video ads, which had a cost-per-conversion that was just a quarter of their search ad spending.
The takeaway? Personalized landing pages can be powerful for your ABM toolkit.
2. Thought leadership webinars and roundtables: Engaging target accounts with industry insights
Webinars and roundtables are not new in the world of marketing. But when used in an ABM strategy, they can be a goldmine.
Inviting thought leaders from your target accounts to participate in these events helps you provide value to your audience and also build excellent relationships with key decision-makers.
A great example of this is the SaaS company, Outreach. They regularly host webinars featuring industry thought leaders.
This not only positions them as a knowledge hub in the industry but also allows them to engage with their target accounts on a deeper level.

For instance, they hosted a webinar titled "How to create and close more pipeline in 2023".
Here Andrew Arocha, CRO of Drift, and Melton Littlepage, CMO of Outreach jammed together on different tips and strategies to close more sales and improve team productivity.
The topic is a perfect audience merge of both businesses, helping them raise awareness of what they do—while connecting Outreach to Drift for future business opportunities.
How can you replicate this for your own ABM strategy? Here are a few steps:
- Identify the thought leaders in your target accounts
- Invite them to participate in a webinar or roundtable discussion
- Choose a topic that is relevant to your industry and your target accounts
- Promote the event to your target accounts and broader audience
- Follow up with participants after the event to continue the conversation
If you’re a smaller company, start with leaders that aren’t too popular. For example, connect with marketing heads instead of CMOs. They’re more accessible and can help you get started quicker.
3. Segmented ads: Tailored messaging for every buying stage
In the world of ABM, the more personalized your approach, the better your results. This is particularly true when it comes to advertising. Segmented ads, which are tailored based on the buying stage and industry of your target accounts, can significantly increase engagement and conversion rates.
One SaaS company that has successfully leveraged this tactic is DocuSign. As part of their ABM campaign, they targeted 450 accounts with different messaging, images, and calls to action, depending on the account's industry and stage in the buying cycle.

This highly personalized approach allowed them to speak directly to the needs and interests of each account, resulting in a more effective campaign.
Here’s one more example from Intridea – a full-service digital agency. They rented a billboard right across Ogilvy & Mathers’ office for some confrontational copy.

How can you replicate this in your own ABM strategy? Here are a few steps:
- Identify your target accounts and segment them based on industry and buying stage
- Develop different ad creatives and messaging for each segment and industry
- Use a platform like LinkedIn or Google Ads to create targeted messaging
- Monitor the performance of your ads and adjust them as needed
Segmented ads can be a powerful tool in your ABM strategy. By tailoring your ads to the specific needs and interests of each target account, you can increase engagement, improve conversion rates, and ultimately drive more revenue for your business.
4. Freebies: A win-win strategy for engagement
Everyone loves a good freebie, and your target accounts are no exception. Offering valuable resources like reports, templates, or even personalized gifts can be a great way to catch the attention of your target accounts and show them you're invested in their success.
One company that has leveraged this tactic to great effect is O2, a leading provider of mobile and broadband services in the UK.

A few years ago, O2 decided to raise its profile as a total communications provider in the B2B space. They created personalized, well-researched, value propositions that showed prospective targets how much they could save by switching to O2.
The results—impressive.
The campaign generated £260m in the pipeline and £39m in closed deals. The personalized reports were a key part of this success and helped the business gain access to accounts that otherwise did not convert.
So, how can you replicate this in your own ABM strategy? Here are a few steps:
- Identify the key decision-makers in your target accounts.
- Understand their needs and challenges.
- Create personalized freebies that address these needs. This could be anything from a valuable report or whitepaper to a product demo or a custom gift.
- Deliver these freebies through personalized ads or direct outreach.
- Follow up with the decision-makers to get their feedback and continue the conversation.
The success of O2's ABM campaign shows that freebies can be a powerful tactic in ABM, especially when they are personalized and provide real value to the target accounts.
So, the next time you're planning your ABM campaign, consider what kind of valuable freebies you could offer to your target accounts and allocate some resources to creating them.
5. Curated emails: Nurturing relationships with target accounts
Connecting with your dream accounts is all about relationship building. And email can be one of your best tools for nurturing those relationships. Instead of blasting generic emails to every account, get strategic with personalized outreach. Really get to know your target accounts—what makes them tick, what challenges they face, and what solutions they need.
Take Skill Share, the online learning platform, as an example. They could send generic course lists to every account. But, they choose to send carefully curated courses that are relevant to a user’s activity and choice of courses.

So, if a user shows interest in video production and editing courses, Skill Share curates a list of courses that are relevant. You can also take it one step ahead — design course pathways that help a user go from 0 to hero where you suggest the next best course automatically over email, when one is nearing its end.
If this is difficult to implement because of how your platform is built, segment your audiences based on the categories of content they consume and create personalized emails for each segment.
The takeaway? Don't just blast emails and hope for the best. Take the time to craft customized outreach that provides real value. That's how you make target accounts feel special - and turn them into loyal customers.
6. Visual social proof: Show, don't just tell
Visual social proof is a powerful way to showcase your company's success and the value you bring to your customers. This can take the form of case studies, customer testimonials, or even social media campaigns that highlight your company's achievements.
For instance, HubSpot, a leading marketing, sales, and service software, uses visual social proof on its homepage by showcasing its customers' logos. This gives potential customers a sense of trust and reliability, knowing that other reputable companies are using HubSpot's services.

Another great example is Ahrefs, an SEO tool, which uses visual testimonials from leading experts in the industry. This gives the company credibility and reassures potential customers about the quality of their product.

Visme, an infographic tool, shows the number of people using their tool around the world. This gives potential customers a sense of the tool's popularity and effectiveness.

Showcase the logos of some of your best clients. Talk about how your product has helped them grow. If you can, combine this with personalized landing pages and showcase industry-relevant logos on each page.
This helps build trust with your customers even before they have booked a demo call or talked to anyone from your team. After all, it’s not about telling your target accounts what you can do for them but showing them real, tangible proof of what you've already done for others.
Deliver a personalized marketing experience at every stage
Implementing these ABM tactics is only half the battle. To truly make the most of your ABM strategy, you need to know which accounts to target and which metrics to track.
Knowing which accounts to target helps you focus your resources on the accounts that are most likely to convert. This is possible with the help of account scoring. Account scoring, implemented right, can give you a clear picture of which clients you must target first and which ones can be deprioritized for better resource allocation.
You also need to be tracking the right metrics to measure the success of your ABM strategy and to make necessary adjustments. Some key metrics to track include engagement rate, conversion rate, and customer lifetime value. But remember, the metrics you choose to track should align with your overall business goals.
.webp)
12 Demand Generation Metrics for Sales Funnel & Aligning for business
Need help seeing results from your marketing campaigns? You need to begin tracking the right demand generation metrics. They help you know what's working at each marketing stage—from initial brand awareness to customer retention.
While there are numerous metrics that you can track, let's explore the 12 most important demand generation metrics you must consider tracking. From website traffic to content engagement and beyond—we'll cover the key performance indicators (KPIs) that allow you to:
- Identify bottlenecks in your marketing processes
- Prioritize high-impact campaign strategies
- Continuously optimize based on actionable data
- Prove and improve marketing's impact on revenue
Let's get started.
Top 12 Demand Generation Metrics
Rather than tracking every metric under the sun, it pays to focus on a targeted set that will give you true insight into your marketing efforts. We'll split them into sections of the B2B sales funnel—top of the funnel, middle of the funnel, bottom of the funnel, and post-conversion metrics for simplicity.

Here are the top 12 metrics you must track for better demand-gen marketing.
Top-of-the-funnel metrics
The top of the funnel is all about driving awareness and interest in your brand. To measure effectiveness at this stage, focus on these key metrics:
Website Traffic and Unique Visitors
Your website traffic shows the total number of sessions or pageviews on your site over time. The unique visitors metric represents the number of new people who have come to your website within a designated time frame.
When both metrics are tracked together, it gives insight into how well your campaigns expose your brand to fresh audiences and drive engagement.

For example, if you drive 5,000 visits and 4,000 unique visitors in a month, it tells you your traffic sources are introducing 1,000 repeat visitors along with 4,000 new people to your site.
This analysis helps you identify which channels excel at attracting relevant new visitors vs. repeat traffic. You can then focus efforts on high-performing channels for new visitor growth while phasing out ones only to drive repeat traffic.
Landing Page Conversion Rate
Your landing page conversion rate is the percentage of visitors completing your desired goal action on your landing page, like downloading content or signing up for a demo. For instance, if you get 300 downloads from 1,000 visitors, your conversion rate is 30%.

Landing Page Conversion Rate: (Total conversions / Total visitors to the landing page) x 100
You can test different elements on your landing pages, like copy, visuals, and calls to action, to refine them for higher conversion rates over time. With an analytics tool like Factors, you get the insights necessary for optimizing your funnel for better conversions.
Click-Through Rate (CTR)
Click-through rate is the ratio of users who click on your ad or content compared to the number who saw it. For example, if your ad gets 300 clicks after being seen 1,000 times, your CTR is 30%.
.avif)
CTR: (Total clicks / Total impressions) x 100
CTR indicates how well your ads perform. If more people click on your ad, it reaches the right people and resonates with them. So, it makes sense to monitor CTR by campaign, ad group, and keyword to identify high-performing content.
Middle-of-Funnel Metrics
Once you've attracted visitors and converted them into leads, it's time to begin nurturing and qualifying them and determining their sales-readiness—that's the middle of the funnel. These key metrics help you assess pipeline health at this stage.
Lead Generation Rate

Your lead generation rate shows how many new leads are produced over a specific period, typically monthly. For example, if your marketing efforts on one channel generate 400 leads over two months, you have a monthly lead gen rate of 200. The higher this number, the better it is—indicating better marketing.
Lead-to-MQL Conversion Rate
Once you have collected the leads, it's time to convert them into MQLs and take them further along the funnel. This metric looks at the percentage of new leads that turn into marketing qualified leads (MQLs)—these are deemed ready for sales follow-up. For instance, if you generate 400 leads monthly and 100 qualify as MQLs, your conversion rate is 25%.
Lead-to-MQL Conversion Rate: (Total MQLs / Total new leads) x 100
This helps you understand how effectively your lead nurturing process moves prospects down the funnel to sales-readiness. A higher conversion rate shows better lead scoring, nurturing, and qualification processes.
Cost Per Lead (CPL)
Your cost per lead represents the average spend required to acquire a new marketing lead. It's calculated by total marketing costs divided by the number of new leads.
For instance, $4,000 in marketing was spent to generate 400 leads. The CPL is $10.
Cost Per Lead: Total marketing costs / Total new leads
We want the cost to be as low as possible to acquire the same number of leads. So, in this case, lower CPL is better for your marketing campaigns. Once you've nurtured your leads, it's time to track and analyze the leads that move to the final stage of purchase—the bottom of the funnel.
Bottom-of-the-Funnel Metrics
As leads move to the final sales stages, these metrics indicate how effectively your processes close and retain business:
Opportunity-to-Win Ratio
This metric evaluates the percentage of sales opportunities that successfully convert to won deals. For example, if your team successfully closes 50 out of 100 closed opportunities, your opportunity-to-win ratio is 50%.
Opportunity-to-Win Ratio: (Total won opportunities / Total closed opportunities) x 100

The higher this percentage, the better your sales team performs. The average sales win rate hovers around 47%. If your sales team can close a higher percentage of leads, it means the sales team better understands your audience's needs. But along with that, it also signifies your lead filtering is done well.
Customer Acquisition Cost (CAC)
Your CAC is the average cost to convert a new customer. It's calculated by dividing total sales and marketing costs by the number of new customers won.
For instance, $40,000 in marketing and sales to gain 100 new customers means a CAC of $400.
.avif)
Compare CAC to factors like customer lifetime value and retention rates to ensure your acquisition costs align with potential revenue and longevity from each customer gained. Use CAC benchmarks by industry to optimize your spend.
Sales Cycle Length
The sales cycle length tracks the average days from initial contact to deal close. In the B2B space, the average sales cycle length can be over two months. However, it's best to aim for a lower average here.
You can try account-based selling—a technique where you look at leads as accounts or companies to target instead of individual users.
This allows you to gain a holistic perspective of the pain points a particular account is trying to solve and target individual accounts with messaging that checks the right boxes.
Determining an individual lead's account can become easier using account intelligence tools like Factors.
Post-Conversion Metrics
Once a customer is acquired, you must also ensure they stay with your company. This involves customer success, customer support, and customer experience throughout their journey. Let's look at some metrics that help you determine the actual value of your products or services.
Customer Lifetime Value (CLTV)
Your customer lifetime value metric represents the average revenue generated from a customer over the entire relationship. It's calculated using average purchase value, frequency, and customer lifespan.
For instance, if a customer pays you $200 a month, and the average relationship is 14 months, your customer lifetime value is $2800.
This metric is valuable for two reasons—one, it tells you the average revenue each customer generates, and two, it tells you how much money you can spend to acquire each customer. Continuing the above example, you're running profitable marketing campaigns if you spend $350 to acquire a new customer.
As you acquire more customers, keep an eye out for this number. Suppose you optimize this through better customer experience, improving features based on feedback, and providing more and more value every month. In that case, you can create a sustainable business in the long term.
Churn Rate
Your churn rate shows the percentage of customers you lose in a given timeframe. For example, if you lose 50 of your 500 customers annually, your churn rate is 10%.

The average annual churn rate in SaaS is 32-50%. This means 50-68% of the users continue using the same product for over a year. While the churn rate cannot be zero, the lower you keep this, the better it is for your business.
Higher churn signals a problem—the product or service isn't delivering enough value to the customers. It also hurts marketing since they now have to work with smaller budgets to acquire more customers while working with the high churn—and it's a vicious cycle you'd best keep at bay.
The best way is to track this metric closely and take action to reduce the churn rate whenever it is going in the wrong direction.
Customer Satisfaction and Net Promoter Score (NPS)
Customer satisfaction metrics like NPS measure customers' happiness and loyalty via direct feedback. NPS asks customers their likelihood to recommend your product or service on a 0-10 scale.
Net Promoter Score: % Promoters (9-10 score) - % Detractors (0-6 score)
This metric relates to the two metrics we discussed above. If your customers are happy, they will stay with the business longer, with less churn.
With technology aiding customer support, begin taking advantage of chatbots trained on your product documentation to answer customer questions instantly—and leave the complex queries for your lean support team.
Aligning the Chosen Metrics for Your Demand Generation Goals
While you can pick a few metrics from the above list and start tracking, you must ensure that the chosen metrics align with your demand generation goals. Let's look at what to consider to do this effectively.
Connect Metrics to Overall Goals
Consider your main company goals, like revenue growth, customer acquisition, or market expansion. Determine which critical metrics at each funnel stage help track progress toward those goals.
For example, track lead volume and velocity through the pipeline and retention rate for a revenue growth goal. To expand market reach, monitor website traffic sources and visitor engagement—this will tell you the story of how far and wide your marketing reaches.
The idea is to have a standardized set of primary metrics you and your marketing team will watch at each stage that map back to high-level goals. With this, you automatically align teams to work towards the same set of targets instead of creating an organizational drift.
Customize Metrics for Your Business
While standard metrics provide a strong starting point, you may want to customize based on your business model, goals, and audience.
Research benchmarks specific to your industry to set targets to gauge performance. Websites like Statista can help you understand the average range for your metrics. For instance, B2B businesses have higher CAC than DTC businesses. And that will help you set expectations when it comes to marketing costs. However, remember that the averages only help you set the goals initially. Once your marketing team has run campaigns over a few months, there will be enough data to create your own goals and metrics that work just right for your business.
Optimize Processes to Move Metrics
We must set metrics and remember them. Monitor how team hand-offs influence your metrics and identify friction points. Based on the data you gather, refine roles and information transitions across sales, marketing, product, and service to align activities that impact your numbers.
For instance, long lead follow-up times could slow velocity and conversion rates. However, refining the process to improve marketing-to-sales hand-offs can be a low-hanging fruit that maximizes lead nurturing effectiveness and increases sales readiness.
Don’t forget to take the time and understand how your teams work collaboratively and identify ways to accelerate progress on the metrics tied to company objectives—calibrate efforts across the funnel for maximum business impact.
Take the Steps To Achieve Your Business Goals with Data-Backed Marketing
Tracking every vanity metric gives us an illusion of understanding marketing performance. But drowning in numbers only muddies the picture. You want the numbers to tell a story about how marketing is progressing toward your business goals.
You want metrics to help you zero in on the KPIs and offer visibility into campaign health and opportunities—enabling strategic decisions to drive growth. And for that, you need to track the most important ones.
This guide will give you a headstart in creating tracking dashboards with the 12 most crucial demand generation metrics. But consider this as the beginning. Start pooling in data from multiple sources and aligning metrics with your business goals to extract the most valuable insights and tell the story right.
Try Factors when you need an analytics tool to help you achieve that quickly.
Factors helps you cut through the noise and clearly understand your marketing performance and revenue opportunities. It also takes advantage of visitor data to identify the business and industry a visitor is associated with—extremely valuable for account-based marketing campaigns.
Stop tracking your campaigns in the dark. The metrics are right here for you to make the most of them. Book a demo with Factors and see how we can make extracting insights easier.
FAQs
How is demand generation measured?
Demand generation is measured through a combination of website traffic, landing page conversion rate, lead volume, cost per lead, sales cycle length, win rate, churn rate, and customer lifetime value. Tracking these KPIs provides visibility into a campaign’s effectiveness at driving new prospects into the funnel and successfully converting them to customers.
What is lead scoring in demand generation?
Lead scoring helps prioritize, which leads to focus on nurturing and advancing down the funnel. It assigns points to leads based on attributes like demographics, behaviors like page views, or interactions like downloading content. The resulting lead score represents a lead's sales readiness. Analyzing metrics by lead score helps focus efforts on higher-scoring segments for better conversion.
How do you measure the ROI of demand generation?
To measure ROI, first calculate campaign costs like advertising spend, human resources, and content creation. Then, quantify revenue driven by new customers acquired through demand gen efforts. Subtract expenses from income to determine net profit, then divide by costs to calculate ROI as a percentage. Tracking attribution helps accurately assign revenue to suitable campaigns and channels.

