.svg)


AI Sales Platforms: Buyer's Guide For Enterprises (2025)
Choosing the right AI sales platform for your business can feel overwhelming. Many options are available, each claiming to boost your sales process. This can lead to confusion and sticking with outdated methods that don't fully use AI's potential.
Picking the wrong platform can waste time and money. It might not work well with your current systems or provide the insights you need to boost sales. This can cause frustration and financial loss.
But there is a way forward. By learning about the main features of AI sales platforms and how to evaluate them, you can make smart choices for your business. This guide will help you understand what to look for in these platforms and how to assess different vendors. With the correct information, you can use AI to improve your sales strategies and engage customers better.
TL;DR
- Prioritize ROI-Driven Platforms: Look for automation, predictive insights, and flexible pricing that directly impact conversion rates and sales efficiency.
- Evaluate Vendor Strengths: Assess credibility, integration support, and innovation trajectory—don't just compare features.
- Address Real-World Barriers: From integration issues to compliance and adoption, success depends on planning beyond tech specs.
- Top Platforms to Watch: Oracle, AWS SageMaker, IBM Watsonx.ai, and DataRobot lead in performance, scale, and usability across industries.
What are Enterprise AI Sales Platforms
Enterprise AI sales platforms help businesses streamline B2B sales processes using technologies like machine learning and data analytics. They assist in lead generation, customer management, and sales forecasting by analyzing data from various sources such as CRM systems, customer interactions, and market trends.
These platforms offer predictive analytics to forecast customer behavior and sales outcomes. They also automate routine tasks, helping sales teams focus on high-priority activities. AI sales platforms provide practical tools to improve decision-making, increase efficiency, and support better customer engagement across the sales cycle.
How AI Sales Platforms Boost Your Enterprise ROI?
1. Boosts Sales Efficiency
AI automates repetitive tasks such as lead scoring, email follow-ups, and data entry. This allows sales reps to focus on high-value activities like closing deals and increasing overall productivity without growing headcount.
2. Enhances Lead Quality and Conversion Rates
AI platforms use predictive analytics and intent data to identify high-potential leads. By prioritizing the right prospects, your team spends less time on low-quality leads and more time converting the right ones.
3. Improves Forecast Accuracy
AI models analyze historical and real-time data to deliver precise sales forecasts. Accurate forecasting leads to better resource planning, quota setting, and revenue predictability—all of which protect and grow your margins.
4. Reduces Customer Acquisition Costs (CAC)
By streamlining the sales process, targeting the right audience, and personalizing outreach, AI reduces wasted ad spend and unproductive calls. This lowers your CAC and improves cost-efficiency.
5. Increases Customer Retention and Lifetime Value (LTV)
AI helps track post-sale engagement, detect churn signals, and suggest the next best actions. Proactively managing customer relationships leads to longer customer retention and more upsell and cross-sell opportunities.
6. Shortens Sales Cycles
AI provides real-time insights on buyer behavior and optimal engagement timing, helping sales reps act faster and move deals through the pipeline more quickly.
7. Optimizes Marketing and Sales Alignment
By sharing data and insights across departments, AI platforms ensure marketing brings in better leads and sales follows up more effectively, reducing friction and maximizing ROI from both teams.
Key Features of AI Sales Platforms
AI sales platforms come with a range of features designed to improve sales efficiency and support business growth. Here are the key capabilities:
1. Data Aggregation and Integration
These platforms collect and unify data from various sources, such as CRM systems, emails, social media, call logs, and website visitor activity. By centralizing this data, sales teams gain a comprehensive view of each customer’s journey and preferences. This holistic view helps tailor outreach, identify bottlenecks, and make better strategic decisions.
2. Predictive Analytics and Sales Insights
Using historical data and machine learning models, AI platforms forecast future customer behavior, lead quality, and revenue trends. This helps in:
- Identifying high-value leads.
- Personalizing outreach based on likely outcomes.
- Optimizing pricing and product positioning.
- Reducing sales cycle uncertainty.
With data-backed forecasts, sales teams can shift from reactive to proactive decision-making.
3. Automation and Workflow Optimization
AI automates repetitive tasks like:
- Lead scoring and routing
- Email sequencing and follow-ups
- Data entry and record updates
- Meeting scheduling
This not only saves time but ensures consistency and faster response rates. Workflow automation also reduces manual errors, helping reps focus more on relationship-building and deal-closing activities.
4. Scalability and Flexibility
Modern AI sales platforms are designed to scale with your business needs. Whether you're expanding your team, customer base, or sales operations, these platforms:
- Handle increasing data volumes without performance drops.
- Support integrations with new tools and systems.
- Adapt to changing sales strategies and market conditions.
This flexibility ensures the platform continues to deliver value as the business evolves.
5. Real-Time Reporting and Dashboards
Most AI sales platforms include customizable dashboards that provide real-time insights into pipeline health, deal progress, team performance, and customer engagement. These reports support quick decisions and better sales forecasting.
How to Evaluate the Right AI Sales Platform for Enterprise?
Choosing the right AI sales platform requires a careful look at factors that impact both short-term performance and long-term value. Here are the core areas to focus on:
1. Vendor Evaluation Criteria
Start by assessing the vendor's credibility and track record. Key things to look for:
- Experience in the sales tech or AI space.
- Case studies or success stories from similar businesses.
- Client references and reviews.
- Ongoing support and training offerings.
- Product roadmap and innovation updates.
Vendors that demonstrate stability, responsiveness, and consistent product improvement are often more reliable partners.
2. ROI and Cost Considerations
Evaluate the platform’s potential impact on your bottom line by considering:
- Expected increase in sales productivity and conversions.
- Time saved through automation.
- Cost of onboarding, licenses, and any add-ons.
- Scalability of pricing as your team or data needs grow.
Look for platforms that provide ROI metrics or offer a pilot program so you can test value before committing.
3. Security and Compliance
Data security is critical, especially when handling customer information and sales intelligence. Ensure the platform includes:
- Compliance with relevant regulations (e.g., GDPR, CCPA)
- Encryption of data in transit and at rest.
- Role-based access controls and audit logs.
- Regular security updates and third-party certifications.
These safeguards help protect your business and maintain customer trust.
4. System Integration and Compatibility
The platform should integrate easily with your existing tools and workflows, such as:
- CRM platforms (e.g., Salesforce, HubSpot)
- Marketing automation tools.
- Email, calling, and calendar apps.
- Business intelligence and reporting tools.
Seamless integration ensures a smoother implementation and maximizes platform adoption by your team.
By considering these factors, you can choose an AI sales platform that meets your needs now and supports your future growth.
Top AI Sales Platform Providers in the Market
When evaluating AI sales platforms, understanding the strengths of major players and rising contenders helps you make an informed decision. These providers offer enterprise-grade solutions, robust infrastructures, and extensive experience in AI integration:
- Oracle: Known for its powerful data management and predictive analytics tools, Oracle’s AI capabilities support complex enterprise needs, especially for companies focused on large-scale CRM and ERP data.
- AWS (Amazon SageMaker): SageMaker provides scalable machine learning tools within the AWS ecosystem, ideal for businesses already using AWS services. It supports custom models and rapid deployment at scale.
- IBM (watsonx.ai): Offers advanced natural language processing (NLP) and machine learning capabilities. IBM is a strong choice for enterprises seeking AI solutions that focus on personalization, conversation AI, and intelligent automation.
These platforms provide innovation, simplicity, and faster time to value, especially for mid-sized or growing businesses:
- Alibaba Cloud (PAI Platform for AI): Offers end-to-end AI capabilities with strong cloud-native infrastructure. It's gaining traction for businesses looking to expand in Asian markets or adopt a hybrid cloud model.
- DataRobot: Popular for its user-friendly interface and automated machine learning (AutoML) capabilities. DataRobot empowers sales teams with actionable insights without needing deep technical expertise.
When choosing a provider, think about what you need, like integration, scalability, and support. Picking the right platform means balancing these needs with your goals, ensuring the investment fits your long-term plans and operational needs.
To study further, explore this guide on the best sales intelligence tools and how to choose the best sales intelligence tools.
Common Challenges Enterprises Face with AI Sales Technology
While AI sales platforms offer valuable capabilities, businesses must navigate several challenges to implement them effectively:
1. High Data Processing and Infrastructure Costs
AI platforms require substantial computing resources to process large volumes of sales and customer data. This can increase operational expenses, particularly for enterprises managing complex sales pipelines or using real-time analytics.
Solution: Opt for cloud-based, scalable platforms that let you pay only for what you use. Also, look for tools that offer model optimization and efficient resource utilization.
2. Talent and Skill Gaps
Successfully deploying AI tools often demands expertise in data science, machine learning, and AI operations. However, there’s a notable shortage of skilled professionals, which limits the speed and effectiveness of AI adoption for many organizations.
Solution: Invest in upskilling internal teams and explore platforms designed with no-code or low-code AI capabilities to lower the technical barrier.
3. System Integration Complexity
Legacy CRM or ERP systems may not integrate easily with modern AI platforms. This creates potential for workflow disruptions, delays in implementation, and the need for custom development or middleware solutions to bridge the gap.
Solution: Choose platforms with robust integration support, such as APIs and connectors, and adopt a phased implementation approach to ensure compatibility and minimize downtime.
4. Data Governance and Compliance
As regulatory frameworks like the EU AI Act or GDPR evolve, businesses must ensure their AI platforms comply with privacy laws and ethical standards. This includes transparent AI decision-making, secure data handling, and maintaining audit trails.
Solution: Establish a clear data governance strategy, work with platforms that support compliance requirements, and regularly audit data use and AI outcomes.
5. User Adoption and Change Management
Beyond technology, successful implementation depends on user adoption. Sales teams may resist new tools or lack training, which can limit the platform’s value. Strong onboarding programs and clear communication are essential to overcome internal resistance.
Solution: Focus on user-friendly tools, provide role-specific training, demonstrate early wins, and involve end-users in the platform onboarding process to increase buy-in.
To tackle these challenges, businesses need careful planning, invest in training, and focus on strong integration strategies to get the most out of AI sales platforms.
In a Nutshell
When choosing an AI sales platform for your business, it’s important to know the key parts and find the right match for your needs. These platforms can change how you work, from gathering data and predicting trends to automating tasks and growing with your business. By using these tools, companies can boost their sales processes, work more efficiently, and connect better with customers.
In the future, trends like generative AI and better data management will shape the industry. Businesses that keep up with these trends and adjust their strategies will use AI to gain an edge.
As you consider adding an AI sales platform to your business, think about how it can change your sales operations. These platforms use data and automation to boost your sales team's efficiency. Now is the time to make smart choices that will help your business grow. Explore what Factors can do and transform your sales operations today.
Top 15 Intent Data Platforms to Boost Your B2B Sales [2025]
Most B2B sales teams struggle with cold leads, wasted ad spending, and missed opportunities. Relying on outdated or incomplete data means reaching out too late—or to the wrong people altogether. This results in low engagement, long sales cycles, and lost revenue.
This is where intent data platforms give you a competitive edge. By tracking real-time buying signals, they help you identify high-intent prospects, personalize outreach, and close deals faster. This guide will explore the top 15 intent data platforms to help you turn buyer intent into revenue.
TL;DR
- Real-time buying signals help prioritize outreach and improve conversion rates.
- Top platforms include Factors, Cognism, Bombora, and ZoomInfo, offering features like AI scoring, LinkedIn integration, and journey mapping.
- Success hinges on choosing tools with accurate data, CRM compatibility, and compliance safeguards.
- Factors.ai stands out for its strong analytics suite, automation tools, and competitive entry-level pricing.
What are Intent Data Platforms?
Intent data platforms help track and analyze digital actions that show buying interest. These platforms gather signals from online activities like website visits, content downloads, product reviews, forum chats, and research habits. They use this data to find companies wanting to buy specific products or services.
For instance, if a company's employees read many articles on cloud security or download papers on cybersecurity, intent data platforms note this as a buying signal. This helps sales teams focus on interested accounts and reach out with the right message at the right time.
Why is Intent Data Important for B2B Sales?
Intent data is vital for B2B sales because it identifies who is ready to buy. With 67% of the buyer's journey now happening online, traditional methods struggle to find potential customers.
Intent data aids sales teams in three main ways:
- Timing: Sales teams can reach out when prospects are actively researching solutions. This boosts response rates and speeds up sales cycles.
- Prioritization: Focusing on accounts with high intent means sales teams target those most likely to convert. Companies using intent data see conversion rates triple.
- Personalization: Knowing what content prospects engage with allows for more relevant conversations. If a prospect explores specific features, sales teams can discuss those directly.
How to Choose the Right Intent Data Platform?
1. Identify Your Business Goals
Before selecting an intent data platform, define what you want to achieve:
- Are you looking to improve lead generation?
- Do you want to align marketing and sales teams with data-driven insights?
- Are you focusing on account-based marketing (ABM) strategies?
- Do you need better predictive analytics to forecast sales opportunities?
Understanding your objectives helps you choose a platform that aligns with your business needs.
2. Evaluate Data Sources and Accuracy
Not all intent data is created equal. Some platforms focus on first-party intent data, such as website visits and email engagement, while others specialize in third-party data, including research activity across the web. Consider:
- Data variety: Does the platform provide both first-party and third-party intent signals?
- Data freshness: Is the intent data updated in real-time or batch-processed on a weekly or monthly basis?
- Data accuracy: Does the platform use AI and machine learning to eliminate false positives?
- Global reach: Does the platform provide global intent signals if you operate internationally?
A platform with high-quality, real-time intent data ensures your sales and marketing teams target the right prospects at the right time.
3. Assess Integration Capabilities
An intent data platform should seamlessly integrate with your existing sales and marketing tech stack. Check for compatibility with:
- CRM Systems
- Marketing Automation Platforms
- ABM Tools
- Business Intelligence Software
Seamless integration ensures intent data flows across your organization, making it actionable for sales and marketing teams.
4. Look for Advanced Analytics and Reporting
A strong intent data platform should offer deep insights rather than just raw data. Key features to look for:
- Custom intent scoring to prioritize high-intent accounts.
- Real-time dashboards to track engagement trends.
- Multi-touch attribution to measure marketing effectiveness.
- Predictive analytics to forecast future buying behavior.
These features allow teams to make data-driven decisions and optimize outreach efforts.
5. Ensure Privacy and Compliance
With increasing data privacy regulations, it’s essential to choose a platform that follows compliance guidelines, including:
- GDPR and CCPA compliance to protect customer data.
- Transparent data sourcing to avoid unethical data collection.
- Opt-in tracking mechanisms to ensure data is collected legally.
A compliant platform minimizes legal risks and builds trust with prospects.
6. Compare Pricing and ROI Potential
Intent data platforms use different pricing models based on:
- Number of accounts monitored
- Data usage volume
- Features included (basic vs. advanced analytics)
Consider the total cost of ownership, including setup fees, training costs, and add-on charges. A platform should deliver measurable ROI, such as:
- Higher conversion rates
- Shorter sales cycles
- Better marketing efficiency
Request a trial or demo before committing to a platform to ensure it meets your needs.
7. Check Customer Support and Training Options
A reliable intent data platform should offer strong customer support and training to maximize usage. Look for:
- Dedicated account managers for onboarding and optimization.
- 24/7 support availability via chat, email, or phone.
- Training resources such as webinars, help centers, and community forums.
A well-supported platform ensures teams can quickly adopt and use intent data effectively.
Top 15 Intent Data Platforms
1. Factors.ai
Factors.ai is the best intent data platform designed to help businesses identify high-intent companies, decode customer journeys, and measure marketing ROI.
By capturing intent signals from various sources, it provides a unified view of customer engagement, enabling marketing and sales teams to build better audiences and execute intent-based campaigns.

Product Features:
- Account Identification–Matches anonymous website visitors to their companies, identifying high-intent accounts.
- Account Intelligence– Enhances firmographic and technographic data for a complete customer view.
- Customer Journey Mapping–Visualizes touchpoints across the buyer journey to optimize engagement.
- Marketing Analytics–Tracks campaign performance, content engagement, and visitor behavior.
- Workflow Automation–Automates go-to-market tasks, improving efficiency for marketing and sales teams.
- LinkedIn AdPilot–Syncs audiences with LinkedIn for precise targeting and improved ad performance.
- Multi-Touch Attribution–Identifies which marketing efforts drive conversions with AI-powered insights.
Pricing:
It has a free plan. The paid plan starts at $399 per month.
2 Cognism
With its real-time intent data, verified contact information, and AI-driven insights, Cognism enables sales and marketing teams to target the right accounts at the right time. The platform ensures compliance with GDPR and other global regulations, making it a reliable choice for businesses looking to leverage intent data for prospecting and revenue growth.

Product Features:
- Intent-Driven Lead Generation – Identify companies showing buying intent with Bombora-powered intent data.
- Real-Time Contact Data – Access verified phone numbers and emails to reach decision-makers instantly.
- AI-Powered Data Enrichment – Automatically update and enrich CRM records with fresh, accurate intent data.
- Sales Companion Extension – Find and engage with high-intent leads while browsing LinkedIn or company websites.
- Advanced Filtering & Segmentation – Prioritize prospects based on intent signals, industry, and firmographics.
Pricing:
Public pricing is not available.
3 Bombora
Bombora is a pioneer in B2B intent data, providing businesses with insights into which companies are actively researching their products or services. The platform integrates with top CRM, marketing automation, and sales intelligence tools, ensuring businesses can act on intent data seamlessly.

Product Features:
- Company Surge Intent Data – Identifies businesses researching specific topics, signaling buying intent.
- Data Cooperative Model – Gathers intent signals from a proprietary network of B2B websites.
- Customizable Topic Tracking – Monitors intent signals across more than 12,000 industry-specific topics.
- Scoring & Prioritization – Ranks accounts based on the intensity of their intent signals.
- Multi-Channel Activation – Enables targeted outreach via email, advertising, and sales engagement tools.
Pricing:
Public pricing is not disclosed.
4 Lead Forensics
Lead Forensics is an intent data platform that helps B2B businesses identify anonymous website visitors, providing actionable insights to convert them into sales opportunities. By tracking visitor behavior and uncovering company details, this software enables sales and marketing teams to engage high-intent prospects at the right time.

Product Features:
- Visitor Identification – Reveals company names, key decision-makers, and contact details of website visitors.
- Custom Alerts & Notifications – Notifies sales teams instantly when high-intent prospects visit the website.
- Advanced Filtering & Segmentation – Organizes website visitors by industry, location, and engagement patterns.
- Multi-User Access – Allows sales and marketing teams to collaborate on lead engagement strategies.
Pricing:
Public pricing is not available.
Factors is a better alternative to Lead Forensics, read the blog out to understand why.
5. Demandbase
Demandbase is a leading intent data platform designed to help B2B businesses identify, engage, and convert high-intent buyers. It enables sales and marketing teams to focus on accounts that are actively researching solutions by leveraging AI-driven account intelligence and real-time behavioral data.

Product Features:
- Multi-Source Intent Data – Aggregates first-party, third-party, and partner intent data to create a complete view of account behavior.
- Engagement-Based Account Scoring – Prioritizes accounts based on their likelihood to convert, helping sales teams focus on the right prospects.
- Cross-Channel Engagement – Enables personalized marketing and ad campaigns based on intent signals.
- Sales Intelligence & Alerts – Notifies sales teams when high-intent accounts are showing active buying interest.
Pricing:
Pricing is not available publicly.
6. ZoomInfo
ZoomInfo is a comprehensive intent data platform that provides businesses with deep insights into buyer behavior. With a vast B2B database, AI-driven insights, and seamless integrations, ZoomInfo enables organizations to prioritize high-intent accounts and accelerate conversions.

Product Features:
- Real-Time Buyer Intent Signals – Identifies prospects showing active buying interest by tracking online searches, content engagement, and firmographic data.
- AI-Powered Lead Scoring – Prioritizes accounts based on predictive analytics and behavioral insights.
- Comprehensive B2B Data – Provides access to an extensive database of company and contact-level information to refine targeting.
- Multi-Source Intent Data – Aggregates data from first-party and third-party sources for a holistic view of prospect behavior.
Pricing:
Public pricing is not available.
7. Lead Onion
Lead Onion is an AI-powered buyer intent platform designed to help B2B organizations identify and engage with in-market buyers. By consolidating 20 unique sources of buyer intent data, it provides a comprehensive view of potential customers actively researching products or services. This enables sales and marketing teams to prioritize high-intent leads and engage them ahead of competitors.

Product Features:
- Multi-Source Intent Data Aggregation: Combines first, second, and third-party intent data within a single platform, offering a holistic view of buyer behavior.
- AI-Powered Buyer Identification: Utilizes artificial intelligence to scan billions of signals, identifying in-market buyers, predicting their purchasing stages, and recommending optimal engagement strategies.
- Real-Time Data Updates: Ensures access to the most current information, allowing businesses to respond promptly to emerging opportunities.
- Advanced Segmentation and Filtering: Enables precise targeting by segmenting prospects based on various criteria, such as industry, company size, and engagement level.
Pricing:
Public pricing is not published.
8. 6Sense
6sense is another best intent data platform that empowers B2B organizations to identify and engage potential buyers demonstrating active interest. It provides actionable insights into buyer behavior, enabling sales and marketing teams to prioritize high-intent accounts and tailor their outreach effectively.

Product Features:
- Predictive Analytics: Utilizes AI-driven models to predict buying stages, assisting teams in engaging prospects at optimal times.
- Audience Building: Facilitates the creation of dynamic audiences using over 80 filters for segmentation and activation across channels.
- Advertising Integration: Enables targeted advertising campaigns across display, video, retargeting, and social platforms.
- Conversational Email: Leverages AI to craft personalized emails that qualify and convert accounts at scale.
Pricing:
It has a free plan. Paid plan pricing is not publicly disclosed.
9. DemandScience
DemandScience is a prominent intent data platform that enables B2B marketers to identify and engage with potential buyers exhibiting active interest. By leveraging advanced data analytics and artificial intelligence, it delivers actionable insights, enabling sales and marketing teams to target high-intent accounts effectively.

Product Features:
- Comprehensive Intent Data: Aggregates and analyzes buyer intent signals to reveal businesses expressing interest in specific topics, allowing for timely and targeted engagement.
- PurePredict Intent Engine: Combines intent signals from multiple sources to assess a company's likelihood to purchase, enabling precise segmentation and prioritization.
- Self-Serve Platform: Offers an intuitive interface for building campaigns, uploading creative assets, and segmenting data, simplifying campaign management.
- Targeted Email Campaigns: Enables reaching the right audience with precision-targeted email strategies, enhancing engagement rates.
Pricing:
Public pricing is not available.
10. Leadfeeder
Leadfeeder is a B2B intent data platform that specializes in identifying companies visiting your website and transforming anonymous traffic into actionable leads. By analyzing visitor behavior, this software enables sales and marketing teams to engage with potential customers demonstrating interest in their products or services.

Product Features:
- Behavioral Analytics: Tracks visitor interactions on your site, helping prioritize leads based on engagement levels.
- Lead Scoring and Filtering: Automatically scores and filters visitors using over 50 behavioral and firmographic filters to identify high-potential leads.
- Contact Information Retrieval: Provides access to a database of decision-makers, allowing users to find and connect with the right contacts within identified companies.
- Customizable Reporting: Offers tailored reports and dashboards to monitor website traffic, lead generation efforts, and sales performance.
Pricing:
It has a free version. Paid plan starts at €99 per month.
11. IntentData.io
IntentData.io is a specialized intent data platform that provides detailed, contact-level intent data, enabling businesses to identify individuals who demonstrate an active interest in products or services. This software provides precise insights, enabling sales and marketing teams to focus on high-potential leads and refine their outreach strategies.

Product Features:
- Contact-Level Intent Data: Unlike many providers that offer account-level data, IntentData.io delivers insights at the individual contact level, facilitating more personalized and effective engagement.
- GDPR Compliance: Ensures that all data collection and processing adhere to data protection regulations, maintaining high standards of privacy and security.
- Transparent Data Sourcing: Provides clear insights into data origins and collection methodologies, fostering trust and reliability in the data provided.
Pricing:
Pricing is not publicly available.
12. Datarade
Datarade is a comprehensive data marketplace platform that connects businesses with a vast network of over 2,000 data providers, facilitating the discovery and acquisition of diverse datasets, including B2B intent data.

Product Features:
- Extensive Data Provider Network: Access to a wide array of data categories such as geospatial data, commerce data, financial data, company data, and more, allows businesses to find the precise data they need.
- B2B Intent Data Sourcing: Facilitates the procurement of B2B intent data, helping marketers engage with quality leads by understanding purchasing intent through tracking company behavior and signals.
- Data Provider Comparisons: Enables users to compare different data providers, ensuring they select the most suitable sources for their specific requirements.
- Data Request Posting: Allows businesses to post specific data requests, inviting data providers to offer tailored solutions, thereby streamlining the data acquisition process.
- Marketplace for Data Providers: Offers data providers a platform to list their datasets, reaching a global audience and tapping into qualified budgets for data.
Pricing:
Public pricing is not available.
13. Lusha
Lusha is a prominent B2B sales intelligence platform that assists sales, marketing, and recruitment teams in connecting with their ideal prospects by providing accurate contact information and company details.

Product Features:
- Prospecting: Create tailored prospecting lists using advanced filters such as job title, industry, company size, and more.
- Buyer Intelligence: Target potential buyers based on intent data, identifying companies actively searching for solutions like yours.
- API Integration: Enrich data in various databases, systems, or applications seamlessly.
- Browser Extension: Access contact information directly from LinkedIn and other web pages using Lusha's Chrome extension.
- Engagement Tools: Connect with prospects directly from Lusha, utilizing AI-powered recommendations and automated outreach features.
Pricing:
It has a free plan. Paid plan starts at $14.95 per month.
14. Foundry ABM
Foundry ABM is a comprehensive B2B intent data platform that enables marketing and sales teams to effectively identify and engage with in-market buyers. By capturing and analyzing intent signals from various sources, Foundry provides actionable insights to drive revenue growth.

Product Features:
- Contact-Level Intent Data: Provides detailed insights at the individual contact level, enabling personalized engagement strategies.
- ABM Software Integration: Combines intent data with account-based marketing tools, facilitating targeted campaigns and improved conversion rates.
- Sales Acceleration Tools: Equips sales teams with the necessary data and assets within their existing CRM systems to expedite conversions.
Pricing:
Pricing is not publicly available.
15. G2
G2 is a leading B2B software review and intent data platform that helps businesses identify in-market buyers by leveraging authentic user-generated reviews and real-time intent signals. By analyzing buyer behavior across its platform, G2 provides actionable insights to sales and marketing teams, helping them engage prospects more effectively.

Product Features:
- G2 Buyer Intent Data: Tracks when businesses research software categories and vendors, providing insights into in-market buyers.
- Review-Based Intent Signals: Identifies prospects evaluating competitors or software in the same category.
- G2 Stack Integration: Offers visibility into the tech stack of potential customers, helping businesses tailor their outreach.
- Competitive Benchmarking: Provides insights into competitor positioning and customer perception.
- Audience Targeting for Ads: Enables businesses to run ad campaigns targeting specific G2 visitors with intent signals.
Pricing:
Public pricing is not available.
The Best Intent Data Platforms to Accelerate B2B Growth
Finding the right buyers at the right time is one of the biggest challenges in B2B sales. Modern B2B sales hinge on timing, relevance, precision, and intent data platforms offer all three. Instead of relying on static lead lists or generic campaigns, sales and marketing teams can now act on real-time behavioral signals from high-intent prospects. These platforms monitor online research behavior across websites, content hubs, and search activity to surface buying interest early.
Without clear intent signals, sales teams waste time on unqualified leads, and marketing efforts miss the mark. Intent data platforms solve this by identifying companies actively researching solutions like yours, allowing for precise and timely engagement.
This curated list of the top 15 intent data platforms covers both market leaders and agile newcomers. You’ll find options offering everything from advanced account identification and multi-touch attribution to CRM integrations and AI-powered lead scoring. Whether you're optimizing an ABM strategy or refining outreach cadences, these tools help shorten sales cycles and elevate targeting accuracy.
Key considerations such as pricing models, compliance standards, integration depth, and signal accuracy are broken down to support decision-making. With the right platform, your team can confidently engage buyers before the competition does—and with far more relevance.

Why did LinkedIn acquire Oribi? Top 4 Oribi Alternatives
Why did Linkedin acquire Oribi?
On March 31st 2022, Linkedin announced its acquisition of Oribi — an Israel-based marketing analytics company, for over $80 million. Oribi was a marketing analytics platform that offers seamless integration and automated event tracking for your website without the need for coding. They provide a user-friendly platform that combines several conversion rate optimization (CRO) features, including customer journey funnels and event correlations, making it easy for users to access and utilize these tools.
An agreement was reached with Oribi CEO, Iris Shoor, after several conversations about product and value alignment. Linkedin’s purchase of Oribi is part of a larger strategy to expand features across Linkedin Marketing Services (LMS). LMS includes a range of strategies, techniques and tools used to promote advertisements, profiles and other businesses on LinkedIn. This helps advertising firms and recruiters to get actionable insights into their posts and advertisements.
With this acquisition LinkedIn aims to position itself strongly in the advertising and marketing analytics domain. With a 43% growth in the marketing service revenue on yearly basis, LinkedIn wants to grab on to the momentum of the growth trajectory of the marketing revenue. It aims to provide its users with keen insights with more data analytics and attribution in order to stronghold itself as a competitor to Google Ads services.
But what are the implications of this acquisition? and how does this affect former-Oribi customers? Let’s find out.
“Understanding which channels and messages have the greatest impact on the decision to take a desired step, such as a buyer requesting a product demo or a job seeker applying to a job posting, is critical to the effectiveness of any marketing campaign. Through the integration of Oribi’s technology into our marketing solutions platform, our customers will benefit from enhanced campaign attribution to optimize the ROI of their advertising strategies” - Tomer Cohen, CPO, LinkedIn
How will Linkedin use Oribi’s technology?
As previously mentioned, Linkedin acquired Oribi with the intention of expanding its LMS portfolio with industry-leading marketing and web analytics software. In particular, Linkedin was expected to employ Oribi to improve LMS insights tag implementation, drive audience insights for retargeting and CRO, and create customer journey funnels for Linkedin campaigns. Campaign attribution and ROI reporting are other Oribi use-cases Linkedin seeks to leverage for LMS.
As part of the agreement, Linkedin opened its very first office in Tel Aviv. The majority of the Oribi team has already joined Linkedin’s LMS division as well. LinkedIn’s action also came with a series of layoffs. According to some reports, 17 Oribi employees working in customer facing verticals(sales, marketing etc) were fired post acquisition.
“Oribi’s team brings deep analytics expertise that will help us accelerate the capabilities of our attribution technology across our lines of business – from helping a marketer find better leads to a recruiter identifying the right candidates. The acquisition will expand our international presence so we can continue delivering products that meet the evolving needs of our global customers and members.” - Tomer Cohen, CPO, LinkedIn
What does Linkedin’s acquisition of Oribi mean for customer data?
A couple of things. First, any data captured following Oribi’s integration remains in the control of customers and adheres to all commitments set by Linkedin’s standard ads agreement. This means that LinkedIn will not use, edit or tarnish the data already captured by Oribi for its existing users. Second, Linkedin will not be combining legacy personal data between Oribi and Linkedin. This means that the data captured by Oribi prior to the acquisition will not be used by LinkedIn in any way, therefore, the existing customers data will not be scrutinized by LinkedIn post integration.
Finally, there are no plans for Linkedin to alter the data it currently collects from users — simply to enhance existing data using Oribi’s technology. This implies that LinkedIn will not change or update its data collection policy from its users post integration with Oribi. Therefore, LinkedIn users should not be worried about collection of additional data points to enhance Oribi’s functionality.
{{INLINE_CTA_A}}
What does Linkedin’s acquisition of Oribi mean for former Oribi users?
According to several reports, Oribi shut down services and canceled customer contracts just weeks after the agreement was reached. Based on conversations with former Oribi-users, its revealed that Oribi has offered its customers a couple of options:
- Try out Oribi/LMS’s early-stage pilot program
- Switch to an alternate marketing/web analytics solution
The problem with the first option is that as a result of Linkedin’s acquisition, the pilot program is heavily limited. Integrations with third-party ad platforms like Google and Facebook look likely to be restricted as well. Therefore, the customers will not be able to get the ultimate benefit of marketing analytics, and integration features post acquisition. Accordingly, option 2 is the popular choice. Especially since historical data will not be preserved, now seems to be the best time to switch to an alternative solution for Oribi.
Best Oribi Alternatives in 2025
Since the acquisition of Oribi by LinkedIn, significant changes have taken place. Although it was anticipated that LinkedIn would leverage Oribi's capabilities to improve its marketing analytics, many users believe that the acquisition did not turn out to be favorable for Oribi.
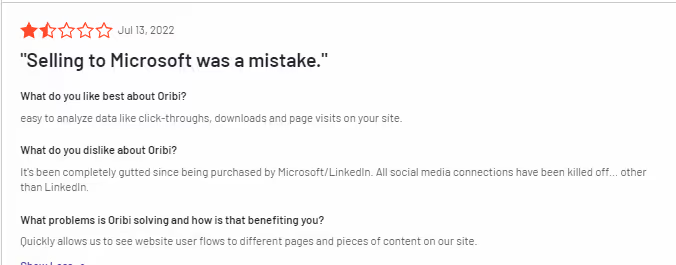
Many users were not happy with acquisition, as they anticipated a large number of Oribi features to be eliminated post acquisition. Therefore, many Oribi customers are out scouting for viable alternatives for their needs.
There are a host of platforms to consider for replacing Oribi including Factors, Heap (which is a powerful solution, but suited more for product analytics), Wicked Reports, and Plausible.
Let's compare some of the top alternatives to Oribi and see how they fare in terms of their features (pros and cons), pricing, integrations and user reviews.
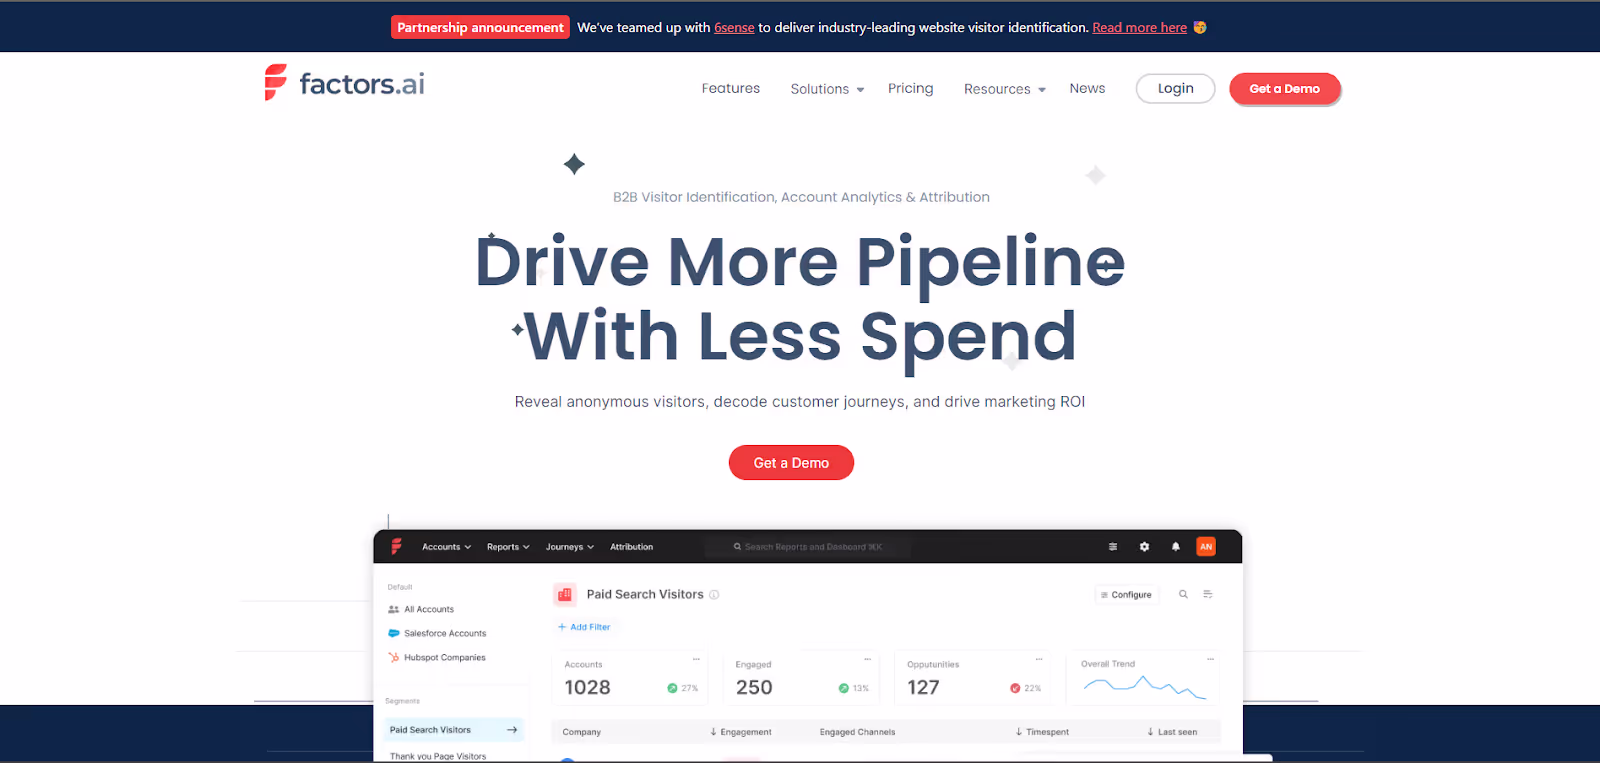
- Factors.ai
Fcators.ai is a marketing analytics tool which specializes in multi touch attribution with a focus on account based analytics and visitor identification.
Oribi does not offer the concept of dashboarding, making it difficult to group and visualize reports efficiently. Factors provides customizable dashboards where all reports are conveniently organized and displayed, simplifying the process of data grouping and visualization. It allows users to consolidate essential data in a single location, enabling easy tracking, analysis, and generation of insights to optimize marketing campaigns effectively.
Factors offers account-based analytics which includes campaign analytics, website analytics, and funnel analytics. With Factors, marketers can enhance their understanding and optimization of website conversions with automated tracking of buttons, detailed page analytics, access to unsampled data, and the ability to track custom domains. Factors provides end-to-end journey analysis with Funnels, letting the user add as many filters as they like to easily customize their data and dashboards.
What’s more is that Factors consolidates various metrics such as CPC, CTR, ROI, impressions, and more at different levels like channels, campaigns, ad groups, and keywords, enabling more detailed data-driven marketing strategies, this was not possible in Oribi.
Moreover, Oribi has limited integration with HubSpot, only allowing the push of web data into the CRM. In contrast, Factors integrates with both HubSpot and SalesForce, enabling the connection of campaign and web data with contact data, offline events, and revenue metrics from the CRM. This integration empowers comprehensive analysis and attribution throughout the customer journey.
Factors can be set up within 30 minutes and offers no-code integrations with ad platforms, CRMs, MAPs, and CDPs.
Both Oribi and Factors deliver intuitive web analytics, CRO, attribution, and funnels. On top of this, Factors also provides end-to-end customer journey mapping across campaigns, web, & CRMs. You can learn more about how Factors compares against Oribi here.
PROS:
- Unlike Oribi which only provided website attribution, Factors provide attribution at every relevant touchpoint from ads and website interaction to offline interaction using CRM integration. With customizable reports across channels, campaigns, and keywords, Factors can be moulded to any need which the user might have.
- Factors has an impeccable 64% visitor identification rate which is the highest in this category.. Along With its robust visitor identification feature complemented by multi-touch attribution, you can perform various attributions including offline touchpoints to identify the various sources from where visitors come to your website.
- Factors is now the official Marketing Partner of LinkedIn. With this collaboration, the users can get complete information about who is viewing Linkedin ads, clicking on them, and how this leads to conversions. With this partnership, users can optimize their campaigns with AI driven insights for all of their marketing efforts..
CONS:
- Factors cannot automatically send data back into Hubspot or Google Analytics like Oribi. Therefore, it may not be a good fit for you if you are looking for data orchestration rather than analytics.
- Factors does not support integration with ActiveCampaign, Mailchimp, and Klaviyo. Therefore, the user may miss out on the use cases relevant to these integrations
Integrations:
- Google Search Console
- Google Ads
- Facebook Ads
- LinkedIn Ads
- Hubspot
- Salesforce
- Clearbit
- Segment
Pricing:
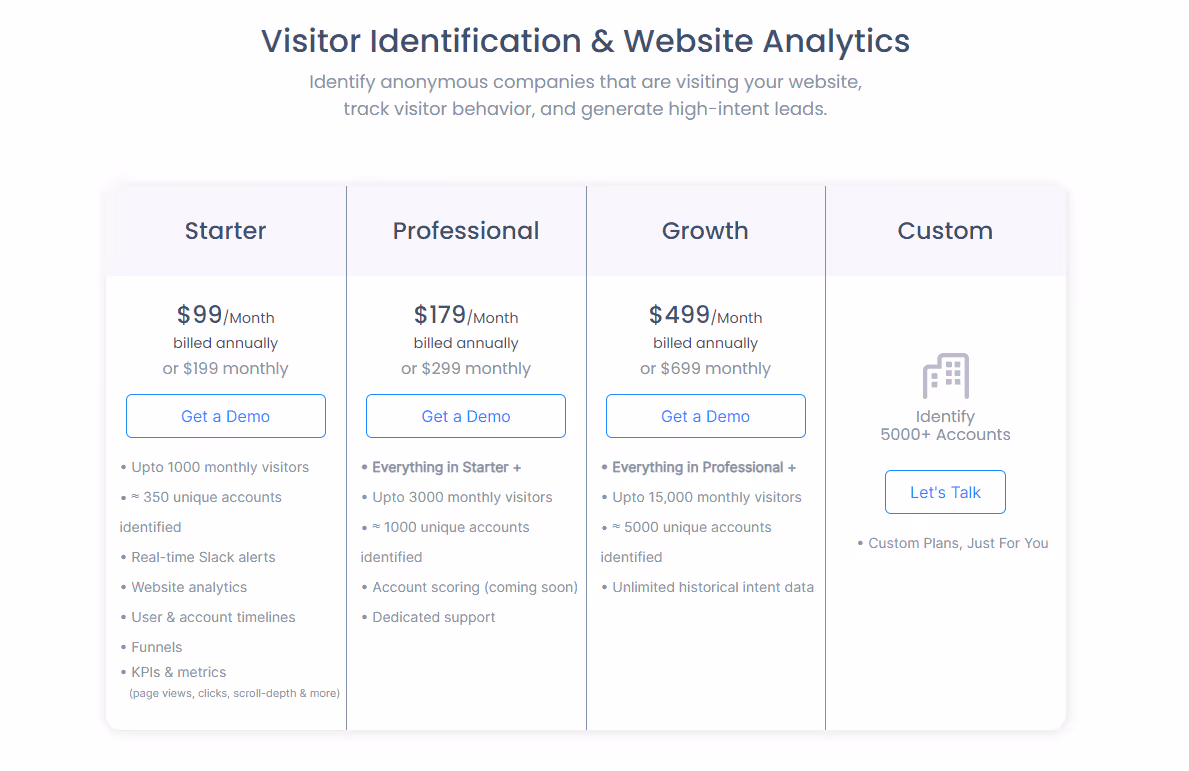
Factors offers a free 14 day trial with no credit card requirement. Visitor Identification and Website Analytics plans start at 99/month, while it has a separate pricing plan for Multi-Touch Attribution starting at $399/month.
Reviews:
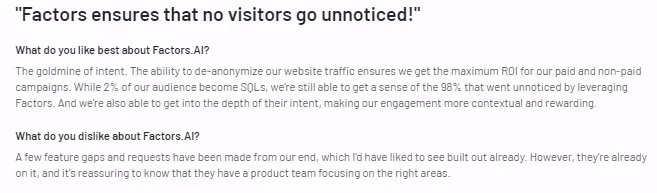
{{INLINE_CTA_A}}
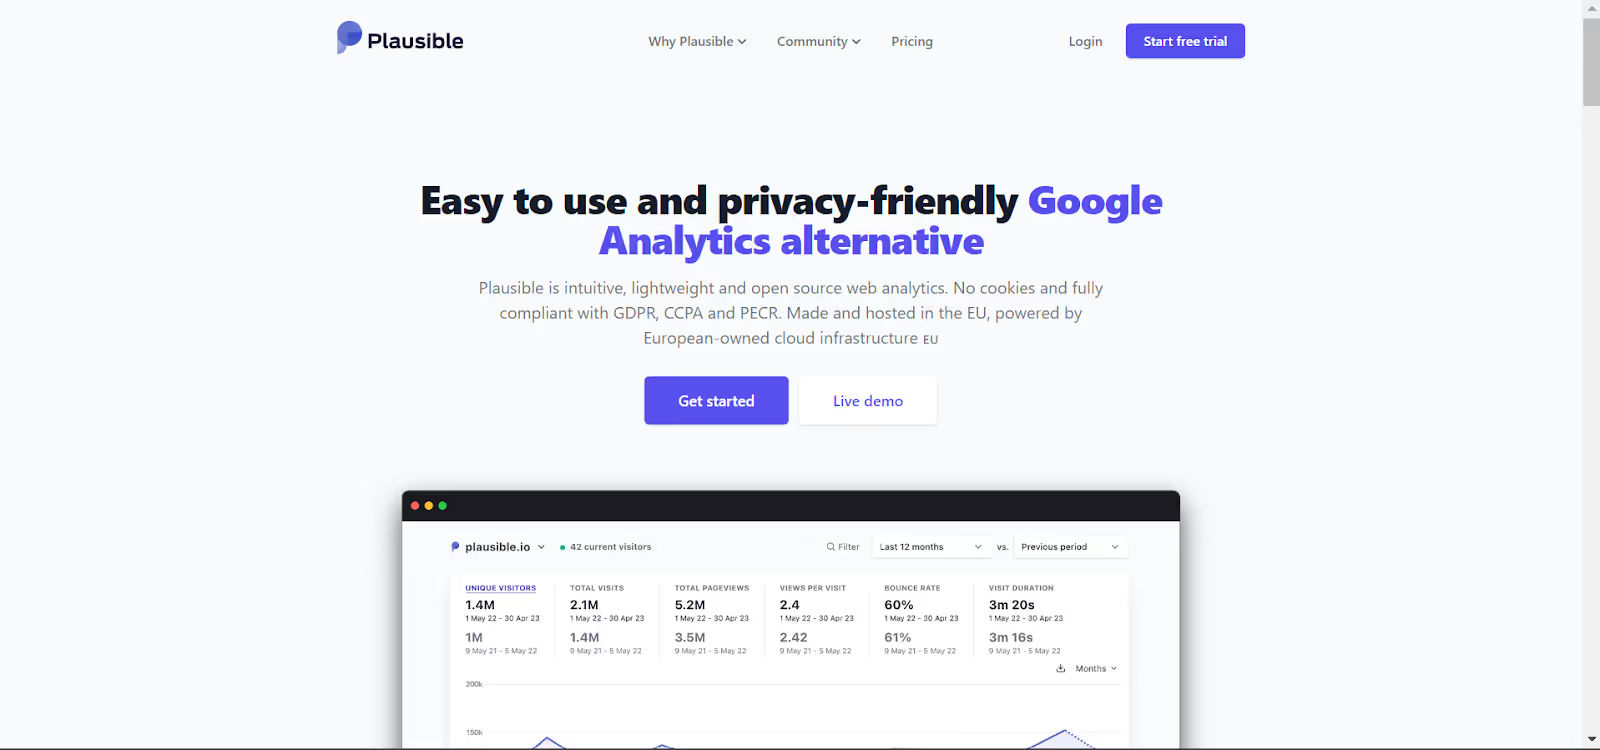
2. Plausible Analytics
Plausible Analytics is a cookieless web analytics tool designed specifically for a wide range of businesses including small and medium-sized enterprises (SMEs), startups, content creators, bloggers, and e-commerce websites.. As an open-source tool, Plausible offers a transparent and customizable solution that empowers businesses to track website performance without compromising user privacy. It offers intuitive data analytics with traffic segmentation, shareable dashboard and real time notifications. Plausible aims to provide simple web analytics at a glance without any complex layering of data with menus, and complex reports. Instead of tracking every imaginable metric, Plausible focuses only on relevant and most important data points. Like Oribi, Plausible provides intuitive data analytics features which are compressed in a 1KB script.
Plausible’s script size is smaller than 1KB, ensuring that website loading time is reduced. With a script size which is 45 times smaller than Google analytics, plausible occupies less space and gets easily installed.
PROS:
- One of the standout features of Plausible Analytics is its incredibly lightweight script, clocking in at less than 1KB. This means that implementing the tool won't slow down your website's loading time, ensuring a seamless user experience for your visitors.
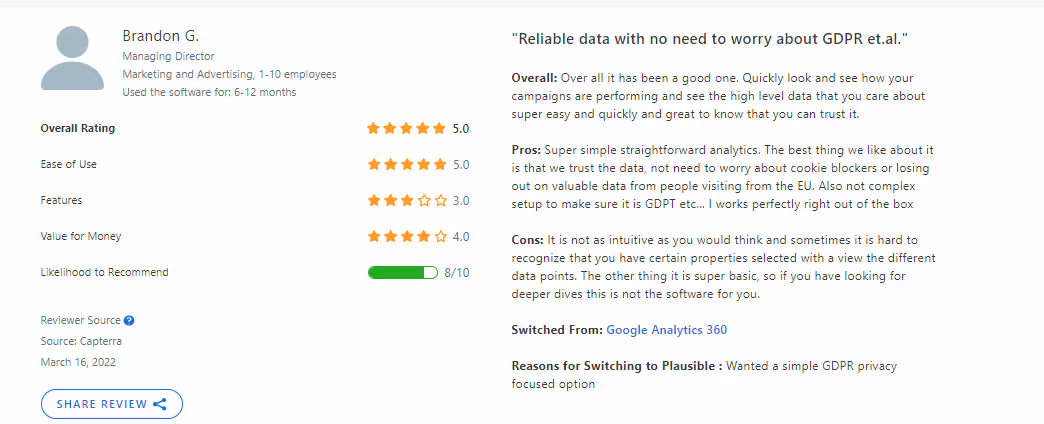
- Plausible complies with GDPR, CCPA, and PECR.. It offers real time slack and email updates which are customizable based on the user’s needs.
CONS:
- Plausible does not provide multi touch attribution but only last click attribution. This leaves you unsure of where the leads actually come from.
- Since Plausible Analytics does not collect or store personally identifiable information (PII) and avoids the use of cookies, it means they do not retain historical data beyond a 30-day period. This could pose a challenge if your tasks involve long-term data analysis or trend tracking, as the limited data retention may affect your ability to derive insights and perform comprehensive analysis
Integrations
- Bubble.io
- Carrd
- Hubspot
- Google Data Studio
- Google Search Console
- Notion
- Wordpress
Pricing
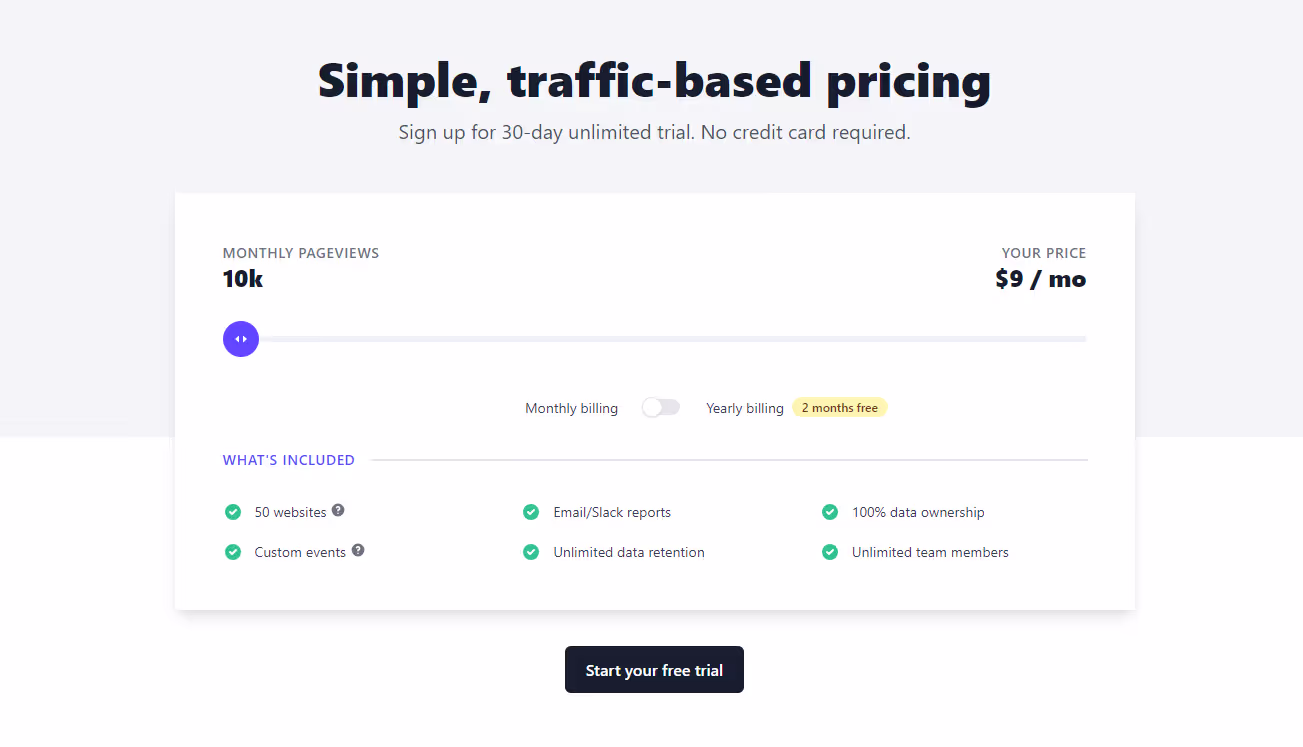
The tool provides a free trial, and the paid plans start from just $9 per month for 10K visitors. Furthermore, users can get a 2-month free subscription if they pay annually.
Reviews
- Heap
Heap is an analytics tool that automatically captures, tracks, and visualizes visitor engagement with the website to provide actionable insights. Heap collects data and collates it into easy to read graphs and funnels.Heap focuses on enhancing customer engagement and tracking their activity throughout their journey with a brand. Heap offers a diverse array of capabilities, like automatic event tracking, retroactive data capture, and real-time reporting. It empowers businesses to segment their data based on users, sessions, and events, simplifying the process of identifying trends and patterns within the data. For Oribi users, Heap could be a good fit since it provides customers with funnels, real time reporting, and a host of data visualization features.
PROS:
- Heap offrs intuitive and customizable dashboards to coordinate important metrics for the business and help drive insight driven actions. It allows businesses to segment their data by users, sessions, and events, making it easier to identify trends and patterns.
- Heap provides user segmentation, which helps categorize users based on their characteristics and behavior. This feature allows businesses to track users retroactively, gaining insights into their past interactions and activities. With user segmentation, companies can better understand their audience and tailor their strategies to meet specific user needs.
- With the user timeline feature, Heap enables marketers to see detailed user level data as to how each user interacts with the website/app. The timeline of this activity can be adjusted from the last 7 days to the date the user first interacted with the website/app.
CONS:
- Heap occupies a large amount of space due to its many features and comprehensive data storage features.. When you have a lot of data stored, it becomes more challenging to calculate the costs associated with data privacy and protection, storage and archiving, and regularly backing up the data. The complexity increases as the amount of data grows, making it important to carefully manage and allocate resources to ensure data security and accessibility.
- Heap only focuses on the website traffic, user activity on the particular site and conversions. It does not factor in the role of paid ads, organic reach on search engines and other touchpoints. Here is where a tool like Factors comes into play as it gives you a complete and in depth overview of the data attribution and visitor identification across multiple touchpoints.
Integrations:
- Shopify
- FullStory
- Clearbit
- RedShift
- Eloqua
- Hubspot
- Salesforce
Pricing
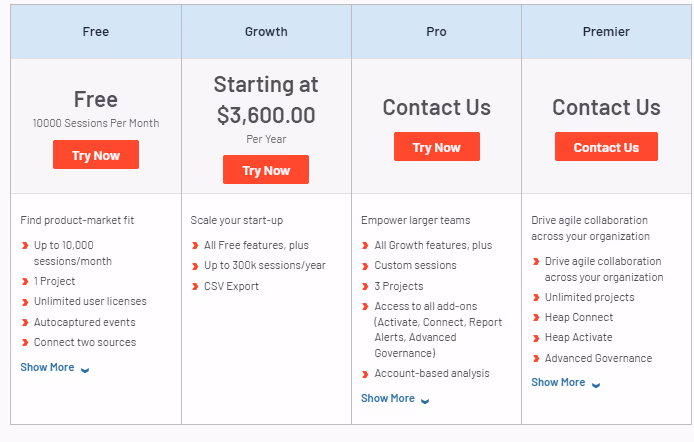
The tool provides a free trial and a free package for up to 10K monthly sessions. The growth package is priced at $3600/YEAR for 3OOk sessions per year.
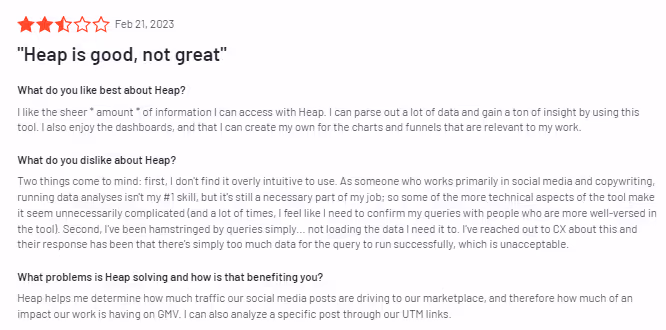
Reviews
{{INLINE_CTA_A}}
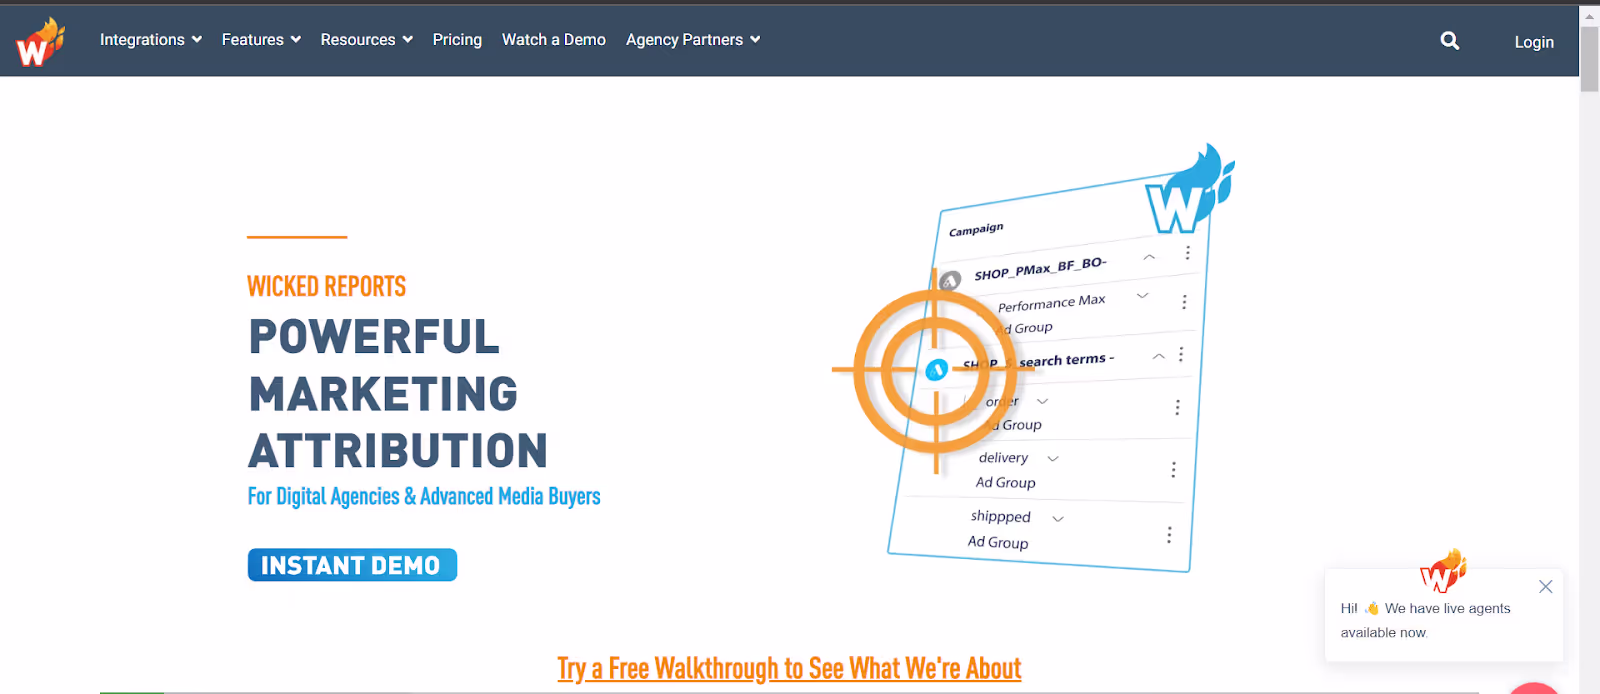
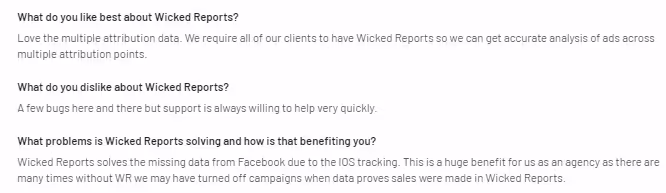
4. Wicked Reports
Wicked Reports is a marketing attribution platform with a wide assortment of campaign analytics features. Some of its unique features include the ability to include/exclude subscription revenue, distinguish new sales from recurring sales revenue, and new leads from re opt-ins.
Attribution in Wicked Reports is its standout feature, primarily used for generating ROI reports. Users can pick from various attribution models provided by this platform like, linear attribution, last click, first click attribution, full impact attribution etc. Wicked Reports also generates insights into customer lifetime value and cohort analysis.
Pro:
- Wicked Reports offers cohort analysis capabilities, allowing you to analyze the behavior and performance of specific groups of customers over time. The platform helps in the visual representation of the monetary value and ROI of the customer, illustrating their profitability and financial performance over time..
CONS:
- Wicked Reports cannot be used to visualize customer funnel journeys. This means that marketers will not be able to locate where leads are lost. Customizing and visualizing of funnels is possible with tools like Factors.ai.
- Wicked Reports primarily focuses on marketing attribution rather than web-level attribution. It specializes in attributing marketing efforts to revenue and ROI, helping marketers understand the impact of their various marketing channels and campaigns. However, when it comes to granular web-level attribution, such as tracking specific user actions on a website, Wicked Reports may not provide extensive capabilities in that area
Integration
- Hubspot
- Mail Chimps
- Shopify
- Google Ads
- Facebook Ads
- Snapchat
- Paypal
Pricing
Reviews
LinkedIn Acquires Oribi: Implications & Top Alternatives
LinkedIn’s acquisition of Oribi in March 2022 enhances its marketing solutions with better campaign attribution and ROI optimization. Former Oribi users may seek alternative analytics platforms.
1. Top Alternatives: Google Analytics, Semrush, SE Ranking, and Similarweb.
2. Key Features: Website traffic analysis, keyword research, competitive insights, and conversion tracking.
3. Strategic Benefits: Optimize marketing performance, track audience behavior, and improve SEO visibility.
These platforms offer valuable analytics solutions to replace Oribi, helping businesses refine their marketing strategies effectively.
{{INLINE_CTA_A}}
In conclusion
LinkedIn’s acquisition of Oribi came at a crucial time for the marketing analytics and attribution space. With a keen focus on positioning itself as a strong rival to Google Ads services, LinkedIn aims to utilize the marketing analytics and attribution features offered by Oribi. LinkedIn wants to focus on its campaign manager which has now become more and more relevant to analyze marketing campaigns.
That said, Oribi can definitely improve its interface and analytics capabilities especially with the continued support of Microsoft. With the acquisition now completed, LinkedIn now has in its coffers a host of features to drive its marketing analysis and attribution arm. As a result, LinkedIn will now be able to offer recruiters and advertisers complete analytics of their ads and posts fueled by AI-driven insights.
Now, more than ever, marketers feel the need and importance of monitoring their efforts and making data-driven decisions to ensure they’re getting the most bang for their buck. The role of marketing analytics will only become increasingly important as even conventionally offline events like seminars and conferences turn digital.
Although the acquisition proved fruitful for LinkedIn and its marketing analytics tool, existing customers did not like it as much. Post acquisition, Oribi shut down its customer-facing vertical, culling out numerous features and also fired customer-facing employees.The existing employees of Oribi especially the sales and marketing vertical had to bear the brunt. Additionally, the existing customers had to venture out in search of alternatives to replace Oribi, which resulted in additional costs, and wastage of time.
The search for an Oribi alternative ends here with Factors. Factors has proven to be a highly effective marketing analytics and attribution platform for B2B marketers. Try it for free or schedule a personalized demo to witness its impact on your campaigns and website conversions today!
FAQ:
- Why did LinkedIn acquire Oribi?
With Oribi’s acquisition, LinkedIn was looking forward to optimizing its marketing and advertising service. LinkedIn aimed to solidify its global presence by providing marketers and recruiters a keen insight into their campaigns. According to Tim Cohen (Chief Product Officer at LinkedIn), marketing services grew about 43% on a yearly basis, with Oribi in its coffers, LinkedIn aims to drive this growth potential and position itself as a reliable source of advertising and marketing services.
Furthermore, LinkedIn aims to position itself as a firm competitor against Google's ads and marketing service.
- What are the best Oribi alternatives?
Some of the best Oribi alternatives for 2023 are Factors.ai, Heap, Plausible Analytics,and Wicked Reports. Some other platforms to look out for are Mixpanel, Amplitude and Fullstory. Oribi carved out a strong position in this market due to its no code and easy to use market attribution feature which housed loads of CRO features. One should look out for relevant attribution services with an easy to use interface in order to match the experience of Oribi.

Top 10 Leadinfo Alternatives and Competitors in 2025 (Updated)
Leadinfo is an innovative software company specializing in B2B marketing data solutions. Utilizing advanced technology, Leadinfo excels in uncovering latent opportunities within website traffic through the analysis of sophisticated intent data.
Throughout the entire customer journey, from initial awareness to decision-making stages, Leadinfo offers in-depth insights. Businesses benefit from the ability to discern potential buyers and tailor engagements according to their preferences.
So, why look for a Leadinfo Alternative?
- Prospect Coverage Limitations:
Scenario: Leadinfo may fall short in capturing smaller prospects, impacting its effectiveness for businesses engaging with a diverse range of potential clients.
Consideration: Companies aiming for comprehensive prospect coverage may explore alternatives with a broader reach and a more inclusive approach to diverse market segments.
- Integration Challenges:
Scenario: Leadinfo's integration capabilities, especially in marketing automation, may have room for improvement, impacting the seamless execution of holistic marketing strategies.
Consideration: Businesses seeking a more integrated marketing tech stack may consider alternatives offering robust compatibility with various platforms, enhancing overall operational efficiency.
- Pricing Sensitivity:
Scenario: While Leadinfo provides a free demo, perceived costliness after the trial period may lead businesses, particularly those with budget constraints, to explore more cost-effective alternatives.
Consideration: Companies prioritizing marketing automation may explore alternatives with advanced features that seamlessly align with their marketing strategies for optimal results.
Factors to consider in the alternative
- Prospect Coverage Precision:
Evaluate the alternative's capability to comprehensively capture a diverse range of prospects, ensuring no segment is overlooked.
- Integration Flexibility:
Assess the alternative's integration capabilities, particularly with marketing automation tools, to guarantee a cohesive and integrated tech stack.
- Cost-Effectiveness:
Consider the pricing structure beyond the trial period, ensuring it aligns with the business's budget while delivering the necessary features and functionalities.
- User Identification Accuracy:
Scrutinize the alternative's precision in identifying and categorizing website visitors, aiming for higher accuracy in lead identification.
- Marketing Automation Enhancement:
Examine the alternative's capabilities in marketing automation, ensuring it meets or exceeds the desired level of functionality for streamlined and automated campaigns.
{{INLINE_CTA_A}}
Today, we’ll be comparing:
- LeadMagic
- Factors AI
- Warmly
- Leadlander
- PearlDiver
- Clearbit
- Demand
- Lead Forensics
- Dealfront (Formerly Echobot and Leadfeeder)
- Snitcher
Before we start, here’s a little about Leadinfo

Leadinfo Features
- Lead Capture Forms:
Leadinfo simplifies the creation of personalized lead generation forms, utilizing visitor information to boost positive responses and improve lead conversions.
- Browsing Activity Tracking:
By monitoring visitors' journeys on the website, Leadinfo enables sales and marketing teams to interpret visitor intent, effectively qualifying them as potential leads.
- User-Friendly Layout:
Leadinfo features an intuitive inbox-style layout, reminiscent of email interfaces, providing a clear and user-friendly overview of each website visitor. This design enhances the tool's usability, making it easily adaptable for teams.
- Seamless Integrations:
Leadinfo seamlessly integrates with over 60 platforms, including Asana, Discord, Freshworks, Insightly, HubSpot, Zoho, and Slack, offering versatile compatibility for diverse business needs.

Leadinfo Pricing
The cost of using Leadinfo is determined by the total number of monthly unique visitors to your website. Users can input their data into the pricing page to determine the corresponding cost for their specific needs.

Leadinfo Limitations
- Integrations:
There is room for improvement in integration development to enhance functionality, particularly in the implementation of marketing automation. This refinement would streamline the execution of marketing strategies for optimal results.

- Pricing
While the free demo period grants access to all features, certain functionalities are disabled upon account creation, leading to a substantial increase in payment. The perceived costliness of Leadinfo is a consideration for potential users.

- Prospect Coverage Limitations:
Leadinfo may not capture all smaller prospects or clients, potentially limiting its coverage and effectiveness for businesses engaging with a diverse range of prospects.

1. LeadMagic

LeadMagic Features:
- Visitor Identification:
The platform assists in recognizing noteworthy accounts that visit a website, ensuring timely communication to sales and marketing teams through Slack messages.
- Lead Scoring and Prioritization:
Using engagement levels as a basis, LeadMagic intelligently assesses and prioritizes leads, promoting a targeted approach to the most promising prospects.
- Lead Nurturing and Automated Workflows:
Streamline lead nurturing campaigns through the platform's automation capabilities, fostering relationships with potential clients.
- Lead Generation Services:
Benefit from customized lead generation strategies, encompassing nurturing, qualification, and strategic outreach facilitated by the platform.
- Digital Marketing Solutions:
Comprehensive digital marketing solutions covering SEO, social media marketing, and PPC advertising, ensuring optimal visibility and engagement for your brand.
- Customer Engagement Programs:
The platform covers diverse digital marketing aspects, including search engine optimization (SEO), social media engagement, and pay-per-click (PPC) advertising, ensuring optimal brand visibility.
- Strategic Consulting:
Specializing in marketing strategy development, data analytics, and insights, the platform aids in campaign performance measurement for informed decision-making.
- Technology Integration:
The platform contributes to marketing effectiveness through technology integration, ranging from marketing automation implementation to interfacing with customer data platforms.

LeadMagic Pricing:
The pricing model is determined by the monthly identification of companies, excluding ISPs and low-quality traffic. Starting at an upfront annual fee of $139, the pricing is adapted to suit various business sizes and web traffic volumes.
Pricing for Visitor Identification with LeadMagic:


LeadMagic Limitations:
- Currency Limitation:
Presently, the platform accepts payments exclusively in USD, with potential future considerations for billing in AUD.

- Interface Improvement:
Acknowledging room for improvement, the platform developers actively integrate customer feedback to enhance the interface.

2. Factors AI

Factors AI Features
- Anonymous Account Identification:
Our platform excels in identifying anonymous website traffic, offering comprehensive insights into company details, industry, location, and online behavior.
- Opportunity Generation and Audience Segmentation:
Facilitating opportunity generation and audience segmentation, our platform becomes a catalyst for refining targeting strategies, and empowering precise sales and marketing approaches.
- Seamless Integration:
Integration is achieved through direct compatibility with various marketing and sales platforms, ensuring efficient audience management and enhancing overall sales cycle efficacy.
- Automated Workflow:
Integrating audiences into marketing and sales services is streamlined, boosting marketing activities and providing a robust workflow.
- Opportunity Management and Real-Time Notifications:
Our platform offers unparalleled visibility, expediting deal tracking, identifying buying signals promptly, and notifying users in real-time when existing customers re-enter the market.

Factors AI Pricing
The Free plan, available at $0 per month and requiring no credit card, offers a perpetually free option to users. The Basic Plan, priced at $149 per month and billed annually, offers a comprehensive set of features designed to meet more advanced needs.

Factors AI Limitations
- Documentation and Tutorials:
While existing resources are available, user reviews suggest the need for more comprehensive guides. Clear and instructive documentation would empower users to maximize the potential of Factors.AI, creating a more user-friendly environment.

- User Interface and Experience:
The user interface could benefit from increased intuitiveness, clearer navigation, and visual cues, as indicated by user feedback. Enhancing the overall user experience is vital for new users to comprehend and effectively use the platform's features, contributing to a smoother onboarding process and higher satisfaction.

- Integration Options:
Currently relies on webhooks, specifically through Zapier, for integration instead of native integrations. While webhooks offer a workaround, the absence of native integrations may limit connectivity with a broader array of tools, posing a challenge for users seeking seamless integration.
{{INLINE_CTA_A}}
3. Warmly

Warmly Features
- Comprehensive Access:
Obtain access to enrichment and intent data for streamlined automation.
- Unified Buyer Experience:
Merge intent insights with immediate action for effective engagement with decision-makers.
- Autonomous Sales Orchestration:
Bridge the gap between intent signals and outreach to enhance competitiveness.
- Effortless Integration:
Seamlessly integrate Warmly with existing tools, converting high-intent website visitors into leads.
- Reveal & Enrich:
Build real-time comprehensive profiles of site visitors, linking them to opportunities.
- Orchestrated Workflows:
Trigger automated prospecting campaigns based on site activity.
- Intent-Driven Playbooks:
Integrate insights to prioritize accounts and orchestrate effective next steps.
- Convert Prospects:
Utilize AI chat for engagement, involving sales when visitors signal readiness for a conversation.
- Attribution & ROI:
Gain real-time visibility into driving ideal customer profile (ICP) traffic and understand conversion rates.
- Unified Revenue Team:
Automate handover to sales, enhance pipeline creation efficiency and align sales-marketing efforts.

Warmly Pricing:
Warmly offers a free account with access to 500 leads per month. The Business plan, starting at $805 per month, provides users with access to 25,000 leads monthly.

Warmly Limitations:
- Bot Traffic and Noise:
Recognition of the challenge of distinguishing valuable leads from bots or short-duration visitors, suggests a need for enhanced filtering.

- Limited User Identification:
Some users have pointed out limitations in identifying every user, proposing solutions such as code additions to marketing emails for improved identification.

- Filter Challenges:
Users report occasional difficulty in filters, sometimes displaying existing customers as leads, particularly in intent data.

- Reporting Features Development:
Users acknowledge ongoing development in reporting features and anticipate improved data integration into the CRM for more informed decision-making.

4. Leadlander

Leadlander Features
- Identification of Business Website Visitors:
Emphasizes the identification of corporate-based website visitors, providing valuable insights into the audience frequenting business websites.
- Verified Contact Profiles:
Furnishes verified contact profiles, encompassing details such as name, email, title, and other critical data points for employees at companies exploring your website, facilitating actionable connections.
- Analytics and Reporting Services:
Provides specific details about each website visitor, transforming anonymous visits into actionable contacts. Offers insights into customer journeys, connections to conversions, and intent data.
- Sales Platform Integration:
Effortlessly integrates with widely used platforms like Salesforce, Mailchimp, HubSpot, and Slack, streamlining the sales process for optimal effectiveness.
- Support Services:
Offers dedicated and responsive service and support to maximize the return on investment for users.
- User-Friendly Interface:
Facilitates real-time delivery of actionable data through tailored reports, alerts, and online access for convenient utilization.
- Intent and Corporate Data Access:
Supplies intent data to unveil individual prospects and their details, along with access to key contacts at prospect companies.

Leadlander Limitations:
- Integration Challenges:
Some users encounter difficulties integrating WebVisitor Insights with specific platforms, restricting the utility of collected data.
- Data Accuracy Concerns:
While providing accurate tracking data, some users express concerns about the precision of metrics, such as the count of unique visitors.
- User Interface Usability:
Users, especially those with limited technical experience, find the interface of WebVisitor Insights challenging to navigate and comprehend.
- Technical Support Quality:
Issues with the quality and availability of technical support have been reported, making it challenging to receive assistance when needed.
- Cost Considerations:
While cost-effective, some users perceive WebVisitor Insights as expensive, particularly for businesses with limited budgets.

{{INLINE_CTA_A}}
5. PearlDiver

PearlDiver Features
- Identification of Anonymous Website Visitors:
Pearl Diver excels in discerning anonymous website traffic, providing in-depth insights into company details, industry, location, and online behavior for a comprehensive understanding.
- Opportunity Generation and Audience Segmentation:
Facilitating the generation of opportunities and segmentation of audiences, Pearl Diver catalyzes refining targeting strategies and enabling precise sales and marketing approaches.
- Direct Platform Integration:
Seamless integration is achieved through compatibility with various marketing and sales platforms via Zapier. This functionality ensures efficient audience management, enhancing the overall efficacy of the sales cycle.
- Automated Workflow:
The integration of audiences into marketing and sales services is streamlined through Zapier or by exporting them to email as CSV files. This automation enhances marketing activities, providing a robust workflow.
- Opportunity Management and Real-Time Notifications:
Pearl Diver offers unparalleled visibility, expediting deal tracking, promptly identifying buying signals, and providing real-time notifications when existing customers re-enter the market. Advanced tracking capabilities contribute to proactive opportunity management.

Pearl Diver Pricing
The introductory plan for Pearl Diver starts at $387 per month. At present, the platform does not offer a free trial option.
Pearl Diver Limitations
- Restricted Geographic Coverage:
Pearl Diver currently operates exclusively within the United States, limiting data capture for businesses predominantly operating in Australia and other countries.

- Manual Data Download Process:
Daily manual downloads of data to Excel are a requirement, which may cause inconvenience. However, ongoing efforts suggest the potential introduction of an API setup to streamline this process.

- Challenges in the Onboarding Process:
Users have reported difficulties during the onboarding process, citing concerns about cleanliness. This may pose hurdles for users in the initial stages of adopting the platform.

6. Clearbit

Clearbit Features
- Clearbit's Target Accounts:
Clearbit's Target Market builder provides businesses with access to a comprehensive audience of every B2B company on the internet, extending beyond simple target account lists. This feature aids in understanding the true B2B target market.
- Intent Revelation and Pipeline Conversion:
Clearbit's solution helps identify anonymous website visitors, revealing buying intent from high-fit companies. This enables prompt action to convert intent into a pipeline, transforming website visitors into potential leads and customers.
- Access to Verified B2B Contact Database:
Offers access to a global B2B contact database with over 30 million verified contacts. This extensive database ensures broad coverage across the US, APAC, and EMEA, guaranteeing accurate B2B contact data for converting intent into a pipeline.
- Integration with HubSpot:
Integrates with HubSpot, facilitating the easy export of data to the HubSpot Customer Platform. This integration ensures instant deduplication of data, ready for campaigns, providing a streamlined prospecting experience.

Clearbit Pricing
The Free Plan, priced at $0, offers users 25 credits each month. The Growth Plan, priced between $50 and $275, offers credit tiers ranging from 125 to 1,000 credits monthly. The Enterprise Plan is customized, and organizations are encouraged to contact the sales team to discuss specific requirements and obtain tailored pricing details.

Clearbit Limitations
- Pricing:
Some users find Clearbit's pricing relatively high, posing challenges for early to mid-stage startups. Credits are quickly depleted, requiring additional purchases for more detailed information, and limiting exploration of features and data.

- Performance Issues:
Clearbit faces occasional lag or unexpected closures without prior notification, causing interruptions and inconvenience. This unpredictability affects overall reliability and user experience.

- Feature Gap vs LinkedIn Sales Navigator:
Clearbit lacks features like InMail to prospects and real-time notifications for key decision-making updates, potentially limiting functionality compared to LinkedIn Sales Navigator.
- Inability to Customize:
The dashboard needs more customization options, hindering the ability to tailor the user interface to individual preferences and suggesting room for improvement in alignment with industry standards.

7. Demand

Demand Features
- Identify Website Visitors:
With Demand, businesses can identify and engage with anonymous website visitors, enhancing lead nurturing and conversion opportunities through automated engagement on LinkedIn and via email.
- LinkedIn Automation:
Demand's advanced automation for LinkedIn streamlines outreach, personalizing messages, and facilitating demo bookings, boosting sales team productivity with AI-powered automation.
- Technology Signals Analysis:
Leveraging technology signals, Demand enables businesses to target and engage potential leads based on the technologies they use, ensuring a more targeted and personalized approach to prospect engagement.
- Automated Sentiment Analysis and Actions:
Demand's AI capabilities include automated sentiment analysis, allowing effective handling of positive, neutral, and negative responses, ensuring leads are not overlooked, and enabling CRM sync for efficient lead management.
- Social Selling Engagement:
Enabling social selling at scale, Demand facilitates lead monitoring and engagement on LinkedIn, brand building, and personalized outreach, aligning sales and marketing efforts for an accelerated sales process.
- AI-Powered Sales Assistant:
Demand's AI sales assistant, trained with a vast database, crafts personalized messages using live data, improving acceptance rates and automating personalized outreach for enhanced sales efficiency.
- Automation and Task Management:
The platform offers user-friendly automation and task management features, streamlining communication, task assignment, and project management to simplify the sales process and boost productivity.
- Comprehensive Training and Support:
Demand provides comprehensive training resources, including tutorial videos and educational content, ensuring users can maximize the platform's potential to achieve their sales and marketing goals.
Demand Pricing
Demand offers three plans, starting from $59/user/month, along with a free 7-day trial with a cancel-anytime option.

Demand Limitations
- Limited Support Responsiveness:
Support may not be readily available, with extended waiting times, and there might be instances where support tickets go unanswered.
- Support Effectiveness:
Support replies may not always be helpful, requiring extensive back-and-forth before problem resolution. Lack of responses when support lacks an answer is reported.
- Knowledge Base:
Users express a need for a more detailed knowledge base to facilitate self-help, enhancing the user experience.
- UI and Speed:
The UI is criticized for its appearance, and occasional sluggishness may impact user experience, although the overall functionality is considered good.

- Manual Tracking Process:
Users note a manual process for excluding personal emails from CRM tracking, suggesting room for improvement in automation.

{{INLINE_CTA_A}}
8. Lead Forensics

Lead Forensics Features
- Visitor Tracking:
Lead Forensics monitors and records the activities of both companies and individuals visiting a business website, providing detailed insights into their browsing behavior, viewed pages, and key contacts within visiting companies.
- Contact Information:
The platform excels in revealing contact details of website visitors, enabling businesses to initiate contact with potential leads who have shown interest in their products or services.
- Lead Scoring:
Lead Forensics utilizes an effective lead scoring system to prioritize efforts on leads with the highest likelihood of conversion based on website visitor behavior.
- Integration Capabilities:
The platform seamlessly integrates with CRM systems and marketing automation tools, streamlining lead management for both sales and marketing processes.
- Real-time Alerts:
Lead Forensics stands out by offering real-time notifications when high-potential leads are identified, enabling prompt engagement with interested prospects.
- Detailed Analytics:
Lead Forensics provides in-depth analytics and reporting, offering valuable insights into website visitor patterns and the ROI of various marketing initiatives.

Lead Forensics Pricing
While specific pricing details are not available, Lead Forensics offers two plans - Essential Plan for small to medium-sized businesses and Automate Plan for enterprise businesses.

Lead Forensics Limitations
- Unintuitive UI:
Despite being a pioneer in visitor identification software, Lead Forensics faces criticism for its unintuitive user interface, with users expressing concerns about complicated functionality in analysis, dashboards, and filters.

- Navigation Challenges Across Multiple Domains:
Navigating across multiple domains may be glitchy, occasionally requiring a complete log-out/log-in, impacting the user experience, especially when managing multiple domains.

- Pricing:
Cost may be a concern for smaller businesses, as the pricing structure may not align with budget constraints, posing a challenge for those seeking more budget-friendly options.

9. Dealfront (Formerly Echobot and Leadfeeder)

Dealfront Features
- Website Visitor Tracking:
Dealfront delivers robust website visitor tracking capabilities, providing insights into the companies and individuals visiting the website.
- Lead Scoring and Qualification:
Dealfront includes tools for lead scoring and qualification, empowering users to prioritize and qualify leads based on website behavior.
- Integration with CRM and Marketing Automation Platforms:
Offers integration with popular CRM and marketing automation platforms streamlines lead data synchronization, enhancing sales and marketing processes.
- Real-Time Lead Notifications:
Users receive real-time notifications with Dealfront when target companies or leads visit their websites, facilitating prompt and strategic follow-ups.
- Detailed Visitor Information:
Dealfront offers detailed information about website visitors, including pages visited, time spent, and available contact information.
- Custom Feeds and Filtering:
Users can create custom feeds and apply filters to segment and analyze website visitor data, simplifying the identification and targeting of ideal prospects.
- Dealfront for Agencies:
Tailored features for marketing and sales agencies empower them to provide exceptional value through enhanced lead generation and visitor tracking.

Dealfront Pricing
Dealfront offers a free plan with no time limit. The paid plan starts at € 198 per month, paid annually.

Dealfront Limitations
- LinkedIn Ads Tracking Limitation:
Inability to track companies visiting the website from LinkedIn ads, especially when individuals engage through mobile devices, preventing linkage to company IP addresses.

- Integration Errors with Microsoft CRM:
Two documented integration errors persist between Dealfront and Microsoft CRM for about a year, with no certain resolution timeline.
- Incorrect Assignment of Dealfront Visits in CRM:
Dealfront visits transfer to CRM, but the tool assigns the wrong person during the transfer, rendering the feature unusable. Changing the owner in CRM doesn't reflect in Dealfront.
- Service and Error Resolution Concerns:
Lack of resolution for reported errors and perceived non-existent service make the tool challenging to recommend. Alternative solutions are being explored.

- Manual Steps and Lack of Interface:
Dealfront Target involves manual steps due to the absence of an interface with the CRM, resulting in time loss.
- Data Timeliness and Quality Issues:
Issues with data timeliness and general data quality surrounding contacts may not always meet expectations.

{{INLINE_CTA_A}}
10. Snitcher

Snitcher Features
- Dynamic Account Identification and Monitoring:
Snitcher employs advanced identification technology to dynamically monitor anonymous website visitors in real time. This cutting-edge capability empowers effective engagement with potential leads as they navigate through online platforms.
- Lead Exploration, Assessment, and Prioritization for Sales Units:
Snitcher provides sales teams with a robust system for exploring, assessing, and prioritizing high-intent leads efficiently. The inclusion of real-time notifications ensures that sales teams stay proactive, consistently replenishing and optimizing their pipelines.
- Account-Centric Marketing Intelligence:
Centered around accounts, Snitcher delivers comprehensive insights for marketing teams aiming to engage their target audience strategically. This strategic approach enhances website personalization, refining retargeting efforts, and ultimately boosting conversion rates.
- Customizable Agency Solution:
Agencies leverage Snitcher's customizable white-label solution to gain early insights, diversify revenue streams, and access qualified leads. This strategic implementation enhances client ROI, elevating the agency's overall value proposition.
- Seamless Integration with a Vast App Ecosystem:
Snitcher seamlessly integrates with an extensive ecosystem of over 5,000 apps, augmenting campaigns and fortifying sales pipelines. This integration versatility plays a pivotal role in streamlining processes and enhancing overall workflow efficiency.
- Spotter - Real-time Identification API:
Spotter, Snitcher's Real-time Identification API, provides users with full control, enabling flexible utilization of identification data tailored to individual needs. This customizable approach ensures adaptability and seamless integration.
- Reliable Customer Support:
Benefiting from good data quality, Snitcher offers responsive customer support and regular feature updates, ensuring users receive consistent assistance and stay abreast of the latest capabilities.
- Optimize Revenue Generation Within Existing Budgets:
Snitcher empowers B2B sales and marketing teams worldwide with invaluable insights to optimize campaigns and maximize revenue generation efforts, effectively leveraging existing budgets for enhanced outcomes.

Snitcher Pricing
Snitcher offers pricing that is tailored to your needs, starting at USD 39 per month. The platform offers an estimate based on your business size and web traffic. Users can also use the 14-day free trial before getting started.

Snitcher Limitations
- Pricing Concerns
The pricing may seem a bit high for smaller organizations. Allowing subscriptions to lower plans with performance visibility would address this concern.

- Unpredictable Costs
Paying per identified visitor, with no upper limits, could lead to concerns about potentially large bills with a surge in web traffic in a given month.

- Categorization Challenges
Snitcher sometimes faces challenges categorizing businesses accurately, resulting in businesses from one industry appearing in multiple categories.

- URL and Industry Details
Under company details, sometimes the URL doesn't work due to HTTP/HTTPS issues. Improvements in this aspect, along with visible industries in company details, would enhance user experience.

Find the Right Leadinfo Alternatives
Exploring Leadinfo alternatives can help overcome limitations in prospect coverage, integration, and pricing.
1. Key Considerations: Look for solutions with better prospect identification, seamless integrations, and cost-effectiveness.
2. User Identification: Ensure accurate tracking to enhance lead insights.
3. Marketing Automation: Choose tools with advanced automation features for improved engagement.
By evaluating these factors, businesses can select the best-fit solution to optimize lead generation and drive better results.
Key Takeaways
While Leadinfo offers innovative B2B marketing data solutions, exploring alternatives reveals a diverse landscape. Platforms like Warmly, LeadMagic, Leadlander, Pearl Diver, Clearbit, Demand, Factors AI, Lead Forensics, and Dealfront present varied features, pricing models, and limitations.
Warmly excels in buyer experience, LeadMagic in visitor identification, and Leadlander in verified contact profiles. Pearl Diver focuses on discerning anonymous traffic, Clearbit on a comprehensive B2B audience, and Demand on LinkedIn automation.
Factors AI emphasizes opportunity generation, Lead Forensics offers detailed analytics, and Dealfront excels in robust website tracking. Each alternative has unique strengths and limitations, demanding careful consideration based on specific needs like pricing, integration, and user interface.
As businesses enhance B2B marketing strategies, exploring these Leadinfo alternatives allows informed decisions for improved lead identification, engagement, and overall success.
{{INLINE_CTA_A}}

Building a Sales Intelligence Tech Stack: A B2B Guide For 2025
Understanding Sales Intelligence Basics
A sales intelligence stack is a set of tools that helps sales teams gather and use data about potential customers and market opportunities. It gives insights about prospects, allowing teams to make informed decisions during the sales process.
Key parts of a sales intelligence stack include customer data platforms, intent data tools, and engagement analytics software. These tools work together to offer a full view of potential customers, their needs, and their buying habits. Good sales intelligence uses firmographic data (like company size and industry), technographic data (like technology used), and behavioral insights.
When used well, a sales intelligence stack provides clear benefits. Companies using these tools see 35% higher close rates and 45% faster sales cycles. These gains come from better targeting of prospects, more personalized outreach, and spotting buying signals early.
The benefits of a sales intelligence stack include:
- Less time spent researching each prospect
- Higher quality leads in the pipeline
- Better conversion rates at each sales stage
- More accurate sales forecasts
- Smarter use of sales resources
- Improved customer retention by finding better fits
Knowing these basics helps teams choose the right tools for their stack and use them effectively. The key is to pick tools that work well together and add unique value to your sales process.
TL;DR
- A sales intelligence tech stack boosts lead quality, conversion rates, and forecasting accuracy.
- Core tools include CRM systems, enrichment platforms, lead scoring, analytics, and communication software.
- Effective stacks require integration, automation, and regular performance reviews.
- ROI comes from shorter sales cycles, increased revenue, and reduced manual workload.
Assessing Your Current Sales Process
Before you build a sales intelligence stack, examine your current sales process to find where technology can help the most. Start by writing down your workflow from lead generation to closing deals, and note any manual tasks that slow your team.
Common issues to watch for include:
- Time spent researching prospects by hand.
- Delays in answering sales inquiries.
- Inconsistent lead qualification.
- Poor visibility into buyer interest.
- Duplicate data entry.
- Incomplete or outdated customer info.
Map your current workflows by:
- Tracking how leads move through your pipeline.
- Measuring time spent on each sales task.
- Identifying communication bottlenecks.
- Noting where deals often stall.
- Analyzing win/loss patterns.
Set clear goals for your new stack:
- Specific metrics to improve.
- Reduction in manual tasks.
- Better response times.
- Improved lead quality and conversion rates.
- Integration capabilities.
This assessment helps you choose tools that solve real problems without adding complexity. Focus on fixing the most impactful issues first, and ensure that new tools integrate well with your current systems. For example, integrating with your existing CRM systems can streamline your sales process significantly.
Essential Components of a Sales Intelligence Tech Stack
A well-organized sales intelligence stack has five key parts that boost your sales process:
- CRM Integration
- Serves as your primary data center.
- Keeps track of customer interactions and deal progress.
- It should connect easily with other tools like Salesforce, HubSpot, and Zoho.
- Data Enrichment Tools
- Update contact information automatically.
- Add company insights and firmographic data.
- Check data accuracy. Some of the tools are ZoomInfo, Clearbit, and LinkedIn Sales Navigator.
- Lead Intelligence Platforms
- Score and qualify leads.
- Track buyer intent signals.
- Watch prospect engagement. A few tools can help you with this process are 6sense, Bombora, LeadFeeder, and Factors.ai.
- Analytics and Reporting Tools
- Measure sales performance.
- Track conversion rates.
- Offer actionable insights. Tableau, InsightSquared, and Clari are some of the tools that can help you with this process.
- Communication Tools
- Support sales outreach
- Track email engagement
- Manage follow-ups using Outreach, SalesLoft, and Groove tools.
When choosing these components, focus on the following:
- Smooth integration.
- Accurate and up-to-date data.
- Easy-to-use interfaces.
- Ability to grow with your needs.
- Reliable customer support.
- Compliance with data rules.
Pick tools that work well together and avoid overlapping features. The aim is to build a simple tech stack that boosts productivity without burdening your team with too many tools. For instance, integrating workflow automations can help streamline your processes.
Building Your Sales Tech Stack Step by Step
Building a sales intelligence tech stack takes planning and careful steps. Here's how to do it:
- Establish Requirements
- List the features you need for your sales process.
- Note current issues and inefficiencies.
- Ask sales teams what they need.
- Set clear goals for the stack.
- Choose Vendors
- Research vendors for each part.
- Make a shortlist based on reviews.
- Request demos from top vendors.
- Compare prices, features, and integration.
- Plan Integration
- Map how the tools will connect.
- Check API documentation and compatibility.
- Plan data flow between systems.
- Identify possible integration challenges.
- Consider Budget
- Calculate total costs.
- Include setup and training costs.
- Plan for growth costs.
- Consider ROI timelines.
- Set Implementation Timeline
- Create a phased rollout schedule.
- Start with core systems.
- Allow time for team training.
- Set milestones for each phase.
- Include buffer time for issues.
Involve key stakeholders throughout the process and communicate progress and expectations. Start small, test well, and expand based on success and feedback. Additionally, consider how account intelligence can enhance your stack.
How To Keep Your Sales Intelligence Tech Stack Effective?
Your sales intelligence stack should grow with your business. Here's how to keep it relevant and effective:
Scalability Considerations
- Choose tools that can handle 3-5 times your current data.
- Pick vendors with clear product plans.
- Ensure pricing models allow for growth.
- Look for flexible API limits and user licenses.
Emerging Technologies
- Keep an eye on AI and machine learning.
- Stay updated on predictive analytics tools.
- Watch for new data enrichment methods.
- Track integration platform updates.
Regular Assessment Methods
- Review your stack every quarter.
- Track how often tools are used.
- Measure the ROI for each tool.
- Get feedback from sales teams.
- Monitor industry standards.
- Note any pain points and limits.
Update Strategies
- Plan clear upgrade paths for each tool.
- Set aside a budget for new features.
- Gradually replace outdated tools.
- Maintain relationships with key vendors.
- Keep documentation up to date.
- Train teams on new features.
Future-proofing is about maintaining a flexible stack that can evolve with your needs. Regular assessments and strategic updates help you avoid significant overhauls and keep your sales intelligence stack effective. Consider how intent capture can play a role in this evolution.
Integration and Workflow Optimization
Sales intelligence tools need to work together smoothly. Here's how to optimize your integration and workflows:
Tool Integration Strategies
- Use built-in integrations when you can.
- Use platforms like Zapier or Workato for custom links.
- Keep a record of all integration points and data flows.
- Test integrations well before full use.
Workflow Automation
- Automate data entry and routine tasks.
- Set triggers for important events.
- Create alert systems for key activities.
- Schedule automated reports.
- Define clear handoff points between tools.
Team Training
- Develop training materials for each role.
- Make video tutorials for common tasks.
- Hold regular training sessions.
- Assign power users as internal experts.
- Track how well the team uses the tools.
- Address any resistance to change quickly.
Performance Monitoring
- Set up dashboards for key metrics.
- Monitor system response times.
- Track how often integrations succeed.
- Look for bottlenecks in workflows.
- Measure time saved through automation.
- Have regular check-ins with team leads.
The goal is to create a smooth, efficient workflow that lets your team focus on selling, not managing tools. Regular reviews and adjustments keep your integration strategy effective and aligned with your sales goals. Utilizing account intelligence can also enhance your performance monitoring.
Measuring Success and ROI of Sales Intelligence Stack
Success in sales intelligence investment relies on clear improvements in your sales process. Here's how to track and measure your return on investment:
Key Performance Indicators
- Lead conversion rates.
- Sales cycle length.
- Deal win rates.
- Average deal size.
- Time on administrative tasks.
- Lead quality scores.
- Number of touches before conversion.
Analytics and Reporting
- Set up weekly and monthly reports.
- Track yearly performance changes.
- Monitor tool usage by teams.
- Compare performance before and after tool use.
- Generate reports on data quality.
Optimization Strategies
- Regular A/B testing of sales methods.
- Refine the lead scoring model.
- Adjust automation workflows based on results.
- Fine-tune data enrichment settings.
- Review tool use regularly.
ROI Calculation Methods
Calculate the following to check if the sales intelligence tech stack is having an efficient ROI or not.
- Cost per lead.
- Cost per customer.
- Time saved multiplied by hourly cost.
- Revenue increase from tools.
- Reduction in data entry costs.
- Customer lifetime value improvements.
- Tool cost vs. revenue generated.
Set baseline metrics before using new tools and review performance against these benchmarks regularly. This helps justify ongoing investment and finds areas for improvement. Track both numbers (like revenue) and improvements in decision-making from better data. Consider how workflow automation can contribute to your ROI.
Building a High-Impact Sales Intelligence Tech Stack for B2B Teams
A well-structured sales intelligence tech stack helps B2B sales teams streamline prospecting, improve lead quality, and boost conversion rates. Essential components include CRM integration, data enrichment tools, lead intelligence platforms, analytics, and communication tools. These systems provide actionable insights using firmographic, technographic, and behavioral data, leading to better-targeted outreach and increased sales efficiency.
Before building your stack, assess your current sales process to identify inefficiencies like manual research, slow response times, and inconsistent lead qualification. Set clear goals, select tools that integrate smoothly, and plan implementation with phased rollouts.
Keeping your tech stack effective requires regular assessments, scalability considerations, and adoption of emerging technologies like AI-driven analytics. Workflow automation, seamless integration, and structured team training enhance efficiency, reducing administrative burdens and improving sales outcomes.
Measuring success involves tracking key performance indicators (KPIs) such as conversion rates, sales cycle length, and ROI improvements. Regular optimization, A/B testing, and workflow adjustments ensure continuous performance enhancements. A well-maintained sales intelligence stack drives sustainable business growth by improving data-driven decision-making and operational efficiency.

AI-Powered Sales Intelligence: A B2B Guide For 2025
Understanding AI-Powered Sales Intelligence
Sales intelligence platforms use data analytics, machine learning, and automation to change how B2B sales teams find and close deals with customers. These systems analyze large amounts of data from company websites, social media, industry databases, and customer interactions to give useful insights to sales teams.
Modern sales intelligence tools do more than provide basic contact information. They track buying signals, watch digital behavior, and find patterns that show when someone might be ready to buy. For example, if a potential customer visits a website more often, downloads certain content, or shows interest in competitors, the system marks these as buying signals.
Sales teams using these platforms get real-time updates about prospects, such as leadership changes, funding news, technology updates, and expansion plans. This helps salespeople reach out at the right time and adjust their approach based on the prospect's situation.
The technology also removes the need for manual research. Instead of spending hours gathering information, sales representatives can quickly access detailed profiles with firmographic data, technographic details, and engagement history. This efficiency lets them focus on building relationships and closing deals, not on collecting data.
TL;DR
- AI-powered sales intelligence improves B2B sales by analyzing customer data and predicting buying signals.
- Key features include predictive lead scoring, customer behavior tracking, and real-time market insights.
- AI automates lead generation, sales forecasting, and pipeline management to optimize efficiency.
- Successful implementation requires data quality, seamless integration, user training, and ROI tracking.
Key Components of Modern Sales Intelligence
Modern sales intelligence relies on four key components that create a complete sales system:
- Data Analytics and Processing is the core. It turns raw data into useful insights. The system gathers information from CRM data, social media, website visits, and industry databases to form a full view of potential customers.
- Predictive Lead Scoring uses AI to rank prospects by their chance to convert. By looking at past data patterns, it finds which traits and actions lead to successful sales and highlights the best leads.
- Customer Behavior Analysis monitors how prospects interact with your company. It tracks email engagement, content downloads, website navigation, and social media to understand buying intent and preferences.
- Real-time Market Insights update the sales team on changes in target accounts and the industry. This includes alerts about company growth, new funding, leadership changes, or new technology. These insights help sales teams time their outreach well and tailor their approach to the prospect's current situation.
Transforming Sales Operations with AI
AI is changing how sales teams work every day in four main ways.
First, automated lead generation finds and qualifies prospects without manual effort. AI scans various data sources, identifies companies that fit the ideal customer profile, and ranks them by purchase likelihood. This saves hours once spent on research and list building.
Intelligent customer profiling automatically creates detailed buyer personas. The system analyzes past successful deals, current customer behaviors, and market signals to build accurate profiles. These profiles help sales teams understand prospects better and tailor their approach.
Sales forecasting is more accurate with AI analyzing historical performance data, current pipeline status, and market conditions. This helps teams predict quarterly results and adjust strategies early if needed. AI spots patterns humans might miss, like seasonal changes or industry trends that affect buying decisions.
Pipeline management is smoother with AI tracking deal progress and flagging risks. The system monitors prospect engagement, identifies stalled deals, and suggests next steps. It also predicts which deals are likely to close, helping sales managers focus their coaching efforts where they are needed most.
Advanced Features of Sales Intelligence Platforms
Modern sales intelligence platforms have four key features that make them valuable for sales teams. Natural Language Processing (NLP) helps these platforms understand customer conversations, emails, and support tickets. This gives sales reps insights from every customer interaction, not just the ones they record.
Machine Learning lets platforms improve over time. They learn from successful deals, failed attempts, and market changes to give better recommendations. The system gets smarter with each interaction, helping sales teams make better decisions based on past success.
CRM integration ensures that sales intelligence works smoothly with existing tools. Data moves automatically between systems, keeping customer records updated without extra work. Sales reps can access insights directly in their CRM, making it easy to use.
Customizable analytics dashboards let teams track what matters most to them. Whether it's lead conversion rates, deal speed, or customer engagement, teams can create views showing their key metrics. These dashboards update in real time, giving sales leaders the information they need to make quick decisions and adjust strategies as needed.
Implementing Sales Intelligence Solutions
Start with a strong data setup. Your system needs clean, organized data from CRM, email, call records, and social media sources. This ensures your AI tools have quality information.
Team training is key but often missed. Sales reps need to see how these tools help them sell better. Show them examples of how sales intelligence saves time and closes more deals. Begin with a small group of early adopters who can help convince others of the benefits.
When adding new tools, keep the workflow simple. Your sales intelligence solution should fit naturally with current processes. Choose platforms that connect easily with your tech stack and don't make reps switch between systems.
Measure ROI to justify the investment and find areas for improvement. Track metrics like:
- Time saved on research and data entry
- Increase in qualified leads
- Higher conversion rates
- Shorter sales cycles
- Growth in deal size
Start small, measure results, and expand based on what works. This approach helps manage costs while proving the value of sales intelligence to stakeholders.
Best Practices for Sales Intelligence
Focus on data quality first. Bad data quality leads to wrong decisions. Schedule regular data cleaning, remove duplicates, and update old information. Train your team to enter data correctly and consistently.
When handling customer data, follow privacy rules like GDPR and CCPA. Get proper consent, store data securely, and be transparent about how you use the information. Document your compliance processes and update them as laws change.
Make your AI systems learn from wins and losses. Feedback is real, so your tools get smarter. Tag successful deals and note what worked to help the system spot similar chances.
Monitor your sales intelligence tools daily. Set up alerts for unusual patterns or drops in accuracy. Track key metrics like:
- Prediction accuracy
- Data freshness
- System usage rates
- Time savings
- Lead quality scores
Keep your team informed about system performance. Share wins and address concerns quickly. When people see real benefits, they are more likely to use the tools properly and help improve them.
Future Trends in Sales Intelligence
Sales intelligence will move from looking at past data to more accurately predicting future outcomes. Systems will detect market changes and buying signals before humans can, giving sales teams an edge.
AI will start making basic decisions on its own. It will qualify leads, schedule follow-ups, and adjust prices based on current market conditions. Sales reps will focus on complex negotiations and building relationships while AI handles routine tasks.
Personalization will become very precise. Instead of grouping customers broadly, AI will create unique plans for each prospect. This includes:
- Custom pricing
- Tailored product suggestions
- Personalized timing for communication
- Individual content creation
Systems will work smoothly across all platforms and tools. Data will automatically move between CRM, email, social media, and analytics tools. This integration will provide a complete view of customer interactions and remove the need for manual data entry.
The future also includes voice-enabled sales intelligence tools. Sales reps will receive real-time coaching during calls and meetings through earpieces. AI will analyze customer tone and sentiment, offering responses and strategies instantly.
Teams that embrace these trends early will gain strong advantages in their markets.
Overcoming Implementation Challenges
Sales teams face four main challenges when using sales intelligence tools:
Data security is the biggest concern. Companies need to protect customer and sales data. To do this, they should:
- Use strong encryption.
- Conduct regular security audits.
- Set clear data policies.
- Follow industry standards.
- Train employees on security.
User adoption can slow things down. Sales reps may resist tools that change their work habits. To succeed, companies need:
- Step-by-step training
- Clear benefits shown.
- Early wins to build trust.
- Support from leaders.
- Regular feedback.
System integration can be tricky. New tools must work with current CRM systems, email, and analytics. Solutions include:
- API-first design.
- Professional integration help.
- Regular testing.
- Backup systems.
- Clear documentation.
Cost management needs careful planning. AI tools can bring returns, but the initial cost is high. Companies should:
- Start with small projects.
- Track clear results.
- Scale slowly.
- Budget for training.
- Plan for upkeep costs.
By tackling these challenges early, companies see quicker returns on their sales intelligence tools.
Measuring Success with Sales Intelligence
Companies need clear metrics to track how well their sales intelligence tools work. Here are the key areas to measure:
Key Performance Indicators (KPIs):
- Lead conversion rates.
- Sales cycle length.
- Deal win rates.
- Revenue per sales rep.
- Customer acquisition costs
ROI Tracking:
- Initial investment vs returns.
- Time saved per task.
- Cost savings from automation.
- Revenue increase.
- Customer lifetime value.
Team Performance Metrics:
- Number of qualified leads.
- Meetings scheduled.
- Response times.
- Follow-up effectiveness.
- Sales activity levels.
Customer Success Metrics:
- Customer satisfaction scores.
- Retention rates.
- Upsell/cross-sell success.
- Engagement levels.
- Net Promoter Score.
For best results, companies should:
- Set baseline measurements before implementation.
- Track metrics monthly.
- Compare results across teams.
- Adjust strategies based on data.
- Share success stories.
Regular measurement helps teams see what's working and fix what isn't. This data-driven approach ensures continuous improvement and supports further investment in sales intelligence tools.
Check out our Intent Capture and Workflow Automations pages for more insights on enhancing your sales strategies. Additionally, learn how to improve your Account Intelligence and explore our Integrations for seamless data management. If you're interested in boosting your Marketing ROI, our resources can guide you through effective strategies.
Don't forget to explore our LinkedIn AdPilot to optimize your advertising efforts!

