
Good Reads
Fix pipeline pains. Solve GTM puzzles. Read strategic brain dump.
Written for marketers who want real solutions to a leaking pipeline (and their dark circles).
Want to read more from us?


I’m looking for…
Position-Based Attribution Model: Definition and Guide
Read about what a position-based attribution model is, how it works, and how it compares to last-touch and full-funnel attribution methods in multi-channel marketing.
.avif)
TL;DR
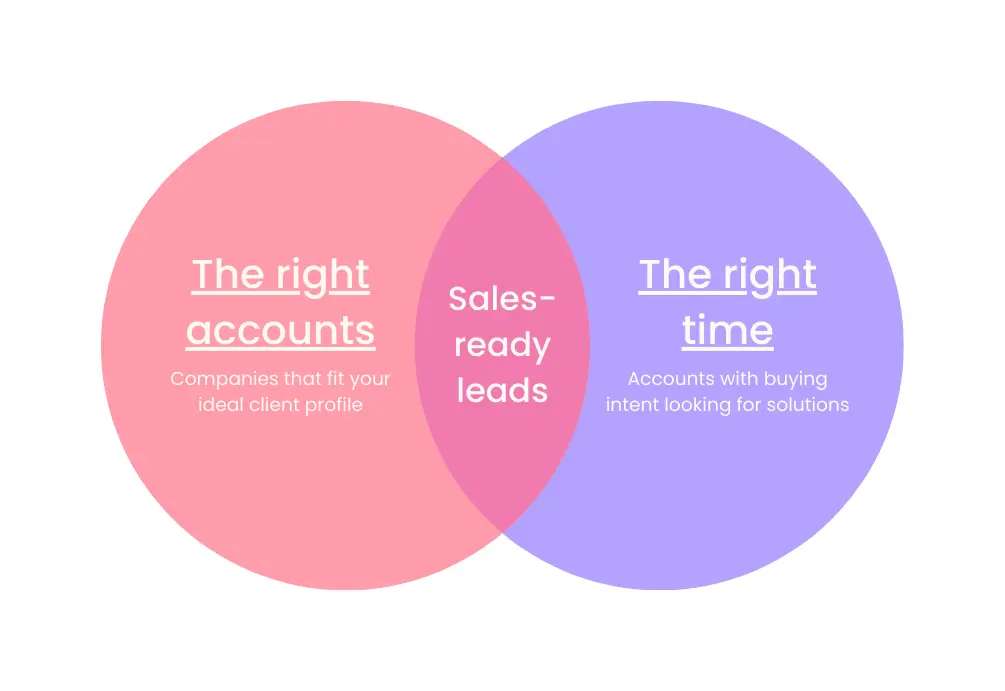
- A position-based attribution model (the U-shaped model) gives the most credit to the first touch and the last touch.
- The usual split is 40% to first touch, 40% to last touch, and 20% shared across everything in the middle.
- It’s useful when you want to understand what creates demand and what closes demand, without pretending the middle touches did nothing.
- Best for multi-channel, multi-touch journeys (hello B2B, SaaS, e-comm).
- With clean tracking and a unified view (like what Factors.ai is built for), it becomes much easier to connect “marketing activity” to actual pipeline movement.
Picture this.
You’re in a weekly growth review. Someone proudly says:
“Email is crushing it. Look, it got the conversion.”
Someone else immediately goes:
“Um, no. Paid search did. That’s literally where the lead came from.”
And then your dashboards just sit there… silently enabling chaos.
Because the customer journey didn’t happen in one heroic click. It went something like:
Google ad → random blog at 11:47 PM → “I’ll decide later” → email click → direct visit → conversion
So who gets credit?
That’s what attribution modeling is for. And if you’re tired of the “last click wins” Olympics, position-based attribution (aka the U-shaped model) is one of the most sane, balanced ways to score the journey.
What does a position-based attribution model really mean?
Position-based attribution basically says:
“Two moments matter a lot.”
- The first touch (how they discovered you)
- The last touch (what finally made them act)
Everything in the middle still matters, but it gets a smaller share.
Think of it like a movie:
- The opening scene hooks you.
- The final scene convinces you it was worth watching.
- The middle is the plot, important, but usually not the moment you remember.
That’s the “U-shape” idea: heavy weight at the start and end, lighter weight in between.
Why does attribution modeling matter?
Without attribution, you’re basically doing marketing with vibes.
You’ll see conversions happening, spend going out, traffic coming in… but you won’t know:
- What started high-quality journeys,
- What helped people stay interested,
- What actually pushed them over the line.
And when you don’t know that, you end up doing classic things like:
- Cutting top-funnel because “it doesn’t convert”
- Over-funding bottom-funnel because “it gets the last click”
- Running channels in silos, then acting shocked when the funnel feels leaky
Attribution is not just reporting. It’s how you stop making budget decisions like a roulette spin.
{{INLINE_TOFU}}
How are position-based models different from other attribution models?
Here’s the simplest way to think about it:
- First-click attribution: “Whoever introduced us gets all the credit.”
- Last-click attribution: “Whoever closed the deal gets all the credit.”
- Linear attribution: “Everyone gets equal credit, like a participation trophy.”
- Position-based attribution: “The opener and closer matter most, but the middle helped.”
Position-based is popular because it matches how most real journeys behave. People rarely convert instantly, and the “middle touches” rarely deserve equal credit either.
How do position-based attribution models work?
A position-based model distributes 100% of conversion credit like this:
- 40% to the first touch
- 40% to the last touch
- 20% split across the middle touches
Example journey:
Ad → Blog → Email → Purchase
Credit split:
- Ad (first): 40%
- Purchase driver (last touch, maybe email click): 40%
- Blog (middle): 20% (or split if there are multiple middle touches)
If there are more middle touches, they share the 20%.
So yes, the middle can end up looking “small” if your journey is long. That’s one of the trade-offs, and we’ll talk about it later.
Let’s visualize the flow…
If you plotted the journey as a timeline, the first and last touchpoints glow the brightest, and the middle touches get softer light.
That’s the U-shape.
Most analytics tools can show something like this, depending on what attribution models they support and how your tracking is set up.
Here’s why this distribution works
The logic is pretty practical:
- No first touch = no journey.
If nobody discovered you, there’s nothing to convert. - No last touch = no action
People can “like” you forever and still not buy. - The middle touches build confidence, context, and momentum, but they usually support the decision rather than trigger it.
So the U-shaped model avoids the extreme bias of first-click and last-click, without going fully “everyone is equal.”
Key benefits and strategic advantages
- Clearer view of how journeys actually happen
Instead of pretending conversions come from one channel, you see the journey as a system:
- What starts it,
- What assists it,
- What finishes it.
- Fairer credit across channels
It stops the “last touch gets all the credit” situation where your retargeting ad looks like the hero when it just arrived at the end of a story already in motion.
- Better budget decisions
You can fund both ends of the funnel without starving one side:
- Invest in what creates demand
- Double down on what converts demand
- Works well for multi-channel strategies
If your funnel includes content, paid, email, social, webinars, and sales touches, position-based attribution is a solid “default model” because it’s easy to explain and generally fair.
Practical Applications of Position-Based Attribution
- E-commerce and retail
Typical journey: Instagram ad → Google search → email discount → purchase
Last-click will worship the discount email. Position-based will show you that:
- Social created awareness
- Search reinforced intent
- Email closed
Much more useful.
- B2B and lead gen
Typical journey: LinkedIn ad → blog → webinar → demo request
Position-based helps you see which channels:
- Opened the loop (first touch)
- Closed the loop (demo request touch)
(while still acknowledging the nurture path)
- Works well with marketing automation and CRM tracking
If your tools are stitched together properly, you can connect marketing touches to pipeline events more cleanly.
This is where systems like Factors.ai tend to matter, not because “attribution is hard,” but because attribution gets messy when your journey data is split across ten dashboards and two spreadsheets named ‘final-final-v7’.
Best Practices for Implementing Position-Based Attribution
- Clean tracking or don’t bother
Attribution is only as good as your data. If your UTMs are inconsistent, channels are mis-tagged, or your CRM mapping is chaotic, the model will confidently tell you the wrong story.
Do the boring stuff:
- Consistent UTM rules
- Correct event setup
- Reliable CRM sync
- Dedupe and identity stitching (as much as possible)
- Compare models occasionally
Position-based is not “the truth.” It’s a lens.
Compare:
- First-click (who creates demand)
- Last-click (who closes demand)
- Position-based (balanced view)
When all three tell wildly different stories, that’s usually a sign your funnel has hidden complexity or tracking gaps.
- Revisit weight splits when your funnel changes
40/40/20 is common, not sacred.
If your “middle” touches are where the magic happens (webinars, product pages, comparisons), you might test a different split.
- Use it to make decisions, not just slides
If you are not changing:
- Budgets,
- Channel strategy,
- Creative,
- Nurture flows,
Then attribution is just a very expensive way to make charts.
- Make it a shared language across marketing and sales
Attribution fights happen when teams are looking at different data and arguing for different goals.
A shared model creates alignment:
- Marketing knows what is driving pipeline
- Sales sees what’s warming accounts
- Leadership gets a clearer narrative
Challenges and Limitations
- Can oversimplify messy journeys
Cross-device behavior, dark social, word-of-mouth, offline conversations, none of that shows up cleanly.
So yes, attribution will never fully capture reality. It captures the trackable part of reality.
- Vulnerable to tracking gaps
If the first touch happened on mobile and the conversion happened on desktop, your model might “lose” the start of the story.
- Undervalue crucial middle touches (sometimes)
Some funnels are won in the middle: webinars, case studies, comparison pages.
If those touches are doing real work, the 20% middle split can feel insulting.
- Tool limitations can get in the way
Some platforms have reduced support for certain rule-based models in certain contexts, so you may need custom reporting or alternative tooling depending on your setup.
- Easy to misinterpret
Attribution shows ‘what happened,’ not ‘why it happened.’ Use it alongside qualitative signals, lead quality, win-loss notes, and pipeline velocity.
So… why do marketers actually use position-based attribution?
Position-based attribution is popular for a reason. It gives you a fairer narrative than single-touch models, without requiring you to become a part-time data scientist.
It helps you answer:
- What’s creating demand?
- What’s closing demand?
- What’s supporting the journey in between?
If you pair it with clean tracking and a unified view of the customer journey, it stops being “a reporting model” and becomes something far more useful: a way to make smarter growth decisions without guessing.
FAQs for Position-Based Attribution Models
Q. Is position-based attribution suitable for all businesses?
Not always. It works best when customers take multiple touches to convert (B2B, SaaS, e-comm). If your conversions are mostly one-touch, a simpler model might be enough.
Q. Is 40/40/20 fixed, or can we change it?
You can change it. Many teams experiment based on funnel behavior, especially if mid-funnel assets do a lot of the heavy lifting.
Q. Can position-based work alongside data-driven attribution?
Yes. A common setup is: use position-based for transparency and sanity checks, then compare with data-driven for deeper insight.
Q. How does it handle anonymous visitors?
Poorly, unless you have identity resolution, strong first-party tracking, or enrichment. Anonymous sessions can break the chain and distort first-touch credit.
Q. What are the most common mistakes teams make with attribution?
Here are the most common mistakes B2B teams make with attribution:
- Messy UTMs
- Incomplete channel tracking
- Treating attribution as “truth” instead of “signal”
- Choosing one model and never revisiting it
Q. Which model is better, last-touch or position-based?
If you want simplicity, last-touch. If you want a more realistic story for multi-touch journeys, position-based is usually more useful.

Pipeline Velocity: Definition, Formula & Strategies
Learn what pipeline velocity (aka sales velocity) is, the formula to calculate it, SaaS benchmarks, and 5 proven strategies to speed up your sales pipeline in 2026.

TL;DR
- Pipeline velocity measures how fast qualified opportunities move through your sales pipeline and convert to revenue.
- Formula: (Number of Opportunities × Average Deal Size × Win Rate) ÷ Sales Cycle Length (in days).
- Why it matters: It provides a real-time, data-driven revenue forecast and uncovers pipeline bottlenecks.
- How to improve it: Increase qualified opportunities, raise deal size, boost win rates, or shorten sales cycles.
- Key benchmark: SaaS win rates typically range from 5–20%; sales cycles range from 14 days (<$2K ACV) to 9 months (>$100K ACV).
There's no doubt that B2B sales is increasingly being conducted in a methodical, scientific manner. Using a wide range of metrics and KPIs, this data-driven sales process ensures minimal revenue leakage and optimized pipeline performance. You may have heard of a few common sales metrics: customer acquisition cost, customer lifetime value, average revenue per user, etc.
This article focuses on a lesser known, yet enormously important metric to monitor & improve the overall health of sales: pipeline velocity (also known as sales velocity or sales pipeline velocity). Let's explore everything you need to know about pipeline velocity; what it is, how to calculate it, and most importantly, how to improve it.
What is pipeline velocity?
In short, pipeline velocity is the speed at which qualified opportunities move through the sales pipeline.
In other words, pipeline velocity is used to measure how quickly leads are being converted into paying customers. This helps understand the efficiency of the sales process and identify areas of improvement.
Think of a literal pipeline: if it's chock-full of debris and leaks, the flow of water will be limited and inefficient. On the other hand, if it's squeaky clean, a large volume of water can flow uninterrupted at maximum speed.

Similarly, a high-velocity sales pipeline results in a consistent, voluminous flow of leads and ultimately, revenue. You can see why it's so important to keep track of this metric.
Pipeline Velocity vs. Sales Velocity: What's the Difference?
You'll often see pipeline velocity and sales velocity used interchangeably — and in most cases, they refer to the same metric. Both measure how quickly deals move through the pipeline and generate revenue using the same formula.
However, some teams draw a subtle distinction:
- Pipeline velocity focuses on the speed of opportunities moving through pipeline stages — from qualified lead to closed-won.
- Sales velocity emphasizes the dollar value of revenue generated per unit of time (e.g., $2,000/day).
For practical purposes, you can treat them as synonyms. The important thing is to measure consistently and use the metric to identify bottlenecks and forecast revenue.
{{INLINE_TOFU}}
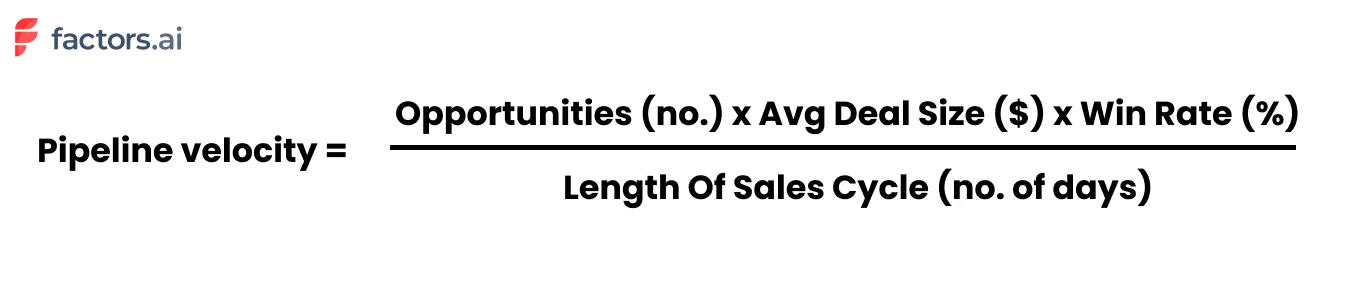
How to calculate pipeline velocity?
Pipeline velocity is calculated using 4 other metrics:
- Opportunities - how many qualified opportunities are in your pipeline?
- Deal size - what is the average contract value of deals in your pipeline?
- Win rate - what percentage of opportunities will likely convert successfully?
- Length of sales cycle - on average, how many days does it take to close a deal?
Here's the most commonly accepted pipeline velocity formula:
Pipeline velocity = (Opportunities x average deal size x average win rate) ÷ length of average sales cycle (in days)
Let's take an example. Say we have 60 qualified opportunities at various stages along the pipeline. The average deal size of these opportunities is $5000. Historically, we've observed a win rate of 20% and sales cycles of around 30 days. Accordingly, our pipeline velocity may be calculated as follows:
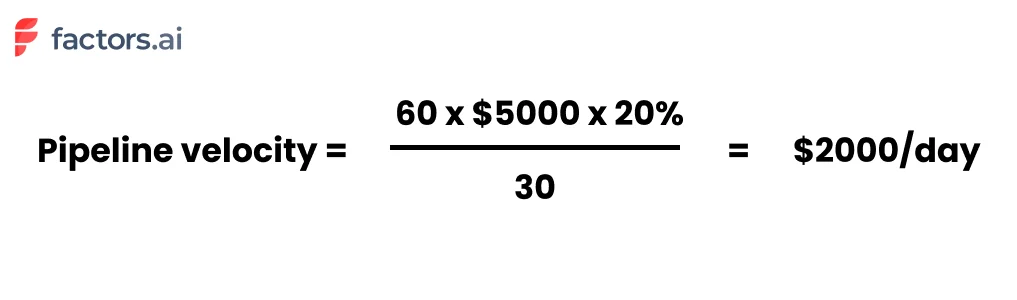
Extrapolating this, we arrive at a figure of $2000/day x 30 days for $60,000 per month.
Pipeline Velocity Calculator
Want to calculate your own pipeline velocity? Use this simple framework:
- Count your qualified opportunities — only include deals that have passed your qualification criteria (e.g., BANT or MEDDIC).
- Find your average deal size — pull this from your CRM's closed-won deals over the last 90 days.
- Calculate your win rate — divide closed-won deals by total closed deals (won + lost) over the same period.
- Measure your average sales cycle — average the number of days from opportunity creation to close for deals closed in the last 90 days.
- Apply the formula: (Opportunities × Deal Size × Win Rate) ÷ Sales Cycle Days = Your Pipeline Velocity
Example: 50 opportunities × $8,000 deal size × 15% win rate ÷ 45 days = $1,333/day (or approximately $40,000/month).
You may notice from the pipeline velocity formula that there are a few ways to improve pipeline velocity:
- Increase number of opportunities
- Increase average deal size
- Increase win rate
- Decrease length of sales cycle
Each variable is a lever that may be pulled to ramp up pipeline velocity. Of course, the most obvious way is to increase the number of opportunities/leads and deal size (easier said than done!). That being said, improving the buyer experience is a low-hanging fruit that results in dramatic improvements in win rates and quicker sales cycles.
But what makes improving the pipeline velocity so important anyway? Here are a few benefits of tracking and optimizing pipeline velocity:
Why is pipeline velocity important?
As HubSpot's director of sales, Dan Tyre, puts it:
"Sales managers live in fear that their pipeline is a bunch of fluff. In today's world of instant gratification, uncovering a sense of urgency and establishing sales pipeline velocity is important because it uncovers a slow-moving, or worse, stagnant pipeline".
1. Understand the overall health of the sales pipeline
Understanding your pipeline velocity helps keep tabs on the overall health of your sales pipeline. By knowing what works and what needs improvement, you can bring iterative, targeted changes to the sales engine. More revenue, less costs — win, win!
2. Ensure accurate sales forecasting
Measuring your pipeline velocity on a regular basis helps with accurate sales forecasting. For instance, taking the previous example, we have a pipeline velocity of $2000 per day, which can be expanded to $60,000 per month or $180,000 for the quarter. Using pipeline velocity is accurate as it's based on real-time sales data, not estimates.
3. Improve attribution & ROI
A powerful use-case is realized when pipeline velocity is used in tandem with attribution modeling. Picture this: each of your pipeline sources, broken down by qualified opportunities, deal size, win rate, and of course, pipeline velocity:
| Source | Opportunities | Avg Deal Size | Win Rate | Pipeline Velocity |
|---|---|---|---|---|
| Paid Search | 20 | $6000 | 30% | 1200 |
| Paid Social | 30 | $4000 | 10% | 400 |
| Cold Outreach | 6 | $5000 | 10% | 100 |
In combination with attribution, pipeline velocity can provide valuable insight into the most effective channels — which in turn can help guide marketing decisions and resource allocation. In this case, we see that even though paid social brings in more opportunities, it's paid search that results in the most ROI given its larger deal size and better win rate.
Sales cycle benchmarks for SaaS
Pipeline velocity itself varies significantly based on the nature and size of the company in question. Instead, here's a breakdown of the benchmark of length of sales cycles in SaaS
Length of sales cycle:
- Deals < $2000 ACV: 14 days
- Deals < $5000 ACV: 30 days
- Deals < $25,000 ACV: 90 days
- Deals < $100,000 ACV < 90-180 days
- Deals > $100,000 3 - 9 months
Depending on the nature of your business, your win rate should be anywhere from 5-20%. Of course, the number of opportunities and deal size is specific to your product, marketing & sales efforts. It wouldn't make sense to maintain or refer to benchmarks in this case.
How to Track Pipeline Velocity in SaaS
For SaaS companies, pipeline velocity is especially critical because of recurring revenue models and the compounding impact of faster deal cycles. Here's how to set up effective tracking:
1. Define Your Pipeline Stages Clearly
Map each stage from MQL → SQL → Opportunity → Proposal → Closed-Won. Ensure your CRM reflects these stages accurately so velocity calculations are meaningful.
2. Segment by Deal Size and Segment
Track velocity separately for SMB, mid-market, and enterprise deals. A $2K ACV deal closing in 14 days and a $100K deal closing in 180 days will produce very different velocity figures — combining them masks actionable insights.
3. Set Up Automated Reporting
Use your CRM (HubSpot, Salesforce, etc.) or a revenue intelligence tool like Factors to automatically calculate pipeline velocity weekly. Manual tracking introduces errors and delays.
4. Monitor Trends, Not Snapshots
A single velocity reading is just a snapshot. Track velocity weekly or monthly to spot trends — a declining velocity over 3+ weeks signals pipeline health issues that need immediate attention.
How to Identify Pipeline Bottlenecks
Before you can improve pipeline velocity, you need to diagnose where deals are getting stuck. Here are the most common pipeline bottlenecks:
- Long time-in-stage: If deals spend 2x the average time in a particular stage, that stage needs attention — whether it's slow follow-ups, missing stakeholder buy-in, or unclear next steps.
- High drop-off at specific stages: A sharp decline in conversion between stages (e.g., Demo → Proposal) indicates friction in that transition.
- Stale deals: Opportunities that haven't had activity in 14+ days are often dead weight. Regularly audit and remove or re-engage them.
- Qualification gaps: As one Reddit user noted, "Velocity slows when pipeline reflects interest rather than intent." If unqualified deals enter the pipeline, they inflate the denominator without contributing to wins.
How to improve pipeline velocity?
In short, improving pipeline velocity involves eliminating points of friction along the customer journey and aligning workflows and stakeholders to ensure smooth sailing. Here are a few tactics and strategies to do so:
Here's a quick-reference table showing the impact of improving each lever:
| Lever | Action | Example Impact |
|---|---|---|
| Opportunities | Better targeting, ABM, intent data | 60→75 opps: +25% velocity |
| Deal Size | Upselling, better packaging | $5K→$6K: +20% velocity |
| Win Rate | Sales training, qualification | 20%→25%: +25% velocity |
| Sales Cycle | Remove friction, automate follow-ups | 30→24 days: +25% velocity |
1. Make the most of existing traffic
Your website is a goldmine of hidden opportunities in the form of yet-to-be-converted accounts. Use an IP-based account intelligence tool (like Factors) to reveal anonymous accounts already engaging with your website, review pages, and ad campaigns.
Given that these accounts are already familiar with your brand, they're far more likely to convert: thereby increasing your "number of opportunities" and "win-rate".
2. Let visitors experience your work
As companies increasingly move towards product-led growth, it's becoming all the more important to show, not tell. While not all products (especially those at early stages) can adopt PLG models, it's really quite simple and effective to put up an interactive product tour on your website. This gives visitors a chance to know a little more about your work before choosing to book a demo, rather than having to go in blind.
{{CTA_BANNER}}
Again, this likely increases the number of opportunities, reduces average sales cycle length, and improves your win rate.
3. Document. Everything. Always.
There's no doubt that sales demos and discovery calls are important. But more often than not, buyers don't have the time to sit through another 30-min. Make life easier for your sales reps, CS team, and of course, the customers themselves by introducing comprehensive documentation on everything they might need to know.
Use-cases, How-tos, Implementation, etc, etc, etc should be easily accessible to anyone interested in your work — to mitigate the risk of unnecessary back-and-forth friction. This will certainly help reduce the length of the sales cycle.
4. Align relevant stakeholders
A vital, yet often overlooked step is ensuring alignment across marketing, sales, CS, and the customers. This involves timely handoffs, relevant communication, straightforward pricing and product details, and clear PoCs across every stage of the customer journey. This helps both the customer and internal departments streamline the sales process end-to-end.
5. Stay on top of data & metrics
The accuracy of your pipeline velocity metrics (and any other metric, really) relies heavily on the quality of your data. Ensure you're regularly maintaining numbers on qualified opportunities, deal size, and length of sales cycle in your CRM so the same may be leverage for pipeline velocity measurement.
What Sales Teams Actually Say About Pipeline Velocity
Pipeline velocity is widely recommended in sales literature, but what do practitioners think? Here's what real sales teams are saying:
The Good
- "Sales velocity helps forecasting in that you base it off actual historical data" — r/SalesOperations. Unlike gut-feel forecasts, velocity is grounded in real CRM data.
- Revenue leaders on LinkedIn consistently call pipeline velocity "the single metric that tells you how fast money is moving through your revenue engine."
The Challenges
- "The one thing that kills pipeline velocity is when everyone thinks they're aligned on lead definitions, but they're actually working off different criteria." — r/b2bmarketing. Marketing-sales alignment is critical.
- Data quality is the #1 blocker. If your CRM data is messy, your velocity calculation will be unreliable.
Pro Tip from the Community
Many experienced RevOps professionals recommend tracking stage-by-stage velocity rather than just overall pipeline velocity. This gives you granular insight into exactly where deals slow down — making it much easier to take targeted action.
How Factors help monitor & improve pipeline velocity
As important as it is, it can be a tedious, unintuitive chore to measure pipeline velocity — unless you have the right analytics solution, of course :)
Factors is an AI-fuelled intelligence & analytics platform that helps teams identify, score, and track accounts across the customer journey. We're talking about automated sales velocity calculations, flexible conversion funnels, IP-based account identification, multi-touch attribution, and more — everything you need to kickstart and refine your ABM process and…pipeline velocity!
Accelerate B2B Sales with Pipeline Velocity Optimization
Pipeline velocity is a crucial metric that measures how quickly qualified leads convert into customers, enabling businesses to refine their sales process.
It's calculated using four key factors:
1. Opportunities: The number of deals in your pipeline.
2. Deal Size: The average value of each deal.
3. Win Rate: The percentage of deals successfully closed.
4. Sales Cycle Length: The time it takes to close a deal.
Improving pipeline velocity enhances sales forecasting, boosts ROI, and ensures a healthy pipeline. Strategies include optimizing existing traffic, effectively showcasing products, and aligning stakeholders for smoother deal progression. AI-driven tools like Factors streamline tracking and analysis, making it easier to refine your sales process and drive faster conversions.
Frequently Asked Questions on Pipeline Velocity
Q1. What is a good pipeline velocity?
A "good" pipeline velocity depends on your industry, deal size, and sales cycle. Rather than chasing an absolute number, focus on trending your velocity upward over time. If your velocity is $2,000/day this quarter and $2,500/day next quarter, that's a 25% improvement regardless of what competitors achieve.
Q2. What is the pipeline velocity rate?
The pipeline velocity rate is the dollar amount of revenue your pipeline generates per day. It's calculated using the formula: (Number of Opportunities × Average Deal Size × Win Rate) ÷ Sales Cycle Length. For example, if you have 60 opportunities, a $5,000 average deal size, a 20% win rate, and a 30-day sales cycle, your velocity rate is $2,000/day.
Q3. How do you calculate pipeline velocity?
Pipeline velocity = (Number of qualified opportunities × Average deal size × Win rate) ÷ Average sales cycle length in days. Multiply the number of deals in your pipeline by the average deal value and your historical win rate, then divide by how many days it typically takes to close a deal.
Q4. What does sales pipeline velocity mean?
Sales pipeline velocity (also called sales velocity) measures how quickly qualified leads move through your sales pipeline and convert into paying customers. It tells you how much revenue your pipeline generates per day, helping with forecasting, resource allocation, and identifying bottlenecks.
Q5. What is deal velocity?
Deal velocity is closely related to pipeline velocity but focuses on individual deals rather than the entire pipeline. It measures how quickly a specific deal progresses from one stage to the next. Tracking deal velocity helps sales managers identify which deals are progressing normally and which are stalling.
Q6. How does pipeline velocity differ from pipeline coverage?
Pipeline velocity measures speed — how fast deals move through the pipeline. Pipeline coverage measures volume — whether you have enough pipeline to hit your quota (typically 3-4x coverage is recommended). Both are important: high coverage with low velocity means you have lots of deals but they're not closing fast enough.

Pipeline Marketing: A Complete B2B Framework for Revenue Growth
Learn how pipeline marketing aligns sales and marketing to boost B2B revenue. Discover key stages, metrics, and best practices for implementation.

TL;DR
- Pipeline marketing unites sales and marketing teams to focus on shared revenue goals. The process includes seven stages: prospecting, lead qualification, engagement, proposal, negotiation, closing, and post-sale follow-up, culminating in advocacy and referrals.
- Aligning sales and marketing (SMarketing) ensures seamless handoffs, improved communication, and higher conversion rates.
- Tracking metrics like conversion rates, deal velocity, and customer value helps identify issues and enhance performance.
- Attribution modeling reveals which marketing efforts drive pipeline success, guiding investment decisions.
B2B organizations often miss revenue targets and waste marketing dollars when marketing and sales operate in silos. Generating high volumes of unqualified leads forces sales reps to chase cold prospects, resulting in low conversion rates, unreliable forecasts, and frustrated teams.
Pipeline marketing bridges this gap by aligning marketing and sales around shared revenue goals. It ensures every lead is:
- Nurtured at each stage of the buyer’s journey
- Qualified for fit and intent before handoff
- Tracked through to closed revenue
By adopting a pipeline marketing framework, you’ll turn fragmented activities into a unified, revenue-focused engine, driving predictable growth and maximizing ROI.
In this guide, we’ll define pipeline marketing, break down its stages, and share best practices to help your team hit consistent pipeline and revenue targets.
What is Pipeline Marketing?
Pipeline marketing is a B2B strategy that directly links marketing and sales activities to revenue outcomes. Unlike traditional marketing, which often stops at lead generation, pipeline marketing follows leads through the entire sales journey, from initial contact to closed deal and beyond. The goal is to align both teams around shared objectives, with a focus on lead quality, conversion rates, and customer lifetime value.
This framework relies on three pillars:
- Collaboration: Marketing and sales work from the same playbook, using shared definitions and dashboards.
- Data-Driven Decisions: Every interaction, from email opens to demo requests, is tracked and scored, so you know exactly which accounts to prioritize.
- Continuous Improvement: Regularly review pipeline metrics, identify bottlenecks, and refine campaigns to boost velocity and win rates.
By unifying teams around a single revenue funnel, pipeline marketing eliminates gaps, improves forecasting accuracy, and turns your demand-gen efforts into a predictable growth engine.
The Pipeline Marketing Framework: Definition and Core Principles
The pipeline marketing framework connects all marketing and sales activities to business outcomes. It guides prospects through stages, from initial awareness to engagement and nurturing, and ultimately to conversion, retention, and advocacy. This framework unifies your teams under a single revenue goal, making both marketing and sales accountable for pipeline health and growth.
Key principles of Pipeline marketing include:
- Revenue-Driven Alignment (SMarketing): Promotes deep alignment between sales and marketing teams, holding both accountable for pipeline performance, not just lead generation.
- Lead Quality Over Quantity: Prioritizes generating high-fit, high-intent leads that are more likely to convert and drive revenue, rather than chasing high lead volume.
- Data-Backed Decision Making: Uses performance data to optimize every stage of the funnel, helping teams adjust messaging, targeting, and channels for better ROI.
- Closed-Loop Feedback System: Encourages ongoing communication between sales and marketing to surface insights, identify bottlenecks, and improve conversion processes in real-time.
- Customer Journey Mapping: Tracks and analyzes every buyer touchpoint, enabling more personalized engagement and enhanced pipeline visibility.
- Retention and Advocacy as Priorities: This approach extends beyond initial conversion, as pipeline marketing continues post-sale to nurture retention, upsell opportunities, and foster customer referrals.
- Foundation for Sustainable Growth: By tying marketing metrics to revenue and customer success, this framework builds a scalable, repeatable engine for long-term business growth in B2B.
{{INLINE_MOFU}}
Key Stages of the Pipeline Marketing Framework
A robust pipeline marketing framework delineates the buyer’s journey into distinct stages, guiding prospects from initial contact to loyal advocacy. It begins with:
1. Prospecting and Lead Generation
Identify and attract potential buyers through targeted outreach, SEO, content marketing, ads, and social campaigns that spark initial interest.
2. Lead Qualification
Evaluate leads based on fit and interest using criteria like budget, need, and buying timeline, ensuring sales teams prioritize the most promising opportunities.
3. Sales Engagement and Nurturing
Engage qualified leads with personalized emails, calls, demos, and content that builds trust and addresses their specific pain points and questions.
4. Proposal and Negotiation
Present tailored solutions aligned with the prospect’s needs, while addressing objections and aligning on pricing, scope, and expectations.
5. Closing the Deal
Finalize the agreement with a contract or sale, converting the lead into a paying customer and transitioning ownership to onboarding or customer success.
6. Post-Sale Follow-Up and Retention
Ensure smooth onboarding, continued support, and value delivery to keep the customer engaged and reduce churn risk.
7. Advocacy and Referrals
Turn satisfied customers into brand advocates through reviews, testimonials, referrals, and case studies to organically fuel new pipeline growth.
Each stage is crucial for maintaining a healthy, revenue-driven B2B pipeline.
Aligning Sales and Marketing: The Role of SMarketing
In many B2B organizations, sales and marketing operate in silos. This often leads to miscommunication, poor lead handoffs, and wasted resources. SMarketing solves this by aligning both teams around shared goals, messaging, and metrics. Instead of working independently, sales and marketing collaborate to define the Ideal Customer Profile (ICP) and buyer personas. This ensures both teams are targeting the same high-value prospects.
They also agree on lead qualification criteria, such as what defines a Marketing Qualified Lead (MQL) or a Sales Qualified Lead (SQL). This alignment improves lead quality and boosts conversion rates throughout the funnel. SMarketing includes co-creating content that supports each stage of the buyer journey. This ensures consistent messaging and more relevant experiences for the prospect.
Regular meetings, shared dashboards, and integrated tools like CRMs help both teams stay aligned. These practices enable transparency and foster continuous feedback. Lead handoffs become smoother, reducing lead leakage and improving follow-up speed. In the end, SMarketing turns pipeline marketing into a well-synced, revenue-generating machine.
Metrics and Performance Measurement in Pipeline Marketing
Measuring the right metrics is essential for optimizing your pipeline marketing efforts. Some metrics to keep track of are:
- Track Primary Metrics First: Start by measuring key business-impact metrics such as total revenue generated and overall pipeline value. These provide a direct view of how marketing and sales efforts contribute to growth.
- Monitor Secondary Metrics for Optimization: Keep an eye on lead-to-customer conversion rates, average deal size, and sales cycle length. These metrics help identify bottlenecks and areas where efficiency can improve.
- Analyze Tertiary Metrics for Tactical Insights: Review engagement-level data like email open rates, click-throughs, content downloads, or event attendance. These show how well individual tactics are performing.
- Measure Performance Across Pipeline Stages: Track how leads progress from awareness to conversion. This stage-wise visibility ensures that only high-quality prospects progress efficiently through the pipeline.
- Use CRM Tools and Dashboards: Leverage platforms like Factors.ai to visualize data in real time. This supports quick decision-making and ongoing strategy refinement.
- Conduct Regular Reviews with Both Teams: Meet consistently with marketing and sales to review KPIs, identify misalignment, and adjust campaigns or processes as needed.
- Focus on Metrics that Drive Revenue: Don’t get distracted by vanity metrics. Prioritize insights that directly impact pipeline velocity, conversion, and ROI to make your pipeline marketing truly effective.
By focusing on the right metrics, you can enhance your pipeline marketing and achieve consistent revenue growth.
Attribution Modeling: Understanding What Drives a Better Pipeline
Attribution modeling is a vital component of pipeline marketing, as it helps pinpoint which marketing activities contribute most to moving leads through the sales funnel. In B2B, the buyer journey is rarely linear. Prospects typically engage with multiple touchpoints, such as webinars, paid ads, content downloads, emails, and sales calls, before converting. Attribution models assign value to each of these interactions to clarify which channels and tactics are actually driving results.
There are several standard models: a first-touch model gives full credit to the initial interaction that brought in the lead, a last-touch model credits the final action before conversion, and multi-touch models (such as linear or time-decay) assign partial credit across all significant touchpoints. By analyzing these models, marketers can make data-backed decisions about where to invest budget, which campaigns to optimize, and how to align sales and marketing efforts more effectively.
Attribution modeling not only improves ROI tracking but also enhances strategic planning by spotlighting the touchpoints that accelerate deals. It ensures your team is doubling down on what works and reducing waste on what doesn’t.
Challenges to Implement Pipeline Marketing and How to Overcome Them
Implementing pipeline marketing in B2B settings presents challenges. Some major issues are:
- Sales and Marketing Misalignment: When sales and marketing teams aren’t aligned, it leads to inconsistent messaging and missed opportunities. Solve this with regular cross-functional meetings, shared goals, and mutual accountability.
- Poor Lead Qualification: Wasting time on unqualified leads drains resources. Use clear lead scoring criteria based on data and behavior to prioritize prospects more effectively.
- Limited Pipeline Visibility: Outdated tools and manual processes hinder visibility into pipeline progress. Invest in integrated CRM and analytics platforms to track pipeline stages in real time.
- Bottlenecks in Proposal and Negotiation Stages: Deals often stall during these phases. Monitor pipeline data regularly to identify delays promptly and implement process improvements or support tools to expedite decision-making.
- Neglecting Post-Sale Engagement: Without proper follow-up, even closed deals can turn into lost clients. Establish structured onboarding, check-ins, and opportunities for upselling and cross-selling to maintain strong relationships.
- Data Silos and Fragmentation: When data is scattered across platforms, it prevents a unified view of the customer journey. Integrate data sources and create centralized dashboards for consistent performance tracking.
- Inconsistent Measurement and Feedback Loops: Without regular reviews, performance issues go undetected. Set up recurring pipeline reviews with sales and marketing teams to assess progress, adjust strategies, and optimize touchpoints.
By addressing these challenges, you can maintain a strong and effective pipeline marketing system.
Best Practices for Building and Managing Your Pipeline Marketing Framework
To establish a robust pipeline marketing framework, implement the following best strategies:
- Align Sales and Marketing Teams: Establish shared revenue goals and ensure ongoing communication between both teams to support collaboration and accountability throughout the pipeline.
- Define Clear Pipeline Stages: Break down your pipeline into distinct stages (e.g., lead, MQL, SQL, opportunity, closed-won) and set clear criteria for moving leads through each phase.
- Implement Lead Scoring: Utilize behavioral and demographic data to rank prospects based on their conversion likelihood, allowing your team to focus efforts on the most sales-ready leads.
- Adopt a Powerful CRM System: Choose a CRM that offers real-time analytics, reporting, and easy integration with marketing tools to monitor pipeline activity and performance.
- Maintain Pipeline Hygiene: Routinely audit your pipeline to remove outdated or inactive leads, ensuring that your sales team works with a clean, relevant list of prospects.
- Train Teams and Iterate Processes: Educate both marketing and sales teams on the pipeline framework and use their feedback to refine workflows and remove friction points.
- Nurture and Engage Continuously: Deliver personalized, timely content across the buyer’s journey, including post-sale touchpoints to drive customer retention, loyalty, and referrals.
These practices will help you create an effective pipeline marketing system that delivers results.
Final Thoughts: Pipeline Marketing for Sustainable B2B Growth
A well-structured pipeline marketing plan is vital for B2B companies to boost revenue and enhance collaboration between sales and marketing. By defining each step, from prospecting to advocacy, you ensure every lead is nurtured and guided through the buying process. Align your teams with shared goals, leverage data insights, and refine your methods to identify issues, shorten sales cycles, and increase conversions.
By focusing on both acquiring and retaining customers and employing robust attribution models, you can enhance your marketing return and build lasting customer relationships. Mastering pipeline marketing enables your business to convert more leads into loyal customers, supporting steady growth in today’s competitive B2B environment.

Identify & Target High-Intent Accounts With Webhooks & Pipedrive
This guide explores how to identify and convert high-intent accounts with the combined powers of Factors’ account identification and Pipedrive webhooks.
Target the right accounts, at the right time with intent-based outreach
B2B sales teams spend a lot of time and effort reaching out to cold prospects only to achieve disappointing results. In fact, even successful benchmarks tag the average cold-call response rate at just 2%.
And honestly, It’s not difficult to see why.
While it’s simple enough to find lists of companies and contacts that fit your ideal client profile, it’s a monumental challenge to convince prospects to consider your solution when they’re not in the market for one.
So what’s the alternative to reaching out to the right accounts at the wrong time?
Reaching out to the right accounts at the right time of course! Or more specifically, it’s intent-based outreach based on the goldmine of anonymous, sales-ready companies already visiting your website.
The following guide explores how to identify and target sales-ready accounts with the combined powers of Factors’ account identification and Pipedrive webhooks. We first discuss how this integration works, before delving into a handful of use-cases.
How It Works: Pushing data back into Pipedrive
Factors taps into industry-leading IP-lookup technology to identify up to 64% of anonymous website traffic at an account-level — without the need for form submissions. This includes company names as well as firmographics such as geography, industry, employee headcount, revenue range and more.
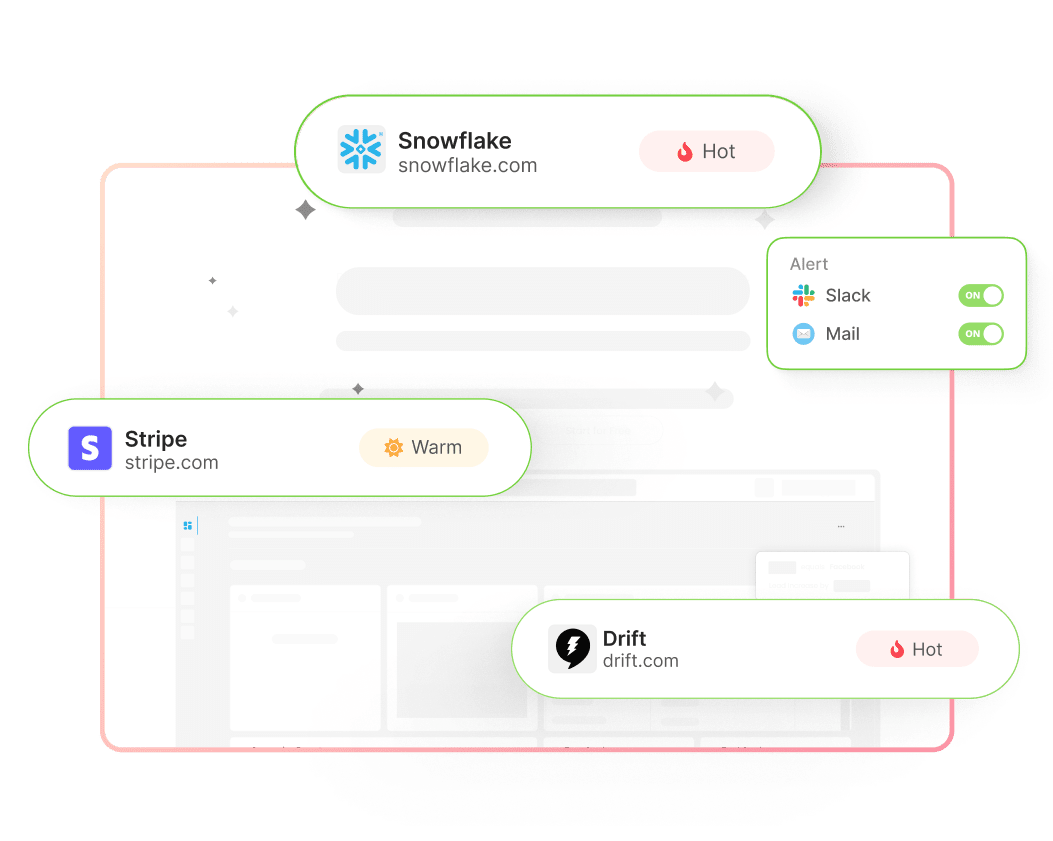
In addition, Factors auto-tracks account-level website activity, engagement, and intent with advanced analytics. This includes page views, button clicks, scroll-depth, account timelines, funnels and more.
With this information, users can filter the total set of anonymous website visitors down to ICP accounts that have expressed buying intent:
- ICP criteria: Filter down traffic based on firmographics such as industry, headcount and revenue-range to identify accounts that fit your ideal client profile.
- Intent criteria: Filter down traffic based on intent signals such as high-intent page views such as pricing, time-spent on page, and percentage scroll-depth to identify sales-ready buyers.
In short, access a list of high-intent ICP accounts that are already visiting your website but are yet to submit a form or sign-up.
Now, with webhooks and Zapier, it’s easier than ever to automatically push all this identification data from Factors into any other tool your team uses. This includes ad platforms, marketing automation platforms, and, in this case, Pipedrive CRM.
How will this help? Rather than going after cold leads with negligible chances of conversion, sales reps can view, segment, and target sales-ready accounts inside Pipedrive. As we’ll see in the next section, this dramatically simplifies and improves targeted sales outreach.
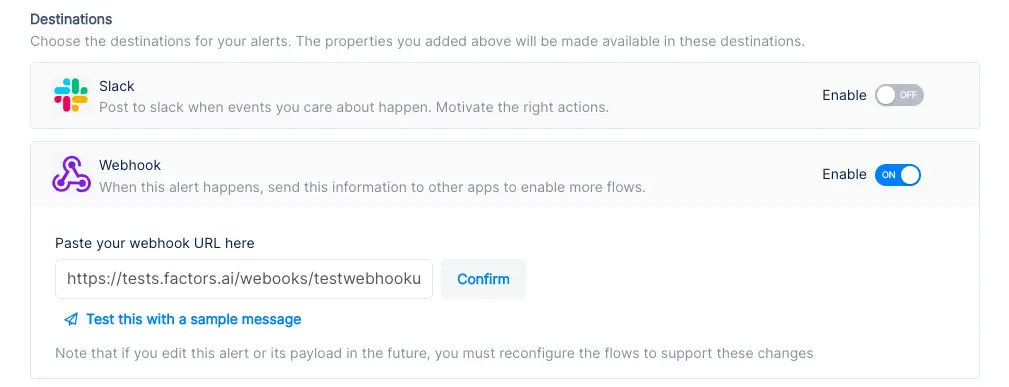
Implementing Webhooks on Factors is easy as pie. See how here.
{{INLINE_TOFU}}
Use-cases: Making the most of your website traffic
1. Identify new business opportunities
Factors surfaces anonymous, high-intent companies visiting your website. As previously discussed, this data can be filtered down to high-fit, high-intent accounts.
Using webhooks, this data can be pushed from Factors into Pipedrive. In other words, you can automatically create organizations inside Pipedrive for visitors that match your ICP and intent criteria.
For example, webhooks can be configured to create a new company when a visitor from a US-based software company with at least 250 employees is live on your website.
Here are a few more examples of what you can see inside your CRM with Factors:
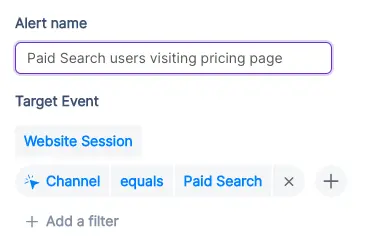
- Accounts that visit a landing page through a search ad but fail to submit a form
- Software companies with at least 500 employees visiting high-intent pages like pricing
- US-based companies that have read through at least half a product comparison blog
Rather than relying on the 5% of website traffic that submits a form, teams can identify and target a deep new pool of potential pipeline — all within Pipedrive. What’s more? Alerts can be relayed to sales reps in real-time through Slack or MS teams so they can immediately reach out to live prospects.
2. Stay on top of existing target accounts
In addition to recording new accounts visiting your website, Factors can be used to monitor and update data for target accounts that already exist within Pipedrive.
For example, say an account clicks on a search ad, submits a demo form, but never schedules time on your calendar. While the account's data is available in Pipedrive, it can be tedious to track and update their actions post the demo form submission.
To solve for this, Factors can automatically update CRM properties based on trigger criterias when account return to your website. Let’s say that the same account is back reading a product alternatives blog or visiting the pricing page after a couple of weeks. This event can be updated within Pipedrive, including their last active time.
Sales reps can be notified with real-time when high-intent events take place so as to be able to immediately reach out to accounts and improve the odds of conversion.
3. Accelerate deals with behavioral data
Certain marketing material may or may not be relevant depending on the audience in question. For example, an enterprise-level account may be especially interested in security compliance related content. An early-stage start-up, on the other hand, may find content around cost-effective pricing more appealing.
Factors can track how various types of companies are interacting with your website to understand what target accounts care about most. This data can be pushed back into Pipedrive so sales reps can easily assess a prospect’s interactions, priorities and pain-points before jumping into a sales call.
For one, sales reps can accelerate deals by personalizing the customer experience. For another, marketing teams can gauge what resonates best with the target audience and finetune content efforts accordingly.
4. Rekindle lost opportunities
Use Factors to track how prospects who have dropped off the funnel or former customers are returning to engage with your website. For instance, maybe a client who churned a couple of quarters ago is back interacting with a page that highlights a new feature release.
This may be an intent-signal that the account is reconsidering your product. It might be a good idea for sales reps to reach out and share some relevant information on what’s new. Of course, this doesn’t necessarily guarantee a conversion. But it’s far more effective than reaching out to an ice cold prospect.
This guide has covered a handful of ways in which pushing visitor data back into Pipedrive can be helpful. Ultimately, the goal is to align account data with relevant stakeholders and technologies in order to:
- Drive intent-based sales outreach
- Refine ABM efforts and spends
- Optimize retargeting campaigns
There are countless other use-cases with account identification working in conjunction with CRMs, MAPs, and more. With webhooks, Factors can push valuable website account data to nearly any platform on the planet. How you make the most of that data is really up to you — the possibilities are endless.

Organic SEO Agency: Services, Strategy, and How to Choose the Right Partner for B2B Growth
Learn how B2B brands can drive pipeline growth with the right organic SEO agency. Read about key services, strategy alignment tips, and partner evaluation criteria.
TL;DR
- Organic SEO for B2B is about influencing pipeline across the buyer journey. Buyers show up at different stages, and SEO supports those moments quietly and consistently.
- Strong organic SEO agencies build systems that compound over time. This includes technical foundations, deep content, smart internal linking, and continuous optimization rather than one-off tasks.
- SEO measurement needs to move past raw traffic. The real signals are ICP-fit engagement, topic-level performance, and how organic search supports revenue across multiple touchpoints.
- Choosing the right partner comes down to clarity and credibility. Look for operational transparency, strategic alignment, and real experience with complex B2B buying journeys.
If you run a B2B company, you’ve probably had this exact moment:
The traffic chart is up and to the right. Someone drops a “🚀” in Slack. And then a very calm, solemn voice from leadership asks:
“Cool… but did this make us any money?”
Translation:
“Is SEO actually driving revenue, or is it just the business equivalent of a participation trophy?”
That question is exactly why choosing the right organic SEO agency matters more than ever.
Look… we all know that SEO is NOT about flexing rankings in a deck like it’s 2016. It lives at the intersection of how buyers actually research, how demand gets created, and how long B2B sales cycles really take (read: longer than a Succession episode, shorter than an entire season).
This really loooong blog breaks down what an organic SEO agency actually does, how organic SEO works in a B2B context, how to evaluate SEO services without getting sold a golden dream, and how to measure results (in a way leadership doesn’t side-eye).
What is an organic SEO agency?
Let’s start with this (^) basiiiic question… the one everyone asks but rarely gets a straight answer to.
At its simplest, an organic SEO agency helps your business show up in search results without paying for every click. Say goodbye to ads and bidding wars. It’s just your website appearing when the right people are actively looking for answers, solutions, or vendors like you.
Now, if you’ve ever typed something like what is an SEO company or SEO company meaning into Google, you were probably trying to figure out one thing:
“Is this actually useful for my business, or just another buzzy buzzword?”
Good question.
Here’s what an organic SEO agency actually does…
An organic search engine optimization company focuses on helping your website earn visibility, not rent it.
That usually means working across four big areas:
- Making your site search-friendly
So search engines can crawl it, understand it, and rank it properly. - Matching real search intent
Creating pages that answer what your buyers are actually searching for, not what a keyword tool says looks ‘good’. - Structuring content clearly
Pages that are easy to read, easy to navigate, and easy for search engines to interpret. - Building long-term trust
Through depth, consistency, and authority, not hacks or shortcuts.
The end goal is not ‘more traffic’ in isolation. It is the right traffic, showing up at the right moments.
And what do SEO services really mean?
When someone asks this question, they are usually expecting a checklist, but it’s really just about building a system that works over time.
Today, SEO services typically cover:
- Technical site health
- Content relevance and depth
- Page structure and internal linking
- Search intent alignment
- Ongoing optimization and measurement
A good organic SEO agency is not a one-time fixer. It is a long-term growth partner that helps your site stay discoverable as search behavior, algorithms, and competition evolve.
So, how is organic SEO different from paid growth?
Here’s where most confusion creeps in.
Organic SEO is about earning attention over time. Paid ads are about buying attention instantly.
An organic SEO agency does not manage ad budgets, bid on keywords, or promise immediate spikes. Instead, it improves how your site performs in search results, in the long-term.
That is why SEO feels slow at first, but impactful later. Once it starts working, it keeps working, even when you are not actively spending.
| Organic SEO agency vs Search Engine Marketing (SEM) agency |
|---|
| The names are similar, but the scope is different. An organic SEO agency focuses only on unpaid search growth. While an SEM agency often bundles SEO with paid search, CRO, or broader marketing and SEO services. This distinction matters A LOT because speed, effort, and measurement/ metrics differ significantly for both. |
How Organic SEO Works for B2B Companies
If you’ve worked in B2B long enough, you already know this:
People don’t wake up, Google a product, and book a demo five minutes later.
B2B deals rarely close in a single session. Buyers read, leave, share links internally, come back weeks later, and repeat the process (and this goes on for months).
And that’s exactly why organic SEO works so well for B2B (when it’s done right). B2B buyers use search long before they are ready to talk to sales.
They search when:
- Something feels broken in their process
- A stakeholder asks an unexpected question
- A tool stops scaling
- A budget conversation is coming up
- All of the above
The three search stages that matter in B2B
Understanding these three search stages is key to knowing how SEO drives value.
- Problem-aware searches
These are early, exploratory searches. Buyers are trying to name or understand a challenge. They are not looking for vendors yet. - Solution-aware searches
The buyer is now evaluating approaches, frameworks, or tool categories. They are comparing ways to solve the problem. - Vendor-aware searches
This is where brand names, comparisons, alternatives, and pricing-related queries show up.
Strong organic SEO strategies cover all three stages. Weak ones obsess only over the last (and that’s why they fail).
How does SEO fit into these loooong B2B buying cycles
Organic SEO supports it by:
- Giving buyers something useful at each stage of the buyer journey
- Building familiarity before a sales conversation begins
- Creating multiple touchpoints across the journey
By the time someone fills out a form, they have often interacted with your content more than once... SEO helps make those interactions happen naturally.
Now, let’s look at SEO as a pipeline influence channel
Here’s where many teams misunderstand SEO.
Organic search may not always ‘convert’ in a visible way. Instead, it:
- Improves lead quality
- Shortens sales cycles
- Increases confidence during buying decisions
- Supports deals that close later
For B2B companies, organic SEO is all about consistent pipeline influence.
When done well, it becomes one of the most reliable sources that bring in educated, high-intent buyers over time.
SEO Agencies… What are their core organic SEO services?
Now… this is usually where things get fuzzy.
You ask an agency what their organic SEO services include, and suddenly you are staring at a 40-item list that sounds impressive but explains nothing.
So… let’s slow it down and break this into real, understandable pieces.
These are the core services most quality SEO services are built on, especially for B2B companies.
- Technical site audit and optimization
This is the foundation. If this is weak, everything else is likely to fall apart.
Technical SEO focuses on whether search engines can access, understand, and trust your site. This includes:
- Crawling and indexing issues
- Page speed and performance
- Mobile usability
- Core Web Vitals
- URL structure and site architecture
- Schema and structured data
You rarely see technical SEO working, but when it’s broken… you’ll know (because you’ll see your growth stall).
- Keyword research and intent clustering
Modern SEO does not chase single keywords anymore.
Instead, organic search agencies group related searches into intent-based clusters. These clusters reflect how buyers actually think and search.
This approach helps:
- Build topical depth
- Avoid thin or repetitive content
- Capture multiple variations of buyer intent
For B2B, clustering is especially important because searches are nuanced and rarely transactional on the first visit.
- Topical authority building
Topical authority is about depth (not only volume)... think thought leadership?!
Instead of publishing disconnected blogs, organic SEO agencies build interconnected content around specific themes that matter to your buyers.
This signals two things:
- To search engines: your site understands this topic deeply
- To buyers: your brand knows what it’s talking about
Authority compounds over time, which is why SEO rewards consistency.
- Long-form content creation
B2B buyers don’t just skim, smile and throw a ton of dollars at you. They read, compare, and validate.
Long-form content supports this behavior by:
- Answering complex questions fully
- Supporting internal stakeholder discussions
- Reducing friction in later sales conversations
This includes guides, comparisons, frameworks, and educational resources designed for decision-makers.
- On-page optimization and internal linking
On-page SEO ensures that:
- Pages are structured logically
- Headings guide the reader
- Internal links connect related ideas
- Important pages receive enough visibility
Good internal linking also helps search engines understand which pages matter most.
- SERP experience optimization
Organic SEO services now include optimizing for (hey, AI!):
- Featured snippets
- FAQ results
- Rich snippets
- AI-friendly formatting
The goal is visibility and clarity before someone even clicks.
- Organic search engine optimization management
If I had a dollar for everytime I said this to someone… let me just say I would be sipping on piña coladas in Hawaii (and not writing this 3500-word blog).
SEO is NOT a one-time setup.
Algorithms shift. Competitors publish. Buyer language evolves. Boom… everything’s changed suddenly.
Ongoing SEO management includes:
- Updating existing content
- Monitoring performance trends
- Improving pages that plateau
- Expanding into new topic areas
- Reporting and performance tracking
At this stage, reporting typically focuses on:
- Traffic quality
- Engagement patterns
- Content performance by topic
Revenue and attribution come later, and we’ll cover that in depth in a separate section.
- Organic SEO consultant vs full-service agency
An organic SEO consultant is usually best for:
- Strategy
- Audits
- One-time guidance
A full-service organic SEO agency handles execution, content production, optimization, and ongoing management.
Both have their place. And the right choice depends on internal bandwidth and growth goals.
{{INLINE_MOFU}}
Organic SEO Agency vs Paid Search Agency
At some point in my life, I’ve heard almost every B2B team asks this question:
“Should we invest more in SEO, or just put the money into ads?”
It’s a fair question. And the honest answer is rarely one or the other.
Look, paid search is immediate. You turn it on, traffic appears. You turn it off, traffic disappears. Paid also gives you control. You can test messaging quickly, scale spend, and target very specific queries.
Organic SEO takes longer to show results, but once it gains traction, it keeps working in the background. Pages continue to rank, content continues to attract buyers, and visibility does not vanish the moment budgets pause. Organic SEO gives you compounding value. Each piece of content builds on the last. Authority strengthens. Marginal cost decreases over time.
For B2B companies with long sales cycles, this compounding effect matters.
PS: This difference is why SEO often feels frustrating early and invaluable later.
Organic SEO Agency vs Paid Search Agency
| Aspect | Organic SEO Agency | Paid Search Agency |
|---|---|---|
| Time to impact | Slower to show results initially | Immediate traffic once campaigns go live |
| Longevity of results | Continues delivering value over time | Traffic stops as soon as spend stops |
| Cost structure | Upfront investment with decreasing marginal cost | Ongoing spend required to maintain results |
| Control and flexibility | Limited short-term control over rankings | High control over targeting, messaging, and budgets |
| Scalability | Scales through content and authority over time | Scales primarily by increasing spend |
| Compounding effect | Strong compounding returns as authority builds | No compounding; performance resets when spend pauses |
| Best suited for | Long-term growth and sustained demand capture | Short-term campaigns and immediate demand capture |
| Impact on B2B sales cycles | Supports long, research-heavy buying journeys | Captures active, high-intent demand quickly |
| Budget dependency | Less dependent on continuous spend once established | Highly dependent on continuous budget allocation |
Here’s why B2B teams eventually (could) need both
Organic SEO and paid search serve different jobs.
Paid search is great for:
- New product launches
- Short-term campaigns
- Testing positioning
- Capturing immediate demand
Organic SEO is better for:
- Sustained demand capture
- Educating buyers early
- Supporting long research cycles
- Reducing long-term acquisition costs
This is why many teams look for agencies that understand both channels, even if execution is split across partners.
| Where organic SEO agencies fit best |
|---|
| An organic SEO agency shines when the goal is: • Long-term growth • Category authority • Search visibility that does not rely on constant spend Paid agencies optimize budgets. Organic SEO agencies build assets. Knowing which problem you are solving helps you choose the right partner. |
Benefits of Hiring an Organic Search Agency for B2B
By now, the question (hopefully) shifts from “What does an organic SEO agency do?” to “Is this actually worth it for a B2B business like ours?”
This is where the answer becomes clear as the water in Similan Islands (Thailand).
- Creates a scalable, non-paid pipeline
One of the biggest advantages of working with an organic search agency is that the output scales without scaling spend.
Every page you publish, optimize, and strengthen becomes a long-term asset. Over time, your site attracts demand without needing a bigger budget to maintain the same level of visibility.
- Attracts higher-intent buyers
Organic search traffic tends to be more intentional.
These visitors are actively researching, comparing, and seeking to understand a specific topic. They are not passively scrolling or reacting to an ad… they are looking for answers.
That intent shows up later in:
- Better sales conversations
- Higher-quality leads
- More informed buyers
An experienced organic SEO company knows how to capture this intent and align it with your ICP.
- Supports long and complex buying cycles
B2B decisions involve multiple stakeholders and repeated touchpoints.
Organic SEO supports this reality by:
- Giving buyers something useful at every stage
- Creating content that can be shared internally
- Reinforcing credibility over time
Instead of pushing for immediate conversion, SEO supports the decision-making process itself.
- Strengthens sales enablement without sounding salesy
Strong SEO content does double duty.
It attracts new buyers and supports existing sales conversations. Sales teams often send SEO-driven pages to prospects because they explain concepts clearly and objectively.
- Builds brand authority in your category
Appearing consistently for relevant searches builds familiarity and trust.
Over time, buyers begin to associate your brand with expertise in a specific area. This authority is difficult to replicate with short-term campaigns.
For B2B companies trying to own a category or narrative, this visibility is invaluable.
- Reduces long-term customer acquisition costs
While SEO takes time upfront, its marginal cost decreases as performance improves.
Once content ranks and authority builds, acquisition costs stabilize or even drop. This is one of the key reasons mature B2B companies continue to invest in organic SEO.
- Captures demand 24/7
SEO does not clock out.
Your content works when your team is offline, across time zones, and throughout long research cycles. It meets buyers where they are, whenever they are ready.
That always-on presence is one of the most underrated benefits of organic SEO.
How to Choose the Right Organic SEO Company
Choosing an organic SEO company depends on who understands how your business actually grows. The wrong choice usually looks fine on paper and shows up six months later.
Here’s how to evaluate organic SEO companies properly, step by step.
- Look for real B2B experience
A good organic SEO company should understand:
- Long B2B buying cycles
- Multiple stakeholders per deal
- Non-linear customer journeys
- High-consideration searches
Ask what types of companies they’ve worked with. If all examples are ecommerce or local businesses, that’s a mismatch for most B2B teams.
- Ask how they map SEO to pipeline
Traffic alone is a weak success metric, especially in B2B.
A strong organic search agency should be able to explain:
- Which content attracts ICP-level visitors
- How SEO supports mid-funnel and late-funnel activity
- How organic traffic influences deals over time
If reporting stops at sessions and rankings, you won’t get answers when leadership asks more complicated questions.
- Evaluate their operational rigor
SEO is execution-heavy… you really have to build content muscles, engines, banks and whatnot.
Look for clarity on:
- How content is planned, reviewed, and published
- How technical issues are prioritized and fixed
- How updates and optimizations are handled over time
Vague processes often lead to inconsistent output and stalled momentum.
- Check their technical depth
You don’t need an agency that only ‘does technical SEO,’ but you do need one that understands it deeply.
Ask how they handle:
- Site architecture decisions
- Page performance issues
- Indexing and crawl challenges
- Migrations or major site changes
- Understand their approach to experimentation
Search behavior and algorithms change constantly.
Strong organic SEO companies:
- Test content formats and structures
- Monitor what stalls and what accelerates
- Update pages based on performance data
SEO works best when it is treated as an evolving system, not a fixed checklist (like I said above).
- Get clarity on timelines and expectations
SEO is a long-term investment, but that doesn’t mean ‘wait and watch.’
A good SEO company should set expectations around:
- Early traction signals
- Medium-term performance indicators
- Long-term outcomes
If someone guarantees rankings or immediate results, that’s usually a red flag 🔴 (because I couldn’t find the flag emoji).
- Ask about collaboration and communication
SEO touches content, product, marketing, and sometimes engineering.
Make sure the agency:
- Communicates clearly
- Shares progress regularly
- Is comfortable collaborating with internal teams
SEO breaks down when ownership is unclear.
- Review how they report progress
Reporting should help you make decisions, while you fill up your slides.
Look for reporting that covers:
- Content performance by topic
- Engagement patterns
- Search visibility trends
- Clear next steps
The best agencies explain what the data means (the analysis bit).
Results-Based SEO: What You Should Actually Measure
Talking of reporting… at least one person asks this (as they should):
“So… what are we measuring, exactly?”
This is where results-based SEO comes in. (And also where many SEO programs quietly fall apart). Because SEO absolutely delivers results… but the problem is, many teams measure the wrong metrics.
Why traditional SEO metrics fall short in B2B
Rankings, impressions, and traffic are easy to report, but they are also incomplete.
A page can:
- Influence a deal without converting
- Be read by multiple stakeholders
- Support sales conversations months later
If you only measure last-click conversions, you miss most of SEO’s impact.
Results-based SEO shifts the focus from surface-level metrics to business signals.
The core metrics that actually matter
A modern, results-driven SEO program looks at performance through multiple lenses.
- Growth in qualified organic traffic
- Traffic from ICP-fit companies
- Visitors landing on high-intent pages
- Engagement depth, not just sessions
This tells you whether SEO is attracting the right audience.
- Performance of keyword and topic clusters
Single keywords fluctuate, but topic clusters often show momentum.
Measuring cluster-level performance helps teams understand:
- Which themes are gaining authority
- Where coverage is thin
- What content needs expansion or updating
This is far more stable than tracking individual rankings.
- New ICP accounts landing on the site
In B2B, accounts matter more than anonymous users.
Results-based SEO looks at:
- Which target accounts are visiting organically
- Which pages they engage with
- How often they return
This connects SEO activity to account-based strategies.
- Organic-influenced pipeline
SEO often supports deals rather than initiating them.
Strong measurement captures:
- Deals where organic search was part of the journey
- Pages viewed before demo or contact events
- Content that appears repeatedly across won deals
This reframes SEO as a pipeline contributor, not just a traffic source.
- Deal acceleration and sales efficiency
SEO can shorten buying cycles.
Educational content helps buyers:
- Understand problems faster
- Align internally
- Ask better questions
When measured properly, this shows up as faster deal progression and higher close confidence.
- Multi-touch revenue contribution
Results-based SEO looks at:
- How organic search works alongside paid, outbound, and events
- Assisted conversions across channels
- Revenue influenced, not just attributed
This is especially important for longer B2B sales cycles.
Rankings still matter. They help diagnose visibility and competitiveness. But rankings alone do not answer leadership’s fundamental question:
“Is this helping us grow???”
Results-based SEO exists to answer that question clearly and credibly.
What B2B Teams Get Wrong About SEO Measurement
Most B2B teams don’t fail at SEO because of bad content or weak keywords.
They fail at measurement.
And so, SEO ends up underfunded, questioned, or deprioritized, not because it is ineffective, but because its impact is misunderstood or invisible in the way teams track performance.
Here are the most common mistakes.
- Treating SEO as a first-click or last-click channel
This is the biggest one.
SEO rarely works as a clean first-click or last-click channel in B2B. Buyers might:
- Discover you through an organic article
- Come back later via direct or paid
- Convert after a sales conversation
If you only credit the final touch, SEO disappears from the story.
In reality, SEO often introduces the problem, frames the solution, or builds trust early. That influence matters, even if it is not the final click.
- Ignoring mid-funnel behavior
Many teams measure SEO only at the top or bottom of the funnel.
What gets ignored is the middle:
- Which pages do buyers read after landing
- How deeply they engage
- What content do they revisit
Mid-funnel behavior is where SEO does a lot of its real work, especially in B2B, where education and validation take time.
- Keeping SEO data separate from CRM data
SEO tools live in one place. CRM data lives in another. And your sanity… well, it’s lying in the corner.
When these systems do not talk to each other:
- SEO looks disconnected from revenue
- Sales has no visibility into content influence
- Marketing cannot defend long-term investments
This separation makes SEO look like a traffic channel rather than a growth channel.
- Overlooking assisted conversions
Not every piece of content is meant to convert.
Some pages:
- Answer objections
- Clarify concepts
- Support internal alignment
When assisted conversions are ignored, these pages look “low performing,” even though they play a critical role in closing deals.
- Expecting linear journeys in a non-linear world
For the 99th time in this article, I’m going to say that B2B Buyers jump between devices, channels, and timelines. They loop back, pause, and restart.
Measurement frameworks that assume a straight line from search to conversion will always undercount SEO’s role.
- Running SEO without experimentation or governance
SEO is often treated as a background activity.
Pages are published, rankings are checked, and little else happens.
Without:
- Clear hypotheses
- Ongoing experimentation
- Regular reviews and updates
SEO becomes static. And static SEO slowly loses ground, even if it once performed well.
- Reporting activity instead of insight
Traffic charts are easy to generate. Insight is harder.
SEO reporting should answer questions like:
- What is working and why
- What is stalling and why
- What should change next
Without this layer of interpretation, SEO reports fail to earn trust.
How Factors.ai Supports SEO Performance Tracking
One of the biggest reasons SEO feels ‘hard to prove’ in B2B is not because SEO is unclear, but because most analytics stacks were not built for long, multi-touch journeys.
This is where Factors.ai fits in.
Instead of treating organic search as a top-of-funnel traffic source, Factors.ai helps teams understand how SEO contributes to revenue.
- Seeing organic search beyond sessions and clicks
Traditional SEO tools tell you what happened on the website.
Factors.ai focuses on what happened after.
It helps teams see:
- Which organic pages are visited by real ICP accounts
- How often do those accounts return
- What content appears across multiple touchpoints
This moves SEO analysis from “how many people came” to “who came and why that matters.”
- Connecting content to pipeline influence
Not all content is meant to convert. Some content educates, some validates, and some accelerates decisions.
Factors.ai helps identify:
- Which pages show up in closed-won journeys
- Which topics consistently influence opportunities
- Which content supports deal progression
This makes it easier to invest in content that actually helps revenue teams.
- Understanding account journeys, not isolated visits
B2B buying happens at the account level, and with Factors.ai, teams can analyze:
- Page paths taken by target accounts
- Repeated engagement patterns
- Content consumed across stages
This helps SEO and content teams design journeys intentionally, rather than publishing in isolation.
- Measuring assisted and incremental impact
Factors.ai supports (because SEO rarely works in silo):
- Multi-touch attribution across organic, paid, outbound, and direct
- Visibility into assisted conversions
- Incrementality analysis to understand true lift
This gives leadership a more honest view of SEO’s contribution.
- Bringing SEO and paid search into the same conversation
SEO and paid search often live in different dashboards.
Factors.ai allows teams to:
- Compare organic and paid performance side-by-side
- Understand how organic visibility improves paid efficiency
- See combined impact on pipeline and revenue
This is especially useful for teams managing blended marketing and SEO services strategies.
- Turning SEO data into decisions
Most importantly, Factors.ai helps teams answer questions like:
- Which topics should we double down on
- Which pages need updating or expansion
- Where is SEO influencing deals but not getting credit
Instead of static reports, SEO becomes a data-driven input for decision-making.
Pricing Models: What Organic SEO Services Cost
There is no single price for organic SEO services, and that’s not a dodge. The cost depends on scope, ambition, and how seriously a company takes SEO as a growth channel.
That said, most organic SEO agencies price their work using a few standard models.
Understanding these helps you evaluate proposals without getting lost in line items.
- Monthly retainer model
This is the most common pricing structure for ongoing SEO.
Under a retainer, an organic SEO company provides continuous support across:
- Technical optimization
- Content planning and creation
- On-page improvements
- Ongoing optimization and reporting
Typical range for B2B:
Mid-market B2B companies often invest anywhere from moderate to high five figures monthly, depending on scale and competitiveness.
P.S: This model works best when SEO is treated as a long-term program rather than a short-term experiment.
- Project-based pricing
Some companies start with a defined scope.
Common project-based engagements include:
- Technical SEO audits
- Site migrations
- Keyword and content strategy development
- Content refresh initiatives
This model is useful when:
- You need a specific outcome
- Internal teams will execute later
- SEO maturity is still developing
The limitation is that SEO impact often plateaus without ongoing work.
- Hybrid pricing models
Hybrid models combine a lower monthly retainer with specific projects layered on top.
This is common when:
- Strategy and guidance are ongoing
- Content or technical work is phased
- Internal teams handle part of execution
For B2B teams with some in-house capability, this can be a flexible option.
- Performance-based or results-based SEO
Some agencies offer results-based SEO pricing, where fees are tied to outcomes.
While appealing on paper, this model requires careful definition of:
- What counts as a result
- How attribution is handled
- What are the excluded external factors
True performance-based SEO is complex because revenue impact is often multi-touch and delayed.
| Here’s what actually drives SEO pricing |
|---|
| Regardless of model, pricing is influenced by: |
| 1. Competition in your category More competitive spaces require deeper investment. |
| 2. Content depth required B2B topics often demand long-form, expert-level content. |
| 3. Technical complexity of your site Larger or older sites require more ongoing work. |
| 4. Measurement and reporting expectations Advanced analytics and attribution add effort and value. |
Small agencies vs Enterprise SEO companies
Smaller organic SEO agencies may focus on execution volume and affordability.
Enterprise SEO companies typically charge more because they offer:
- Strategic depth
- Cross-team collaboration
- Advanced analytics integration
- Scalable content operations
Neither is inherently better. The right choice depends on growth goals and internal resources.
Best Practices for Working with an Organic SEO Consultant / Agency
Hiring an organic SEO consultant or agency is only half the equation. The other half is how you work together… because SEO fails more often due to poor collaboration than poor strategy.
Here’s how you can get the most value from an organic SEO consultant / Agency:
- Treat SEO as a program, not a task
SEO is not something you ‘finish.’
The teams that see results treat SEO as an ongoing program with:
- Clear goals
- Regular reviews
- Continuous iteration
If SEO is treated as a side project, it will behave like one.
- Align on outcomes early
Before work begins, align on:
- What success looks like
- Which metrics matter at each stage
- What will change if something is not working
This avoids the classic situation where marketing celebrates traffic and leadership asks about revenue… and everyone’s just staring at each other.
- Create clear ownership and workflows
SEO touches multiple teams, so get answers to these questions beforehand:
- Who approves content
- Who owns technical fixes
- How feedback is shared
- How delays are handled
Clear ownership will prevent SEO from stalling due to internal bottlenecks.
- Give consultants access to context, not just tools
An organic SEO consultant performs best when they understand:
- Your ICP and sales motion
- Deal sizes and buying cycles
- Common objections and questions
- Competitive positioning
SEO improves dramatically when it reflects real customer conversations.
- Commit to regular check-ins
Set up monthly or fortnightly check-ins, they help:
- Review what’s working
- Spot early warning signs
- Adjust priorities
- Keep momentum steady
Long gaps often lead to misalignment and wasted effort.
- Encourage experimentation and updates
Search behavior changes, content ages, Google releases its seventh Core Update in the year…
Strong SEO programs:
- Refresh existing pages
- Test new formats
- Expand winning topics
- Retire underperforming content
Progress comes from iteration, not perfection.
- Avoid the ‘set it and forget it’ trap (PLEASE)
Publishing content and walking away is one of the fastest ways to stall growth.
SEO improves when teams:
- Revisit pages regularly
- Improve clarity and depth
- Adapt to new intent signals
Consistency compounds.
Checklist: Evaluating Organic Search Engine Optimization Companies
When you are comparing organic search engine optimization companies, conversations can start to sound the same very quickly.
Everyone promises growth, shows charts, and says they are ✨StRaTeGiC✨.
This checklist helps you cut riiight through that and evaluate agencies on what actually matters for B2B SEO.
Use it as a reference during pitches, demos, or internal discussions.
- Technical expertise
Confirm that the agency can confidently handle:
- Site architecture and crawlability
- Indexing and rendering issues
- Page performance and Core Web Vitals
- Schema and structured data
- Migrations and major site changes
Technical blind spots often limit SEO long before content does.
- Content depth and quality
Ask how the agency approaches:
- Topic selection and prioritization
- Content depth for complex B2B subjects
- Editorial standards and review processes
- Content updates and refresh cycles
High-performing SEO content is rarely thin or generic.
- Industry and business familiarity
Strong organic SEO companies understand:
- Your buyer personas and ICP
- Typical deal sizes and sales cycles
- Common objections and decision criteria
SEO works best when it mirrors how your buyers actually think and search.
- Measurement and analytics maturity
Look for clarity on:
- How success is defined
- How SEO is connected to pipeline or revenue
- How assisted conversions are handled
- How insights are communicated
If reporting stops at traffic and rankings, you will struggle to defend SEO internally.
- Tools and technology stack
Ask what tools the agency uses for:
- Keyword research and monitoring
- Technical audits
- Content performance analysis
- Reporting and insights
Tools alone don’t create results, but weak tooling limits visibility.
- Transparency and communication
Evaluate how clearly the agency explains:
- What they are doing and why
- What is working and what is not
- What will change next
Good SEO partners educate as much as they execute.
- Case studies and references
Look beyond metrics and fancy decks.
Strong case studies explain:
- The problem being solved
- The strategy used
- The constraints involve
- The outcomes achieved
References should reflect situations similar to yours.
- Contract clarity and expectations
Before signing, confirm:
- Scope and deliverables
- Timelines and milestones
- Review and exit terms
- Ownership of content and assets
Clear contracts protect both sides.
FAQs for Choosing an Organic SEO Agency
Q. What does an organic SEO agency do?
An organic SEO agency helps businesses grow visibility and demand from unpaid search results. This includes improving site health, creating and optimizing content around real buyer intent, and strengthening long-term search performance so the right audiences find you naturally over time.
For B2B companies, the focus is usually on attracting high-intent visitors and supporting longer buying journeys rather than driving instant conversions.
Q. What is the meaning of SEO services?
SEO services refer to the set of activities that improve how a website performs in organic search. This typically includes technical optimization, keyword and topic research, content creation, on-page optimization, internal linking, and ongoing performance monitoring.
SEO services are most effective when they are aligned with buyer education and revenue influence, not just traffic growth.
Q. How long does organic SEO take for B2B companies?
Organic SEO is a long-term investment.
Most B2B companies start seeing early traction within three to six months, such as improved visibility, engagement, or content performance. Meaningful pipeline influence usually takes longer, especially in competitive categories.
The exact timeline depends on your starting point, competition, and consistency of execution.
Q. What’s the difference between an SEO company and an SEO consultant?
An SEO company typically provides end-to-end execution, including strategy, content creation, technical work, and ongoing optimization.
An SEO consultant usually focuses on strategy, audits, or advisory work and may not execute day-to-day tasks.
B2B teams with limited internal bandwidth often benefit more from a full-service organic SEO agency.
Q. How do organic SEO companies measure success?
Modern organic SEO companies measure success using a mix of indicators, including qualified traffic growth, topic-level performance, engagement depth, account-level behavior, and organic influence on pipeline or revenue.
Rankings and traffic are still tracked, but they are treated as signals rather than final outcomes.
Q. What is results-based SEO?
Results-based SEO is an approach that focuses on business outcomes rather than surface metrics. Instead of optimizing only for rankings or visits, it looks at how SEO contributes to qualified leads, pipeline influence, deal acceleration, and revenue over time.
In B2B, this approach is more realistic because buying journeys are multi-touch and non-linear.
Q. Why is organic SEO important for enterprise B2B brands?
For enterprise B2B brands, organic SEO supports long buying cycles, builds category authority, reduces dependency on paid media, and captures demand continuously.
It also helps align marketing, sales, and leadership around a shared understanding of how buyers research and make decisions.
Q. How does organic search differ from paid search in B2B?
Organic search compounds over time and supports education-heavy buying journeys. Paid search delivers immediate visibility but stops working when spend stops.
In B2B, organic search often influences decisions early and mid-funnel, while paid search is used to capture active demand or support specific campaigns. Most mature teams use both together.

Oribi vs Heap
Compare Oribi & Heap analytics tools to choose the best fit for your business needs. Read Factors blog to understand the features & differences between them.

{{INLINE_BOFU}}
Marketing Analytics, Web Analytics, and Customer Journey Funnels
Now more than ever, marketing analytics, web analytics, and customer journey mapping is at the core of every marketing strategy. That being said, tracking, collecting, cleaning and formatting data is a laborious chore. Most organisations, especially SME firms, have neither the time nor the resources to devote to these steps. What's more? Only after you have all the data in place can you analyse, report and optimize marketing efforts.
This is where organisations use self-serve marketing analytics solutions to collect and analyse data. There's no shortage of tools trying to solve for quality, self-serve analytics. Picking the right one, however, can be tricky. One such web analytics solution, Oribi, was recently acquired by LinkedIn for over $80 million. As a result of the acquisition, former Oribi-users are on the hunt for alternate solutions — one of them being Heap.
Heap
Founded in 2013, Heap is a San Francisco based product analytics platform that provides insights and data visualization to track customer engagement with a company’s site or product. It maps user behaviour and enables users to quickly access and organise data to recognise sources of friction within the user journey.
Oribi
Oribi is an Israeli based web and journey analytics platform founded in 2015. Oribi helps track site interactions and key conversions. It also allows marketers to get action-oriented and data-backed trends and insights. Additionally, Oribi helps users understand visitor journeys with intuitive, user-friendly reporting mechanisms.
Heap Vs Oribi: Analytics and Integrations
Although marketers can (and do) use both Heap and Oribi to access user journey data, Heap is marginally more intuitive when it comes to tracking user journeys on web-based products. Oribi, on the other hand, is better suited for pure web analytics.
Another point: Heap does not support direct integrations with ads platforms like Google ads or Facebook ads. To be fair, Oribi’s integrations with Google and Facebook is also set to be discontinued as a result of the Linkedin acquisition. When it comes to CRM integrations, Heap allows for both Hubspot and Salesforce. Meanwhile, Oribi only users to push data back into HubSpot.
Heap works by placing a snippet of code at the top of the site and tracks user journeys only on your website or your product. Its primary use cases are product adoption, product-led growth and funnel tracking for the digital experience over the website or application. Heap also enables site search tracking and campaign management. Oribi does not.
Oribi’s funnel helps marketers understand what journeys buyers are taking and where they are losing more users so that marketers know what they have to work on to improve. Similarly, it gives insights as to which type of content works best and drives more buyers to convert.
Shameless plug but Factors.ai delivers the best of both worlds. Strong campaign analytics, web analytics, revenue attribution, funnels, button tracking and more — across ads, web, and CRM. Schedule a personalized demo to learn more :)
Heap Vs Oribi: User Interface
Oribi has often been praised for its simple to use UI. Heap, on the other hand, has been found a bit wanting in terms of ease of use. Oribi has consistently ranked higher across factors like UI, ease of set-up, ease of admin, real-time reporting, etc. However, Heap may have the edge in terms other features like retroactive reporting, integrations and custom event tracking. Although Heap is a non-code platform, users with zero experience have often found the tool a bit complex to set up and the learning curve steeper than in the case of Oribi.
Factors also ranks high (in fact, higher than even Oribi) across ease of use, onboarding, customisable filters and breakdowns for reports. Learn more here!
Heap Vs Oribi: Multi-step digital journeys & multi-channel digital journeys
Both Heap and Oribi help organise and track customer journey funnels. But the funnels are of different kinds.
Heap has been proven to be best for tracking the funnel in a multi-step digital journey, this means that if the user has to take several steps in their digital journey over the application/product or website to get to the end goal or to convert, Heap gives insights as to what steps the user took, in what sequence, when did they complete the goal, where they faced frictions, what step took more time, etc. Their effort analysis features allow you to see what parts of the site give more trouble to the user and why.
On the other hand, Oribi is preferable for marketers to track the funnel in a multi-channel buyer journey. In other words, if you want to see where your potential buyers are coming from, and what actions they’ve taken before they’ve come to the website, a tool that focuses on tracking multi-channel journeys is more useful. Particularly in the case of B2B user journeys, where there are multiple decision-makers, each of which interacts with your product/service on various marketing channels over a longer sales cycle, multi-channel attribution tracking and efficiency measurement of overall campaigns becomes more important for the marketing team.
Pros and Cons of Oribi and Heap
Heap Advantages
- Real-time reports: Heap’s auto-tracking and data governance tools ensure that every single event and every single user is tracked and these data points fit into a data structure from the moment that they are collected. This ensures that the reports are always real-time and the data structure is able to adapt even when events change — without any code or engineering support.
- Allows for retroactive analysis: Since users can retroactively define events and conversions, the data structures and dataset organisations evolve to fit deliverables when they change.
Heap Disadvantages
- High cost of data storage: Because every single user and every single event is automatically tracked on a real-time basis, this leads to a large quantity of data that has to be stored.
- Website analytics focussed: Although Heap supports several integrations, it is more focused on user’s interactions and journeys on the website/product. It also misses ad platform integrations due to the same reason. B2B marketers cannot map out entire customer journeys which in turn, can make it harder to derive insights into overall sales patterns.
- Difficult to use: Its UI is a little complex as compared to Oribi. The learning curve is steeper.
Oribi Advantages
- User interface: The interface and dashboard are intuitive and easy to use for anyone within the organisation.
- Automated data orchestration: Oribi’s ability to automatically send data back into platforms like Hubspot and Google Analytics helps with data orchestration and breaking down of siloes across different storage locations.
Oribi Disadvantages
- Oribi’s CRM integration allows it to send data automatically to Hubspot but it cannot take data from the platform to integrate CRM data for attribution on the user’s larger customer journey on its own platform.
- Oribi’s reporting capabilities have been found lacking as it does not allow for custom filters, breakdowns and formats for data visualisation. The reporting section only allows for pdf reports which can limit how much you can include/exclude.
In closing,
The biggest difference between the two is that Heap is primarily a product analytics tool and Oribi, a web analytics tool. However, because most B2B SaaS products are web-based, the functions of product and web analytics bleed into each other. So Heap is also used for web analytics and vice-versa. At the end of the day, there are several analytics tools that help marketers automate grunt work like data collection, organisation and formatting. They come with different features that help solve various use cases in the day-to-day working of the team. To choose which tool is best for you and your organisation, identify what you struggle with and what tools provide best for such use cases.
We suggest you check out Factors to get the most out of your data!

Best Mixpanel Alternatives and Competitors for Your Business in 2026
Here are some of the 9 best mixpanel alternatives. Our list covers key features, pricing and more, to help you find the best fit for your business needs.
Marketing analytics tools are crucial for B2B marketers as they offer valuable insights into customer behavior, campaign performance, and marketing ROI. There are numerous analytics tools to choose from, and Mixpanel is one among them.
Mixpanel is a user behavior analytics platform that helps businesses optimize customer engagement and drive growth.
It provides various features such as event tracking, cohort analysis, and user segmentation. Though the tool offers product and marketing analytics, Mixpanel is widely used for product analytics. It's even second in the list of best product analytics tools in G2.
While Mixpanel seems to be an effective analytics tool, we have found some limitations upon evaluating customer reviews. Poor customer support, expensive pricing, and unintuitive user interface are a few to name. Ergo, marketers are also looking into alternatives that may fit their businesses.
But with so many available options, it can be hard to know which tool is perfect. That's why we've compiled a list of Mixpanel alternatives you should look for in 2026.
This blog will discuss 9 alternatives to Mixpanel with their unique features, integrations, pricing, and customer reviews.
So let's dive in and explore what each of these alternatives offers!
Why do users look for Mixpanel alternatives?
Mixpanel has been a popular choice for many, but some teams consider alternatives because of certain limitations of the tool.
Here are some of the shortcomings of Mixpanel:
1. Higher pricing

High pricing can lead to budget constraints, resulting in companies cutting costs in other areas to accommodate the tool. Also, with high pricing, companies may not be able to afford all features or support services. Customer reviews have shown that Mixpanel’s pricing is very expensive. This is one of the main reasons marketers seek a Mixpanel alternative.
{{INLINE_CTA_A}}
2.Poor customer support
Customer support is crucial for analytics tools. With proper support users can
- Easily adopt the tool.
- Resolve technical issues.
- Better understand tool functionality.
Customer reviews show Mixpanel’s customer service to be unresponsive and poor. Due to their limited support, implementation of the tool also takes a lot of time and effort.
3. Unintuitive User Interface

An intuitive UI encourages quick product adoption and sustained usage. Unfortunately, customers find Mixpanel to be a complex platform with a steep learning curve for non-technical users.
4. Complex filter options

You need to filter out the data perfectly to understand where your product lags and identify how to improve. Based on reviews, customers find Mixpanel’s filters to be confusing. This may lead to extracting unwanted data and hard to find the data you need.
Following are some cons we found while evaluating customer reviews on Capterra.
- Data reports may have some missing data.
- Duration tracking on iOS platforms is sometimes wrong.
- There are no advanced features for detailed email marketing campaigns.
- Dashboard features have a very limited data range, up to only 2 weeks. It can’t accommodate all the generated reports.
The aforementioned limitations are some of the reasons why marketers seek an alternative. However, keep in mind that these may vary with businesses.
Now that we have understood why marketers are looking for an alternative to Mixpanel, let's dive into our list of suggestions.
Top 9 Mixpanel alternatives
Explore the top 9 Mixpanel alternatives to select your marketing analytics tool. We will introduce some competitors that can match or surpass Mixpanel's capabilities. Read on to learn more.
1. Factors.ai

First in the list of Mixpanel alternatives is Factors.
Factors is a marketing analytics and attribution tool explicitly built for B2B companies. The tool has numerous features that help businesses gain valuable insights into user interactions and engagement with the website.
The platform can track online and offline touchpoints and thus provides a complete view of the customer journey. This helps marketers identify and analyze channels and campaigns that are driving engagement and conversions.
The tool is easy to implement and allows no-code integrations, helping marketers connect with CRM, ad platforms, and MAPs. In addition, its dashboard is customizable and can gather all key customer data in one place. By doing so, marketers can monitor and analyze campaigns quickly and optimize them accordingly.
Key features

- Advanced Web Analytics:
With Factors, marketers don't need to create custom events or use different tools for website behavior analysis. It can automatically track all events, both online and offline. The events can be button clicks, form fill attempts, sales calls, and meetings. It also automatically captures retroactive data, allowing marketers to analyze past data, such as user behavior, the performance of past campaigns, etc. This helps them optimize current strategies and make informed decisions for future growth.
- User Segmentation:
The more customer data an analytics tool has the more effectively the tool can segment users. Factors' robust integration with CRM software makes it possible for it to collect more customer data and segment users more efficiently than other tools.
- User Timelines:
This feature visualizes every user interaction and engagement on your website. The timeline includes online and offline touchpoints and is available at the user and account-level. As a result, it offers a better understanding of user behavior.
- AI-Powered Insights:
Using AI technology, Factors' Explain feature shows which elements are working toward a specific goal and which aren't.
- Multi-Touch Attribution:
The features provide a range of attribution models to compare and select the right one for the business. It allows you to accurately attribute conversion and revenue to the channels driving revenue.
- Account Intelligence:
The feature allows marketers to discover anonymous accounts visiting your website. As a result, marketers gain insights into their traffic, where its are coming from, and more. This helps in segmenting the target audience from the rest. In turn, marketers can optimize and personalize their campaigns for better conversions.
Integrations
- Hubspot
- Facebook Ads
- LinkedIn Ads
- Google Ads
- Salesforce
- Segment
- Bing Ads
- Rudderstack
- Marketo
- 6Sense
- Clearbit
- Leadsquared
- Drift
- Google Search Console
- Slack
- Google Spreadsheet
Customer reviews


Pricing
Find pricing info here: pricing details.
{{INLINE_CTA_A}}
2. Heap
Heap is a digital analytics platform that helps businesses track how users interact with digital products. The tool offers no code and easy implementation. Like Factors, Heap can also track various events automatically.
Heap can track events automatically. Since the tool records all events from day one, every event definition is completely retroactive. This allows users to view and analyze past data.
Additionally, Heap can also automatically generate reports for analysis, which can be very helpful for small teams.
Key Features
- Customizable Dashboards:
Customizable dashboards allow businesses to create custom dashboards to track all essential KPIs and metrics. Companies can visualize and analyze their data without wasting time on irrelevant information.
- Autocapture:
Heap doesn’t require manual tagging and can automatically capture user interactions on websites or apps. Marketers can pinpoint the point of friction of a customer journey and optimize accordingly to improve it.
- Behavioral Segmentation:
The feature helps businesses understand how users interact with their website or app. This allows them to effectively target their visitors and provide a personalized user experience.
Integrations
- Salesforce
- Marketo
- Optimizely
- Clearbit
- Zendesk
Customer reviews

Pricing

Heap's free plan includes 1 project and up to 10K monthly sessions. The details about Growth, Pro, and Premier plans are available upon request.
3. Amplitude

Amplitude is a digital analytics platform that is used by brands and innovative businesses to personalize their digital products and optimize product development.
Amplitude helps answer critical questions about your digital product strategy, like
- How are users navigating through the website?
- What features are users engaging with most?
It's an analytics solution built for modern product and growth teams, offering real-time analytics, cross-platform tracking, behavioral analytics, and enterprise-level security and customer support.
Key features
- User Surveys:
With Amplitude, companies can easily create customized surveys to collect user feedback. This feature helps better understand user preferences, opinions, and pain points, helping businesses make more informed decisions to enhance user experience.
- User Profiling:
Amplitude provides companies comprehensive data on individual users, including their behavior, demographics, and interests. This information can be used to create personalized marketing and outreach plans to potentially improve the conversion rate.
Integrations
- Segment
- Slack
- Salesforce
- Optimizely
Customer reviews

Pricing
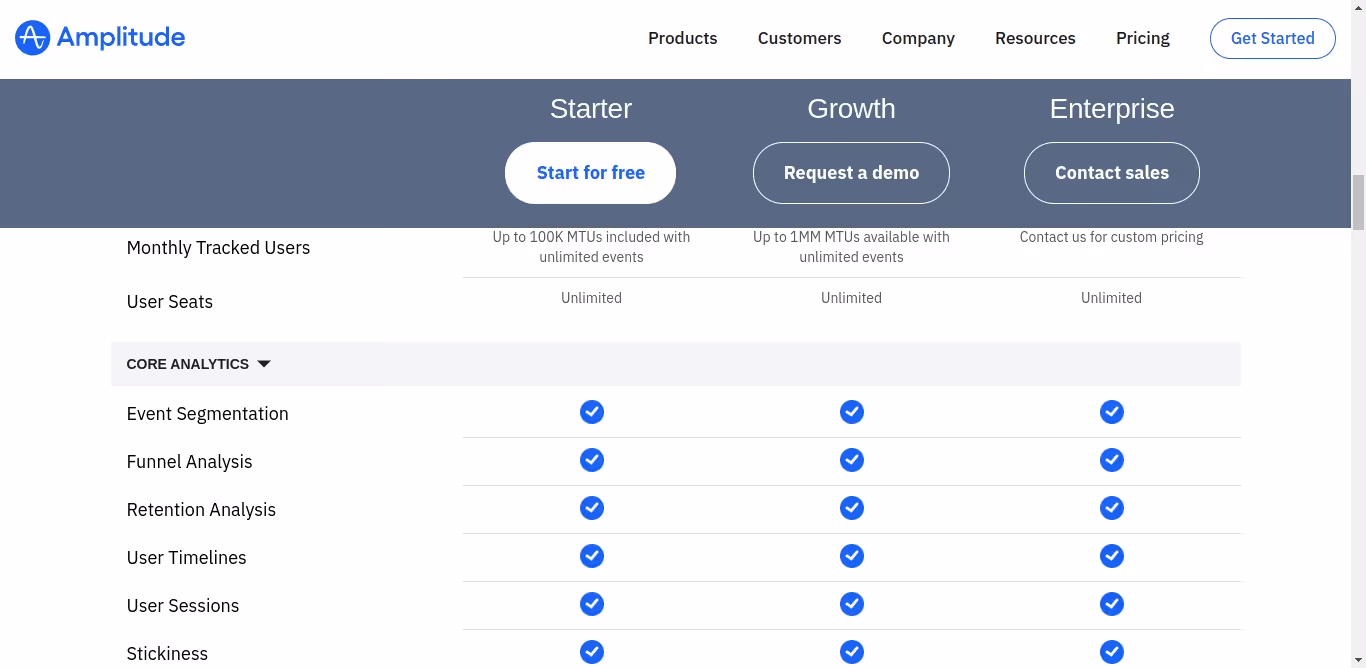
Amplitude has three different packages. The Starter package is free to use, and you need to contact the sales team to know the pricing for the other two packages.
{{INLINE_CTA_A}}
4. Google Analytics

Google Analytics is a robust analytical tool that helps companies better understand their audience, website and digital marketing efforts. GA is user-friendly and flexible, enabling marketers to identify the most effective channels for achieving the best results.
The tool can also help identify areas of friction that marketers can optimize based on information from the tool to improve engagement and other key metrics.
Key Features
- Enhanced Reporting
Google Analytics provides auto-generated reports for all of your marketing campaigns. It can provide different reports like - audience reports, behavior reports, conversion reports, real-time reports, and more. You can easily visualize the reports in a chart manner for better understanding.
- Data Activation
One of the specialized tools of Google Analytics is data activation. It uses machine learning algorithms to thoroughly analyze the marketing data. This helps you make smarter marketing decisions using input data streams.
Integrations
- Salesforce
- Zoho
- Hubspot
- Mailchimp
- Campaign Monitor
Customer reviews

Pricing

Google Analytics has a free version and an enterprise-version called Google Analytics 360. The pricing for the latter starts at $150,000 per year.
5. Plausible Analytics

Plausible Analytics is a privacy-focused web analytics tool. It offers businesses valuable insights into their website traffic and user engagement. The tool complies with regulation laws such as GDPR, CCPA, and PECR. Plausible is easy to use and implement and is one of the most simple analytics available in the market.
Key features
- Lightweight script:
Plausible is executed through a lightweight script. Its script size is less than 1KB, ensuring that your website’s page load speed won’t be affected in the least.
- Traffic segmentation:
You can segment and differentiate data based on various metrics. This helps you understand the volume, behavior, and characteristics of visitors coming to your website and their source. You can also create custom events to get the specific information they need.
- Sharable dashboards:
Other tools don’t allow dashboard sharing. Plausible allows marketers to share the analytics dashboard with the team members or management for better collaboration.
Integrations
- Carrd
- Bubble.io
- Hubspot
- Google Data Studio
Customer reviews

Pricing

Their pricing depends on the monthly page views. If you have 10k views, you need to pay $9 per month. They also provide a 30-day free trial and 2 months free if paid annually.
{{INLINE_CTA_A}}
6. Matomo

Matomo, formerly known as Piwik, is a powerful open-source web analytics platform. It gives you real-time updates on visitor details, goal conversion tracking, event tracking, and A/B testing for optimizing website campaigns.
You can choose between two hosting options: cloud and on-premise. The cloud option is easy to set up and requires no technical know-how, whereas the on-premise option has to be hosted on your server and requires developer support.
The tool is easy to use and is compliant with GDPR privacy laws.
Key features
- Event tracking:
Using this feature, marketers can observe, analyze, and interpret the actions and interactions of customers on a website. Marketers can create custom events to analyze the customer's behaviors and help distinguish high-intent visitors from the rest.
- Multi-touch attribution:
This helps marketers to accurately identify the marketing campaigns and channels that are performing better and that don’t.
Integrations
- WordPress
- Magento
- WooCommerce
- MailChimp
Customer reviews
%252520reveal%252520that%252520though%252520it%252520is%252520a%252520free%252520tool%252520tha.avif)
Pricing

Hosting On-Premise is free of charge. You can download and set up the platform on your servers. However, it offers limited features, and extra fees apply for each additional feature.
For Cloud hosting, pricing begins at $23 per month, accommodating up to 50K traffic.
7. Kissmetrics

Kissmetrics is a web analytics tool. It helps track user behavior, identify growth opportunities, and improve customer engagement.
Its dashboard is intuitive and brings all key metrics to one place. In addition, the Funnel feature visualizes customer interactions at each stage of the customer journey. This enables marketers to identify where prospects are dropping off and potential friction in the funnel, helping improve the overall marketing strategy.
Key features
- Customer Segmentation:
This feature enables businesses to group website visitors and product users based on shared characteristics. This will help the sales and marketing teams create personalized campaigns targeting each group, increasing the conversion rate.
- Cohort Analysis:
Businesses can use this feature to identify trends and patterns in user behavior by cohorts, such as determining if customers who signed up during a specific promotional period remain active and engaged in subsequent months.
Integrations
- Shopify
- WooCommerce
- Zapier
- Gmail
Customer reviews
Pricing
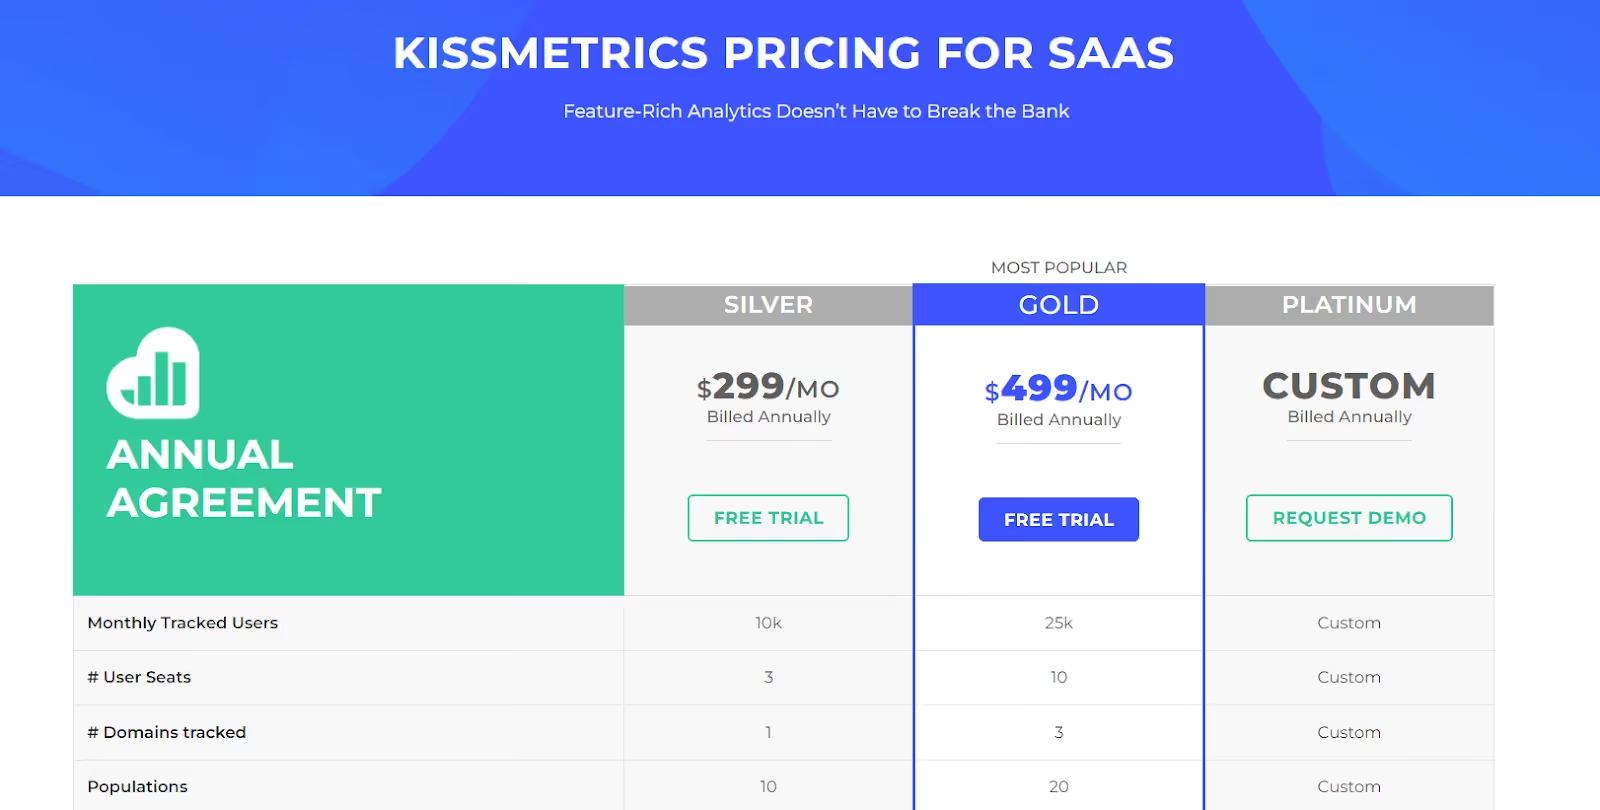
Pricing of Kissmetrics starts from $299/month to customizable according to the increase in the monthly tracked users.
{{INLINE_CTA_A}}
8. Contentsquare

Contentsquare is a cloud-based digital experience analytics tool that allows businesses to understand customer behavior and use that data to improve their experiences.
It captures and visualizes a wide range of data, including user clicks, scrolls, and navigation patterns, allowing businesses to understand how visitors engage with their digital properties and identify areas for improvement.
Key features
- Behavioral Analytics
Identify the how and why behind metrics, such as the number of clicks, page views, and click-through rates, by capturing every in-page interaction. Also, create user experiences that boost conversions and align future efforts with customer needs and goals based on these behavioral insights.
- Tagless integration
The feature captures content interactions automatically. It lets you analyze and prioritize data content pieces to focus on without having to rely on preplanned and configured event tags.
- Integration and APIs
Contentsquare integrates seamlessly with all major analytics tools and visualization suites. This allows you to bring the best insights on web analytics, A/B testing, Voice of Customer, APM, BI tools, and more.
Integrations
- Salesforce
- Google Analytics
- Adobe Analytics
- InMoment
- AWS
- Google 360 Analytics
Customer reviews
Pricing
There's no pricing information available on the website. Contact the Contentsquare team for more details.
{{INLINE_CTA_A}}
9. FullStory

FullStory is a platform that provides Digital Experience Intelligence (DXI) by combining product analytics, session detail, and collaboration tools. This helps you gain real-time insights to improve your web and mobile app experiences.
With FullStory, you can proactively monitor your website and digital products. This helps you to understand how users interact with your product or website using qualitative information. It also supports effective collaboration with your team, analyzes behavioral data, identifies opportunities for conversion, and creates impactful digital experiences.
Key features
- Conversion funnels:
The tool automatically tracks all user interactions and can identify areas of high engagement and spots where users drop off.
- Web Analytics:
The feature analyzes all key metrics in real-time to understand how users engage with the website or app. The monitored key metrics include engagement time, clicks, scrolls, and more.
Integrations
- Slack
- Shopify
- Salesforce
- Google cloud
Customer reviews

Pricing
They have three different plans, and you can contact the Fullstory team for the pricing details.
Mixpanel offers powerful analytics but comes with high costs, a steep learning curve, and limited support.
1. Challenges with Mixpanel: Expensive plans, complex setup, and limited support options.
2. Alternative Solutions: Teams are shifting to platforms that offer deep behavioral analytics with more flexibility and ease of use.
3. Strategic Fit: Choose a platform that aligns with your team’s workflow and analytical needs without compromising on functionality.
Find a solution that balances simplicity with robust analytics for more effective decision-making.
Conclusion
As a B2B marketer, you need the tools that really suit your business needs. Every tool has its own pros and cons. Whether you're looking for something with robust reporting capabilities or simply an affordable alternative to Mixpanel, you're sure to find something on this list that fits the bill.
At the end of the day, choosing the right marketing analytics tool can make all the difference in optimizing your business's performance. So, take the time to explore these alternatives and find the one that works best for you. Happy analyzing!

.avif)
On-Page SEO for B2B: Guide to SEO Content, Titles, URLs & Structure
A practical B2B on-page SEO guide covering titles, URLs, content clarity, technical structure, and keyword strategy.
TL;DR
- Strong on-page content prioritizes relevance, readability, and direct answers, especially in B2B, where buyer roles vary and time is limited.
- Titles, URLs, and meta descriptions shape first impressions, set expectations, and guide the right users to your content. Precision is non-negotiable.
- Technical SEO removes friction, enabling access, but rankings come from structure, keyword alignment, and problem-solving clarity.
- Look beyond sessions, track repeat visits, internal shares, and buyer engagement to understand real SEO impact.
If you ask ten marketers what ‘SEO-friendly’ means, you’ll get ten different answers.
Somewhere along the way, the term got reduced to checklists, plugins, and green dots in SEO tools. That’s part of the picture, but it’s no longer the point.
When I think about anything that’s supposed to be SEO-friendly, I think about clarity.
SEO-friendly content today is something that:
- Answers a real question someone is searching for
- Does so clearly, without forcing the reader to work for it
- Helps the reader decide what to do next
- Adds value to their existing knowledge
Search engines have grown up. They no longer reward pages simply because keywords appear in the right places. They reward pages that demonstrate understanding of the topic, the search intent, and the target audience.
What is on-page SEO?
On-page SEO is about making every single web page pull its weight in search. It’s the work you do on the page to help search engines understand what the page is about and when it should show up. This includes fundamentals such as title tags, meta descriptions, header tags, internal links, and the actual content ON the page. When these elements are aligned properly, search engines can clearly connect your page to relevant search queries, which directly improves search engine rankings, organic traffic, and overall online visibility.
In practice, on-page SEO is less about tweaking things in isolation and more about clarity. Clarity for search engines, yes, but even more importantly, clarity for real people. When someone clicks through to your page, they should instantly feel reassured that they’re in the right place. The headline should reflect what they searched for. The content should answer their question without making them scroll endlessly or decode jargon. And the structure should guide them naturally from one section to the next.
This is where search intent really comes in. Effective on-page SEO focuses on creating valuable content that matches users' immediate needs. Whether they’re looking for an explanation, a comparison, or a step-by-step guide, the page should deliver that experience cleanly and confidently. Your meta descriptions set expectations, your title tags establish relevance, and your headers make the content easy to scan and understand.
When all of this comes together, on-page SEO does more than help a page rank. It creates pages that feel intentional, useful, and trustworthy. Pages that bring in organic traffic, keep users engaged, and quietly build credibility over time. And that’s the real goal. Ranking is just the outcome.
| Two very common terms you should know before we read ahead… if you already know this, feel free to skip this section :) |
|---|
| A. Keyword Research and Planning Keyword research is the literal base of any solid SEO content strategy. It’s how you understand what your audience is actually typing into search engines, not what you think they’re searching for. By doing proper keyword research, you get visibility into search volume, competition, and, most importantly, the intent behind specific search queries. This step ensures your content aligns with real demand in the search engine results pages, not assumptions. Good keyword research is all about finding the right balance between relevance, opportunity, and intent (and getting traffic… duh?!). The goal is also to identify keywords that make sense for your business and naturally fit into the problems your audience is trying to solve. A high-volume keyword that doesn’t match your offering rarely delivers meaningful organic traffic. That’s where keyword planning comes in. Tools such as Google Keyword Planner, Ahrefs, and SEMrush help you evaluate which keywords are worth prioritizing based on competitiveness and potential impact. Long-tail keywords deserve special attention here. These more specific phrases usually face lower competition and often attract users who already know what they want, making them far more likely to engage or convert. When done well, keyword research helps you plan content with purpose (and everything in life should have a purpose, right?). It gives structure to your editorial calendar, guides how pages are written, and ensures every piece of content has a clear role in driving visibility. Instead of publishing randomly, you’re building a content strategy designed to rank, resonate, and perform consistently in search results. B. Content Strategy A strong content strategy is what turns SEO from an item in your to-do list into a system. It’s not about publishing for the sake of staying “consistent” or hitting a blog quota. It’s about knowing what you’re creating, who it’s for, and why it deserves to exist in the first place. At its core, a good content strategy is built around search intent, so every piece you publish has a clear role in attracting organic traffic and delivering real value. The starting point is clarity. You map out topics your audience genuinely cares about and choose formats that serve those topics best. Sometimes that’s an in-depth guide. Sometimes it’s a practical how-to blog post. Other times, it’s industry insights that help your reader make sense of what’s changing. The format should support the intent, not the other way around. From there, SEO becomes an enabler, not a constraint. Every piece of content should be thoughtfully optimized with keyword optimization, well-written meta tags, and internal links that connect related pages together. This helps search engines understand how your content fits into a larger ecosystem, while also making it easier for users to navigate and explore further. Measurement matters just as much as creation. Tools like Google Analytics and Google Search Console show you what’s ranking, what’s getting clicked, and where users are dropping off. These insights help you refine your content strategy over time instead of guessing what might work. When done right, a content strategy creates momentum. You’re not just chasing Google search rankings. You’re building trust, authority, and engagement with every piece you publish. And as that foundation strengthens, organic traffic follows naturally, bringing in results that compound long after the content goes live. |
Here are a few key points to remember about SEO-friendly content
- SEO-friendly is about intent, not tricks
Breaking News: Nobody wakes up thinking, “Omgggg, I want to consume SEO content today.” They’re just trying to solve something.
In B2B, that usually sounds like:
- Why isn’t this blog ranking?
- What exactly do I need to fix on this page?
- Is this worth updating, or should we rewrite it?
An SEO-friendly page makes the answer obvious. It doesn’t bury the lede. It doesn’t ramble for the sake of word count. It respects the reader’s time.
I’ve worked on sites where traffic increased simply because we rewrote pages to be more direct, same topic, exact keywords, and clear structure. No new backlinks. No technical overhaul. Just better alignment with intent.
- Content clarity matters now more than ever
Clarity has become a ranking signal, even if Google doesn’t call it that explicitly.
Clear pages:
- Use straightforward language
- Break complex ideas into sections
- Make it easy to scan before committing to read
This matters because modern buyers don’t read the way we read textbooks back in the day. They skim, jump, scroll, and return later. If your content only makes sense when read top to bottom in one sitting, it’s working against how people actually behave.
SEO-friendly content meets readers where they are, half-focused, slightly distracted, and trying to get an answer fast.
- Buyer relevance is the B2B differentiator
This is where B2B SEO diverges sharply from generic advice.
Your audience isn’t a single person. It’s often:
- A marketer researching
- A manager validating
- A leader deciding
Each of them lands on your page with different expectations. SEO-friendly content acknowledges that by:
- Framing the problem clearly
- Providing depth where it matters
- Avoiding filler content
Long sales cycles mean your content may influence decisions weeks or months later. That’s why SEO in B2B is rarely about instant conversions. It’s about being helpful at the exact moment someone needs clarity.
| A simple test I always use before calling a page SEO-friendly: |
|---|
| Before I call a page SEO-friendly, I ask myself one question: “If I landed on this page from Google, would I trust it enough to share it internally?” If the answer is no, something’s off, usually structure, clarity, or relevance. ‘SEO-friendly’ isn’t about pleasing algorithms in isolation (okay, it might be a little bit of that)… but it is also about creating pages that make sense to humans first and give search engines clear signals in the process. |
{{INLINE_TOFU}}
On-Page SEO vs On-Page Technical SEO
This is one of those distinctions that sounds obvious once you understand it, but causes endless confusion in practice. I’ve seen teams argue about SEO priorities for weeks simply because they were talking about two different things without realizing it.
So let’s draw a clean line.
What does on-page SEO actually cover?
On-page SEO is everything you intentionally design on a page to help both search engines and readers understand it.
That includes:
- Page titles and meta descriptions
- URLs and slug structure
- Content quality, depth, and structure
- Header tags (H1, H2, H3…)
- Internal linking and anchor text
This is the layer where meaning lives. It’s where you decide what the page is about, who it’s for, and how clearly that comes across.
When people talk about an on-page SEO checklist, this is usually what they mean.
What does on-page technical SEO focus on?
On-page technical SEO deals with whether a page can be accessed, rendered, and understood properly by search engines.
This includes:
- Page speed and performance
- Mobile responsiveness
- Indexability and crawl signals
- Canonical tags
- Clean HTML and basic technical hygiene
This layer doesn’t create meaning. It removes friction.
If technical SEO is broken, great content struggles to surface. If technical SEO is solid, content has a fair shot.
Here’s why B2B teams get this balance wrong
I see this all the time in B2B companies… when a site underperforms in search.
The instinctive response is to:
- Run a technical audit
- Fix dozens of low-impact warnings
- Chase perfect performance scores
Meanwhile, the actual pages:
- Don’t clearly answer search intent
- Bury important information halfway down
- Use vague language that sounds impressive internally but unclear externally
The result? A technically sound site that still doesn’t rank for the queries that matter.
I’ve worked on B2B blogs where rankings improved after we rewrote headlines, restructured sections, and clarified positioning, without touching the technical setup at all.
But here’s how you should think about priorities
If you’re early in your SEO journey, prioritize in this order:
- Content clarity and intent alignment
- Page structure and internal linking
- Basic technical hygiene
Technical SEO supports on-page SEO. It doesn’t replace it.
Once the foundation is strong, technical improvements compound results. But without clear content and structure, technical fixes rarely move the needle on their own.
| Here’s a simple way to learn this: |
|---|
| I would explain it like this: • On-page SEO answers “What is this page saying, and to whom?” • On-page technical SEO answers “Can this page be accessed and understood without friction?” Both matter… but if your content doesn’t earn attention, speed and crawl-ability won’t save it. |
SEO Page Titles: Best Practices (that still work)
If I had to pick one on-page SEO element that punches far above its weight, it’s the page title.
You can have solid content, clean URLs, and decent internal links, but if your title doesn’t earn the click, none of that matters. The title is your first impression in search results… and in B2B, first impressions decide whether someone even gives you a chance.
What is an SEO title? And why does an SEO title matter so much?
An SEO page title (often called a title tag) is the clickable headline that appears in Google search results and in the browser tab.
It serves two audiences at once:
- Search engines use it to understand what the page is about
- Humans use it to decide whether to click
It’s not a creative writing exercise… it’s a relevance signal.
So, what do the best SEO titles have in common?
Across hundreds of B2B pages I’ve worked on, the best SEO title formats consistently share a few traits.
- Clear keyword placement
Your primary keyword should appear naturally, preferably toward the beginning. This helps with relevance and visibility, especially on a mobile where titles get cut off. - Clarity over cleverness
Internal teams love clever titles. Searchers don’t. If someone can’t immediately tell what the page offers, they move on. - A reason to click
The title should hint at value: a checklist, a comparison, a framework, or a specific outcome.
For example:
Strong B2B title:
On-Page SEO Checklist for B2B: Titles, URLs, Content & More
Weak B2B title:
The Ultimate Guide to On-Page SEO You’ll Ever Need
One tells you exactly what you’ll get. The other sounds impressive but says very little.
How long should an SEO page title be?
The practical limit is around 50–60 characters. Anything longer risks truncation in search results.
This is where prioritization matters. Don’t try to cram everything in. Choose clarity over completeness.
If the title gets cut off, you lose context, and often the click.
Here are some common SEO title mistakes
These show up even on well-funded B2B sites:
- Duplicate titles across multiple pages
- Over-optimized titles stuffed with variations
- Titles written for internal decks, not search behavior
- Missing differentiation between similar pages
Another subtle issue: Titles that make sense only if you already know the product. Searchers don’t have that context yet. How will they search for the fifth feature from your third product launch?
| Here’s how I write SEO titles: |
|---|
| I start with three questions: 1. What is the exact query this page should rank for? 2. What would someone expect to see after clicking? 3. Can this be understood in five seconds or less? (Try to use the primary keyword in the H1/ title) If the title passes those, it’s usually strong enough to perform. Titles are the only places where you don’t need to add personality. But you DO need to add precision… because in on-page SEO, precision compounds. |
SEO Descriptions: What Matters (and what doesn’t)
Meta descriptions don’t get nearly as much attention as titles, and that’s partly because they don’t directly affect rankings. But in practice, they decide who clicks and who doesn’t. And in B2B, that distinction matters a lot more than raw traffic.
What is an SEO description?
An SEO description is the short summary that appears below your page title in search results.
If the title earns the glance, the description earns the click.
Search engines don’t use meta descriptions as a ranking signal. People do. That’s why understanding what is SEO description is still very relevant in modern on-page SEO.
What SEO descriptions are actually responsible for
Think of your meta description as a filter.
A good one:
- Confirms relevance for the searcher
- Sets expectations for what the page contains
- Discourages the wrong clicks
That last part is especially important in B2B. You don’t want everyone clicking. You want the right people clicking, those who are actually looking for what you’re offering.
I’ve seen pages lose conversions after a traffic spike simply because the description promised something the page didn’t deliver.
How to write SEO descriptions that work in B2B?
Strong SEO description copy usually has three elements:
- Intent alignment
The description mirrors the language and urgency of the query. If someone is looking for a checklist, say it’s a checklist. If they’re looking for an explanation, make that clear. - Context and scope
Let readers know what’s included. B2B buyers don’t want surprises after clicking. - Subtle qualification
Phrases like “for B2B marketers,” “for SaaS teams,” or “for growing companies” help filter your audience naturally.
Example:
A complete on-page SEO checklist for B2B marketers covering titles, URLs, content structure, internal linking, and technical fixes.
It’s clear, specific, and sets the right expectations.
So, how long should SEO descriptions be?
Aim for 140–155 characters. Shorter is fine if the message is clear. Trying to fill every character often leads to fluff. Precision beats length here.
Why does Google (sometimes) rewrite your descriptions?
This confuses a lot of people.
Google rewrites meta descriptions when:
- They don’t match the query being searched
- They’re too generic or vague
- They repeat content from other pages
- The on-page copy offers a clearer summary
Don’t think of this as a penalty, take it as feedback.
When I see frequent rewrites, I usually revisit to see whether the:
- Description reflects actual page content
- Page is trying to rank for too many intents
- Description sounds like marketing copy instead of an explanation
What doesn’t matter as much as people think…
- Keyword stuffing in descriptions
- Writing ‘catchy’ copy at the cost of clarity
- Trying to rank using meta descriptions
Descriptions don’t need to impress… they need to reassure people (and Google) that something valuable lies on the other end.
SEO-Friendly URLs: Structure, Length, and Keywords
URLs are one of those things people set once and then forget about. That’s fine when they’re done well. When they’re not, they quietly undermine everything else you’re doing with on-page SEO.
An SEO-friendly url should make sense to three audiences at once: search engines, humans, and future you.
What makes a URL SEO-friendly?
At its core, an SEO-friendly URL is:
- Easy to read
- Easy to understand
- Clearly connected to the page topic
You should be able to look at the URL and know what the page is about without opening it.
If that’s not true, it’s worth fixing.
URL structure best practices:
These are the rules I follow almost obsessively:
- Keep it short and descriptive
Long URLs with unnecessary words dilute meaning and make search results look messy. - Use lowercase letters
Consistency matters, and lowercase avoids duplication issues. - Separate words with hyphens
Hyphens are easier to read and preferred by search engines. - Avoid parameters and IDs for content pages
They add no value for users and often create indexing issues. - Include keywords naturally
If your page targets ‘on-page SEO checklist,’ the URL should reflect that.
Example:
- Good: /blog/on-page-SEO-checklist
- Bad: /blog/2025/SEO-post-final-v3
Why URLs matter more than you think
URLs influence:
- Click-through rates from search
- Trust at first glance
- Internal linking clarity
- Shareability across teams
In B2B especially, links get shared internally in Slack, emails, and docs. Clean URLs feel intentional. Messy ones feel like drafts.
I’ve seen buyers hesitate simply because a link looked confusing or temporary. That hesitation compounds.
URL conventions for B2B content
Consistency helps both users and search engines.
Some patterns that work well:
- Blogs: /blog/topic-name
- Guides: /guides/topic-name
- Comparison pages: /compare/product-a-vs-product-b
- Resources: /resources/topic-name
Once these conventions are in place, your site becomes easier to navigate and easier to scale.
When to change an existing URL
Changing URLs should be done carefully, but avoiding it forever isn’t the answer either.
Consider updating a URL when:
- It’s clearly not descriptive
- It contains dates or versioning
- It no longer reflects the page focus
Always use proper redirects. The goal is improvement, not disruption.
| Quick pre-publishing tip: |
|---|
| Before publishing, I ask: “Would I feel comfortable pasting this URL into a client email?” If the answer is no, the URL needs work. |
Content for SEO: How to Write Pages That Rank and Convert
This is where most on-page SEO advice becomes vague or contradictory. You’ll hear things like “write for humans” or “create high-quality content” and be left wondering what that actually looks like when you’re staring at a blank doc.
Here’s how I think about content for SEO, especially in B2B.
SEO content works when it helps someone move from confusion to clarity. Conversion happens when that clarity builds trust.
- SEO-based content vs content that actually helps
A lot of SEO based content technically checks the right boxes:
- Keywords are present
- Word count looks healthy
- Headings exist
And yet, it doesn’t perform.
Why? Because it was written to satisfy an algorithm instead of a person.
Content that ranks and converts usually does a few things well:
- It frames the problem immediately
- It answers questions in a logical sequence
- It anticipates follow-up doubts
- It doesn’t make the reader work to understand the point
When someone lands on your page from search, they’re asking, “Am I in the right place?” Your content needs to answer that within seconds.
- Start with the problem, not the explanation
One mistake I see often in SEO blog writing is starting with definitions and background before acknowledging why the reader is there.
In B2B, the reader usually arrives with context. They don’t need a lecture. They need help.
Strong content SEO usually opens by:
- Naming the exact problem
- Acknowledging the frustration
- Setting expectations for what the page will cover
Once the reader feels understood, they’re far more likely to stay for the explanation.
- Structure matters as much as substance
Great content loses impact if it’s hard to navigate.
I structure SEO content assuming:
- The first read is a skim
- The second read is selective
- The third read is intentional
That’s why structure matters:
- Clear section headers
- Short paragraphs
- Bullet points where appropriate
- Visual breaks between ideas
This point is really just about respecting how people actually read.
- Writing for SEO and humans at the same time
The tension between SEO and content is often overstated.
When you:
- Answer the query clearly
- Use natural language
- Cover the topic comprehensively
- Organize information logically
You end up with content that search engines understand and humans appreciate.
That overlap is where the best B2B content lives.
Also, remember that conversion is NOT always a form fill
In B2B SEO, conversion often looks like:
- Someone bookmarking the page
- Sharing it internally
- Returning later to a different page
- Trusting your brand a little more than before
Not every page needs a CTA screaming for attention. Some pages exist to do quiet persuasion. That still counts.
| Here’s a personal rule I follow: |
|---|
| Before I consider a piece of SEO content done, I ask: “If this showed up as the top result, would I feel relieved?” If the answer is yes, it’s usually strong enough to rank and convert over time. |
SEO Keyword Optimization Without Keyword Stuffing
This is the section where many first-time SEO writers get nervous. Keywords feel technical, rigid, and easy to mess up. And honestly, a few years ago, that fear was justified.
Today, SEO keyword optimization is far more strategic and far less mechanical.
Here’s how keyword optimization actually works now
Modern keyword optimization starts before you write a single sentence.
The real work happens when you decide:
- What this page is about
- Which query it should rank for
- What related concepts naturally belong on the page
That’s why every strong page needs:
- One primary keyword
- A set of secondary and semantic keywords
- A clear scope so the page doesn’t try to do everything at once
In this case, the primary keyword is on-page SEO checklist. Everything else supports that idea.
So, where should keywords appear naturally?
You don’t need to force keywords everywhere. You do need to place them where meaning is formed.
Natural keyword placement includes:
- The page title
- The H1
- One or two H2s (wherever relevant)
- The opening section
- Body copy where it fits logically
- Internal link anchor text
If you’re writing clearly, most of this happens on its own.
When I see someone asking “how many times should I use the keyword,” it’s usually a sign the content doesn’t have a strong structure yet.
Primary vs Secondary Keywords
Primary keywords define the page.
Secondary keywords:
- Add context
- Capture variations
- Help search engines understand depth
For example, phrases like SEO-friendly content, SEO page title, or SEO blog writing naturally belong in a guide like this. They don’t need to be forced into every paragraph. They just need to appear where they make sense.
Is the concept of keyword density outdated?
Keyword density was useful when search engines relied heavily on repetition to infer relevance. That’s no longer the case.
Today, excessive repetition:
- Hurts readability
- Feels unnatural
- Signals low-quality writing
Search engines look at context, phrasing, and topic coverage. If you explain something well, the keywords tend to appear organically.
| Here’s how I sanity-check keyword usage: |
|---|
| After writing a section, I scan it with one simple question in mind: “Would a human notice the keyword usage and find it weird?” If the answer is yes, I usually rewrite. Good keyword optimization blends into the content. It shouldn’t call attention to itself. |
SEO Tagging: Best Practices
SEO tagging is one of those areas where small mistakes quietly add up. Individually, they seem harmless. Collectively, they make pages harder to read, harder to navigate, and harder for search engines to interpret.
Good tagging creates structure. Bad tagging creates friction.
- Header tags to create a clear content hierarchy
Let’s start with the basics.
Every page should have:
- One H1 that clearly states what the page is about
- H2s that break the page into logical sections
- H3s (and beyond) that support those sections where needed
This hierarchy helps:
- Readers understand the flow at a glance
- Search engines map the structure of the page
A common mistake I still see is using headers for visual styling rather than structure. Headers aren’t there to make text bigger. They’re there to organize meaning.
- Proper H1 usage
Your H1 should closely mirror your page title, but it doesn’t need to be identical.
It should:
- Contain the primary keyword
- Clearly describe the page topic
- Appear only once
Multiple H1s dilute focus and confuse both readers and crawlers.
- Image tagging and alt text
Images add value when they explain, illustrate, or break monotony. From an SEO perspective, they also need context.
Alt text should:
- Describe what’s in the image
- Explain its relevance to the content
- Be written for accessibility first
Stuffing keywords into alt text doesn’t help. Clear descriptions do.
I often think of alt text as explaining the image to someone who can’t see it. That mindset keeps it honest.
- Link tagging and anchor text
Links are another area where tagging matters more than people realize.
Good anchor text:
- Describes what the reader will find
- Fits naturally into the sentence
- Avoids vague phrases like ‘click here’
Anchor text gives search engines context and helps users decide whether to follow the link. Poor anchor choices break flow and reduce trust.
- External links and credibility
Linking out to relevant, credible sources signals depth and context. It also helps readers explore further without you needing to explain everything from scratch.
What matters:
- Relevance to the topic
- Natural placement
- A reasonable balance
External links don’t weaken your page… instead they strengthen it.
Here’s why poor tagging hurts more than you think
When tagging is inconsistent:
- Readers struggle to skim
- Search engines struggle to understand relationships
- Accessibility suffers
Good SEO tagging best practices improve usability first, and obviously, rankings benefit as a result.
Internal Linking for On-Page SEO
Internal linking rarely gets the credit it deserves. It doesn’t feel flashy, and it doesn’t come with instant gratification. But over time, it shapes how both readers and search engines experience your site.
Internal links also help turn isolated B2B blog posts into a connected system.
Why do internal links matter for on-page SEO?
Internal links help with three big things:
- Discovery: Search engines find and crawl more of your content
- Context: Pages understand how they relate to each other
- Navigation: Readers move naturally from one topic to the next
Without internal links, even great content can feel like a dead end.
I’ve seen sites with hundreds of solid blogs where most of them barely got traffic simply because nothing pointed to them.
How do internal links influence rankings?
Internal links pass relevance and authority across your site. When a strong page links to another relevant page, it’s effectively saying, “This matters too.”
That signal compounds over time.
The key is relevance. Random links don’t help. Contextual links do.
Best practices for internal linking
These are the rules I follow consistently:
- Link contextually within the content
Links placed naturally inside paragraphs perform better than lists dumped at the bottom. - Use descriptive anchor text
Anchor text should tell readers what they’ll find. Vague phrases don’t add value. - Link with intent
Each link should have a reason, supporting a point, expanding an idea, or guiding the reader forward. - Avoid over-linking
More links aren’t better. Clear links are.
Topic clusters make internal linking easier
One of the simplest ways to improve internal linking is to think in clusters.
For example:
- A core page on on-page SEO
- Supporting pages on titles, content, technical SEO, and measurement
Each page links back to the core topic and to related subtopics. Over time, this builds authority around a theme instead of spreading it thin.
Internal linking for B2B buyer journeys
Internal links also guide buyers across stages:
- Awareness content links to deeper explanations
- Educational pages link to comparison or evaluation content
- Decision-stage pages link back to supporting proof
Just know that internal linking is about helping someone learn at their own pace, not pushing them to empty their pockets.
| A quick internal linking check: |
|---|
| I often ask: “If someone lands on this page, is it obvious where they should go next?” If the answer isn’t clear, internal links need work. |
On-Page Technical SEO Checklist (Quick Wins)
Technical SEO has a reputation for being overwhelming.
Excruciatingly long audits, scary terminology, endless ‘errors’ that don’t always translate to impact.
For most teams, that overwhelm leads to one of two outcomes: ignoring technical SEO entirely or obsessing over every minor warning.
Neither helps.
This section is about on-page technical SEO quick wins, the things that genuinely affect how your content performs and how people experience your site.
- Page speed: Fast enough beats perfect
Page speed matters because humans notice it. If a page takes too long to load, people bounce. That behavior feeds back into how search engines evaluate usefulness.
What’s worth checking:
- Does the page load quickly on mobile?
- Are images unnecessarily large?
- Are scripts delaying visible content?
What’s usually not worth stressing over:
- Chasing a perfect PageSpeed score
- Micro-optimizations that don’t change real load time
I’ve seen pages rank and convert just fine with ‘average’ scores because they felt fast to users. That’s the bar.
- Mobile friendliness is non-negotiable
Most B2B research still happens on laptops, but discovery often starts on phones.
Your page should:
- Be readable without zooming
- Have tap-friendly links
- Avoid layout shifts that make reading annoying
If someone opens your page on mobile and immediately closes it, that’s a signal you can’t afford to ignore.
- Indexability: Can Google actually find this page?
This sounds basic, but it trips teams up more often than you’d expect.
Double-check:
- The page isn’t blocked by robots.txt
- The page isn’t marked “noindex” accidentally
- The canonical tag points to the correct version
I’ve seen entire content hubs fail simply because pages weren’t indexable. No amount of optimization helps if search engines can’t access the page.
- Canonicals: Keeping signals clean
Canonical tags tell search engines which version of a page should be treated as the primary one.
They matter when:
- Similar pages exist
- Parameters create multiple URLs
- Content overlaps across sections
Incorrect canonicals quietly drain rankings by splitting authority. Correct ones consolidate it.
What’s noise for most B2B sites
Most B2B teams don’t need to:
- Fix every minor HTML validation issue
- Obsess over edge-case crawl warnings
- Rebuild pages for marginal performance gains
Technical SEO should remove friction, not create anxiety.
| A simple prioritization rule I follow: |
|---|
| I ask one question: “Does this issue block reading, crawling, or indexing?” If the answer is no, it’s usually not urgent. |
How to Validate SEO-Friendly Content
Validation is the step most teams rush through. A page gets written, a plugin gives a green signal, and it’s published. Weeks later, when performance is underwhelming, everyone wonders what went wrong.
Validating SEO-friendly content needs both tools and human judgment. One without the other leads to blind spots.
Here are some points to keep in mind while validating SEO-friendly content:
- Using an SEO-friendly content checker responsibly
An SEO-friendly content checker is useful for catching obvious issues:
- Missing title or meta description
- Overly-long titles
- Broken links
- Header structure problems
- Keyword absence in key locations
These tools are good for hygiene. They are not good at assessing clarity, relevance, or usefulness.
I treat them like spellcheck… It’s helpful, but not decisive.
- Your tools might not solve for EVERYTHING
Tools struggle with:
- Intent mismatch
- Over-explaining obvious things
- Talking past the reader
- Sounding generic or templated
A tool won’t tell you if a paragraph feels unnecessary or if a section answers the wrong question. Only a human can do that.
- Use SEO keyword generators early in the process
This helps with:
- Understanding how people phrase problems
- Spotting variations and related terms
- Avoiding missing obvious angles
It shouldn’t dictate structure or copy. Strategy comes first. Automation supports it.
Here’s a pre-publish validation checklist I actually use
Before hitting publish, I review the page with these questions:
- Does the opening clearly state what the page covers?
- Is the primary keyword present naturally in key places?
- Can someone skim this and still understand the main points?
- Do the headers flow logically?
- Are there clear internal links to related content?
- Does the page feel complete, not padded?
If I hesitate on any of these, I revise.
| Don’t miss this important validation step: |
|---|
| This one is simple and underrated… I scroll the page without reading it word for word. If the structure alone doesn’t make sense, the content won’t perform well. Search engines read structure before nuance. Humans do too. Validation is all about removing friction before it compounds. |
Measuring On-Page SEO Impact in B2B (Beyond Traffic)
This is where on-page SEO either earns respect or gets dismissed as ‘just traffic.’
If the only thing you measure is sessions and rankings, SEO will always feel disconnected from business impact, especially in B2B, where buying journeys are long, messy, and rarely linear.
I’ve learned this the hard way… I’ve seen blogs ranking #1, bringing in thousands of visits, and doing absolutely nothing for pipeline. What’s more, I’ve also seen quiet pages with modest traffic consistently show up in deal journeys months later.
Now, the difference is not always the content, it’s how success was measured.
Here’s why traffic and rankings aren’t enough
Traffic tells you all about visibility. Rankings tell you positioning. Neither tells you value.
In B2B, a single relevant visitor can matter more than a hundred irrelevant ones. Someone researching seriously may:
- Visit once
- Leave
- Return weeks later
- Influence a decision internally without ever filling a form
If you only look at surface-level metrics, you miss all of that.
Metrics that actually matter for on-page SEO in B2B
Here’s what I pay attention to instead.
- Engaged visits
Time on page, scroll depth, repeat visits. These indicate whether the content is genuinely useful. - ICP-fit traffic
Are the right companies and roles visiting these pages? Volume without fit is noise. - Content-assisted journeys
Which pages show up before demo requests, contact forms, or sales conversations? - Return behavior
Pages that people come back to are doing more than ranking, they’re building trust.
So, how does on-page SEO contribute to pipeline?
SEO rarely closes deals on its own.
But what it does exceptionally well is:
- Educate early
- Validate mid-journey
- Support decisions quietly
That influence shows up over time, not instantly.
When teams start looking at SEO pages as part of buyer journeys instead of standalone assets, the conversation changes. Suddenly, updates, rewrites, and internal linking feel worth the effort.
Connecting SEO to revenue influence
This is where tools like Factors.ai change the game.
Instead of asking:
- “Did this blog convert?”
You can ask:
- “Which companies read this before entering pipeline?”
- “Which pages consistently show up in influenced deals?”
- “How does organic content support other channels?”
This shift from channel metrics to buyer behavior, makes SEO measurable in a way leadership understands.
| Here’s something that helps me evaluate whether on-page SEO worked: |
|---|
| I stopped asking whether a page ‘worked’ in isolation. I started asking: Did this page help someone move forward or learn something? That’s the real impact of on-page SEO in B2B. |
In a Nutshell
The traditional view of on-page SEO, defined by checklists, tools, and surface-level optimizations… no longer holds weight in modern B2B strategy.
This guide looked at SEO as a clarity-first discipline, where the real performance drivers are clear content, aligned search intent, and meaningful structure. We broke down the anatomy of SEO-friendly pages: precise titles that earn the click, meta descriptions that filter the right audience, URLs that signal relevance, and body content that helps readers solve real problems.
Importantly, it challenged the overreliance on technical audits and green lights, advocating human-first validation and iterative refinement.
We learnt how to optimize keyword placement without stuffing, write for distracted buyers who skim and scroll, and use internal linking to support deeper engagement. The guide also drew a difference between on-page SEO and technical SEO, urging teams to focus first on clarity before chasing performance scores. In B2B, where buying journeys are long and conversions are rarely linear, SEO must be measured by influence, not just rankings. The approach highlighted in this blog connects search performance to buyer behavior, where every click, revisit, and internal share carries weight.
FAQs for On-Page SEO Checklist
Q. What is included in an on-page SEO checklist?
A solid on-page SEO checklist covers everything you can control directly on a page. That includes:
- Page titles and meta descriptions
- SEO-friendly URLs
- Content structure and clarity
- Keyword placement and optimization
- Header tags (H1–H6)
- Internal links
- Image alt text
- Basic on-page technical signals like indexability and mobile usability
If a checklist skips content clarity or internal linking and focuses only on tools and tags, it’s incomplete.
Q. How often should you update on-page SEO?
For most B2B sites:
- Core pages (guides, product pages, high-intent blogs): review every 3–6 months
- Supporting blogs: review annually or when rankings drop
I usually revisit pages when:
- Search intent shifts
- Competitors start outranking us
- The content feels outdated or overly verbose
On-page SEO is not a one-time task. It compounds when maintained.
Q. Is on-page SEO still relevant with AI search?
Yes…arguably more than before.
AI-driven search still depends on:
- Clear structure
- Explicit answers
- Well-organized content
- Strong topic relevance
Pages that are vague, bloated, or poorly structured are harder for AI systems to summarize or reference. Clean on-page SEO improves discoverability across traditional search and AI-powered experiences.
Q. How long does on-page SEO take to show results?
It depends on your site authority, competition, and consistency, but broadly:
- Engagement improvements: a few weeks
- Ranking movement: 1–3 months
- Business impact: 3–6 months
In B2B, patience matters. SEO influence often shows up indirectly before it shows up directly.
Q. What’s the difference between SEO content and regular content?
Regular content focuses on expression. SEO content focuses on discovery and clarity.
SEO content:
- Answers a specific query
- Uses structure intentionally
- Anticipates follow-up questions
- Is designed to be found, not just read
The best SEO content doesn’t feel optimized. It feels helpful.

Optimizing ABM with Revenue Attribution
Learn how to improve your ABM strategy with revenue attribution. Understand which tactics drive revenue & optimize your campaigns. Read more on Factors.ai.

In an age where the functionality of the B2B marketing landscape becomes increasingly volatile, account-based marketing (ABM) and Revenue Attribution rise to the occasion. The adoption of ABM as an alternative to traditional demand generation is becoming progressively prevalent in the B2B space. Despite its increased use in recent times, the conception of several new and complex channels is promoting the need for ABM practitioners to be able to appraise their investments and optimise their ABM strategies. The incorporation of Revenue attribution in account-based marketing deciphers this challenge.
Understanding Account Based Marketing
What is ABM?
Account-based marketing or ABM is a strategic marketing approach wherein marketing resources and campaign efforts are directed towards targeted/key customer accounts. More specifically, ABM earmarks Ideal Client Profiles (ICPs) that would generate the most revenue.
ABM is known to be collaborative in nature, as most functional ABM efforts work in conjunction with other teams such as sales, operations, customer success, etc. This collaborative work is done during the earlier and final stages of ABM, the former of which involves scrutinizing your target accounts by soliciting the data (i.e. profitability, ACV, retention rates of customers, technographic characteristics etc) in order to build your ideal customer profile. With this data, one can identify target accounts as well as target contacts within those accounts.
While businesses *could* work with this list of prospects, most marketers further compartmentalize these accounts and contacts into tiers that rank prospects based on ratings assigned for revenue potential. This, ultimately, would help distinguish your marketing approaches — one-to-one, one-to-few, and one-to-many etc.
The final stages of ABM involve engaging with your preferred accounts. What’s important here is that you integrate other prominent teams like sales, customer success, and operations to ensure an aligned execution of efforts.
When is ABM Necessary?
Given the sheer magnitude of money, time, research, and personal campaigns invested into ABM, generating an ROI for your ABM strategy necessitates its investment. The problem is that the efficacy of your marketing efforts will not be the same for all key accounts, but that’s obvious. What’s noteworthy here is that your marketing efforts on key accounts should have the lowest risk and the highest viability. This however only becomes feasible depending on the quantity and mostly the quality of the target market. The higher the number of key accounts available to target, and the better the revenue potential of each key account, the more suitable ABM will become for your targeted accounts. There are a couple of ways in which you can measure this:
- Measuring the annual contract value of your key accounts will help gauge the potential ROI if you were to use ABM, the higher the better your ROI.
- For account quantity, a larger number of key accounts accumulated is preferable — if ABM is your main/exclusive marketing strategy — as they increase the probability of lead generation per account.
- The TAM or total addressable market will help you gauge if your target market is too broad or narrow for a manageable audience for personalized marketing efforts, the smaller the size of the TAM the more serviceable the personalized engagement becomes.
The Relevance of ABM
While account based-marketing is not a novel strategy, its emergence over the last couple of years has been excellent thanks to its adaptation to technology, automation, and the utilisation of tools by an increasing number of businesses. Enabling better synergy for its collaborative prospects as discussed earlier.
As of 2021, over 70% of marketers reported the use of ABM, 15% of whom grew from the previous year alone.This is owing to an overhaul of your standard marketing approaches partly as a consequence of the global pandemic causing a loss in value for traditional lead generation and volume-oriented targeting. What made ABM stand out is its versatility and its adaptability to its customer needs. This is because ABM focuses more on quality than the quantity of your broader customer base. Prioritising retention and marketing efforts on their targeted accounts instead of a broader miscellaneous customer base that would have a higher chance of disqualification. The businesses that utilised ABM before and during the COVID-19 outbreak, adapted to the changes — relating to industries like tourism and food service that took a hit based on PD — by reconstructing their key accounts and ideal customer profiles based on new factors, showcasing its versatility and popularity in choice in a changing economic climate.
Attributing ABM
How does Revenue Attribution enhance ABM?
The following are ways in which revenue attribution can help overcome some of the shortcomings of ABM and maximise its utility in practice:
Measuring ABM Activities and Tracking ROI:
One of the core principles of ABM is that it prioritises and invests in appeasing your best revenue-generating key accounts through personalised engagement programs, this warrants the need to measure the engagement and campaign’s success. A common challenge in ABM and legacy ABM tools is that they fail to provide these insights. That being said, the utilisation of revenue attribution and attribution models accommodates this need as it provides insights into what channels drive revenue and can highlight poor performing channels and campaigns throughout all your key accounts’ pipelines. Tracking your account-based campaign’s ROI, and optimising your customer acquisition cost through those insights are all part of its preliminary functions. Not to mention, identifying a reliable cost per lead (CPL), allowing ABM practitioners to set a more practical CPL limit on their channels for their key accounts.
Key Account Mapping:
The steps involved in an ABM strategy are complex, yet straightforward. Your plan of action is to identify your ideal customer profile (ICP) and use that as a blueprint to locate your key accounts. But what about the people or stakeholders within an account? — 75% of ABM practitioners can’t find the right contacts at companies matching target profiles. And along comes the next challenge. How do we identify the stakeholders involved in the buying process? The solution to this problem involves rigorous research into key accounts and organisational structure. Revenue attribution embellishes this process thanks to its sheer detail in the compartmentalisation of the customer journey by analysing several touchpoints mapping out a multi-stakeholder journey. Highlighting all the stakeholders involved in the buying process, which will facilitate better planning by engaging with the right stakeholders and the optimisation of campaigns based on these insights.
Incorporating Data Attribution in ABM:
The incorporation of data attribution facilitates the ability to measure the impact of account-based activity over the lifecycle of your key accounts or customers and help increase the productivity of these activities. Identifying the right data using a few metrics will make it possible to understand if you have targeted the right accounts. For example, the progression rate and pipeline velocity will illustrate the rate or speed at which your MQL or marketing qualified leads among your key accounts move through the pipeline in their life cycles. But before doing so, it is imperative to associate the right data with your attribution. A lot of the data solicited through various touchpoints are unstructured, identifying intent and buyer interest using metrics such as bounce rate, click-through rate, lead conversion rate, etc., are all essential in data attribution.
Aligning Sales and Marketing:
The functionality of ABM is highly dependent on the collaborative efforts of various teams involved in the approach, especially the sales team. 42% cannot effectively run their ABM program as they find it difficult to align their sales and marketing teams. Meanwhile 86.7% of marketers that utilize multi-touch attribution state that they have a good relationship with their sales team. Why is this? This is because of the lack of shared data and leads. A majority of MQL or marketing qualified leads that pass-through sales teams get disqualified. Only a small percentage (27%) of those leads turn to SQL or sales qualified leads due to not getting a hold of the right stakeholder or decision-maker in the purchase decision. As mentioned earlier, r attribution streamlines this problem through multi-stakeholder tracking aligning MQLs with SQLs. Revenue attribution also enables better communication between the teams through reporting. Through revenue attribution, marketers can report on revenue numbers instead of other marketing vanity metrics.
Implementation
The problem with implementing attribution in ABM is starting out. Laying the groundwork for attribution is usually a trial-and-error process if you want to find the most efficient way to utilize attribution. Deriving an attribution strategy, deciding on what models to implement, testing other models, etc., are all common problems faced when implementing attribution into anything. These are inevitable and will cost money and time. In order to stay one step ahead of the game there is a way in which a marketer can anticipate preferred campaigns by targeted accounts and stakeholders. It is through the use of intent data. Regardless of the manner through which it is obtained, it can be very insightful for understanding the channels your targeted account stakeholder is deriving their buyer intent from. This data will prove to be useful in the formation of your attribution models as will be able to premeditate your own channel activity due to the information obtained through the intent data.
Once you have laid the groundwork. It is time to start tracking your engagement. Using multi-channel or multi-touch attribution makes a big difference. Considering the proportion of the investment and the degree of personalisation being used in your account-based engagement, single-touch models will not do an effective job attributing all of your activities — keep in mind that this is dependent on several factors like the number of channels, opportunity cost of channels, the channel intent, etc. In fact, a lot of marketers focus on bottom-of-the-funnel attribution investing in sales enablement to convert customers, while not realising that there are so many other factors to consider. The goal here is to organise your customers into accounts and map out the complete customer journey through the pipeline of said accounts. Pairing this with data obtained from your tech stack will enable you to identify the stakeholders involved in buying decisions within each account.
As mentioned earlier the functionality of ABM is heavily reliant on the collaborative work of other departments, and the same holds true with the use of revenue attribution. While the use of revenue attribution itself facilitates this alignment, that alone should not give you a reason to disregard it. Ensuring that both the marketing and sales teams are working with the same metrics and also the same stakeholders play a vital role in your ABM’s campaign success. Revenue attribution tools also benefit from data across teams, as mentioned earlier, the utilisation of your tech stack which would include things like your sales data and CRM data, etc., are essential in the functionality of your revenue attribution in ABM.
{{INLINE_TOFU}}
Challenges with ABM and Attribution
A lot of the challenges that arise from attributing ABM have to do with problems and mistakes marketers face when using attribution. Finding the most efficient model that is applicable for your ideal customer profile is not an easy task and has several hurdles. Identifying stakeholders will also only get more difficult considering the constant increase of the number of stakeholders involved in a B2B buyer decision due to sales cycles becoming increasingly bigger in size. Multi-touch attribution, in general, is a complicated and tedious process with more complex channels arising convoluting the entire journey. To overcome this, advancements in marketing technology have enabled us to accompany the right attribution tool that consolidates complex information into useful insights that will save time and effort in practice. Better yet, an AI-powered attribution tool that will eliminate the skill gap required to effectively utilize an attribution tool. With all the necessary tools and know-how available, you should be well equipped in attributing your account-based marketing.
_%2520A%2520Long-Tail%2520Playbook%2520with%2520Keyword%2520Mapping.avif)
How to Research Keywords for a Niche (US): A Long-Tail Playbook with Keyword Mapping
A practical US playbook for niche keyword research: PAA mining, long-tail discovery, competitor gaps, and a page-level keyword map template.

Broad keywords get you broad results in a larger market. When businesses targeting a niche need every click to matter, the effort to find niche keywords is your leverage point.
Instead of competing for overly competitive terms like "project management software" with companies that have six-figure monthly Google Ads budgets, you can target "construction project management for small crews" and speak directly to potential customers who are genuinely interested in your solution.
This guide walks you through a step-by-step process that produces a prioritized keywords plan mapped to specific pages on your site, not just a list of terms with high search volumes.
What is an SEO Keyword?
An SEO keyword is a term or phrase people type into search engines when looking for information, products, or services. Initial research involves identifying these search terms based on search volume (how often people search), competition levels (how difficult it is to rank), and search intent (the intent behind a given search query).
For example, someone searching "how to fix a leaky faucet" has informational intent, while "emergency plumber near me" signals transactional intent. Understanding this distinction helps you create content that matches what searchers expect to find.
What are Long-Tail Keywords?
Long-tail keywords are multi-word, intent-rich search phrases that typically have lower search volumes but higher conversion rates.
Where "running shoes" might get 100,000 monthly searches, "best trail running shoes for wide feet" gets maybe 500. But those 500 people know exactly what they want. And although such keywords individually don’t bring a lot of search traffic, over 91% of all search queries on Google are long-tail keywords.
Fortunately, they’re also easier to rank for because there is less competition, and the traffic converts better because you're answering specific questions.
What is Keyword Optimization (vs. Research)?
Keyword optimization is the ongoing process of placing the right keywords in high-value elements like titles, headers, URLs, and body copy to match user intent.
Keyword research helps you find keywords. Optimization puts them to work. After identifying "eco-friendly office gifts under $50" as a target keyword, optimization means using it in your page title, H1 tag, first paragraph, and alt text for product images.
Do note that keyword optimization isn't a one-time task but rather a continuous refinement as you track performance and adjust based on what ranks.
{{INLINE_MOFU}}
The 7-Step Niche Keyword Research Workflow (US)
Alright, now that we have the basics out of the way, let’s go over the steps to perform keyword research. The steps here apply to pretty much any target audience that you may want to target.
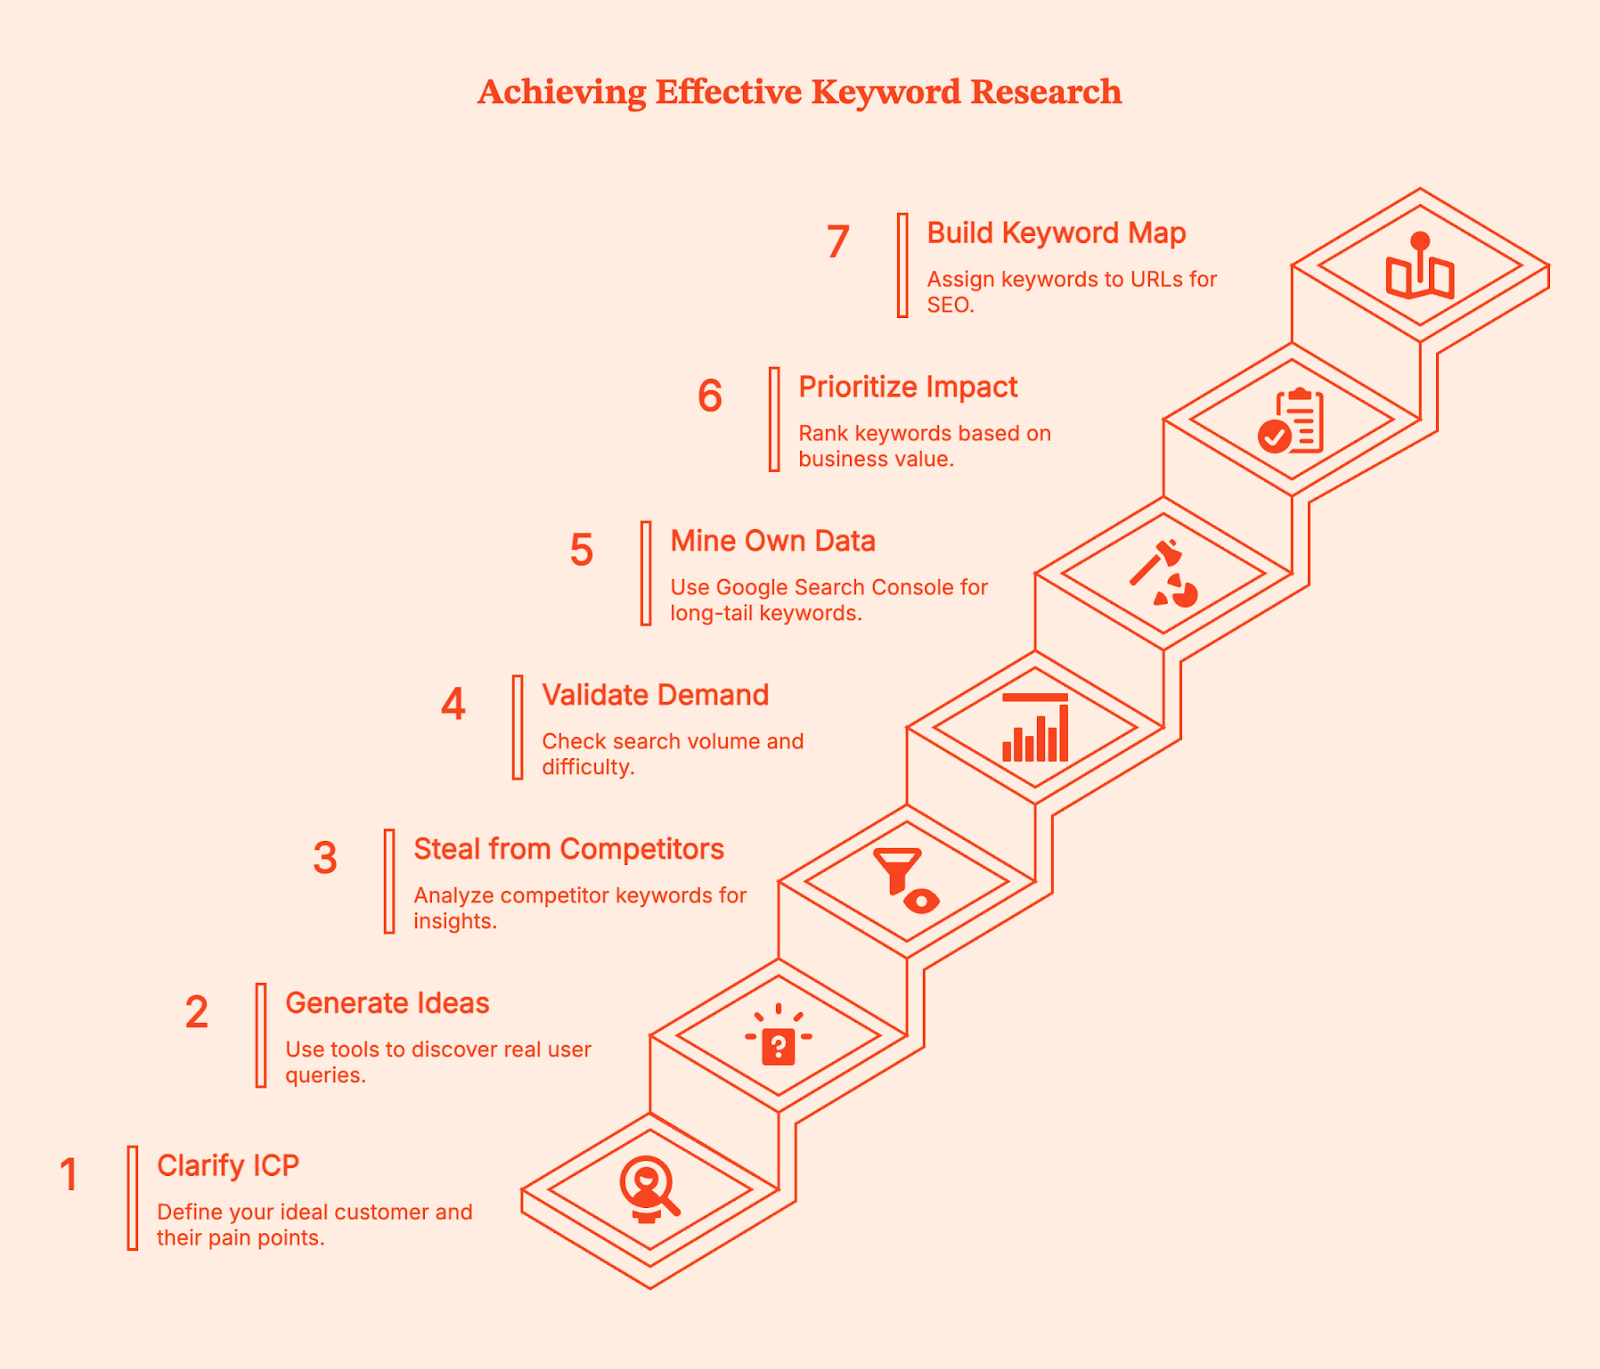
Step 1: Clarify Your ICP and List Seed Keywords
Start by defining the right audience and what specific problems keep them searching at 2 AM.
Your ideal customer profile determines everything downstream. If you run a B2B SaaS tool for accounting firms, your seed keywords might include "audit automation," "tax workflow management," and "client portal software."
Write out 5-7 pain points your customers face, then turn each into phrases related to your niche. Don't overthink this step with formal buyer personas. Just list the actual terms your customers use when describing their problems.
Step 2: Generate Keyword Ideas from Autocomplete and PAA Tools
Feed your seed topics into question mining tools to discover what real people actually ask. Start with a platform like Soovle to aggregate autocomplete suggestions across multiple search engines.
You could also use AlsoAsked, AnswerThePublic, and KeywordsPeopleUse to mine People Also Ask (PAA) questions. For "audit automation," you might discover "can audit automation integrate with QuickBooks" or "what tasks can audit automation handle."
Using your Google Ads account, set your Google Keyword Planner location to the United States to ensure you're getting US-specific volume data. These questions become content angles that align with search intent.
Step 3: Steal from Competitors (Systematically)
Drop 3-5 top competitors into a keyword research tool and harvest content gaps and competitors keywords.
Go to Ahrefs Site Explorer or Semrush's Organic Research tool.
Enter a competitor's domain, then filter their organic keywords by question modifiers (who, what, where, when, why, how). Sort by traffic to find their top ranking pages.
We consistently recommend competitor mining as it reveals proven keywords that already drive organic traffic. You're not copying their content but rather identifying validated search demand.
Redditors on the r/SEO subreddit often mention competitor research as the fastest way to generate keywords.
Step 4: Validate Demand and Difficulty
Check potential keywords for monthly search volume, keyword difficulty (KD), and SERP composition before committing to create content.
Use Ahrefs Keywords Explorer to see if your target keywords actually get searches in the US market. As a general rule, a keyword with 10 monthly searches isn't worth targeting unless it's extremely high-intent.
Look at KD scores (Ahrefs calculates these based on backlinks needed to rank), but more importantly, manually review the SERP. If you see forums, old sites, or thin content ranking in positions 3-7, that's a signal you can compete.
You can also read through Google's SEO Starter Guide which emphasizes matching content type to search intent over chasing vanity metrics.
Step 5: Mine Your Own Data for Long-Tail Gold
Use Google Search Console (GSC) with regex patterns to surface longer queries that already bring you traffic.
Open Search Console, go to Performance > Search Results, click "New" under Queries, then select "Custom (regex)."
Enter the pattern .{25,} to filter for queries with 25 or more characters. This regex technique reveals the specific phrases people use to find your content.
You might discover "how to automate recurring invoices in accounting software for small businesses" brings 5 clicks per month at position 12. That's an easy optimization win where you can create dedicated content to capture more targeted traffic or optimize existing blog articles to capture that intent.
For B2B companies, layer in behavioral intelligence from your target accounts. If you're running account-based marketing, platforms like Factors show which companies visit your site, what relevant topics they engage with, and where they spend time. This reveals interest in a particular topic that search volume data can't capture.
Step 6: Prioritize for Business Impact
Rank keywords by "pain proximity" (how close they are to your solution), achievable KD, and internal link support you can provide.
Not all new keywords deserve equal effort. Create a simple scoring system: high commercial intent (ready to buy) = 3 points, medium intent (comparing options) = 2 points, low intent (learning) = 1 point. Then factor in whether you can realistically rank.
A KD of 30 with 200 monthly searches beats a KD of 65 with 2,000 searches if you're working with limited domain authority. Consider which existing pages can link to your new content, as strong internal linking from related pages makes ranking easier.
“Internal linking is one of those underrated SEO strategies that quietly does the heavy lifting for your website. It’s about connecting pages, but also about helping search engines and users better understand your site. When done correctly, internal links can enhance crawlability, improve your search engine rankings, and boost your topical authority.” – Edwin Toonen on the Yoast blog
Step 7: Build Your Keyword Map
Assign one primary keyword per URL, cluster related secondary terms around it, and map content types to search intent. Open a spreadsheet and start assigning keywords to pages. Each row represents one URL on your site.
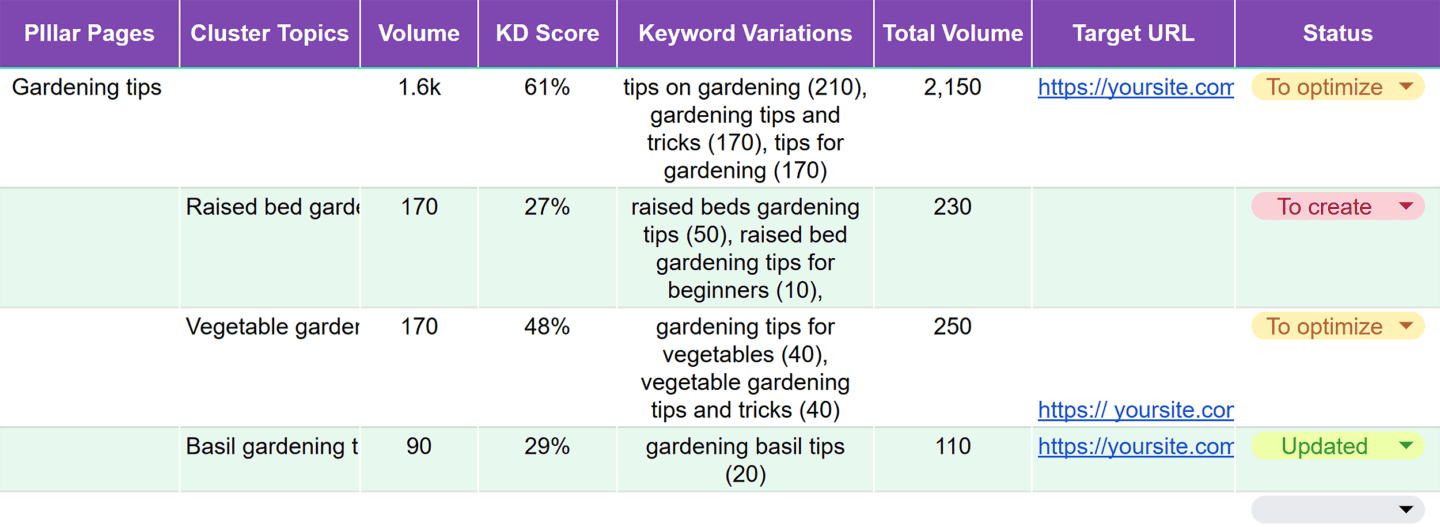
For instance, your homepage might target "construction project management software." A feature page could target "time tracking for construction crews."
You can also use Backlinko's keyword mapping methodology where you group semantically related keywords under one primary term.
If you have "best time tracking apps for contractors," "contractor time tracking software," and "construction crew time management" all ranking for similar results, put them on one page as primary/secondary targets instead of creating three competing pages.
Create Your 'Keywords Plan' Sheet
Your keyword plan should live in a spreadsheet with specific columns that guide initial research and content creation.
Here’s a Google sheet you can duplicate to get started with your tracking.
SEO Tracking Spreadsheet Template
If you prefer setting up manually, here are the 13 columns you need along with the values they can have.
Keyword, Intent (Informational/Commercial/Navigational/Transactional), US Volume (from Keyword Planner), Keyword Difficulty, CPC (to gauge commercial value), Priority (1-3 ranking), Funnel Stage (Awareness/Consideration/Decision), Page Type (Guide/Product/Category/Comparison), Primary or Secondary designation, PAA Questions to Answer, Target URL, Internal Link Opportunities, and Notes.
For example, a row might look like:
- Keyword: "best accounting software for nonprofits"
- Intent: Commercial
- US Volume: 320
- KD: 42
- CPC: $18
- Priority: 1
- Stage: Consideration
- Page Type: Comparison Guide
- Primary/Secondary: Primary
- PAA: "Does QuickBooks work for nonprofits?" / "What accounting software do 501c3s use?"
- Target URL: /accounting-software-nonprofits
- Internal Links: Blog post on nonprofit bookkeeping, Nonprofit resources hub
- Notes: Competitor X ranks with thin content, opportunity to outrank
This format keeps your research organized and makes it simple to hand off to writers who need clear guidance on what to create.
Keyword Best Practices for Marketing Strategy
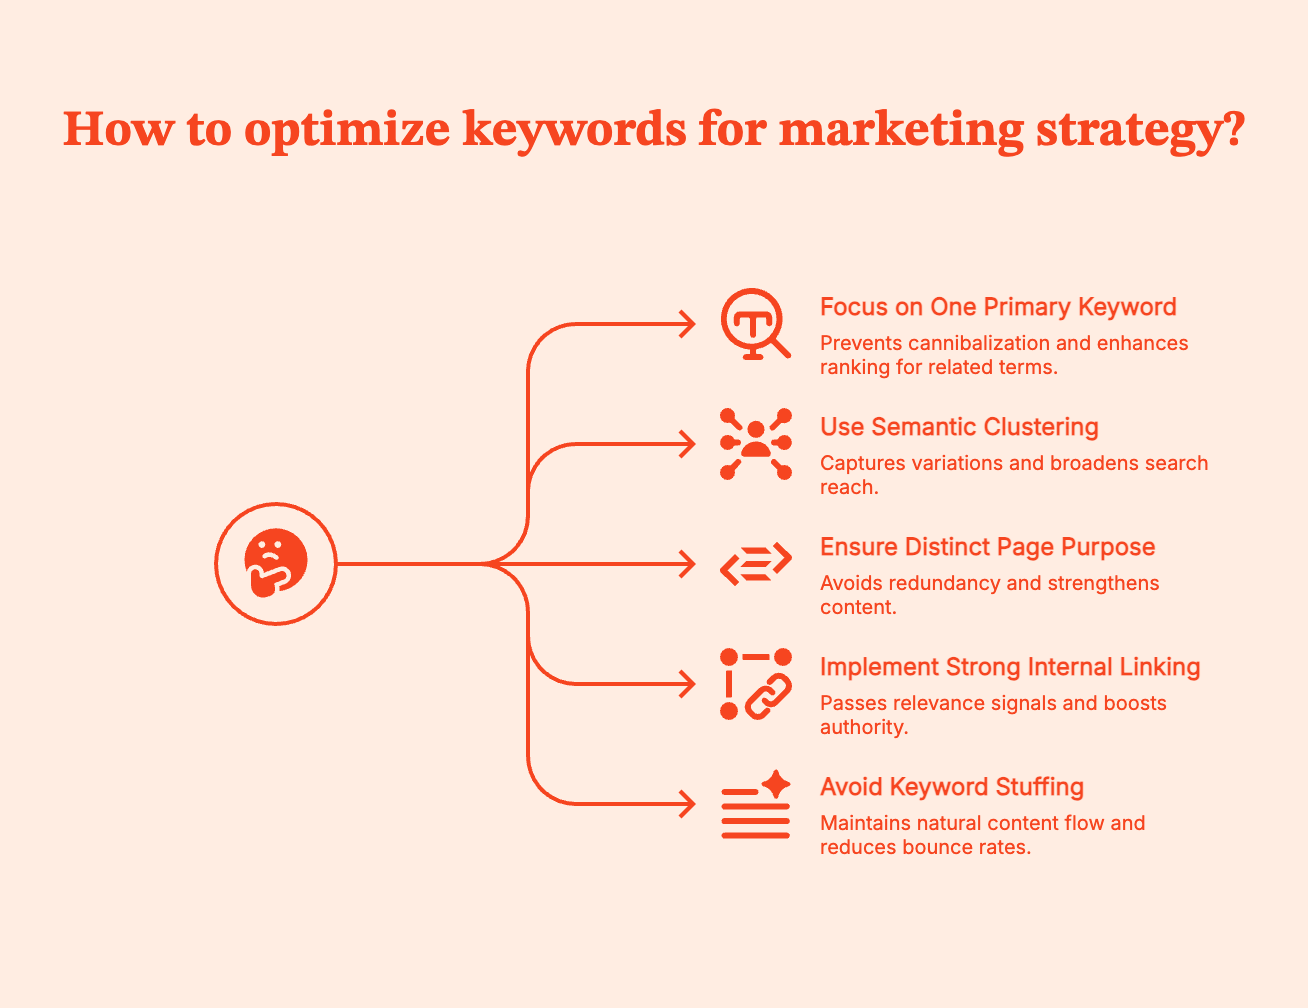
One primary keyword per page prevents cannibalization, while semantic clustering captures related search variations.
According to Ahrefs' research data, pages that rank for their target keyword also rank for an average of 1,000+ related terms. This happens when you build comprehensive content around one primary focus. Your title tag, H1, and URL should all contain your primary keyword naturally. Your H2 and H3 subheadings can target secondary keywords and PAA questions.
Each page needs a distinct purpose. If you have two pages targeting nearly identical keywords, consolidate them to make a stronger piece.
You also need strong internal linking from high-authority pages to newer content using keyword-rich anchor text. For example, when you write "check out our guide to construction project management" and link those words to your target page, you're passing relevance signals.
And no matter how tempting it may seem, avoid the old-school SEO tactics.
- Don't stuff keywords unnaturally into your copy (targeting a 2-3% keyword density is outdated advice).
- Don't hide keywords in white text or behind images. Google's guidelines are clear: write for humans first, optimize for search engines second.
- If your content reads awkwardly because you forced keywords into every sentence, you'll see high bounce rates even if you rank temporarily.
Free and Paid SEO Tools
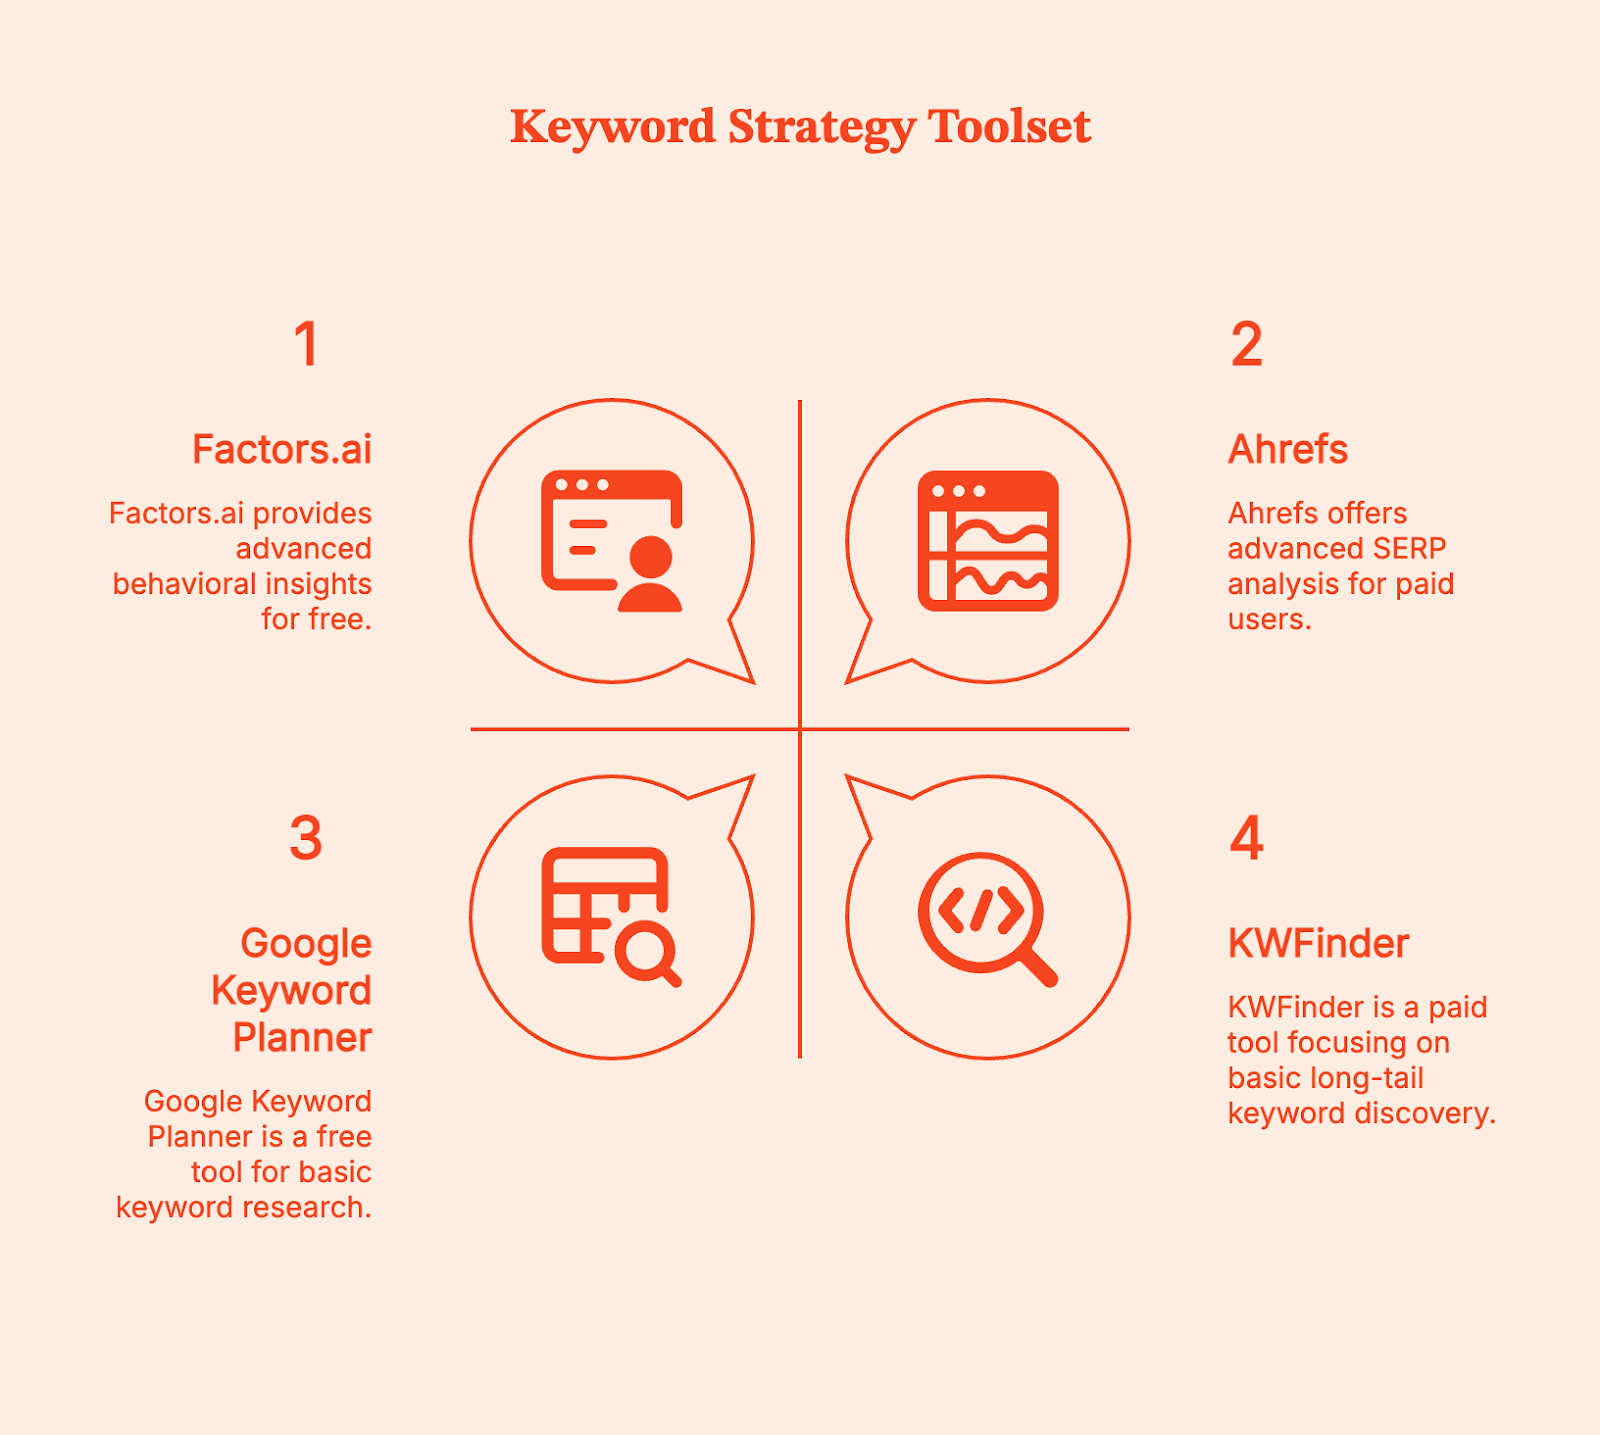
Start with free tools to validate your niche, then invest in paid platforms when you're ready to scale competitor analysis.
Free Tools
- Google Keyword Planner (set location to United States for accurate volumes)
- AnswerThePublic limited free searches
- Answer Socrates for question-based discovery
You can export data from these tools and build your initial keyword list without spending anything.
Paid Tools
- Ahrefs ($129/month) and Semrush ($199/month) provide keyword difficulty scores, SERP analysis, and competitor gap reports.
- KWFinder from Mangools ($43.85/month) focuses specifically on long-tail discovery with an interface built for finding low-competition terms.
These platforms aggregate billions of keywords and show you which ones competitors rank for but you don't, making the investment worthwhile when you're producing content regularly.
Account Intelligence for B2B Keyword Strategy
For B2B companies running account-based strategies, Factors.ai adds a behavioral layer that traditional keyword tools miss. While Ahrefs tells you search volumes, Factors shows which target accounts actually engage with specific content topics on your site. This reveals keyword opportunities based on real buyer behavior rather than just search data.
Factors identifies anonymous website visitors at the company level, tracks their content engagement patterns, and connects this to your CRM and ad platforms.
When you see that multiple high-value accounts repeatedly visit content about "SOC 2 compliance automation" but spend minimal time on "unique features," that's a signal to create more content around the specific compliance angle, even if search volumes look similar.
Common Pitfalls of Keyword Research
Keyword research fails when people optimize for the wrong signals or create overlapping content without a map. Here are some of the most common mistakes:
- Chasing volume over intent is the most common mistake. A keyword with 10,000 monthly searches looks attractive until you realize it's informational ("what is project management") and your product page won't rank because Google shows definitions and guides in those results. Always check the actual SERP before committing.
- Duplicating primary keywords across multiple pages creates keyword cannibalization where your own content competes with itself. Without a keyword map, you might have three blog posts all targeting "best time tracking software" in slightly different ways. Google doesn't know which to rank, so none rank well.
- Ignoring SERP features costs opportunities. If your target keyword triggers a People Also Ask box and a Featured Snippet, you need to structure your content to capture those. Use clear H2 questions and provide direct answers in the following paragraph.
- Not localizing to US search behavior when you're targeting US customers leads to volume miscalculations. Always set your keyword tool location filters appropriately.
- Keyword stuffing and hidden text still happen, usually with AI-generated content that someone didn't edit. Google penalizes these tactics, and they make your content unreadable to actual humans who might convert.
FAQs
Q: What is an SEO keyword?
A: An SEO keyword is a word or phrase people enter into search engines, chosen by website owners based on search volume, competition level, and intent during keyword research to optimize their content.
Q: How do I search for long-tail keywords in a niche?
A: Use PAA mining tools like AlsoAsked, AnswerThePublic, and Soovle for autocomplete suggestions. Run competitor domains through Ahrefs to find keyword ideas they rank for, and use GSC regex (.{25,}) to surface 25+ character queries your site already gets.
Q: What's a good 'low-competition' signal?
A: Check SERP quality first. If you see forums, outdated sites with thin content, or low domain authority pages in positions 3-7, that signals an opportunity. Ahrefs' keyword difficulty under 30 is generally achievable for newer sites, but manual SERP inspection matters more than the number. Look for an intent match where the ranking content type aligns with what you plan to create.
Q: How many primary keywords per page?
A: Typically one primary keyword per URL, supplemented with semantically related secondary terms. This prevents keyword cannibalization, where multiple pages compete for the same rankings. Use a keyword map to track which page owns which primary term.
Q: What is keyword mapping?
A: Keyword mapping assigns specific target keywords to individual pages on your site, reflecting your site structure and preventing overlap. You organize keywords into clusters around primary terms, then map each cluster to one URL with supporting secondary keywords.
Q: What is 'keyword optimization'?
A: Keyword optimization is placing selected keywords strategically in high-value page elements (title tags, H1, H2, body copy, URLs, image alt text) while maintaining natural readability and matching user search intent. It's an ongoing process of refinement based on performance data.
Q: Which free tools should I start with for US data?
A: Google Keyword Planner (set location to United States) for volume estimates, AnswerThePublic for question discovery (3 free searches daily), Answer Socrates for additional PAA questions, and Soovle for autocomplete across multiple search engines.
.avif)
Net Dollar Retention: What It Is & How To Improve It
Discover the significance of Net Dollar Retention. Read about how to calculate, evaluate and improve NDR for your SaaS business.

TL;DR
- NDR helps determine the revenue retained from existing customers after considering churn and expansion
- Calculating net dollar retention helps identify blockers in your growth like poor product fitment or low customer engagement
- The median NDR for private SaaS companies is 105%
- Improve NDR with better Customer Success operations, user analytics and sales-CS alignment
- Factors.ai can improve sales-CS alignment with account intelligence features
On average, it's 5 times more expensive to acquire a new customer than retain an existing one.
There's no doubt that your current customers are your most important assets. But traditional customer metrics such as CAC and churn don't provide visibility into the whole picture of customer sentiments. This is where net dollar retention comes in.
Net dollar retention (NDR) is an invaluable SaaS metric that helps evaluate the health of your customers and in turn, the health of your business.
This article explores everything you need to know about NDR.
What is Net Dollar Retention?
Net dollar retention is a metric that measures the rate of change in annual recurring revenue over a defined period of time.
The value of NDR helps determine the revenue retained from existing customers after considering churn and expansion.
It's a metric that quantifies customer success in terms of revenue retention, helping you evaluate what percentage of your recurring revenue you’ve retained and if you’ve been able to grow that value over time.
how to calculate net dollar retention?
NDR = (ARR at the start of the year - Churn - contraction + Expansion) / ARR at the start of the year
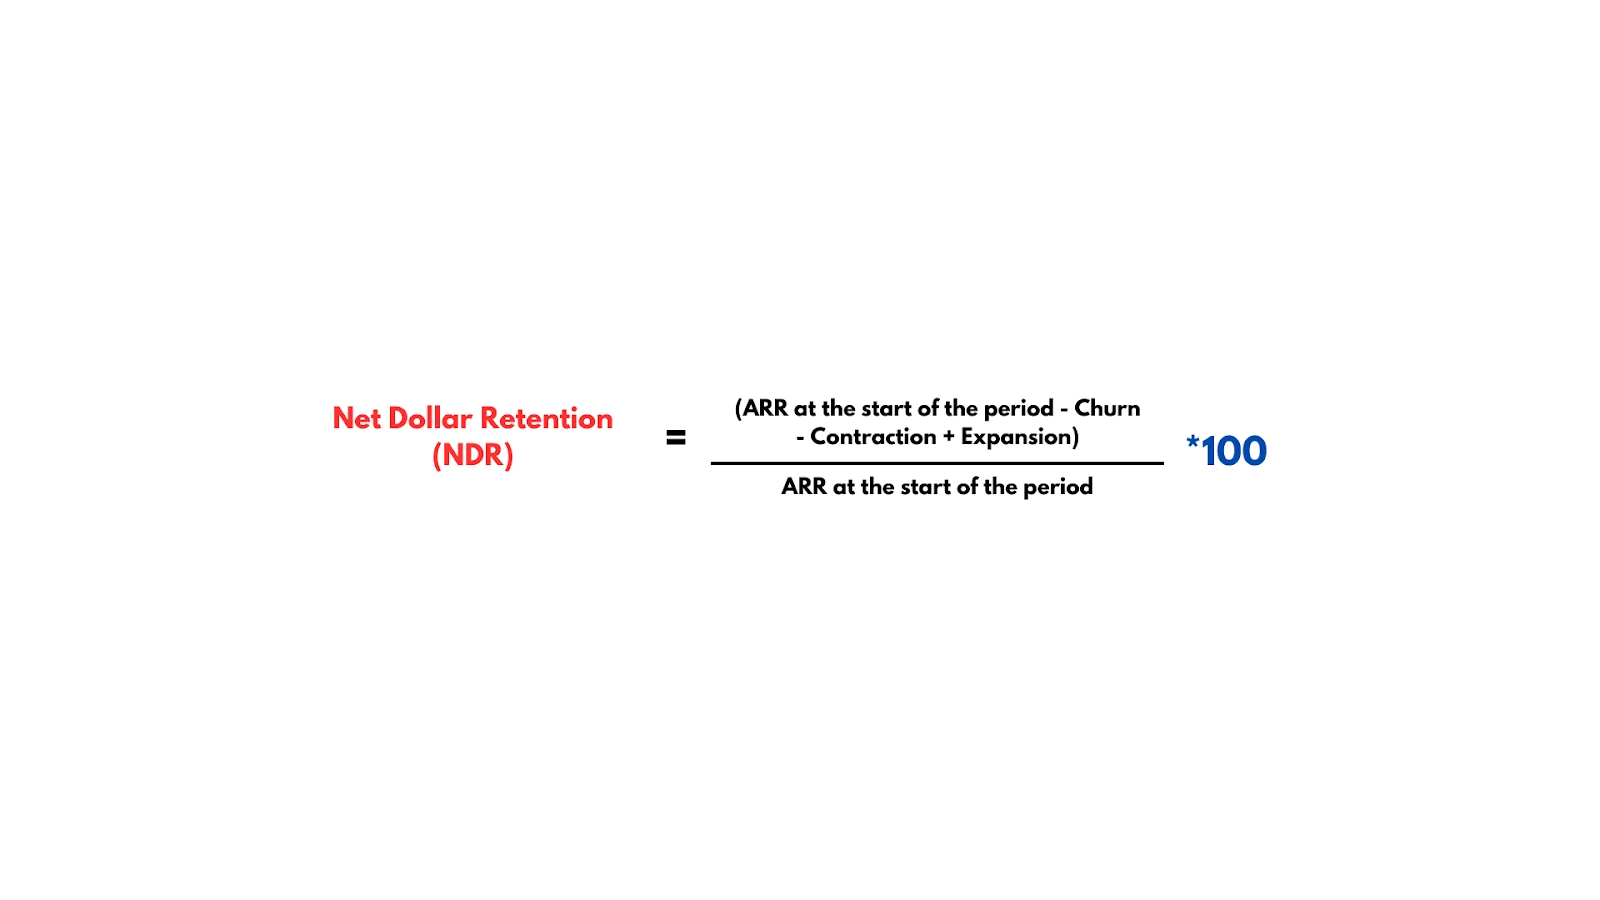
Let's say you want to calculate the NDR for the year.
At the beginning of the year, you have 100 customers, each paying $1,200 per year. So, your Annual Recurring Revenue (ARR) at the start of the year is 100 customers * $1,200/year = $120,000/year.
During the year, you experienced some changes:
Churn: 5 customers decided not to renew their subscriptions, resulting in a loss of $6,000 in ARR.
Expansion: However, you managed to upsell 10 existing customers to a higher-tier plan, each paying an extra $600/year, resulting in an additional $6,000 in ARR from expansion.
So your NDR is:
NDR = {($120,000 - $6,000 + $6,000) / $120,000} * 100, which is 100%.
This means that, on average, you retained and expanded revenue from your existing customer base, offsetting the revenue lost due to churn. An NDR higher than 100% signifies growth in recurring revenue, while a value below 100% signifies a loss in recurring revenue.
NDR can also be calculated for each month using MRR instead of ARR in the formula:
NDR = (MRR at the end of the period - Churn + Expansion) / MRR at the start of the period.
This helps track changes in revenue on a monthly basis.
{{INLINE_TOFU}}
Why Is NDR Important For SaaS?
When SaaS startups reach the growth stage, they struggle to break the chasm of early adopters. A chunk of revenue is generated through customers who are looking for new technology to experiment with. You’ll have to experiment with pricing strategies, messaging, and deal with higher churn in the early stages of your business. This means that simply measuring unit metrics like churn gives you a rather pessimistic view of your operations. To add to that, your customer success teams bear the brunt of this limiting perception of revenue generation.
Net dollar retention is a cohort-based metric. It allows you to focus your efforts on your most valuable customers. As the company scales, it becomes imperative to identify the sources of recurring revenue and optimize your operations to better serve such customers. Periodically calculating net dollar retention helps identify any blockers in your growth. A low NDR can be caused by high churn and/or limited expansion. This could signify any of the following:
1. Low Customer Engagement
A low NDR can be attributed to the fact that a significant portion of users did not fully engage with the software during the free trial period, or failed to derive substantial value from it. This lack of customer engagement often results in a reluctance to upgrade, leading to missed upselling opportunities. A diminished NDR necessitates an enhancement of customer success operations, a thorough examination of the signup process, or a refinement of the onboarding and training procedures.
2. Poor Product Fitment
A low NDR may also signify problems in the product-to-market fit. If churn is high and leads to a reduced NDR, it may be time to reevaluate the product offering and set up thorough feedback loops to understand the customer’s needs better. Similarly, if there is little revenue generated from expansion opportunities, it contributes to a low NDR. It can imply that customers are not convinced of the value addition in upgrades, and the product offerings should be reevaluated.
3. A Key Metric for Investors
NDR plays an important role in investors' decisions. A healthy NDR indicates that you have a strong product-to-market fit and the solution resonates with the intended audience. It serves as a predictor of future growth, as it is a strong indicator of scalability and long-term viability, making it a key factor in investment decisions.
Net Dollar Retention Benchmark: What’s A Good NDR?
A report published by RevOps determined that the median NDR for private SaaS companies was 105%, with the 75th percentile falling above 110%.
If your NDR is close to 105%, you’ve got nothing to worry about. If it is above 110%, there’s cause for celebration. And if you’re below 100%, you should look into ways to improve retention.
The report further suggested that the NDR is not materially correlated with the company size, as it is with other variables including Go-To-Market motion (Product-Led Growth vs. Sales-Led Growth) and pricing model (pure subscription versus Usage-Based Pricing).
5 Ways To Improve Net Dollar Retention
A happy customer will stay with you. A delighted customer will grow with you. A low NDR shows that your customers do not see value in your product offerings or are struggling to derive value from it.
This could be because of poor training, creating a longer learning curve. Maybe the customer opted for more features than they needed, and now they feel overwhelmed when using the tool. Maybe the product isn’t intended for a company that size, or they don’t see the appeal of upgrades. There are ways to improve the user and post-sales experience to:
1. Invest in Customer Success
Customer success often takes a backseat when we think of revenue generation. However, customer success teams enjoy the strongest bonds with customers and should be encouraged to identify and capitalize on these opportunities. Allocate resources to strengthen your customer success team to ensure that they can contribute to the NDR.
2. Use Product Analytics Amongst Power Users
Analyze the behavior of your most engaged users to identify features or workflows that resonate with your ideal customer profile. This will help you narrow down your positioning and attract more high-value customers. These insights may also be leveraged to guide your product road map to ensure high adoption and lengthy customer lifecycles.
3. Keep Customers Involved
Engage customers through regular communication, interviews, feedback mechanisms, and user groups to understand evolving requirements and expectations.
4. Optimize Contract Terms Based on Customer Preferences
Offer flexible contract terms and pricing options that align with different customer needs and preferences, promoting upsell opportunities. This will promote customer delight and lead to higher retention rates or open doors for expansion.
5. Look Into Sales-Customer Success Alignment
One of the key and often overlooked factors in customer success is its alignment with sales and marketing functions. Having first-hand access to customer feedback, customer success teams are equipped to identify the most serviceable customers. The customer success team can help align your messaging and sales efforts to speak to target the ideal customer profile for your business. Aligning the marketing, sales, and customer success functions will help you identify the customers you can serve best, consequently leading to lower churn and higher NDR.
How Factors Helps Improve Net Dollar Retention?
Most businesses chase sales-qualified leads. But getting a sale is only half the battle won. Ensuring a good customer experience, customer satisfaction, and customer retention are equally important for a better NDR. It is crucial to ensure that efforts prioritize CS-qualified leads over sales-qualified leads. While marketing and sales can bring in many customers, focusing on the most serviceable ones will help you scale faster. With Factors.ai's account intelligence and analytics, you can identify the right, high-intent accounts with longer retention, higher growth, and optimized NDR.
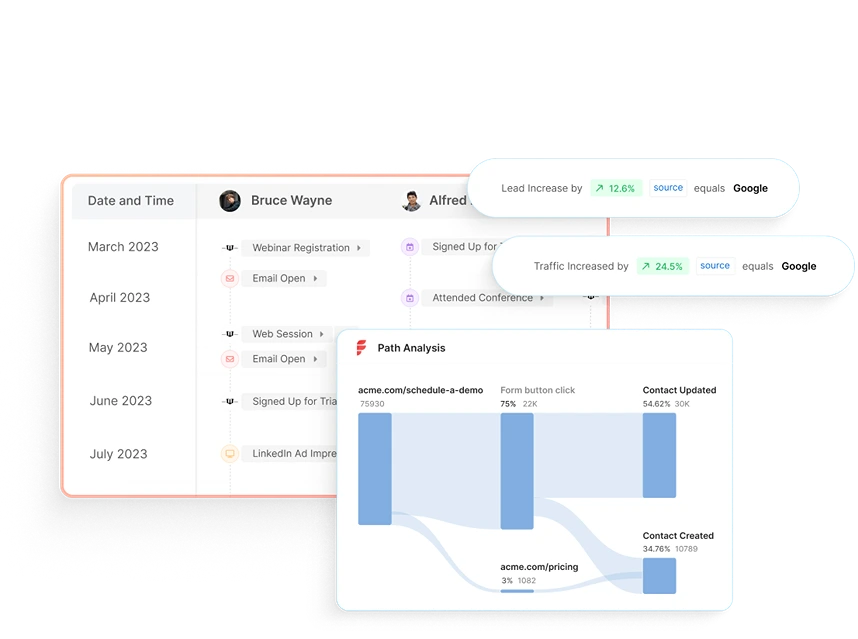
Factors can identify up to 64% of anonymous accounts visiting your website, engaging with product reviews, or viewing your LinkedIn ads. Its event-based data model helps you identify the most effective messaging and marketing touchpoints.
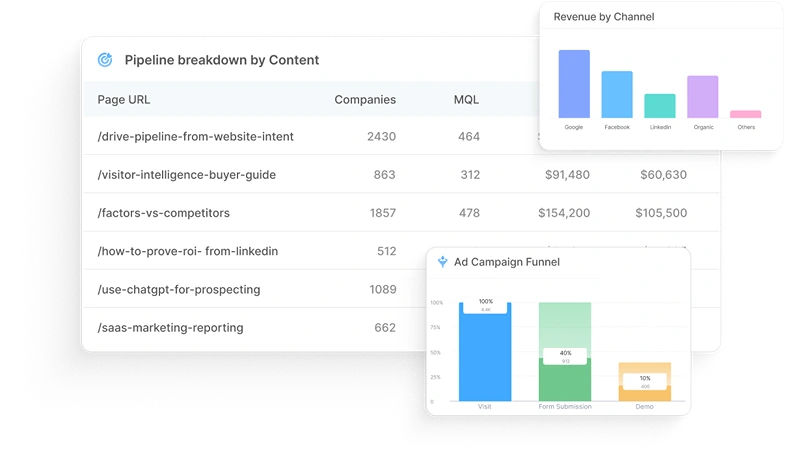
Net Dollar Retention (NDR) tells you how much revenue you're keeping, and growing, from your current customers. Anything over 100% means existing accounts are expanding. Under 100%? That’s a red flag.
To improve NDR:
1. Strengthen your customer success playbook.
2. Analyze usage data to catch churn risks early.
3. Align sales and support so handoffs aren’t messy.
Tools like Factors make this easier with account-level insights and behavioral signals, so you can act before issues escalate and spot upsell opportunities with real context.
Net Dollar Retention FAQs
Q: What is the net dollar retention formula?
A: Net Dollar Retention (NDR) = ARR at the start of the period - the revenue lost due to churn + the revenue generated through Expansion (cross-sell, upsell, etc.) divided by the ARR at the start of the period.
Q: What does 100% net dollar retention rate mean?
A: 100% net retention signifies that a business retains and expands revenue from existing customers, offsetting any losses from churn.
Q: What’s The Difference Between GDR and NDR?
A: GDR (Gross Dollar Retention) measures total revenue retained from existing customers, while NDR (Net Dollar Retention) considers revenue lost to churn and gained from expansion, providing a more precise growth indicator
.avif)
MQL vs SQL: The Key Difference Driving Sales & Marketing Alignment
Learn the difference between MQL and SQL, when to transition leads, and how to align sales & marketing to boost conversions.
TL;DR
- MQLs are leads showing early engagement and curiosity, not ready to buy but open to nurturing.
- SQLs show strong intent with actions like demo requests, pricing inquiries, or product comparisons, ready for direct sales outreach.
- Clear qualification turns a messy funnel into a predictable revenue engine.
- Sales and marketing alignment ensures smooth handoffs and faster conversions.
- Shared lead scoring models and automated workflows keep teams focused on the right leads.
- Tools like Factors track signals, trigger actions, and surface opportunities in real time.
- Avoid common pitfalls like pushing leads too early, waiting too long, or misjudging intent.
- AI-driven predictive lead scoring, real-time intent data, and deeper attribution are shaping the future of lead qualification.
- Nailing the MQL-to-SQL transition means more pipeline, higher win rates, and scalable growth.
Every successful revenue engine depends on one thing: the ability to separate interested prospects from real buyers. No matter how much traffic your website attracts or how many campaigns you run, growth only happens when you can identify which leads deserve immediate sales attention and which ones need nurturing. The primary difference between a Marketing Qualified Lead (MQL) and a Sales Qualified Lead (SQL) is the lead's purchase intent and the specific marketing or sales approach required for each.
Think of it like dating; not everyone who shows interest is ready for a relationship. Some are only demonstrating initial interest and just want to know more, while others are ready to commit. Your job is to figure out who’s who. That’s where lead qualification (this blog) comes in.
Also, read lead generation 101.
What is sales funnel and lead management
Think of the sales funnel as a filtering system. At the top, you have a broad mix of visitors, blog readers, ad clickers, webinar attendees, and curious trial users. But like I said above, not everyone at the top is ready to buy. Some are just exploring, some are gathering information, and only a fraction have genuine purchase intent.
Lead management is the process of sorting through this noise, qualifying leads based on data and signals, and ensuring that the right contacts move from one funnel stage to the next. When done correctly, this process eliminates wasted sales effort, aligns marketing with revenue goals, and drives higher win rates.
Importance of effective lead qualification in business growth
A poorly qualified funnel is like running ads with no targeting: expensive and inefficient. You might get lots of clicks, but if none of them turn into customers, what’s the point? It’s like throwing darts in the dark; you’re bound to miss most of the time. And those misses hurt your metrics, drain time, energy, and resources across the team.
Often, sales reps waste hours chasing leads who were never going to buy, while high-intent prospects slip through the cracks. Flip that equation with proper lead qualification, and the difference is dramatic:
- Higher conversion rates - because sales only talks to leads that match your ICP and show intent.
- Shorter sales cycles - because SQLs (Sales Qualified Leads) are contacted at the right buying moment.
- Better marketing ROI - because budgets are focused on campaigns that generate quality leads, not vanity metrics.
The difference between a scalable revenue engine and a stalled pipeline often comes down to how clearly a company defines and manages MQLs and SQLs.
{{INLINE_BOFU}}
What are MQLs and SQLs
Marketers and sales teams often throw these acronyms around, but definitions vary widely across companies. Because if you’ve ever been in a marketing meeting, you’ve probably heard these terms tossed around like confetti.
Let’s see:
- MQL (Marketing Qualified Lead): A lead that has engaged with your marketing (downloaded an eBook, signed up for a newsletter, attended a webinar) and fits your ICP. They’ve shown interest but aren't ready to buy yet.
- SQL (Sales Qualified Lead): A lead that has crossed the intent threshold. They’ve either requested a demo, asked for pricing, or engaged in behavior that indicates they’re evaluating solutions seriously. Sales can confidently prioritize them.
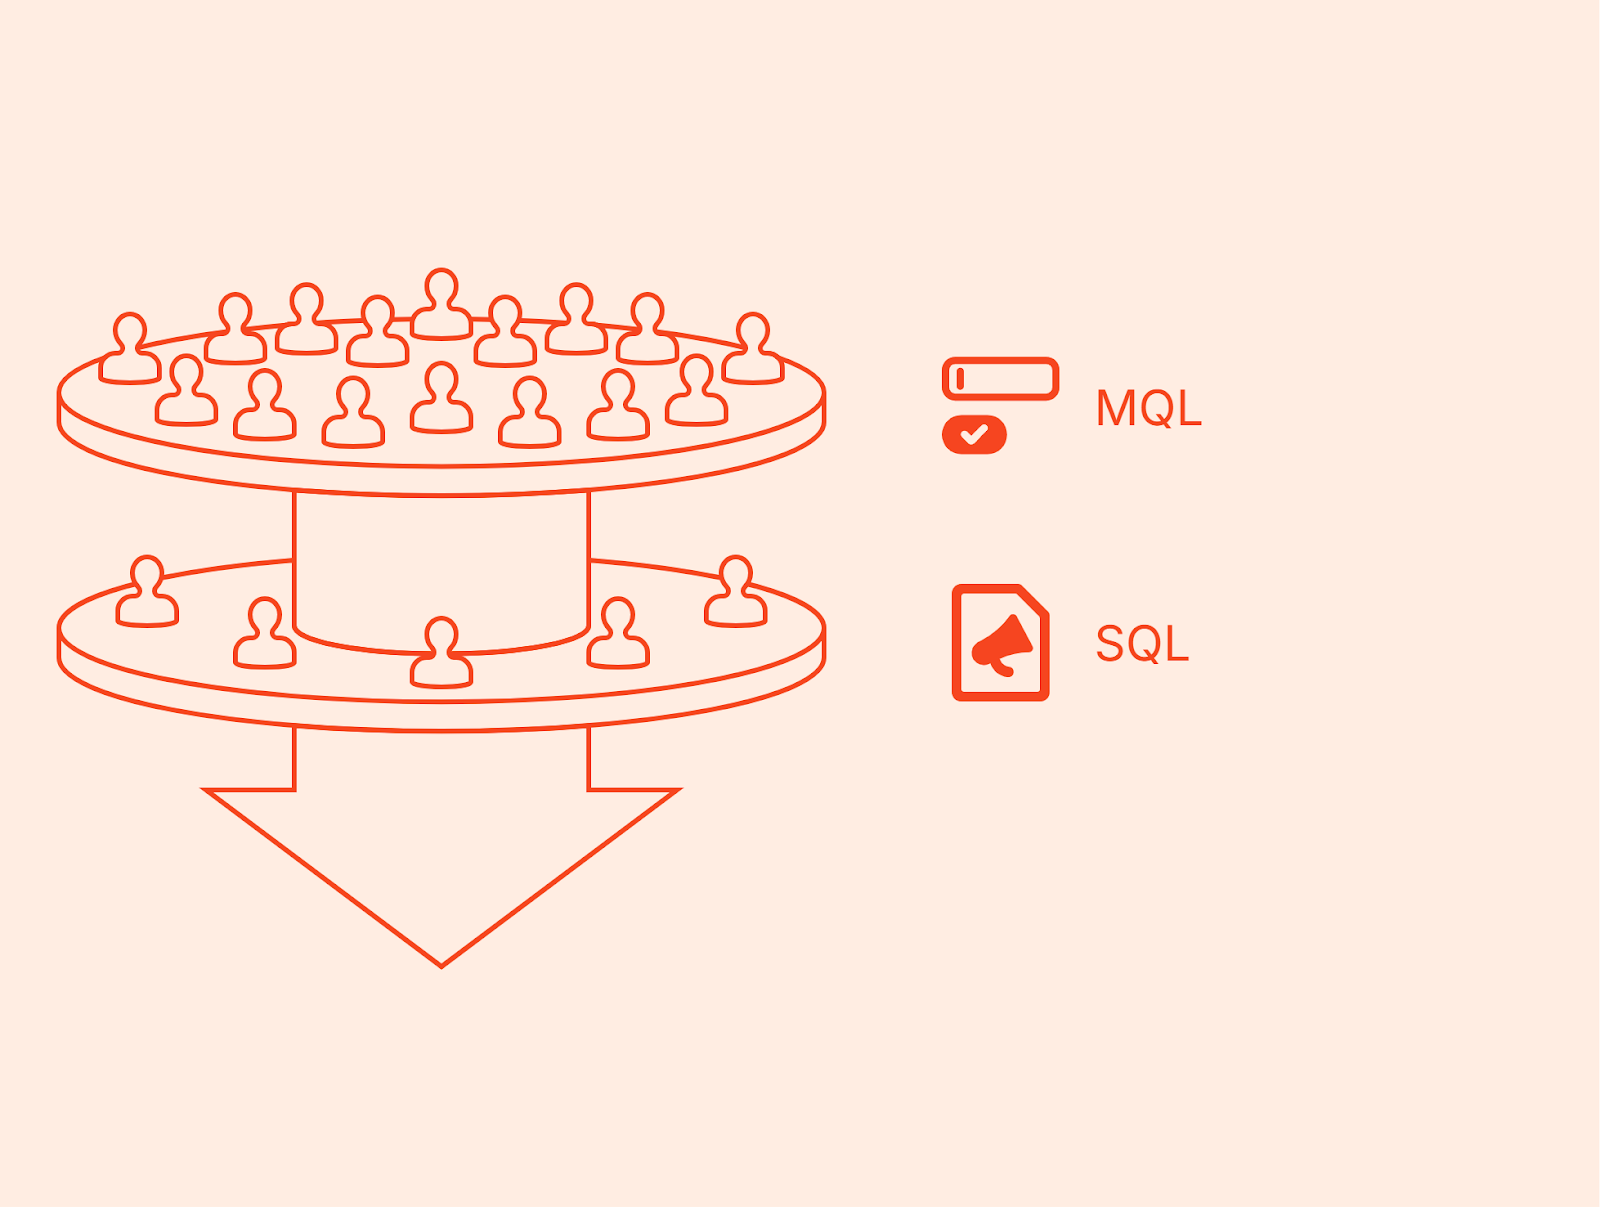
This is where the MQL vs SQL distinction matters most. MQLs are nurtured until they’re ready, while SQLs are handed off immediately to sales for follow-up. Confusing the two wastes resources and leads to frustration on both sides.
How MQLs and SQLs fit into the overall sales and marketing strategy
Think of MQLs and SQLs as two gears in the same machine. Marketing creates awareness and nurtures prospects into MQLs. Once the lead shows clear buying intent, it becomes an SQL and enters the sales pipeline.
When marketing and sales align on what qualifies as an MQL vs SQL, the handoff becomes seamless. Marketers can measure success in terms of how many MQLs convert into SQLs, while sales can focus their energy on leads that are truly ready to buy. This shared framework strengthens collaboration, reduces missed opportunities, and ultimately drives more predictable revenue growth.
What is the main difference between MQL and SQL
In sales and marketing, the line between interest and intent is razor-thin. Misjudge it, and you either push leads too soon (risking churn) or wait too long (missing the buying window). That’s why the distinction between MQL and SQL is critical. Let’s break down the key differences.
Also read https://www.factors.ai/blog/post-sale-customer-journey-framework
What is an MQL? And what are its characteristics?
A Marketing Qualified Lead (MQL) is a prospect who has interacted with your brand in meaningful ways but is not yet ready for a direct sales pitch.
- Definition: A lead that meets baseline ICP criteria and has shown early buying interest through marketing channels.
- Signals: Downloaded an eBook, attended a webinar, engaged with multiple emails, or browsed your product pages.
- Stage: Middle of the funnel, aware of their problem, exploring potential solutions.
- Action required: Nurturing through content, ads, and automated workflows.
In short, an MQL is a potential buyer who says, “I’m interested, but not just yet.”
What is an SQL? And what are its characteristics?
A Sales Qualified Lead (SQL), on the other hand, is ready for direct engagement.
- Definition: A lead that has demonstrated clear buying intent and meets sales-readiness criteria.
- Signals: Requested a demo, visited the pricing page multiple times, asked for a product comparison, or directly contacted your team.
- Stage: Bottom of the funnel, actively evaluating vendors or making purchase decisions.
- Action required: Timely outreach from SDRs or AEs, qualification calls, and opportunity creation.
An SQL essentially says, “I’m evaluating solutions. Convince me why yours is the right fit.”
Criteria used to identify MQLs vs SQLs
The SQL meaning marketing teams use often varies, but successful organizations define clear, measurable criteria. In other words, guessing isn’t an option here; the clearer your criteria, the less time your team wastes chasing the wrong people.
Here’s what typical MQL criteria often include:
- MQL criteria:
- Fits ICP (industry, size, persona)
- 3+ high-intent web visits in 30 days
- Consumed gated content (eBook, case study, whitepaper)
- Opened multiple nurture emails
- SQL criteria:
- Completed demo or trial sign-up
- Multiple visits to pricing or product comparison pages
- Responded positively to sales outreach
- Scoring threshold surpassed (e.g., >80 points)
(For more on scoring models, read Unlocking the Secrets of Lead Scoring Models)
The Role MQLs and SQLs play in the customer journey
- MQLs: Fuel the middle of the funnel. They show interest, need education, and are not yet ready to be approached by sales.
- SQLs: Fuel the bottom of the funnel. They are closer to a purchase decision, ready for sales engagement, and need tailored conversations.
Without MQLs, the funnel dries up. Without SQLs, the funnel never converts. Together, MQL and SQL form the backbone of a healthy pipeline.
Also read https://www.factors.ai/blog/stages-of-the-customer-journey
Common indicators and signals for qualification
- Behavioral: Content downloads, repeat visits, webinar registrations → MQL. Demo requests, trial usage, pricing page visits → SQL.
- Firmographic: Company size, industry, revenue → filters for both MQL and SQL qualification.
- Technographic: Tools currently in use → helps decide sales relevance.
- Intent signals: Ads engagement, G2 research, product activity.
At a glance: Here’s how MQLs and SQLs differ
| Aspect | Marketing Qualified Lead (MQL) | Sales Qualified Lead (SQL) |
|---|---|---|
| Stage in Funnel | Middle (awareness + interest) | Bottom (consideration + decision) |
| Primary Signals | Content engagement, ads clicks, email opens, multiple site visits | Demo request, pricing inquiries, product trial usage |
| Readiness | Curious, researching, needs nurturing | Actively evaluating solutions, ready for outreach |
| Owned by | Marketing team | Sales team |
| Action Required | Nurture campaigns, lead scoring, retargeting | Direct contact, discovery call, opportunity creation |
| Goal | Move from interest to intent | Move from intent to closed deal |
Here’s why the distinction matters
When teams blur SQL vs MQL definitions, the entire revenue process breaks. It’s a bit like passing the baton in a relay race. If one team doesn’t know when to hand it over, the whole thing slows down (or worse, collapses).
And that’s exactly what happens in many organizations: marketing floods sales with unready leads (hurting SDR efficiency), or sales misses high-intent leads because they weren’t flagged in time. Clear separation ensures:
- Marketing measures success by MQL→SQL conversion.
- Sales measures success by SQL→Opportunity conversion.
- Leadership sees predictable pipeline progression across the funnel.
To understand how sales and marketing can collaborate better at this stage, explore our 6 Tips to Align Sales and Marketing Teams.
Challenges and pitfalls: Common traps when defining MQLs vs SQLs
Even experienced teams encounter difficulties when drawing the MQL/SQL line. Common pitfalls include:
- Overqualification: Labeling too many leads as SQLs before they’re ready. This leads to wasted outreach and sales fatigue.
- Underqualification: Holding onto MQLs for too long, which delays engagement and causes competitors to swoop in first.
- Siloed systems: Marketing automation platforms and CRMs that don’t sync create inconsistent lead statuses, confusing SDRs.
- Lack of feedback loops: Without sales feedback, marketing doesn’t know which MQL behaviors actually predict SQL conversion.
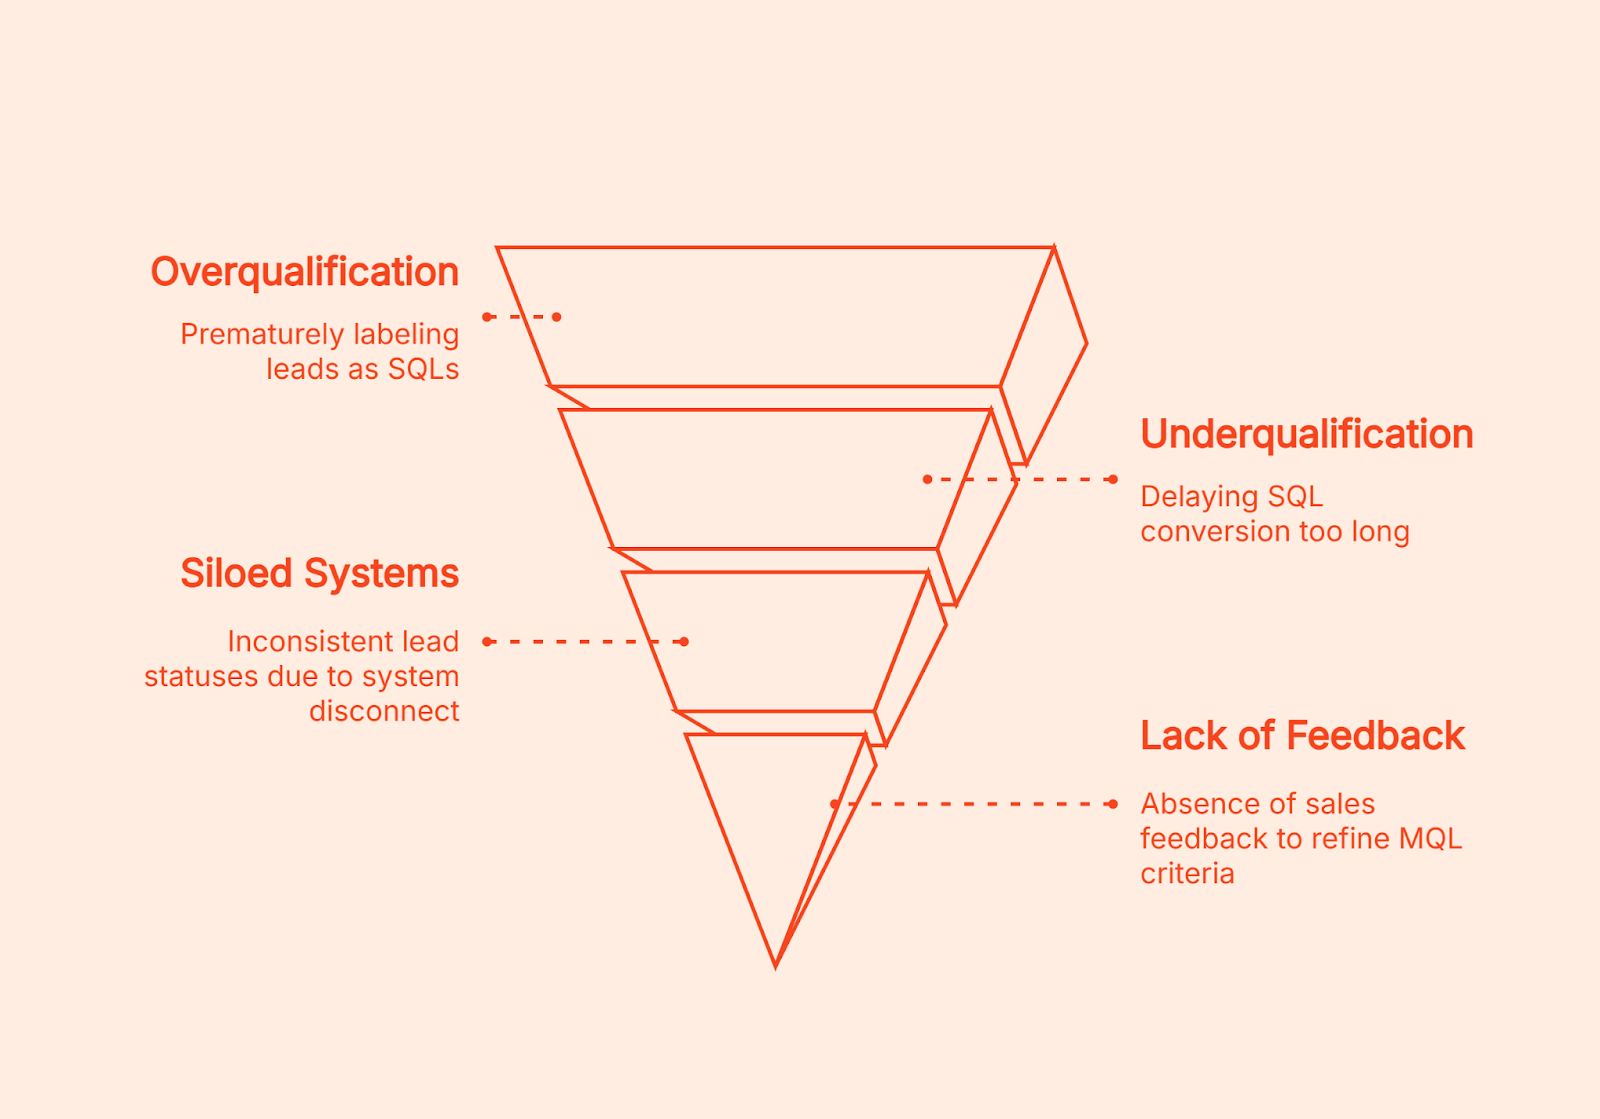
Avoiding these pitfalls requires both technology (CRM + automation) and process discipline (weekly feedback loops, clear scoring rules, documented SLAs).
Why the MQL–SQL Distinction Matters for Growth
At the end of the day, the MQL vs SQL distinction is about more than labels. It’s about ensuring your revenue engine runs efficiently:
- Marketing focuses on quality, not just volume.
- Sales focuses on timing, not just effort.
- Leadership gains predictability across the funnel.
Get it right, and your funnel becomes a growth multiplier. Get it wrong, and it becomes a costly bottleneck.
Here’s how defining MQLs and SQLs impacts business growth
The distinction between MQLs and SQLs isn’t just a matter of terminology; it has direct, measurable consequences on how efficiently a business grows. Companies that clearly define and operationalize MQL vs SQL are able to build predictable revenue systems. Companies that blur the line struggle with wasted effort, lost deals, and misaligned teams.
- Impact of lead qualification on sales pipeline efficiency and conversion rates
One of the strongest outcomes of proper qualification is improved pipeline efficiency.
- Higher-quality SQLs mean higher conversion rates. If sales is handed leads who are already showing intent signals, win rates increase naturally.
- Shorter cycle times. When SQL sales teams receive qualified prospects at the right moment, they can engage quickly before interest decays.
- Cleaner pipeline visibility. Leadership can forecast accurately because MQL→SQL→Opportunity conversion ratios are reliable.
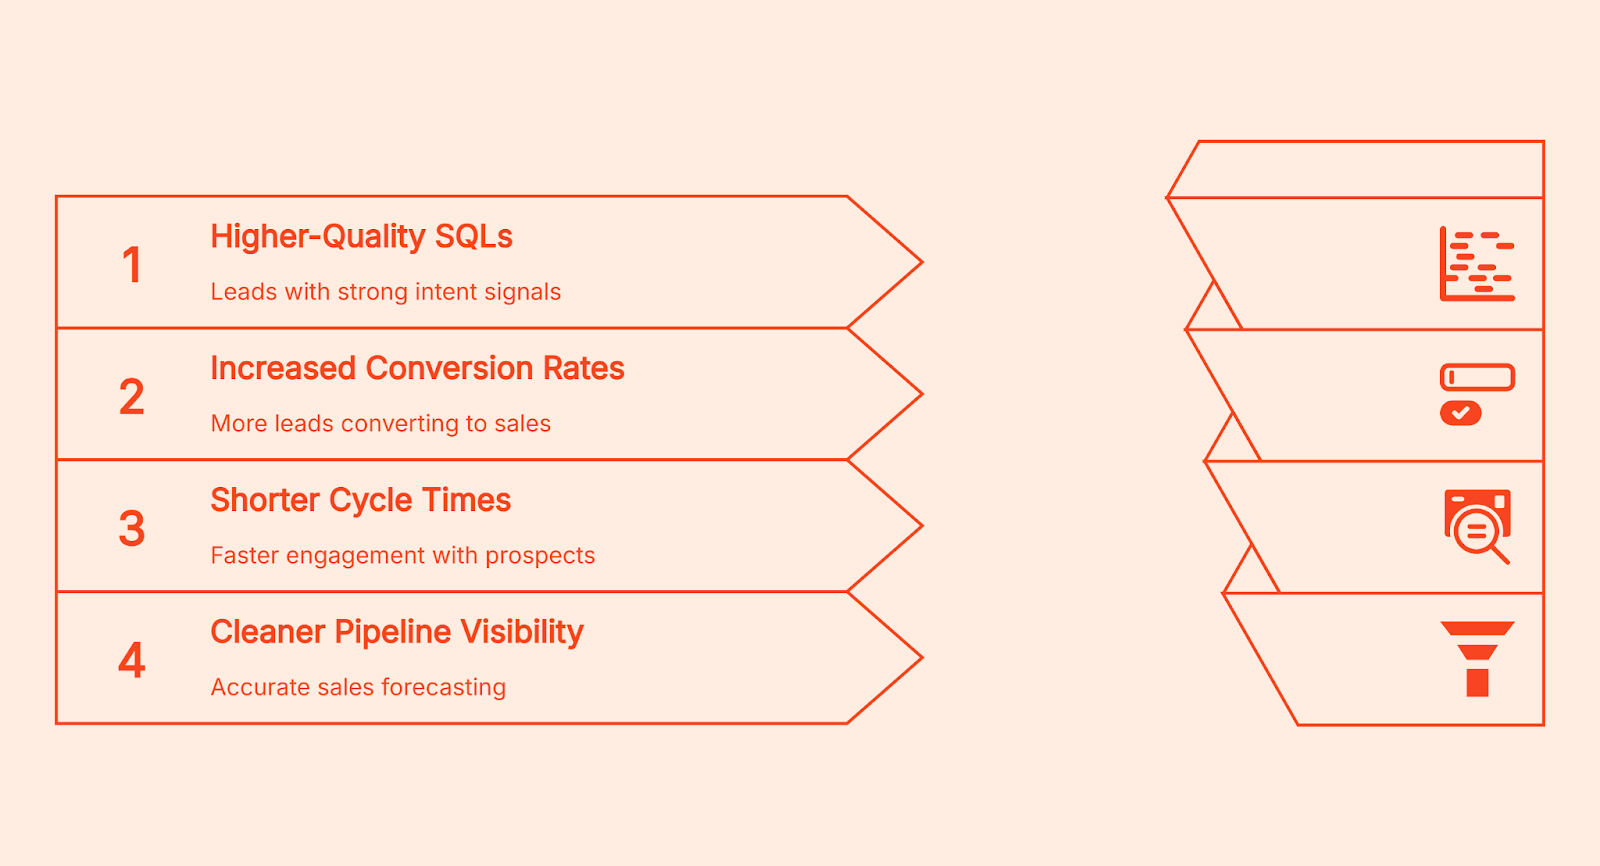
A mismanaged funnel has the opposite effect: bloated pipelines filled with weak opportunities, wasted SDR time, and frustrated marketers.
Common pitfalls to watch out for
- Pushing leads to sales before they show real buying intent.
- Setting criteria so strict that promising leads never make it through.
- Working in silos without feedback or shared context.
- Ignoring sales feedback when refining qualification models.
- Relying on a static scoring model instead of adapting over time.
Here’s how proper qualification improves marketing ROI
Marketing budgets are finite. If a team optimizes campaigns purely for lead volume without considering quality, ROI plummets.
By distinguishing SQL vs MQL, marketing can:
- Identify which campaigns generate leads that actually convert into SQLs.
- Shift spend toward high-quality channels (for example, G2 or high-intent search) instead of vanity metrics (e.g., low-cost leads from broad awareness ads).
- Prove contribution to pipeline in terms of SQL creation, not just MQL volume.
This closes the loop on SQL marketing impact: marketing doesn’t just generate interest. Having clear thresholds avoids the guesswork it directly fuels revenue by creating SQLs.
And when it comes to measuring which channels actually contribute to that growth, accurate attribution becomes essential. The Factors B2B Marketing Attribution Guide highlights the biggest challenges companies face and how multi-touch attribution connects every click to revenue.
Aligning marketing and sales for a seamless handoff
A classic failure point in many organizations is the ‘throw it over the wall’ mentality: marketing generates leads, hands them to sales, and hopes for the best.
Even the most sophisticated lead qualification process can fall apart if marketing and sales aren’t on the same page. It’s not enough to define MQLs and SQLs, both teams need to collaborate continuously to ensure every handoff is timely, relevant, and acted on.
How to strengthen marketing and sales collaboration
- Evolve shared definitions: Go beyond just agreeing on MQL and SQL criteria once revisit and refine them regularly as buyer behavior and ICP insights evolve.
- Turn communication into a system: Don’t limit alignment to monthly syncs. Set up recurring lead review sessions where both teams analyze what’s working, what’s not, and how scoring can improve.
- Recycle rejected leads effectively: Not every SQL will convert immediately. Instead of dropping them, feed them back into marketing workflows for continued nurturing.
- Build joint dashboards and KPIs: Move past vanity metrics. Create shared views of conversion rates, velocity, and pipeline impact so both teams measure success on the same terms.
Strategic recommendations for aligning marketing and sales efforts
- Define thresholds clearly. Document exactly what makes a lead an MQL vs SQL.
- Automate handoffs. Use CRM workflows and real-time alerts so no SQL falls through the cracks.
- Enforce SLAs. Sales must act on SQLs quickly; marketing must deliver only leads that meet criteria.
- Measure success across stages. Track MQL→SQL conversion rates, SQL→Opportunity rates, and ROI from each campaign.
- Create a feedback loop. Sales shares qualitative input on SQL quality; marketing refines scoring models based on that data.
Look, marketing and sales alignment isn’t a one-time fix; it’s a discipline. But with the right frameworks and the right platform, it becomes easier, faster, and far more scalable.
Best practices for managing MQLs and SQLs effectively
Knowing the difference between MQL vs SQL is only half the battle.
The real growth comes from how you manage these leads, how you define them, nurture them, transition them, and continuously refine the process.
Let’s break down the best practices that top-performing teams use to maximize lead conversion.
- Develop clear qualification criteria and scoring models
The foundation of effective lead qualification is a transparent, points-based scoring model.
- Fit (Firmographic/ICP criteria): Industry, company size, geography, tech stack.
- Intent (Behavioral criteria): Page visits, webinar attendance, content downloads, product trial activity.
- Recency: How recently those actions occurred (a demo request last week is stronger than one six months ago).
For example:
- A prospect from your ICP who attended a webinar (+20), downloaded an eBook (+10), and visited the pricing page twice (+30) might hit the 60-point threshold for MQL.
- Once they request a demo (+30) or actively engage with a rep (+20), they cross the 80-point threshold into SQL.
Having clear thresholds avoids the guesswork. Sales knows why a lead was passed over, and marketing knows what behaviors to prioritize.
Factors helps you visualize this transition through its Milestones feature, which offers funnel analytics that pinpoint what actions drive movement from MQL → SQL, so you can double down on what works.
- Implement lead-nurturing strategies for MQLs
MQLs and SQLs require different engagement strategies. An MQL should never be treated like an SQL; doing so risks scaring them away before they’re ready.
For MQLs:
- Content drip campaigns: Educational content → case studies → product comparisons.
- Retargeting ads: Serve content to high-fit accounts browsing your site but not converting.
- Personalized nurture: Use marketing automation to send emails aligned with their activity (e.g., “Since you downloaded our product guide, here’s a webinar you might like”).
The goal is to warm them until intent signals show they’re ready to progress.
- Transition leads from MQL to SQL: timing and communication
The handoff moment is where most companies lose momentum. Without speed and clarity, hot leads go cold.
Best practices include:
- Service Level Agreements (SLAs): Documented rules, e.g., Sales must engage an SQL within 24 hours.
- Automated alerts: Slack/MS Teams messages triggered when a lead reaches SQL status.
- CRM workflows: Automatically assign SQLs to the correct SDR, create tasks, and log activity.
Example: If a prospect hits the SQL threshold at 10 a.m. after browsing the pricing page, an SDR alert should fire instantly. Waiting until the weekly sync to act wastes the signal.
- Use CRM and marketing automation tools for seamless handoffs
Technology ensures consistency. Modern GTM stacks make SQL sales handoffs smooth and measurable.
- CRM systems (Salesforce, HubSpot): Track lead status changes from MQL → SQL → Opportunity.
- Marketing automation (Marketo, Pardot, HubSpot): Score and nurture MQLs until they’re ready.
- ABM/ad platforms: Sync high-intent MQL segments into LinkedIn or Google Ads for precision retargeting.
This integration ensures marketing and sales are never blind to each other’s activities. For example, SQL marketing teams can see which campaigns sourced SQLs, while sales can give feedback on which MQL signals actually led to opportunities.
- Continuously monitor and refine qualification processes
Lead qualification is not a “set it and forget it” system. Buyer behavior changes, markets shift, and what worked last quarter may not hold next year.
Best practices include:
- Weekly or bi-weekly MQL→SQL reviews: Marketing and sales analyze which signals worked and which didn’t.
- Adjust scoring weights: If trial usage proves more predictive than eBook downloads, increase its point value.
- Feedback loops: Sales shares qualitative feedback on why certain SQLs closed or stalled, informing marketing.
- KPI tracking: MQL→SQL conversion rate, SQL→Opportunity rate, average time-to-SQL, win rate by source.
Also read: KPIs Explained: Conversion Rates
Continuous refinement turns the MQL and SQL framework into a living system that evolves with your business.
Putting it together: Steps for predictable growth
Here’s what a streamlined MQL-to-SQL qualification process looks like from start to finish:
- Define MQL and SQL thresholds (with scoring tied to ICP + intent).
- Nurture MQLs with targeted content, ads, and automation.
- Trigger handoff automatically when SQL criteria are met.
- Enforce SLAs so sales acts quickly on SQLs.
- Review and refine scoring and signals every week.
The result? Sales spends time on the right accounts, marketing proves ROI beyond vanity metrics, and leadership gets a clean, predictable pipeline.
How Factors helps
Most teams struggle with the MQL→SQL handoff because marketing and sales speak different languages. Marketing tracks engagement; sales tracks intent. Somewhere in between, leads get lost. That’s where Factors brings everyone back on the same page.
Factors simplifies alignment by giving both teams a shared source of truth. Features like Milestones visually map the journey from MQL to SQL, showing exactly which actions or content drive progression between stages. With these funnel analytics, you can finally diagnose drop-offs, validate GTM experiments, and double down on what’s working.
Meanwhile, real-time AI Alerts notify sales reps the moment a lead crosses an intent threshold, like revisiting the pricing page or engaging with multiple assets. These alerts don’t just say who to reach out to, but why and how, surfacing rich account context for hyper-personalized follow-ups. It means your reps never miss a ready buyer, and marketing gets immediate feedback on what’s driving sales conversations.
To take it a step further, GTM Engineering combines AI Agents and execution services that turn intent into revenue. Agents automatically:
- Alert reps in real time when an account is ready to talk
- Pull detailed account research
- Identify and multi-thread buying groups
- Revive closed-lost deals
- Track post-meeting engagement to guide next steps
This automation ensures every follow-up is timely, relevant, and backed by context.
Now, all this intelligence feeds into Factors’ Account 360, a unified view of every touchpoint, from ads and content engagement to sales outreach. It gives your GTM teams complete visibility into the buyer journey, so marketing knows which campaigns are driving SQLs, and sales knows exactly what the account has seen, done, and responded to.
And with Dynamic Ad Activation, you can sync audiences to LinkedIn and Google Ads in real time, ensuring every campaign stays in sync with funnel progression. Run buyer-stage–specific campaigns, retarget high-intent accounts, and suppress low-quality leads, automatically.
Together, these features transform lead qualification from a guessing game into a repeatable, data-backed process. Forget disjointed dashboards or manual CSV uploads, and those alignment meetings that go in circles. (I can hear you breathe a sigh of relief!)
With Factors, alignment stops being a recurring pain point and becomes a revenue-driving habit, powered by shared visibility, smart automation, and AI that connects intent to action.
Future trends in lead qualification and sales enablement
Lead qualification is evolving quickly. The truth is, the way we qualify leads today might look completely different in just a couple of years and that’s not a bad thing. Here’s a glimpse of what that future is starting to look like:
- AI-driven scoring: Machine learning models now combine behavioral, firmographic, and product usage fdata to predict intent with far greater accuracy.
- Real-time intent data: Integration of external signals like review site activity, funding data, or hiring patterns into lead scoring.
- Deeper ad platform integrations: Expect SQL marketing workflows that sync high-intent accounts into ad campaigns in near real time.
- AI assistants in sales: SDRs increasingly rely on AI agents that not only identify high-intent accounts but also surface the right contacts and generate personalized outreach insights.
In a nutshell…
The MQL vs SQL debate determines how effectively your revenue engine runs. MQLs represent early interest and the potential for future opportunities. SQLs, on the other hand, represent immediate buying intent and the chance to close deals quickly.
MQLs and SQLs are not interchangeable. Confusing them leads to wasted resources, missed opportunities, and frustrated teams. Clear definitions and scoring rules ensure that marketing fuels pipeline with quality leads and sales engages only when prospects are ready. The SQL meaning marketing teams rely on must tie directly to measurable business outcomes like conversion rates, pipeline growth, and ROI.
Both are essential, but they require different playbooks, timelines, and ownership.
FAQs for MQL vs SQL
Q1: What is the main difference between MQL and SQL?
A: An MQL is a lead who has shown interest through marketing activity but isn’t ready for sales yet. An SQL has demonstrated clear buying intent and is ready for direct sales engagement.
Q2: Why is it important to distinguish between MQLs and SQLs?
A: Mixing the two wastes time and resources. The distinction ensures that marketing focuses on nurturing and sales focuses on closing, improving overall pipeline efficiency.
Q3: What does SQL mean in marketing?
A: In marketing, an SQL is a lead that has passed qualification criteria, showing intent signals like demo requests or pricing inquiries, and is ready for sales outreach.
Q4: How do you convert MQLs into SQLs?
A: Through lead nurturing, emails, ads, content, and retargeting, until the lead crosses defined scoring thresholds (e.g., demo requests, pricing page visits).
Q5: What KPIs should businesses track for MQLs and SQLs?
A: MQL→SQL conversion rate, SQL→Opportunity conversion rate, average time-to-SQL, pipeline sourced by SQLs, and win rate by origin channel.
Q6: Can a lead skip MQL and go directly to SQL?
A: Yes. If a prospect shows strong buying intent from the start like requesting a demo or contacting sales they can skip the MQL stage and become an SQL immediately.
Q7: How many MQLs convert to SQLs?
A: There isn’t a universal benchmark as it varies by product, ICP, lead source, and how you define each stage. The most useful benchmark is your own: track MQL→SQL by channel/segment over a consistent window (e.g., last 90 days) and improve it by tuning fit criteria, scoring, SLAs, and nurture..
Q8: What SQL means in marketing?
A: It refers to a lead that’s shown clear buying intent and is ready for direct sales engagement, usually after taking actions like requesting pricing or booking a demo.
Q9: What’s the difference between “SQL sales” and “SQL marketing”?
A: “SQL marketing” is how marketing identifies a lead as sales-ready. “SQL sales” is how the sales team qualifies and engages that lead to move it into an opportunity.
Q10: Do all SQLs become customers?
A: No. Some SQLs don’t convert due to factors like timing, budget, or competition, but strong qualification increases the chances they will.
Related Reads from Factors
If you’re looking to improve how your team defines, qualifies, and moves leads from MQL to SQL, these reads can help you sharpen the foundation:
- How To Build Your Ideal Customer Profile In 15 Steps – A practical guide to defining your ICP so your MQLs and SQLs are more targeted, qualified, and conversion-ready.
- How To Leverage Signals For Account Scoring – Learn how to use intent and engagement signals to fine-tune lead scoring models that bridge the MQL→SQL gap.
- An Introduction To B2B Account Scoring - Understand the basics of account-level scoring to ensure sales teams focus on the highest-potential opportunities first.

Navigating Sales In Early-Stage Start-Ups
Explore challenges in early-stage startup sales. Overcome them with insights from Praveen Das, Factors.ai co-founder, and Ankit Jain, Clearfeed co-founder
{{INLINE_TOFU}}
Navigating Sales In Early-Stage Start-Ups
Building pipeline and scaling sales as a startup is not easy.
Learn about the challenges with navigating sales in early-stage start-ups — and how to overcome them. Understand the power of account-based sales with Praveen Das, Co-founder of Factors.ai and Ankit Jain, Co-founder of Clearfeed.
What we’ll cover:
- Common challenges startups face when they begin their sales journey.
- How high-growth teams like Clearfeeder overcome these challenges.
- And why account-based sales is important for early-stage businesses.
Q. As an early-stage company, you have an unknown brand. Your product-market fit is yet to be achieved. Your ICP is evolving. And there’s limited tooling and team bandwidth. Getting to those first 20 customers might seem…impossible. How should you go about it? What was that journey like?
A. Startups are like hourglasses. You start with very broad ideas and segments. Then starts the journey of going as narrow as possible: “we serve this one ICP in this one segment”. And finally, you achieve growth.
- We identified 4-5 segments we care about. Within those segments, we identified a list of relevant, high-level problems our technology could solve.
- Then, we performed customer discovery by reaching out to about 200 people in each of those segments to validate our problem-statements.
- After these conversations, we identified a “pull” towards one of these segments (Customer success teams from series B dev/infra SaaS start-ups using Slack) and ran with it.
- Based on this insight, we built a product that this specific niche of people loved — which gave us our initial boost in customers based on referrals and virality.
Q. At this stage, what did your go-to-market engine look like? Was it mostly outbound or inbound? How did you go about GTM?
A. At this point of time, we didn’t have a market team. It was just the founders and a few engineers so there was no question of inbound.
The other consideration was whether we’re creating a category or are in an established category. If it’s the latter, you can “buy your way out”. We didn’t have this back then, so it was primarily an outbound motion:
- A list of 3500 ICP accounts based on firmographics and technographics
- Reach out via sequences of mails, calls, and LinkedIn
- This approach helped land 8 meets per month, out which 2-3 convert.
A quick break from questions to discuss engagement-based sales models…
Engagement-based sales is a sales strategy that focuses on targeting highly engaged accounts and customizing the sales approach to fit the needs of each account (As opposed to a cold approach).
For context, the “old way” involved a standard process of defining ICP accounts, researching target accounts, reaching out to contacts within those accounts, and measuring success with KPIs.

The challenge with this is approach is:
- Researching target accounts involves several hours of tedious effort
- Measuring success with KPIs involves pulling data from disparate sources
- AND you’re missing out on anonymous accounts that are already engaging with your brand
This is where Factors.ai comes in. Factors identifies and unifies hidden account data across ad campaigns, product review site, website, and CRM to capture demand, monitor engagement, and personalize outreach & nurturing.

Engagement-based sales is the new way. Here’s how Factors helps:
- Identify anonymous inbound traffic across channels
- Track granular account engagement to measure intent
- Personalize outreach based on engagement and intent
- Finally, measure marketing & sales KPIs under one roof
Ankit and Clearfeed’s experience with Factors and the new approach
“Why aren’t we personalizing outreach to improve response rates?” is a standard question amongst founders and the standard answer is usually “it takes a lot of time to meaningfully personalize outreach”.
Then, the question was “how can we find which accounts are most engaged, so we can personalize outreach to them alone?”. Seems reasonable. So with Factors, we identified accounts from our top of the funnel awareness campaigns as well as organic traffic from educational content assets.
This set of accounts were, at the very least, problem aware. SDRs could now prioritize personalized outreach to this set of “higher-intent” accounts. This has resulted in a 5x improvement in response rate and our ability to book outbound meetings. Real-time alerts with Factors also helps with speed to response rates. These insights are also signals on what accounts care about or why they’re visiting our website.
Read more about how Clearbit leverage Factors here: factors.ai/customers/clearfeed
Other tips to improve outbound performance include:
- Achieve a comprehensive understanding of target accounts through their website, customers, growth, and other signals
- Pinpoint the exact channels your ICPs prefer (LinkedIn, mail, calls, communities, etc)
- Keep experiment and iterating on bottlenecks, wins, and learnings
Q. Today, Clearfeed is further along its growth journey — running ads, content, etc. How has Factors come in handy at this stage?
A. As a founder, I always want to know what’s working. With Factors, we can see what accounts that have converted interacted with pre-sales. What are their touchpoints? What pages have they visited? What topics resonate most? and more. This helps guide our content strategy, paid strategy and beyond.
The Factors advantage for engagement-based sales may be summarized as…
- Unified account data and scoring: Qualify and target the right accounts based on website engagement, intent signals, and firmographics
- Advanced analytics: Optimize demand gen and content marketing investment
- Real-time alerts: Stay on top of new ICP accounts and closed lost accounts showing engagement

Multi-Touch Attribution Models: The Pros and Cons Explained
Explore the benefits, challenges, and future of multi-touch attribution. Learn how to track full customer journeys, improve ROI, and build smarter marketing campaigns.
TL;DR
- Multi-Touch attribution reveals which channels contribute to conversions, helping marketers allocate budgets more effectively and measure ROI with confidence.
- Privacy laws, offline tracking gaps, and model confusion make attribution tricky—but with standardization, right-fit tools, and team training, the value remains strong.
- Modern attribution tools leverage machine learning for real-time credit assignment, predictive insights, and automated model tuning.
- When integrated with CRMs and CDPs, attribution empowers revenue teams—spanning sales, product, and CX—to collaborate around shared data and smarter decision-making.
Marketing today isn’t a straight line - it’s a maze of channels, touchpoints, and decision-making moments. Customers might discover your brand through a social ad, read a blog post days later, open a few emails, and finally convert after a direct search. So, how do you know which of those marketing touchpoints truly mattered?
That’s where multi-touch attribution comes in. It offers a more accurate way to track the full customer journey by assigning credit across multiple interactions, not just the first or last. Instead of guessing which campaigns worked, you get a clearer view of what actually influenced the buyer.
In this blog, we’ll explore the pros, challenges, and limitations of multi-touch attribution, along with practical strategies to overcome common pitfalls. You’ll also discover where attribution is heading and how to stay ahead of the curve.
What is a Multitouch Attribution?
Many businesses still don't use any attribution model, missing key insights about their marketing. Multi-Touch attribution (MTA) measures how each marketing touchpoint affects a conversion, rather than giving credit to just one interaction.
Imagine putting together a puzzle. When a customer buys something, they might have seen your Facebook ad, read your blog, watched a YouTube review, and clicked on a Google ad. Traditional models only credit the last click, ignoring other channels that influenced the decision.
Multi-Touch attribution fixes this by sharing credit across all touchpoints that helped with the conversion. It understands that customer journeys are rarely straightforward and often involve many interactions across different channels before a purchase. This method provides a clearer view of how various marketing efforts combine to drive conversions.
The main idea is to track and analyze customer interactions across channels and devices. Each interaction gets a value based on its role in the final conversion. This includes:
- Social media interactions
- Email clicks
- Website visits
- Content downloads
- Ad clicks
- Phone calls
- Chat sessions
Pros of Multi-Touch Attribution
Multi-Touch attribution offers several key benefits that help marketers make informed decisions:
Complete Customer Journey Analysis
Multi-Touch attribution lets you see the entire path a customer takes before converting. Instead of giving credit to just the first or last click, it highlights every touchpoint—like ad views, email clicks, social interactions, and more. This full-funnel visibility helps you understand how different channels and messages influence decision-making at each stage of the journey.
Smarter Budget Allocation
When you know which channels contribute to conversions, you can invest your budget more effectively. Multi-Touch attribution reveals the impact of each touchpoint, helping you avoid over-investing in flashy, last-click channels and instead support the touchpoints that genuinely move buyers forward.
Precise ROI Measurement
One of the biggest challenges in B2B marketing is tying spend to results. Multi-Touch attribution helps you calculate ROI more accurately across channels and campaigns. By distributing credit fairly, you can see what’s truly delivering value, so you can report results with confidence and optimize accordingly.
Better Campaign Optimization
With detailed insights into which content and channels are most influential, you can fine-tune your campaigns for better performance. Maybe your paid search campaigns perform well early in the journey, while retargeting is more effective later. With that insight, you can create better sequencing, messaging, and targeting strategies.
Improved Team Collaboration
MTA breaks down silos across departments. Since it shows how different touchpoints work together—like content from marketing, emails from sales, and ads from paid media—it encourages cross-functional teams to collaborate based on data, not assumptions.
Higher Quality Leads
By understanding which combination of touchpoints brings in the best leads, you can adjust your efforts to attract more qualified buyers. You’ll see which channels or content types bring high-intent users who are more likely to convert.
Better Customer Experience
Multi-Touch attribution helps you spot gaps or friction in the customer journey. If people drop off after seeing a landing page or ad, you can identify weak points and improve them. This leads to a smoother and more personalized customer experience overall.
Stronger Forecasting and Planning
Once you understand the role each channel plays in the conversion process, you can better predict future performance. This helps in planning campaigns, allocating budgets for upcoming quarters, and building more accurate revenue forecasts.
Data-Driven Culture
Adopting multi-touch attribution promotes a more data-driven mindset within your organization. Rather than relying on gut instinct or siloed performance metrics, teams begin to trust shared insights and use them to drive decisions across the board.
These benefits make multi-touch attribution a valuable tool for marketers who need to understand and improve complex customer journeys.
{{INLINE_TOFU}}
Challenges and Limitations in Multi-Touch Attribution
Multi-Touch attribution is useful, but it comes with several challenges that marketers should know:
Data Collection Complexities
Tracking users across multiple platforms is difficult due to different data standards and tracking methods. Device switching, ad blockers, and cookie restrictions create gaps. This leads to an incomplete customer journey. Reliable attribution depends on clean, unified data—something not always easy to get.
Technical Implementation Hurdles
Setting up multi-touch attribution takes time, tools, and technical know-how. From embedding tracking codes to integrating platforms, the process can overwhelm small teams. Maintaining clean data pipelines is an ongoing effort. Without resources, errors and gaps can quickly derail results.
Privacy and Compliance Concerns
With GDPR, CCPA, and growing privacy expectations, user consent is now required for tracking online activities. Many users opt out, which limits visibility into their journey. Attribution accuracy drops as a result. Marketers must balance insight with strict data compliance.
Integration with Offline Channels
Most attribution tools focus on digital channels, missing offline actions like phone calls or in-store visits. This leaves a blind spot for businesses that rely on human interaction. Bridging offline and online data is possible, but it takes extra effort. Without it, attribution stays incomplete.
Attribution Window Limitations
Attribution systems usually look at a fixed time frame, like 30 or 90 days. This works for short sales cycles, but long-term buyers often start earlier. Key top-of-funnel touchpoints can be missed. That skews results and undervalues early interactions.
Model Selection Confusion
Choosing the right model—linear, U-shaped, or time decay—is not always clear. Each business has unique goals and customer behavior. Picking the wrong model can lead to misinformed budget decisions. It takes testing and tuning to find the right fit.
Data Overload and Complexity
Multi-Touch Attribution tools generate lots of granular data. Without proper filtering and visualization, it’s easy to get lost. Teams need time and skill to make sense of it. Otherwise, insights turn into noise instead of action.
Inconsistent Data Standards Across Platforms
Different platforms define metrics differently—what’s a ‘conversion’ in one tool might not match another. This leads to inconsistent reports and questionable insights. Normalizing data across sources is critical but often overlooked.
Costs and Licensing Fees
High-end attribution tools can be expensive, with costs for software, setup, and support. For smaller teams, it may not feel worth the investment. Even after adoption, ongoing maintenance adds to the expense. That makes cost a real barrier for many.
These challenges do not reduce the value of multi-touch attribution, but knowing them helps set realistic expectations and develop strategies to lessen their impact. The key is to recognize these limits while working to create the best attribution system for your business needs.
How to Overcome Common Challenges in Multi-Touch Attribution?
1. Simplify and Standardize Data Collection
Start by using consistent tracking methods across all platforms, such as UTM parameters, standardized naming conventions, and tag managers (e.g., Google Tag Manager). Leverage first-party data and server-side tracking where possible to reduce reliance on third-party cookies.
2. Invest in the Right Technology Stack
Choose attribution tools that offer built-in integrations with your marketing and CRM systems. Platforms like Factors.ai or Segment can simplify setup and help connect fragmented data sources. Look for solutions with low-code or no-code options to ease technical implementation.
3. Address Privacy and Compliance Proactively
Implement clear consent banners and ensure your systems comply with regulations like GDPR or CCPA. Use consent management platforms and privacy-focused analytics tools to build trust and gather data responsibly.
4. Combine Online and Offline Tracking
Bridge the gap between digital and offline interactions with tools like call-tracking software, QR codes, in-store promo codes, or customer surveys. Sync this data with your CRM to get a more complete view of the customer journey.
5. Adjust Attribution Windows for Longer Sales Cycles
Customize the attribution window to match your typical buying cycle. If your sales process spans 90+ days, extend your lookback period accordingly in your attribution tool. This ensures early-stage interactions get proper credit.
6. Choose Models That Match Your Goals
Don’t overcomplicate things at the start. Begin with basic models, such as linear or time decay. As your team matures, test custom or algorithmic models to refine insights. Model testing and comparison help identify what best reflects your customer behavior.
7. Train Teams and Encourage Adoption
Offer training sessions and documentation to help marketing, sales, and analytics teams understand how marketing attribution works. Encourage data-driven decision-making by making insights easy to access and apply.
8. Regularly Audit and Improve Your Setup
Review your attribution system every quarter. Check for tracking gaps, outdated tools, or broken integrations. Keep documentation updated and refine based on what’s working and what’s not.
9. Control Costs with Scalable Solutions
Start with affordable tools and scale up as needed. Many platforms offer modular pricing or freemium tiers so you can gradually expand without overspending.
Future Trends in Multi-Touch Attribution
As marketing becomes more complex and data-driven, multi-touch attribution (MTA) is evolving fast. Here are some key trends shaping its future:
1. Rise of AI and Machine Learning
AI is making attribution models smarter. Machine learning can automatically adjust credit allocation based on performance data, predict customer behavior, and improve accuracy over time, without manual tuning.
2. Shift to First-Party Data
With third-party cookies being phased out, marketers are relying more on first-party data. This trend prompts brands to establish direct relationships with customers and collect data through their own channels, such as websites, apps, and emails.
3. Privacy-Compliant Attribution Models
As regulations like GDPR and CCPA tighten, attribution platforms are developing privacy-first solutions. Expect more anonymized tracking, consent-based data collection, and compliance-focused features built into attribution tools.
4. Cross-Device and Omnichannel Tracking
Users jump between devices constantly. New attribution tools are improving their ability to stitch together cross-device journeys using login-based or probabilistic matching, giving a more complete view of user behavior.
5. Integration with CDPs and CRMs
More businesses are integrating attribution with customer data platforms (CDPs) and CRMs to unify online and offline data. This allows marketers to track the full lifecycle, from awareness to retention, in a single system.
6. Real-Time Attribution Insights
Speed matters. Attribution systems are moving toward real-time reporting, allowing marketers to adjust campaigns instantly based on performance, especially useful in fast-moving industries or short sales cycles.
7. Focus on Incrementality and Lift
Beyond just crediting conversions, marketers now want to measure lift — the actual impact of a campaign compared to a control group. Expect more attribution tools to include experimental design and A/B testing for deeper insights.
8. Simplified, User-Friendly Interfaces
As adoption widens, vendors are investing in cleaner dashboards and intuitive model setups. Tools are becoming more accessible to marketers without heavy data science skills.
9. Attribution Beyond Marketing
Attribution is expanding beyond marketing. Sales teams, product managers, and even customer success departments are beginning to use attribution insights to guide their strategies and optimize the customer experience.
10. Attribution for B2B and Long Sales Cycles
Expect to see better MTA models tailored for B2B companies, with account-based views, multi-stakeholder tracking, and support for longer, non-linear journeys common in enterprise sales.
Related reading: Ultimate guide to Advanced Marketing Analytics Techniques
Multi-Touch Attribution in 2025: Rethinking How Marketing Gets Credit
In today’s nonlinear marketing world, understanding what truly drives conversions requires more than single-touch metrics. Multi-Touch attribution (MTA) breaks down the customer journey across social ads, content, emails, and search, assigning value to each meaningful interaction. It helps marketers identify the fundamental drivers behind performance, beyond the misleading simplicity of first- or last-click models. This guide explains how MTA enables smarter budgeting, sharper ROI measurement, and more cohesive team collaboration. At the same time, it unpacks the complex barriers that come with fragmented data, privacy regulations, and long buying cycles. To move forward, brands must streamline data collection, align models to their goals, and adopt scalable, privacy-compliant tools. As attribution advances with AI, real-time insights, and CRM integration, it becomes an essential strategy, not just for marketers but for the entire revenue engine.
Metadata vs. Factors.ai: Choosing the Best Platform for Campaign Management
Explore the strengths and challenges of Metadata and Factors for audience targeting and campaign management.
TL;DR
Metadata and Factors excel in audience targeting and campaign management but cater to different needs. Metadata shines in handling complex, multi-channel campaigns and large-scale experiments across Google, Facebook, and LinkedIn, offering advanced automation for optimizing pipeline and revenue. However, it can be challenging due to campaign fragmentation, high volumes of data, and a steep learning curve.
Factors, on the other hand, provides a more streamlined approach focused on LinkedIn and Google. It emphasizes improved audience syncing, reporting, and cost-effectiveness, potentially making it more suitable for businesses focusing on these platforms. With upcoming features like Google ABM and Facebook ABM, Factors is set to offer a comprehensive solution that could give it a slight edge, particularly for LinkedIn-centric strategies.
Before we dive into the comparison, let’s learn a little more about Metadata.
When it comes to marketing, data isn’t just king—it’s the whole royal court! Imagine trying to navigate your ad campaigns without a clear map; that’s where Metadata comes in. Think of it as your GPS for marketing, offering a structured approach to handling heaps of information and refining your strategies across big names like Google, Facebook, and LinkedIn.
Metadata is like the backstage crew of a major production, ensuring everything runs smoothly. It’s more than just a tool; it’s a game-changer that takes the guesswork out of campaign management. Diving deep into customer-facing platforms enhances your targeting precision and automates ad management, making your marketing efforts efficient and effective. Metadata is a must-have ally for marketers aiming to make every dollar count in the quest for optimal ad spend and campaign success.
About Metadata's Positioning in the Market
Metadata differentiates itself by strongly emphasizing campaign management across major platforms: Google, Facebook, and LinkedIn. These platforms are pivotal for B2B and B2C interactions, central to effective demand generation. Unlike traditional ABM platforms that often focus on third-party display advertising systems, Metadata enhances marketing efforts by providing a unified approach to launching, optimizing, and tracking campaigns across these critical channels.
Metadata's platform is designed to streamline campaign management through automation. It allows users to efficiently handle ad targeting, budget allocation, and performance optimization. This automation is crucial for businesses aiming to scale their marketing efforts without adding complexity to their operations. By offering advanced capabilities for audience targeting and budget management while maintaining control over metrics and attribution settings, Metadata supports a more strategic and data-driven approach to campaign management.
Key Capabilities of Metadata's Platform
The core of Metadata’s platform lies in its ability to provide robust capabilities for audience targeting, campaign optimization, and revenue maximization. Let’s break these down:

a. Revenue Optimization
One of Metadata’s standout features is its AI-driven revenue optimization capabilities. Instead of wasting marketing budgets on underperforming campaigns, Metadata uses artificial intelligence (AI) to automatically reallocate ad spending toward channels, audiences, and creatives that generate the highest pipeline and revenue. This real-time optimization ensures that marketing dollars are efficiently utilized, preventing budget waste and enhancing return on investment (ROI).
Key benefits include:
- Customizable metrics and outcomes aligned with specific business goals.
- AI-powered optimization using customer relationship management (CRM) data to maximize ROI.
- Advanced budget management that focuses on spending on the most effective campaigns and reducing waste.
b. Audience Targeting

Accurate audience targeting is a cornerstone of any successful campaign. Metadata matches business profiles with personal emails, allowing marketers to ensure their efforts reach decision-makers where they are most active. By integrating first-party, third-party, and intent data, Metadata enhances targeting capabilities, ensuring businesses engage with their ideal audience across platforms such as Facebook, Google, and LinkedIn.
Capabilities of Metadata’s audience targeting include:
- Flexible audience segmentation uses data sources like first-party, third-party, and intent data.
- Cross-channel targeting enables marketers to reach their actual buyers on multiple platforms.
- Activation of intent data, ensuring outreach to individuals and accounts demonstrating an active interest in a product or service.
c. Campaign Automation
Managing campaigns across multiple platforms can be labor-intensive, but Metadata’s campaign automation simplifies this process. Marketers can use a centralized platform to launch and manage their campaigns across various channels without manually rebuilding them on each platform. This automation allows marketing teams to focus on strategy and creativity rather than repetitive campaign management tasks.
Some of the highlights of Metadata’s campaign automation include:
- A centralized campaign library where marketers can store and reuse campaign assets efficiently.
- The ability to launch and manage campaigns simultaneously across Google, Facebook, and LinkedIn, ensuring consistent execution.
- Time savings through automation allow marketers to focus on higher-level tasks like strategy and revenue growth.
d. Campaign Experimentation
Metadata also supports large-scale experimentation to help improve campaign performance. Businesses can conduct thousands of small, automated experiments through its platform to test audiences, creatives, and messaging variations. This experimentation leads to continuous optimization, with data-backed insights driving future campaign adjustments for better results.
With Metadata’s experimentation system, businesses can:
- The ability to experiment with audience segments, creatives, and content offers without extensive manual work.
- Immediate application of insights gained from experiments to live campaigns, improving real-time performance.
- The capacity to scale experimentation ensures campaigns evolve and improve based on concrete data and results.
{{INLINE_BOFU}}
Campaign Experimentation System with Metadata
Metadata’s platform is designed around continuous campaign experimentation, crucial for optimizing marketing campaigns. The system allows businesses to break down more extensive campaigns into multiple smaller, targeted experiments. Each experiment can test variables such as audience segments and creative variations to uncover the most effective combinations.
Key Features of Metadata’s Experimentation System:
Granular Testing:
Businesses can examine different audience groups and creative approaches in detail by segmenting a larger campaign into various smaller tests. This granular testing enables a precise analysis of which combinations yield the best performance.
Real-Time Analysis:
Metadata’s platform provides real-time data on campaign performance, allowing marketers to identify which variables are driving the best results quickly. This immediate feedback loop facilitates swift adjustments and optimizations, ensuring campaigns remain effective and efficient.
Scalable Experimentation:
The experimentation system is designed to scale, simultaneously accommodating a large volume of tests. This scalability is ideal for companies looking to expand their ad campaigns while maintaining control over key performance metrics.
Data-Driven Insights:
Continuous experimentation generates valuable insights into audience behavior and creative effectiveness. Marketers can leverage these insights to refine their strategies and make data-driven decisions, leading to improved campaign outcomes.
Let’s Talk About MetaMatch & It’s Capability
MetaMatch is one of Metadata's most innovative tools. This feature ensures that marketing and sales teams are precisely targeting the same audience by aligning business profiles with personal emails across paid social channels. For B2B marketers, this is critical, as audience targeting accuracy can make or break a campaign.
Here’s How MetaMatch Ensures Marketing and Sales Teams Target the Same Audience
MetaMatch takes the guesswork out of audience targeting by directly linking marketing efforts and sales objectives. For instance, uploading personal and business email lists ensures that LinkedIn campaigns reach the intended decision-makers and influencers within target accounts. This alignment between sales and marketing increases the likelihood of converting leads into actual buyers.
Importance of Audience Targeting Accuracy in B2B Campaigns
For B2B companies, audience targeting accuracy is crucial to ensure marketing budgets are well-spent on relevant audiences. MetaMatch helps businesses navigate this challenge by providing a comprehensive solution for matching and targeting the right individuals across multiple platforms, ensuring that every dollar spent contributes to the company’s bottom line.
Operational Challenges of Metadata

Source: Metadata.io Reviews & Product Details
While Metadata offers a powerful platform for automating and optimizing B2B marketing campaigns, it comes with its operational challenges. These challenges are crucial, especially for businesses with varying resources and expertise. Here's a breakdown of the critical operational challenges associated with Metadata:
Fragmentation of Campaigns Across Platforms:
Challenge:
Managing campaigns across multiple platforms like Google, Facebook, and LinkedIn can lead to fragmentation. Despite Metadata’s efforts to unify and automate campaign management, the inherent differences in reporting and performance metrics across these platforms can create inefficiencies. Marketers may struggle with disjointed reporting, making reconciling performance data and comparing outcomes across channels difficult.
Impact:
For businesses without a dedicated marketing operations team, the manual oversight required to handle these fragmented campaigns can negate some of automation's benefits.
Complexity in Handling Large Volumes of Campaigns:
Challenge:
Metadata’s ability to run thousands of experiments simultaneously offers significant potential and introduces complexity. Managing a high volume of experiments demands a robust understanding of the platform and a clear strategy for analyzing results. The sheer scale of experimentation can make it challenging to interpret data effectively.
Impact:
Companies may find it overwhelming to keep up with the volume of experiments and the resulting data, which can make it difficult to make informed decisions and optimize campaigns effectively.
Operational Overhead and Maintenance:
Challenge:
Maintaining campaigns and adapting to the evolving digital advertising landscape requires continuous effort. Although Metadata automates many aspects of campaign management, users must stay vigilant with platform updates, new ad formats, and shifting audience behaviors. The platform’s AI-driven features necessitate ongoing oversight to ensure campaigns remain relevant and effective.
Impact:
This ongoing maintenance can become an operational burden, particularly if businesses lack the resources to manage these tasks efficiently.
Learning Curve and Resource Requirements:
Challenge:
Metadata’s advanced capabilities come with a steep learning curve. Marketers must become well-versed in its features, including audience targeting, campaign automation, and large-scale experimentation. Smaller teams or those lacking specialized expertise might struggle to leverage the platform’s capabilities fully.
Impact:
The resource intensity required to use Metadata effectively can be a barrier for some businesses. Without adequate personnel or expertise, users may find it difficult to unlock the platform's full potential, which could lead to suboptimal campaign performance.
Not Suitable for Every Business:
Challenge:
Metadata is particularly effective for large enterprises with substantial marketing budgets and dedicated teams. However, smaller businesses or those with less complex marketing operations may find the platform’s extensive features overwhelming or unnecessary.
Impact:
A simpler and more streamlined platform might be a better fit for these businesses, as Metadata’s advanced functionalities may not align with their specific needs or capabilities.
Metadata’s advanced features can greatly enhance marketing operations and campaign performance, but businesses must be prepared to address these operational challenges. From managing fragmented campaigns to overcoming a steep learning curve, effective use of Metadata requires a strategic approach and sufficient resources. Businesses that navigate these challenges effectively find Metadata a powerful tool for optimizing their marketing efforts across multiple channels.
Sync Audience to LinkedIn
Metadata’s platform offers a powerful feature for syncing audience data with LinkedIn, an essential tool for B2B marketers. LinkedIn is a primary platform for B2B marketing due to its professional user base. By synchronizing audience data with LinkedIn, businesses can effectively target their campaigns to reach key decision-makers and influencers within their target accounts. This integration ensures that marketing efforts are precisely aligned with the right audience, enhancing the effectiveness of B2B campaigns on LinkedIn.
How Factors Stands Out
Audience Syncing with LinkedIn and Google ABM
Factors distinguish itself with streamlined audience syncing capabilities, particularly with LinkedIn and Google. Factors’ AdPilot is designed to enhance ROI on LinkedIn campaigns, aiming to deliver up to 2X ROI by providing a cost-effective and efficient solution for audience targeting and campaign management. Additionally, Factors is set to introduce Google ABM later this year, which is expected further to strengthen its competitive edge in the cross-channel ad space.
Avoiding Campaign Fragmentation and Improved Reporting Capabilities
One of the Factors’ standout features is its approach to minimizing campaign fragmentation. While Metadata users may encounter challenges managing campaigns across various platforms and dealing with fragmented reporting, Factors consolidate campaigns into a unified reporting framework. This integration provides more precise, more actionable insights and improved reporting capabilities, which can lead to better ROI optimization.
Cost-Effectiveness for Businesses Focused on LinkedIn and Google
Factors is desirable for businesses that prioritize LinkedIn and Google for their ABM campaigns. It offers a cost-effective solution compared to Metadata, especially for companies focusing primarily on these platforms. With the addition of Facebook ABM, expected later this year, Factors aims to expand its capabilities, potentially making it an even more compelling choice for businesses looking to optimize their paid social efforts.
In a Nutshell
Metadata and Factors provide effective solutions for audience targeting and campaign management, each with its strengths. Metadata is robust in managing complex, multi-channel campaigns and running large-scale experiments across platforms like Google, Facebook, and LinkedIn. Its advanced automation capabilities make it ideal for companies needing extensive experimentation to optimize pipelines and revenue.
Factors, on the other hand, offers a streamlined approach focused on LinkedIn and Google, emphasizing improved audience syncing, reporting, and ROI optimization. Factors may offer a slight edge for businesses that prioritize cost-effectiveness and efficiency, especially on LinkedIn. With upcoming enhancements like Google ABM and Facebook ABM, Factors is poised to deliver a comprehensive solution across these major platforms.
The main point is that while Metadata excels in high-level automation and multi-channel management, Factors provides a more focused and potentially more cost-effective option, particularly for LinkedIn-centric strategies.

15 Marketing Touchpoints that Will Guide Your Prospect to Book a Demo
Looking to improve your marketing efforts? This blog covers effective marketing touchpoints to help you reach your target audience and increase engagement.

Do you remember Takeshi’s castle and the historic skipping stones?
You jump on the right stones, and there you go, easy to reach the next level of the game. But what if you landed on the wrong stone? Everyone laughed! But that will not happen when you lose your prospect.
Your prospect is that smiling champ getting ready to play the skipping stones of landing on the right marketing touchpoints to reach the happy destination of having a product that solves their problem.
Fret not about the wrong stones, because in this post, we’ll help you pick the perfect 15 marketing touchpoints to help you guide your prospect to book a demo.
What Exactly Is a Marketing Touchpoint?
Marketing touchpoints or digital touchpoints are any form of customer interaction or point of contact that a potential customer has with your brand or company. Every time a potential customer engages with your brand, they're experiencing a marketing touchpoint. Marketing touchpoints can occur through various channels, such as advertising, social media post, email campaigns, events, customer loyalty programs, customer service, or even in-store experiences.
Role of Marketing Touchpoints in a Buyer's Journey
When it comes to marketing touchpoints, it's important for marketing teams to understand that they go beyond just providing information. Each touchpoint should evoke a certain emotion in the customer, whether it's excitement, trust, or happiness. These emotions can influence how the person feels about your brand or product, ultimately leading them towards making a purchase decision. The key here is to have a strong understanding of your customer preferences.
The buyer's journey goes through three important stages: awareness, consideration, and decision.
1. Awareness Stage
This is the first stage of the buyer journey.
Here, the buyer is aware of a pain point that they have. Let's say your potential customer is browsing their LinkedIn feed and comes across an ad for a software company specializing in project management tools. They are already struggling with project management or thinking of switching to automation from manual management.
The ad features an attention-grabbing headline and a compelling image and mentions a free trial offer. That's it! Your LinkedIn ad serves as a marketing touchpoint for the awareness stage, as you've captured their interest in your company and products.
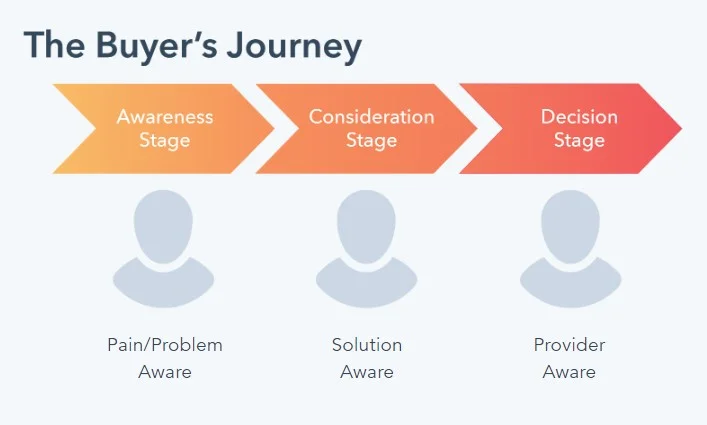
2. Consideration Stage
Now that the buyer has identified a pain point and is sure of it, they will start to evaluate various solutions to their problem. Let’s say that the potential customer has clicked your LinkedIn ad.
They now get directed to your company's website, where they see an interactive product demo, one of the customer experience touchpoints embedded on your website that showcases your product in action and helps the buyer make an informed decision.
This makes a stronger case for the potential buyer to consider your product, as the product demos allow the buyer to see the features and benefits of your product and how it can solve their pain points. When they see your product in action and are convinced you might be a good fit, they shortlist you into their consideration set and move to the next stage.
You can also use other product-focused touchpoints during the consideration stage, such as product tours, product-focused blog posts that show your product in action, and product webinars. These touchpoints provide valuable insights into your product and help the buyer determine if it fits their needs well.
3. Decision Stage
Level three is the most important stage, where the buyer decides which product or service to purchase.
They want to see proof that it's worked for other businesses. At this stage, the buyer goes to your company's website, wanting to find a case study about a similar business that successfully implemented the tool and saw positive results. But guess what? Since they already saw your product in action via product demos and product tours, they are already almost convinced about the purchase.
But marketing touchpoints such as the case study gives that little nudge to build trust and reassure the business owner, ultimately leading them towards making a purchase.
15 Marketing Touchpoints to Motivate a Demo Booking
We’ll share 15 rewarding marketing touchpoints, real-time customer touchpoint examples from top brands, and how you can use them in different stages of the buyer’s journey.
1. Social Media Advertising
First in line - You can run social media ads targeting potential customers to create awareness about your product or service. For example, check out Hubspot’s ads on its social media channels targeting business owners to discover how their CRM platform transforms prospecting, connecting, reporting, and collaboration like never before. With bold graphics and clear visuals, their LinkedIn ad is designed for easy absorption while browsing.
Why Social Media Advertising Is a Good Marketing Touchpoint?
- Its highly targeted nature allows businesses to target specific audiences based on demographics, interests, and behaviors.
- Allows creating campaigns tailored to your ideal customers' needs and preferences, increasing the likelihood that they will engage with your content.
- Potential to reach a large target market for promoting your products or services.
{{INLINE_TOFU}}
2. Educational Blog Posts
Good old long form of content creates wonders. Nothing compensates for creating informative content that addresses the pain points of your target audience and provides solutions.
For example, check out this Moosend’s blog post - What Is Email Marketing? A Beginner’s Guide For 2023. It has everything one needs to know to streamline a successful email marketing process, from definition to benefits and practices. Ultimately, they cleverly made the reader understand how Moosend can help them with everything mentioned in the blog.
Why Blog Is a Good Marketing Touchpoint?
- Helps to drive traffic to your website and attract visitors who are interested in your offerings.
- An effective way to establish yourself as an authority in your industry.
- A very interactive way to engage with your audience is by encouraging comments and if it interests your visitor, it also helps with qualified lead conversions.
💡 Pro tip: In your product-based blog posts, embed product demos as GIFs to show your product in action
3. Webinars
Hosting webinars can be an effective marketing touchpoint as it provides valuable insights and demonstrate your expertise to potential clients.
Check out how ActiveCampaign developed a series of webinars dedicated to announcing its product updates as part of its customer touchpoint strategies. ActiveCampaign used these webinars to promote the company and communicate easily with its customers.

Why Webinars Is a Good Marketing Touchpoint?
- By sharing valuable insights and expertise, you can build credibility with your audience and also increase brand awareness.
- Allow for interactive engagement and position you as an expert in the field with attendees, including live Q&A sessions, polls, and customer satisfaction surveys.
- Can be accessed by attendees from anywhere in the world, making them a cost-effective way to reach a large audience
Customer Testimonials
A very happy marketing touchpoint and no one can deny it. Share the success stories of your loyal customers to showcase the effectiveness and value of your product or service. Check out Notion’s testimonial that made social media cool again. It had the perfect balance of hook, story arc, visuals, takeaway, and music that led everyone to explore Notion’s features.
Why Customer Testimonials Is a Good Marketing Touchpoint?
- When potential customers see positive reviews from existing customers, they are more likely to trust your business and make a purchase.
- Creates an emotional connection with potential customers by sharing real-life experiences of how your product or service has helped solve a problem or meet a need.
- Showcases newer use cases of how your existing customers are using your product, thereby motivating prospects to make a purchase.
5. Product Demos
Offer product demos to potential customers, with no strings attached. Allowing them to experience your product or service firsthand can be a good marketing touchpoint. Topylyne’s product tour is an excellent example. The very first pop-up explains what Topylyne does and how users can benefit from it.
You can learn more about creating a product demo that converts here
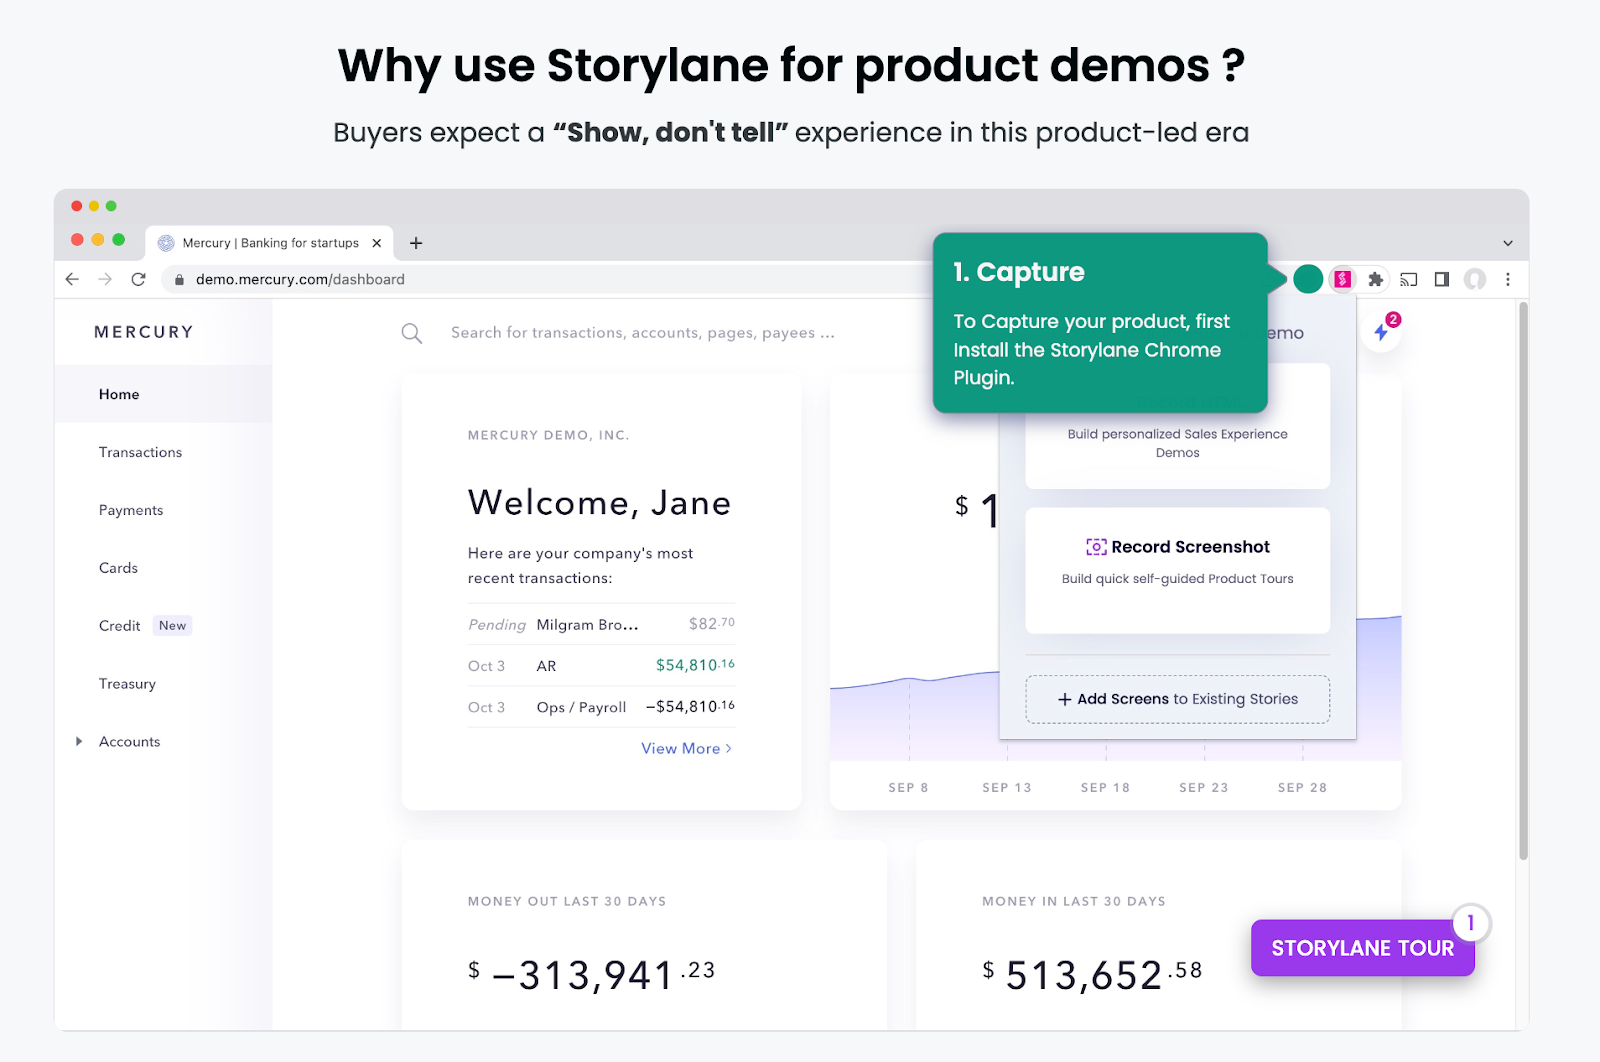
Why Product Demos Is a Good Marketing Touchpoint?
- Helps prospects see your product firsthand with the right product placement, how it works, and how it can benefit them, which can be more persuasive than simply reading about it or watching a video.
- Low-risk for potential customers because they can try your product or service without committing to a purchase.
- Gives your business a competitive advantage by setting you apart from competitors who don't offer a similar experience.
💡 Pro tip: Interactive demos can provide a hands-on experience of your product or service, which has better engagement than a static product demo
6. Chatbots or Live Chat on the Website
A crucial touchpoint that provides real-time support to potential customers through chatbots or live chat on the website.
Check out Hubspot’s live chat and how they use it creatively. Live chat gives these communities an opportunity to have real-time discussions and help Hubspot’s potential customers.
Why Live Chats Is a Good Marketing Touchpoint?
- Allows existing customers to get instant support and answers to their questions, which can help to build trust and confidence in your business so that they stick to your brand.
- Increases engagement by providing a convenient and accessible way for both prospects and customers to interact with your business.
- Offers assistance and guidance to potential customers. In the process, also collects their contact information for follow-up.
7. Referral Programs
It’s no secret that potential customers tend to trust recommendations from their peers more than any form of communication. In fact, a whopping 83% of customers consider friends and family as their most reliable sources of referrals. Check out Dropbox's referral program, which operates on a one-sided reward system. When you refer someone to Dropbox, you’ll both get extra storage.
Why Referral Programs Is a Good Marketing Touchpoint?
- When customers receive recommendations from their peers, they are more likely to trust the recommended product or service
- By incentivizing existing customers to refer their friends and family, businesses can acquire new customers without spending large amounts on advertising
- Referral marketing leads to a higher conversion rate compared to other forms of marketing
8. Promotional Emails
Promotional emails are different from other email campaigns and newsletters. They are sent for one particular purpose and that is to convert more potential customers. One such email is the cart abandonment email that provides an opportunity to remind potential buyers about their interest in a product and include personalized incentives, such as a free demo or consultation, and encourage them to complete the purchase. Check out Away’s cart abandonment email that motivates the recipient to complete a purchase using short, sweet, and no-distraction content.
Why Cart Abandonment Emails Is a Good Marketing Touchpoint?
- It serves as a reminder to customers about the items they left behind in their cart, encouraging them to complete their purchase and increasing conversion rates.
- Can be personalized based on the items in the customer's cart, making the email more relevant and engaging.
- Includes incentives such as discounts or free shipping, which can encourage customers to complete their purchases. These incentives can be a powerful motivator for customers who are on the fence about making a purchase.
9. Email Campaigns
Use email campaigns to send personalized messages and offers to potential customers. Check out this e-mail from Dropbox that strikes a professional and courteous tone while also providing clear instructions and links to template libraries. The call-to-action is prominently displayed, making it impossible to miss.

Why Email Campaigns Is a Good Marketing Touchpoint?
- By tailoring the message to the customer's interests and pain points, businesses can show how their product can solve their specific needs.
- Can include clear and prominent call-to-action buttons that encourage customers to book a demo.
- By sending targeted and relevant follow-up emails, businesses can remind customers of the benefits of their product and encourage them to take action.
💡 Pro tip: Embed a personalized product demo video in your email campaign, inviting the recipient to explore your product more.
10. Newsletters
Newsletters are a great marketing touchpoint as they provide an ongoing way to stay in touch with customers, offer valuable content, and can be targeted to specific customer groups, all while being cost-effective. Check out Invsion’s weekly newsletter which includes a roundup of their best blog content, favorite design links from the week, and a new opportunity to win a free t-shirt!

Why Newsletters Is a Good Marketing Touchpoint?
- Allows businesses to stay in touch with their customers and build ongoing relationships. By providing valuable content, such as tips, insights, and promotions, businesses can establish themselves as a trusted resource and stay top-of-mind with their customers
- Can be tailored to specific segments of a business's audience, allowing them to deliver targeted messaging and promotions to different customer groups.
11. Podcasts
Podcasts can be a highly engaging and informative way to showcase a product and its features. For example, The Customer Engagement Lab is a unique business-comedy video podcast that explores creative sales and marketing campaigns for customer attraction. With in-person interviews, round table discussions, and TikTok reaction customer segments, it offers a one-of-a-kind B2B experience.
Why Podcasts Is a Good Marketing Touchpoint?
- Through engaging conversations and storytelling, businesses can pique the interest of potential customers and motivate them to book a demo.
- Offers the convenience of on-the-go learning. So it can reach a wider audience and create awareness about your product.
- Can increase their visibility and credibility and motivate potential customers to want to learn more about their product through a demo.
12. Offline Conferences
Offline conferences or Summits could be another one where companies can showcase their product, and everyone attendee can get a glimpse of the product. For example, Marketo's "Marketing Nation" community provides resources, events, and networking opportunities for marketers. By building a community around its product, Marketo effectively markets itself as a comprehensive and supportive solution for marketers.

Why Offline Conferences Is a Good Marketing Touchpoint?
- Provides an opportunity for businesses to interact with customers face-to-face, building personal connections and trust.
- Attracts a targeted audience, making it easier for businesses to find potential customers and tailor their product demos to their needs.
- Increases the pace of decision making such as booking a demo as offline events activates a part of the brain associated with active reflections on decision-making
Online Customer Reviews and Ratings
Online reviews and ratings on trusted platforms are a customer experience touchpoint that motivates your prospective customers to book your demo, acting as a marketing touchpoint. Check out this positive review of Storylane, an interactive demo platform that increases trust in that brand.
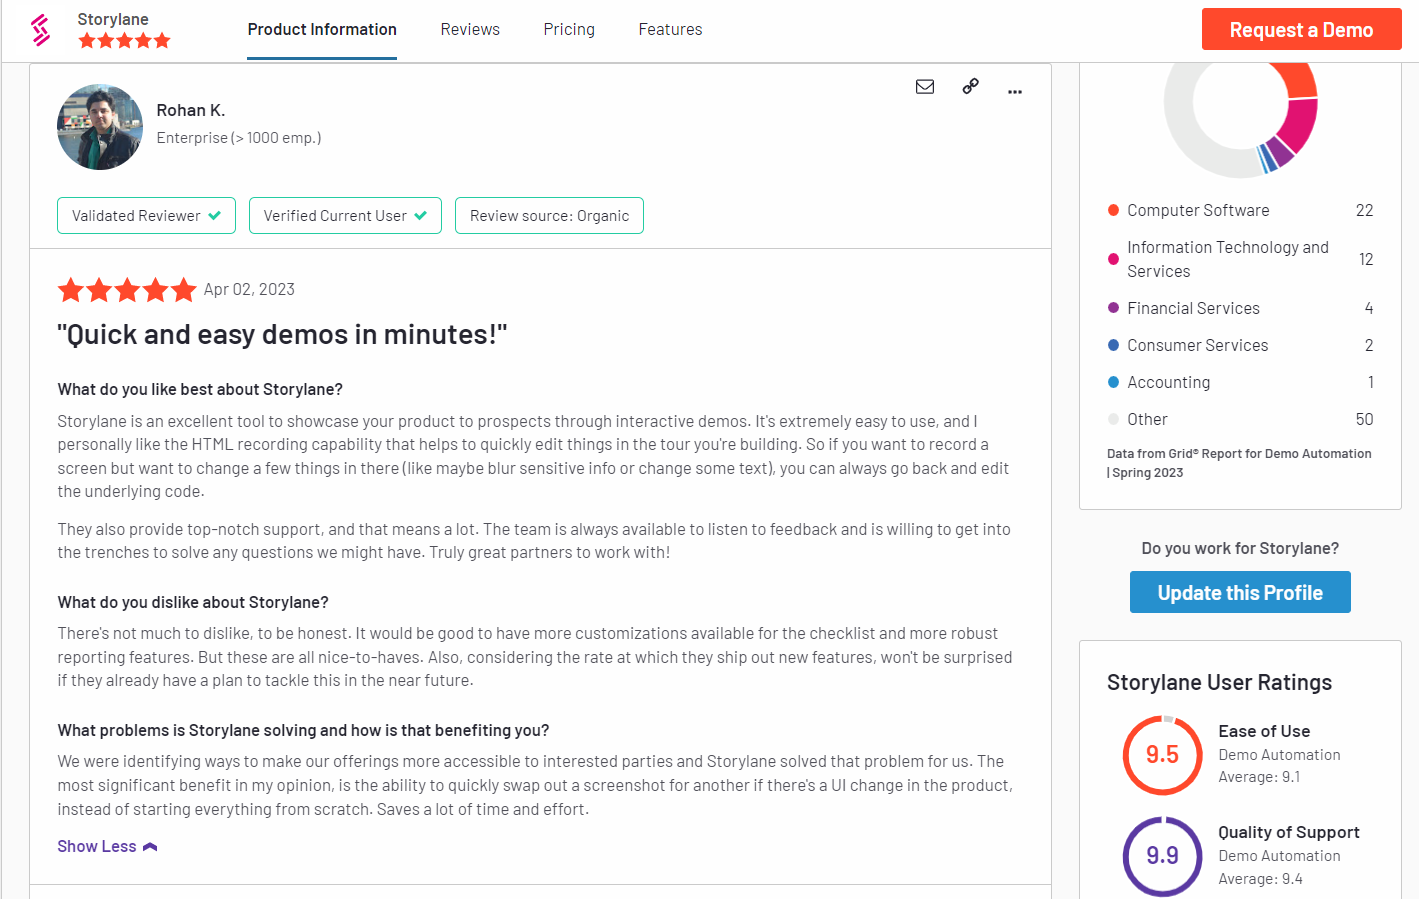
Why Online Reviews And Ratings Is a Good Marketing Touchpoint?
- Acts as social proof and help potential customers evaluate the quality and effectiveness of a product, which can motivate them to book a product demo.
- Increases a business's trust and credibility with potential customers, increasing the likelihood of booking a product demo.
- It provides insights into customers' needs and preferences, allowing businesses to tailor their product demos to meet those needs and preferences better.
💡 Pro tip: Drive user engagement and increase research time by embedding interactive videos on review platforms like TrustRadius and G2. Compared to video demos, interactive demos have 3 times more engagement and lead to an average research time of 40 minutes, while the average web user spends only 45-54 seconds on a website.
14. E-Books
E-books are a good marketing touchpoint as they provide value-added content that can help attract and engage potential customers. For example, The Social Media Trends Report by HubSpot shares insights from industry insiders and helps social media marketers how to adapt marketing strategies to take advantage of the ever-changing social media landscape.

Why E-books Is a Good Marketing Touchpoint?
- By creating informative and valuable e-books, businesses can establish themselves as thought leaders in their industry, thereby gaining the trust of their potential customers.
- Create an opportunity to collect email addresses and nurture the email list with valuable content, thereby staying on top of mind for your subscribers
- Encourages readers to learn more about their product and take the next step towards booking a demo.
15. Whitepapers
Whitepapers are a good marketing touchpoint as they establish thought leadership, provide valuable insights, and help generate leads. Check out Google’s Cloud Security and Compliance White paper. This explains the efficiency of Google Cloud products and services in keeping the data of any workspace safe and secure.

Why Whitepapers Is a Good Marketing Touchpoint?
- Whitepapers are educational resources that provide valuable insights on industry trends and challenges, positioning your business as a thought leader and expert in your field.
- By offering whitepapers as gated content, you can collect contact information from interested readers and follow up with personalized outreach, increasing the likelihood of booking a demo.
- Whitepapers can be repurposed into other formats, such as blog content or social media content, expanding your reach and creating multiple touchpoints for potential customers.
Measuring the Success of Your Marketing Touchpoints
Tracking successful marketing touchpoints is very important and is possible. But it isn’t always easy, as,
- Conversion types can vary widely. For example, some businesses rely on conversions like phone calls, live chat, and form fills to create leads that are then closed offline by sales teams. But it is quite a task to track the volume of these conversion types and attribute the closed revenue back to the marketing channels and campaigns that drove those conversions.
- Customer journey mapping can be lengthy. 15 is just a start. There can be hundreds of touchpoints for some industries. While some insight can be gained into which channels drive conversions, it can be challenging to attribute closed revenue to the proper channels.
- Crediting the last-click conversion is not sufficient enough. It is important to credit all supporting touchpoints in the customer motivation journey. Without proper lead tracking, ensuring that marketing channels and campaigns receive fair credit for driving revenue is impossible.
Effective marketing touchpoints are key to moving prospects through the buyer’s journey and securing demo bookings. Here’s how to optimize each stage:
1. Awareness
Capture attention with LinkedIn ads or blog content that addresses your audience’s pain points and introduces your solution.
2. Consideration
Build credibility through case studies, whitepapers, or webinars that showcase real-world results and thought leadership.
3. Decision
Nudge prospects toward action with personalized emails, targeted retargeting ads, or intent-based outreach.
Using a well-orchestrated mix of these touchpoints ensures a seamless buyer experience—boosting engagement and increasing demo conversions.
Wrapping Up
Understanding the customer's entire journey, business outcomes, and business goals is very important in deciding which marketing touchpoint can be effective for you. By understanding the buyer's journey, finding your customer journey map, and aligning the effective touchpoints accordingly, you can create a seamless experience for your customers. Diversify the touchpoints and experiment with new ones to stay ahead of the competition. Focus on providing value and building trust with customers and successfully use these touchpoints to increase the number of product demos booked and achieve their marketing goals!

MarTech in 2026: How to Build a Lean, Revenue-Driven Stack
A no-BS guide to MarTech in 2026. Learn how to cut tool sprawl, choose the right marketing intelligence and attribution tools, and prove ROI with revenue metrics.

TL;DR:
- Your martech stack doesn’t need to be bigger; it needs to be smarter and leaner.
- MarTech ≠ AdTech: AdTech buys attention, MarTech turns it into pipeline and revenue.
- The market is huge (15k+ tools) and consolidating. Buying by job-to-be-done is non-negotiable.
- Shortlist tools by category: automation, intelligence, attribution (e.g., Factors.ai), and AI automation.
- Implement with simple 14-day playbooks: connect data, standardise naming, build one exec dashboard, automate a few key journeys.
- Prove ROI with SQL rate, pipeline $, win rate, CAC payback, LTV: CAC, not opens and clicks.
- Run 30-day pilots with clear success criteria; if a tool doesn’t move revenue, don’t keep it.
Marketers, how often do you resonate with the sentence, “My martech stack feels more like a SaaS rescue shelter”?
You know what I mean, a stack full of abandoned tools, overlapping features, and mystery invoices.
Well, you’re not alone.
Most B2B marketing teams operate with tens of tools. And yet, the revenue pipeline is often flat, attribution is fuzzy, and the CFO keeps asking why marketing spends more on software than on branding.
MarTech in 2026 is bigger and smarter than ever. Ironically, it is also more confusing than ever.
That’s where this no-BS guide steps in.
I built this to help people in the trenches: marketing ops, demand gen, and analytics leads at B2B SaaS and services firms who don’t need more tools; they need the right tools.
What Is MarTech (and How It Differs from AdTech)?
MarTech is all the software you use to create, automate, personalize, analyze, and measure your marketing efforts. That covers email, SMS, landing pages, reporting, attribution, AI automation, lead scoring, and dashboards.
Basically, if it touches a marketing workflow, it’s MarTech.
Examples you’ll know of: HubSpot, Marketo, Braze, Factors.ai, Salesforce Marketing Cloud, Funnel, Adverity, Looker, Zapier/Make.
It’s much easier to understand than AdTech, which focuses on buying media, optimizing ads, managing bigs, and working with different ad networks. That’s what Google Ads, Meta Ads Manager, DV360, and The Trade Desk do.
The State of MarTech in 2026: Bigger, Smarter, More Consolidated
If the modern MarTech ecosystem were a city, it would be Mumbai or Manhattan: crowded, expensive, and expanding vertically (and uncontrollably).
- There are 15,384 martech solutions in 2025; up 9% YoY from 14,106 in 2024.
- A staggering 1,211 tools were removed (either through acquisition or simply shutting down) ≈8.6% churn.
- Gartner warns that over 40% of agentic AI projects will be scrapped by 2027 because they were “overhyped” or delivered minimal business value.
Enterprise adoption of AI-native tools is growing fast, but usage depth is low. Everyone’s buying AI market intelligence software, but they don’t seem to know what to do with it…yet.
For you, fellow marketer, that means not just more choice than ever before, but also more noise.
The 2026 Category Map for Market Intelligence Tools
Ever woke up thinking, “Wow, we need another tool.” Me neither. Early morning thoughts usually include, “Why is attribution still lying to me?” or “Why are our leads stalling at SQL?”, "Why aren't these marketing campaigns working?", or "Where are the actionable insights I was promised?"
You pick the right marketing automation tools to give you real competitive intelligence when you think of the job to be done. Forget market trends and industry trends for a bit; what does the tool need to get done for you to thrive?
Here’s a framework that actually maps how operators buy MarTech in the real world:
| Job To Be Done | Outcome You Want | Tool Category | Example Platforms |
|---|---|---|---|
| Orchestrate journeys, automate engagement, scale lifecycle campaigns | Higher engagement, increased SQLs, reduced manual work | Marketing automation SaaS | HubSpot, Marketo, Braze, Salesforce Marketing Cloud |
| Unify data, build dashboards, track emerging market trends & competitors | Single source of truth, better insights, faster decisions | Marketing intelligence tools | Funnel, Adverity, Fivetran • Klue, Crayon |
| Understand what drives pipeline & revenue; reduce wasted spend | Accurate attribution, smarter spend, tighter CAC | Attribution & analytics | GA4, Looker • Factors.ai (multi-touch, account-based attribution) |
| Automate workflows, deploy AI agents, reduce manual load | Faster execution, lower headcount cost, fewer repetitive tasks | AI automation tools | Adobe Agents, Zapier/Make, emerging agentic AI |
{{INLINE_TOFU}}
How to Choose Marketing Intelligence Software in 2026
Don't sign another six-figure martech contract just yet. Before that, run every vendor through this filter. If they fail more than 2–3 of these, you'll probably regret buying the marketing intelligence platform. If it meets all of these, you're buying a competitive edge.
- Clear use-case & KPI: What will this tool move?
Finish this sentence. If you can't, don't buy it.
“We’re buying this tool to [do X], so that we can improve [metric] by [Y%] in [Z months].”
B2B firms usually look at these KPIs:
- SQL rate (lead → opportunity)
- Pipeline generated (by channel/campaign)
- Win rate
- CAC and payback period
- LTV:CAC
Ask vendors:
- “Which specific KPIs do your most successful customers track with your product?”
- “Can you show examples of before/after metrics (anonymized, of course)?”
- “What results should we not expect in the first 90 days?”
Red flags: Vague answers like “better engagement” or “AI-powered experiences” that do not connect to SQLs, opps, or revenue.
- Data model & PII handling
You're not just buying a tool's features but also its data model and risk profile.
With GDPR, CCPA, and many U.S. state laws, mishandled PII creates liability. Fines under GDPR can be up to 4% of global annual turnover or €20M (whichever is higher).
Ask vendors:
- “Do you act as a processor or controller under GDPR?”
- “Where is data stored geographically?
- “How do you handle deletion/‘right to be forgotten’ requests?”
- “What exactly do you store on leads, contacts, and accounts?”
Red flags: If they say, “We’re still working on our DPA,” or “we don’t really store PII… just names, emails, and IPs.”
- Integration with CRM / warehouse / CDP
Any tool that cannot connect to your CRM and data warehouse is dead weight. The right marketing intelligence platform will do exactly that.
Data professionals spend ~44% of their time just on data preparation and integration. Integration-hostile tools simply further complicate this conundrum.
Here's what you cannot do without:
- Native integration with your CRM (Salesforce, HubSpot, Dynamics, etc.)
- API access for custom needs
- Webhooks or event streaming for close to real-time updates
- Ability to sync with your warehouse or data lake (Snowflake, BigQuery, Redshift, Databricks)
Ask vendors:
- “Do you have production customers using [our CRM] + [our MAP] with no custom middleware?”
- “What data syncs both ways, and what’s read-only?”
- “What’s the typical integration time with stacks like ours?”
Red flags: They say, “We integrate with everything via Zapier,” or “Yes, we can integrate, you just need a small services project…” RUN.
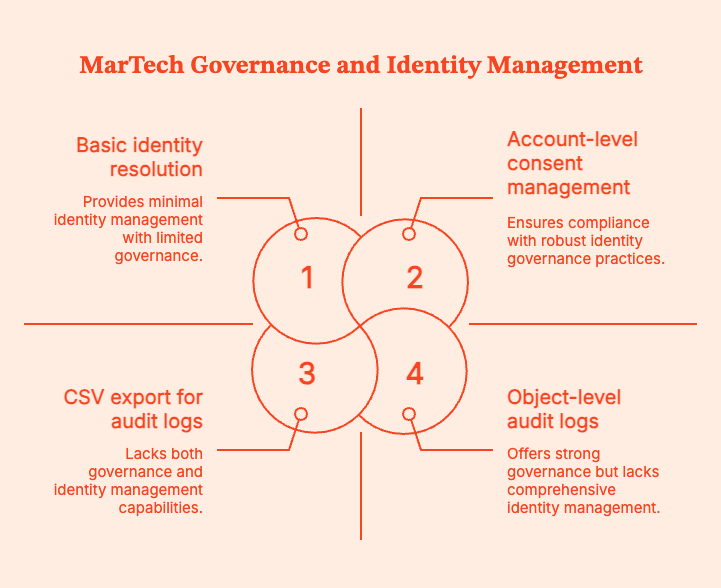
- Governance & audit logs
Governance is non-negotiable, especially when AI or automation enters your stack.
Managers and teams need to know:
- Who created or edited workflows, segments, models?
- When AI acted autonomously vs. when a human approved.
- What data was changed and why?
A 2024 IBM Cost of a Data Breach report found that the average breach costs $4.88M globally. Poor access controls and auditability will make it harder to detect and minimize the impact of customer data breaches.
Ask vendors:
- “Do you have object-level audit logs for workflows, models, and campaigns?”
- “Can we restrict who can publish AI-generated changes?”
- “Can we export logs for compliance?”
Red flags: Anyone says, “We can send you CSV exports if you need history.”
- Identity & consent
In B2B, your real unit of value isn’t just a “lead,” it’s an account. Your tools need to:
- Stitch people to accounts.
- Resolve anonymous traffic by identifying likely accounts (reverse IP, B2B intent data).
- Respect consent and preferences across channels.
Reverse IP and account intelligence tools like Factors.ai can help find companies visiting their sites and connect their activity to CRM accounts. I've personally used it to close large attribution and intent gaps.
You might like to read: Top 7 Marketing Attribution Tools in 2025
Ask vendors:
- “How do you resolve identities across web, email, ads, and CRM?”
- “Do you support account-level journeys and reporting?”
- “Can your platform ingest and respect consent flags from our existing systems?”
Red flags: They say, “We treat everyone as just users with emails”.
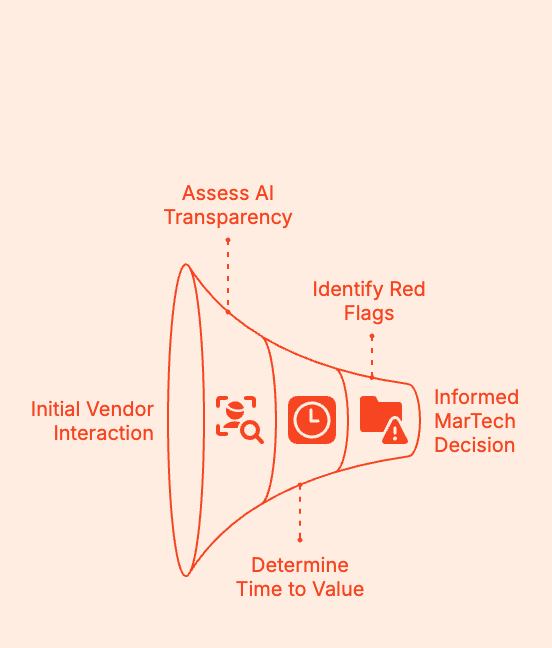
- AI transparency
You need to identify AI tools that deliver valuable insights, driving revenue growth. Don't be fooled by marketing hype.
Ask vendors:
- “List specific tasks your AI can perform end-to-end without human intervention.”
- “What is human-in-the-loop vs. fully automated?”
- “Why was the lead scored high?”
- “If your AI makes a wrong decision, how do we roll back or correct it?”
Red flags: They say, “It just learns from your data,” or “it’s like having a marketing co-pilot.”.
- Time to value (TTV)
Let's say a tool takes 6–9 months to implement, plus another 3–6 months to meaningfully impact the pipeline. That is a 12-month bet.
With a median initial contract length of often 12 months, you might be renewing a tool before you’ve truly seen ROI.
So, ask vendors:
- “What have customers with a stack like ours achieved in the first 30, 60, 90 days?”
- “What is your typical onboarding timeline for [company size/type]?”
- “What’s not realistic to expect in the first quarter?”
Red flags: The vendor says, “It depends,” with no examples from similar customers.
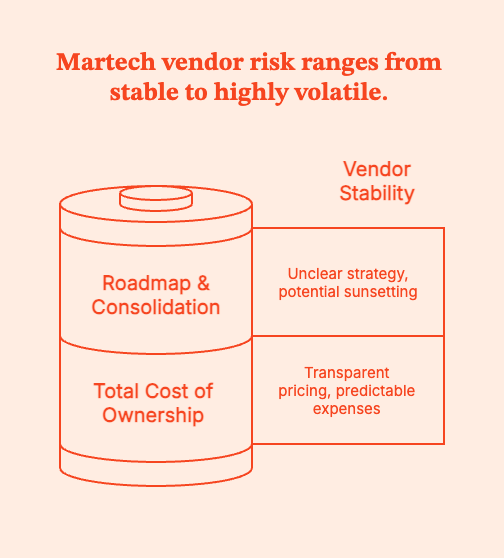
- Total cost of ownership (TCO)
The annual licence is usually the tip of the pricing iceberg.
Real TCO includes:
- Licence/subscription
- Onboarding/implementation fees
- Required seats (marketing, sales, ops, analytics)
- Services (vendor PS, agency hours, contractors)
- Data/storage/compute or AI “credit” overages
- Internal time (ops, analytics, IT)
Zylo’s 2024 SaaS Management Index found that “at least 50% of SaaS licences are underutilised or unused” in many enterprises.
Ask vendors:
- “What’s the typical all-in cost (licences + services) for customers similar to us?”
- “How many FTEs do we realistically need to operate this tool well?”
- “Coverages, add-on modules, mandatory PS?”
Red flags: “We’ll work something out with your rep,” and 14 different SKUs for basic functionality.
- Roadmap & consolidation risk
Martech vendors are being bought, rolled into suites, or quietly sunset. Especially if they incorporate AI or machine learning.
It's possible that your chosen tool might:
- get sunset,
- become a buried feature in a suite,
- pivot away from your use case.
Ask vendors:
- “Where does your product sit in your company’s long-term strategy?”
- “Have you sunset any major features in the last 24 months?”
- “If you were acquired tomorrow, what protections would we have (data export, contract terms)?”
Red flags: Entirely inbound-driven product plans (“we build whatever customers ask”), or obvious “built to flip” intent.
Shortlists to Evaluate: My Recommendations
For more details, we’ve also laid out the 9 Best B2B Marketing Tools and Platforms.
1. Marketing Automation SaaS
- HubSpot
- Marketo
- Braze
- Salesforce Marketing Cloud
2. Marketing Intelligence Tools
- Funnel
- Adverity
- Fivetran
- Klue
- Crayon
- Brandwatch / Sprout Social (for social intel)
3. Attribution & Analytics
- GA4 + Looker
- Factors.ai (multi-touch attribution, account journeys, revenue modeling)
- HockeyStack
- Improvado
4. AI Automation Tools
- Adobe Agents
- Zapier / Make
- Early-stage GTM agents (with caution; proof > promises)
Implementation Playbook: Automation for Data-Driven Decisions
| Phase | Days | What to Do | Output / Milestone | Success Signals |
|---|---|---|---|---|
| Plan | 1–2 | Pick 2–3 revenue-critical journeys (demo, trial, pricing) and define triggers & success metrics | Clear journey map = “Who enters → What they get → What success means” | Alignment across marketing → ops → sales |
| Prepare | 3–4 | Import *only consented* contacts; fix fields (job title, region, lifecycle, source) | Clean, segmented audience with correct lifecycle stages | No “zombie lead” contamination |
| Build | 5–7 | Create 3 flows — Welcome, Nurture, Reactivation — with short, value-forward messaging | All 3 flows completed with logic + content | First batch of leads ready to enter flows |
| Enhance | 8–9 | Add routing: alerts for high intent, tasks for SDRs, simple scoring rules | SDR notified when buying signals spike | Time-to-follow-up drops sharply |
| QA | 10–11 | Check links, triggers, CRM sync, device rendering, unsubscribe/preferences | Zero delivery/UX blockers | Sales won’t get bad-fit or confused leads |
| Launch + learn | 12–14 | Launch → monitor SQL rate, opp creation, cycle speed daily for 5 days | First automated leads progressing through funnel | Increase in SQLs and opps attributable to automation |
Implementation Playbook: Intelligence for Competitive Advantage
| Phase | Days | What to Do | Output / Milestone | Success Signals |
|---|---|---|---|---|
| Connect | 1–2 | Sync CRM + ad platforms + automation platform into single pipeline | All performance + funnel data flowing | No manual reporting patchwork |
| Normalize | 3–5 | Standardize naming (region, channel, segment, stage, objective, campaign type) | Unified taxonomy adopted across channels | Reporting filters become usable |
| Build | 6–9 | Create ONE executive dashboard (Leads → SQL → Opp → CW, CAC, attribution influence) | CRO-friendly dashboard with 60-sec readability | Leaders voluntarily reference it |
| Analyze | 10–11 | Track anomalies and trends every week across CPL, SQL%, spend, opp cost, and pipeline contribution | Weekly “show me what changed and why” | Decisions driven by insights, not opinions |
| Share | 12 | Present 30-minute readout: 🔹What’s working 🔹What’s not 🔹What we’re changing next | Leadership alignment + budget flexibility unlocked | No more “marketing doesn’t know what’s going on” |
| Operationalize | 13–14 | Turn repeated insights into playbooks (“When this happens → do this”) | Reusable playbooks for budget shifts and optimization | Weekly iteration loop becomes a habit |
Proving ROI
Your CFO and CRO don't care about the number of leads. Stop reporting stats that describe activity and report stats that describe revenue impact.
An email got a 42% open rate. No one cares.
A landing page got a 2.7% CTR. Congratulations! Where's the deal closed?
Metrics that matter are tied to sales outcomes and cash flow.
Don’t forget to take these 10 Key Customer Engagement Metrics into account.
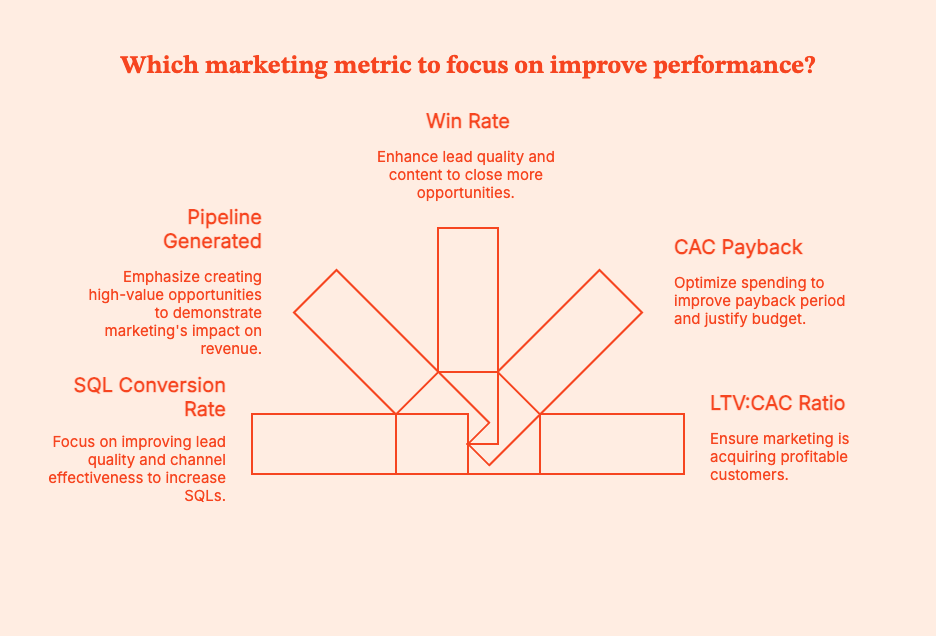
- SQL Conversion Rate
SQL Rate = (Number of leads that turned into Sales Qualified Leads ÷ Total leads) × 100
Pro-Tip: To know which channels and journeys generate SQLs vs. just “marketing-qualified traffic”, use Factors.ai to connect form fills + product usage + sales touches + web behavior. You'll find which touchpoints move contacts to SQL.
- Pipeline Generated (in $)
What it tells you: Pipeline is the total dollar value of opportunities that marketing helped create or influence. Pipeline is the common language between marketing and sales. If marketing grows a pipeline reliably, the CFO will see the value of spending.
- Win Rate
Are leads entering opportunities that can actually close?
Win Rate =Total Opportunities/Closed Won Opportunities
An improving win rate implies that:
- Lead quality is up
- ICP targeting has sharpened
- Content is helping deals move faster
4. CAC Payback
CAC Payback = Gross margin per month/Cost to acquire a customer
Pro-Tip: If payback improves after a new spend or tool, no one questions the budget.
5. LTV:CAC Ratio
LTV: CAC = Customer Acquisition/Cost Lifetime Value
This metric proves that marketing is closing profitable customers.
30-Day Pilot Plan Template
Entry Criteria: Do Not Start Without These
| Entry Requirement | Definition | Why It Matters |
|---|---|---|
| Clean data | Contact + account data is de-duplicated, lifecycle stages are accurate, lead source/UTM consistent | Dirty data will mess up your SQL rate, attribution, and pipeline impact |
| Clear KPI | Single primary target metric, e.g., “improve SQL rate by 15% in 30 days” or “reduce CAC payback below 12 months.” | You need this "north start" if you don't want the test to drift and become impossible to measure. |
| Defined use-case | Narrow scope (e.g., trial → SQL nurture, demo → opp acceleration, reverse IP → outbound intent) | Enables fast launch and easy to measure impact |
| Baseline metrics captured | Snapshot of performance before pilot begins | “before vs after” comparisons: no ambiguity |
Pilot Execution (30 Days)
| Week | Focus | Key Activities | Outputs |
|---|---|---|---|
| Week 1 | Setup & activation | Configure the tool, connect CRM + MAP + ad platforms, import clean data, map workflows | Tool is operational, integrations working, data is data-ing |
| Week 2 | Launch use-case | Deploy the targeted use case (example: nurture flow, anomaly alerts, reverse IP → SDR alerting) | “Day 1” of usage on real leads/accounts |
| Week 3 | Evaluate performance | Track SQL movement, pipeline created/influenced, cohort performance, cycle time | First indicators of whether the tool is improving efficiency |
| Week 4 | Optimize & score | Apply learnings (tests/adjustments), compute KPI changes, compare to baseline | Clear performance report + recommendation |
Exit Criteria: Is the Tool Worth the Money?
Judge the pilot only on business outcomes, not ‘vibes’ or effort.
| Metric | Success Looks Like? |
|---|---|
| SQL quality & volume | Lift in SQL rate (+10–20%) or more opportunities from the same lead volume |
| Pipeline & revenue efficiency | CAC payback reduced, more pipeline per dollar spent, higher win rate, improved deal velocity |
| Cycle time | Faster progression from lead → SQL → opportunity |
| Operational lift | Sales alerted faster, fewer routing errors, better attribution visibility |
| Negative/neutral outcome (“stop” signal) | No material lift in SQLs/opp creation, weak adoption, high service cost, data problems |
Go/ No-Go Decision Framework
| Scenario | Verdict | Next Steps |
|---|---|---|
| Pilot met or exceeded the KPI target | Go | Scale rollout and negotiate contract |
| Pilot did not hit the KPI target, but has a clear optimization path | Conditional Go | Extend the pilot 15–30 days with a specific goal in mind |
| Pilot failed. No strong hypothesis for improvement | Stop (No-Go) | Do not expand, do not renew. Sunk cost is NOT justification |
Please learn from my previous failures when I say: a failed pilot saves you more money than a long-term commitment to something that doesn’t move revenue.
Future-Proofing Your MarTech Stack
Your Martech stack will (hopefully) evolve with a constantly shifting tech horizon. When deciding on a tool, take these signals into account:
- AI-native agents are finally becoming practical. Tools that work dynamically are already worth US$5.4 billion in 2024, set to grow rapidly. The “AI marketing” market was estimated at US$47.3B in 2025, with forecasts pointing to > US$107B by 2028.
AI is not a fad. Its infra is getting better, and modern stacks should incorporate AI-driven workflows. - Privacy-first, data-first pipelines are here to stay. Orgs collect more data than ever before: first-party metadata, behavioral, and account-level. It is the org's responsibility to manage that data responsibly, securely, and compliantly.
- Warehouse-native marketing is rising. That means fewer silos and more data fluidity. Unified, data-driven marketing stacks (with analytics, attribution, CRM, customer feedback, and automation connected to the same warehouse or data layer) are increasingly the backbone of serious marketing departments.
- Immersive interfaces like VR / XR / new channels are flagged among global tech “megatrends.”
Build a stack that’s modular, privacy-conscious, and data-centered. Stay “upgrade-ready” for when immersive or alternative-channel marketing becomes viable.
Summary:
Most B2B marketing teams aren’t suffering from a lack of tools. They’re suffering from too many of them. Tech stacks with 25 to 60+ products are common, but pipeline is flat, attribution is sketchy, and nobody can explain half the invoices.
What is MarTech? It’s the software to create, automate, personalise, and measure marketing (email, journeys, analytics, attribution, AI, dashboards).
The landscape in 2026 is massive, AI-heavy, and consolidating fast. That’s why you can’t buy by category anymore.
Choose your tools based on use-case, data/PII, integrations, governance, identity, AI transparency, time to value, TCO, roadmap, peer proof, and practical shortlists across categories.
You can use plug-and-play implementation playbooks (14-day automation and intelligence setups), which show you how to measure success (SQL rate, pipeline, win rate, CAC payback, LTV: CAC), and offer a 30-day pilot framework so you stop buying tools based on vibes.
Future-proof your martech stacks with AI agents, warehouse-native marketing, and privacy-first data.
FAQs for MarTech Solutions
Q. What is “martech”?
Martech (short for marketing technology) includes all the software (offline and online) used to create, automate, personalize, and measure marketing experiences.
If it touches a marketing workflow, it’s martech.
Q. How is martech different from adtech?
AdTech covers tools for media buying and activation. Think paid ads, bidding, targeting, DSPs. MarTech includes tools for owned data, mapping user journeys, personalization, and measurement.
AdTech gets attention. MarTech turns attention into revenue.
Q. Which marketing automation SaaS should I shortlist in 2025–2026?
A quick shortlist for choosing martech in the US B2B domain:
- HubSpot
- Marketo
- Braze
- Salesforce Marketing Cloud
Q. What are “marketing intelligence tools”?
Marketing intelligence tools integrate and clean data, standardize naming, extract insights, and track competitive trends. These tools often come in two branches:
- Data intelligence: Funnel, Adverity, Fivetran
- Competitive/market intelligence: Klue, Crayon
Q. Do AI automation tools actually work?
Some do. Some are cosplaying at it. For instance, Adobe’s agents can autonomously implement on-site actions. But tools will just give you bots that say they’re “taking actions” but really just send a Slack notification.
To find the good AI tools, run tightly scoped pilots with clear KPIs.
Q. Has the martech market consolidated or expanded?
It’s actually done both.
- The market is bigger than ever (15,384 products in the 2025 ChiefMarTec landscape).
- But platforms are consolidating into suites, especially around automation, identity, and loyalty/CDP.
Q. What tools are marketers actually using in 2025?
A few real-world stacks would be:
- HubSpot or Klaviyo for automation
- GA4/Looker for analytics
- Ahrefs/Semrush for SEO
- Canva/Figma for creative
- Zapier/Make for workflow automation
Q. How do I avoid tool sprawl?
After every procurement call, ask yourself, “What is the job to be done — and what KPI will this improve?”
- Buy tools by job, not category.
- Demand native integrations + SSO.
- Run a 30–60 day proof-of-value pilot.
- Look at peer proof from G2 / Gartner Peer Insights.
Q. Where do I track martech trends?
These are reliable sources to track MarTech trends:
- ChiefMartec landscape.
- Industry reports (Grand View Research, MarketsandMarkets)
- MarTech.org coverage and research
- Gartner Hype Cycles
You can also learn from LinkedIn, Slack groups, and Reddit, because real people have no reason to lie about a product.

Measuring Marketing With Change Science (Part 1)
Discover how change science may be used to evaluate marketing success. Learn how to use statistical significance to make daily decisions as a marketer

We all have heard the saying: “Change is the only constant,” which translates to the fact that everything changes, every time. While that is too philosophical, and since marketers – more so data-driven B2B marketers – are not really fans of philosophy, there is a need to “measure” change. And not just that, a business needs to “attribute”, “rank”, “predict”, “explain”, and hopefully even “bring about" change using data analytics. Since statistics is the mother of all real-world measurements, and probability is the grandmother thereof, the science of measuring change too lies somewhere close by.
Since surface (i.e., not deeply thought-out) definitions are easy to make but difficult to follow with real-world data, the real challenges are solved by taking support from the well-researched areas of data science and probability. One extreme is to discuss the topic of change with its extreme roots, but that could easily fill-up a book (which is under way), but we stick to measuring change w.r.t. marketing analytics.
The questions
The main questions from a marketing perspective are: “What main factors changed from last week to this?”, and “By how much did these main factors change?”. But before that, let us understand something even more basic.
Why to measure?
Marketers take various targeting decisions on a daily basis – which audience to target, how frequently, and with what kind of marketing campaigns. They also have to keep track of various prospective customers, their journey, their overall statistics, and most importantly, reasons why a particular technique worked (or didn’t work) – be it a campaign or a strategy. And there are various goals when it comes to marketing. While some techniques could be motivated towards increasing reach (where it’s important to maximize the number of eyeballs a webpage could get), others increase conversions (at various points in a funnel – form-fills, email cold/warm calls, prospects, pre-sales, sales, etc.).
The foregoing marketing goals are achieved by measuring both static marketing performances (i.e., what happened today / this week), and also more dynamic, time-aware ones. While analyzing performance over time is a comprehensive view of marketing goals’ achievements / shortcomings and hence makes it cumbersome to digest multiple metrics of interest in a single frame, summaries of the same are preferred. And one of the summaries of a dynamic measurement of marketing performance comes in the form of change – that is, what changed, by how much, and why. In this article, we would focus on measuring overall changes, and would dig deeper into measuring the causes for the same in a follow-up blog.
What to measure?
Based on the business requirements, marketers focus on tracking and eventually improving relevant KPIs (key performance indicators). For the scope of this article, we would explain change analysis taking the example of one important metric marketers are concerned about – the number of leads they generate every week. They achieve this by driving relevant visitors to their website every week. Any change in the number of leads that they get as compared to what they expected calls for an investigation on the reasons for the difference between expected and actual metrics.
Since the first step into any such investigation is to measure and compare (with last week) some global performance indicators measuring the reasons for change, the same is the focus of the current article. Hence, keeping a webpage in mind, we take the example of measuring the number of visitors (those who reached the website), the number of leads (visitors who reached target), and the conversion rate therefrom (leads per visitor).
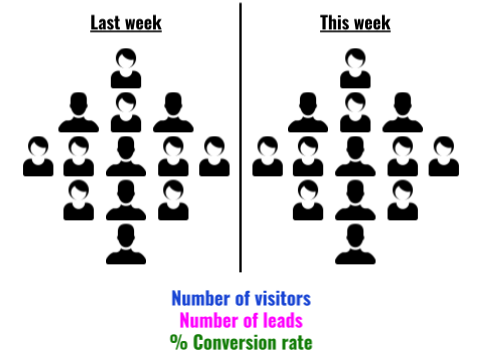
When we perform these measurements for two given periods of time (say consecutive weeks), we could compare them. Let V1, L1, and C1 represent the number of visitors, number of leads, and conversion rate of week 1 respectively, and let V2, L2, and C2 represent the same measurements from week 2.
{{INLINE_TOFU}}
How to measure?
The four simple change measurements one could perform are the following:
- Total change: This is the most basic measurement of interest that preserves both the “unit” and the “sign” of change. For example, if the number of website visitors who filled out a form changed from 50 last week to 75 this week, we get an absolute change value as +25 form-fillers. In short, it answers the question: “How much more/less?”.
More formally though, one could measure absolute change in visitors (𝚫V = V2-V1), leads (𝚫L = L2-L1), and conversion rates (𝚫C = C2-C1). - Relative change: While absolute change remembers the unit of the entity one is measuring, it is – more often than not – more convenient to adopt a normalized change score. Taking the same example as before, change in the number of form fillers from 50 to 75 means a change value of +25, but the same is true if form-fillers had increased from 150 to 175 (viz., +25). What separates the two cases is relative change (i.e., how much did the unit change per unit original), which is +0.5 (=25/50) for the former (50→75), and +0.17 (=25/150) for the latter (150→175). The specialty of this score is that it remains a fraction between -1 and +1, and helps in comparing two “changes”. In a day-to-day language, a “percentage” variant of this metric is used by marketers.
Again, a formal representation of relative change in visitors (𝚫rV = 𝚫V / V1), leads (𝚫rL = 𝚫L / L1), and conversion rates (𝚫rC = 𝚫C / C1) would also help engrave the idea. - Percentage change: As described earlier, it’s easier to understand when one says “the number of visitors saw a 50% increase” (as opposed to saying the relative change of visitors was +0.5). Therefore, as a human-friendly change metric, the percentage variant is more popular than its math-friendly counterpart (relative change).
A notable caveat is as follows. “From X to zero” would mean a “100% decrease” (and vice-versa), but “from zero to X” turns out to be an “infinite% increase”, which is absurd. One workaround to rectify this is to call “from zero to X” as “from min to X”, where min could be set based on the metric of interest (e.g., min could be just 1). Another workaround is to call “from zero to X” as a “100% increase”. Another interesting point is that “no change”, it’s called a “0% change” – even if it is “from zero to zero”.
From the perspective of our current example, percentage change in visitors (𝚫pV = 100 x 𝚫rV), leads (𝚫pL = 100 x 𝚫rL), and conversion rates (𝚫pC = 100 x 𝚫rC) could be computed by simply multiplying the relative change by 100. - Factor change: Some marketers (and sometimes marketers) like to express change in percentage differences, and sometimes in factor increments/decrements (and some do both), and this is purely a personal/company-wide choice. Picking the same example from above, whether it is convenient to say “the visitors increased by 50%” or “this week’s visitors are 1.5x last week’s” differs from use-case to use-case, but is only a different way of expressing relative change.
Although one has to be cautious, however.
- “1x” means no change (a “0% change”). For example 100→100, 1→1, 0→0, etc.
- “0x” means a “100% decrease”, from, say 100 to 0, 5 to 0, but not from 0 to 0 (since we choose to call it a “1x” change.
- “2x” means a “100% increase”.
- “1.5x” means a “50% increase”.
- In general, “kx” means a “100*(k-1)% increase/decrease”, where it’s an increase when k > 1 and a decrease when k < 1.
- When saying “kx”, k never goes negative.
Going by the earlier example of website visitors, we could be interested in the factor change in number of visitors, (𝚫fV = V2 / V1), leads (𝚫fL = L2 / L1), and conversion rates (𝚫fC = C2 / C1).
Measuring overall change
Depending upon the business and the audience, there are multiple combinations of possibilities. We only cover some of them, summarizing overall (global) change. And as mentioned earlier, our next article on this topic would dive deeper into digging up the “reasons that drive this overall change.”
No change
Let us start with a simple world, and slowly drift towards complex scenarios. Suppose our website had 1,000 unique visitors last week, and 1,000 new unique visitors this week (i.e., there was no change in the number of visitors). Of the 1,000 users last week, 20 signed-up for our newsletter, and the same trend continued this week as well. In other words, both last week’s and this week’s conversion rate was 2% (20*100/1,000). What does this tell us about this week’s performance over last? That it remained the same! In other words, there was a 0% increase/decrease in both reach and lead conversion rate.
Proportionate increase in visitors & leads
Now, if we had more visitors (say 1,500) this week as compared to the last, with a proportionate increase in leads so as to maintain the 2% conversion rate, it would amount to a 50% increase in visitors and leads, but a 0% change in conversion rate.
Increased leads, retained visitor count
On the other hand, if the total number of visitors had remained the same, and leads would have increased by 50%, this would increase the conversion rate by 50%.
Increased visitors, no change in leads
If, however, the number of leads would have remained the same despite an increase in visitors (by, say, 50%), we would see a 33% fall in conversion rate.
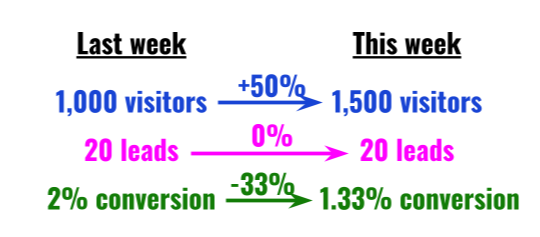
Disproportionate increase in visitors & leads
It is also possible that the number of leads increased by a disproportionate amount, which led to an increase in conversion rate.
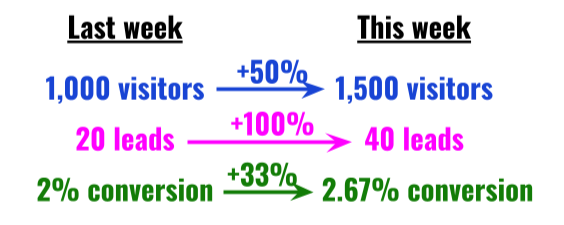
Measuring change factors
We just discussed how measuring overall change is straightforward: simply report the signed/relative/percentage difference or factor change in visits, leads, and conversion ratio between the two weeks. But this is only half battle won. What is ideal is to measure the “causes” for the change. For example, we know that a 2x increase in visitors (V2 = 2V1) and 1.5x increase in leads (L2 = 1.5L1) – and hence a 25% drop in conversion rate (C2 = L2/V2 = 0.75L1/V1 = 0.75C1) – happened. But why it happened is one of the most important questions change science has to answer.
What causes change?
A seasoned marketer can quickly understand the main factors that led to a drop or a rise in scale (#visitors) or conversion (leads/visitor). But where data analysis comes in is in short-listing such factors from the rest, and hence help the marketer with her weekly (or periodic) decisions. In this article we only give an intuitive idea of what causes change (and how we measure it). In part 2 of this series on Change Science, we discuss the exact procedures and methods to measure factors that cause change periodically.
The more we know about our customers, the more our analysis benefits. While measuring change, as it was mentioned above, we usually track the number of visitors (V), the number of leads (L), and the respective conversion ratio (C). Along with mere counts, one ought to measure the profiles of such visitors and leads – in both weeks. For example, with a 2x and 1.5x raises in visitors and leads, to know what caused it, one has to track how the properties of visitors and leads have changed. The properties we are referring to are usual user/event based properties – from simple demographic ones such as Location (country, city, etc.), User Agent (browser, OS, etc.), etc. to marketing-oriented ones such as Referrer (domain, campaign, etc.) – along with their values (a “property=value” combination looks like “country=India”, for example). In summary, in addition to tracking overall statistics (visitor and lead counts), we also track counts “grouped-by” their properties.
Needless to mention, such properties are too many to count, and property=value combinations are even more. This is where Factors.AI comes in. We track-down each factor, measure the change attributed to the factor, and surface top insights. And we repeat the process for any event pair combination (in say, a funnel), for every property, and for every consecutive period of interest. We urge you to follow-up with us in the next article that describes how exactly we surface the main change factors via our very own Weekly Insights feature.
Stay tuned.


We don’t just write about demand gen. We deliver it.
Our AI Agents help you uncover high-intent accounts, run campaigns that actually convert, and keep your GTM motion in sync.
1000+ GTM teams have already scaled their pipeline with Factors.
*Includes built-in peace of mind. And fewer late-night funnel audits.

.svg)


.png)