
.webp)
Revenue Forecasting Models | 101 Guide To Revenue Forecasts
Revenue forecasting is critical for any business, especially when it comes to B2B SaaS. The immense speed of progress in this industry requires keeping up with trends, continuously experimenting with fresh channels, and adjusting budget allocation based on future predicted revenue.
Accurate revenue forecasts help organizations make data-driven growth decisions.
This comprehensive guide will cover everything you need to know about revenue forecasting models.
What is Revenue Forecasting?
Revenue forecasting is the process of predicting future revenue for a company using historical performance data, predictive modeling, and qualitative insights. Revenue forecasts provide an estimated projection of the total revenues expected in a future period.
Forecast time horizons can range from next month to next quarter to five years from now. Short-term forecasts may focus on immediate sales pipeline conversion, while long-range forecasts take a broader market-based approach.
With revenue forecasting, the goal is to provide the most accurate prediction of future revenue based on current insights. These reports can also be improved by leveraging attribution data so you know exactly what functions of marketing or sales bring in real revenue.
Revenue forecasting helps answer questions like:
- How much revenue can we expect to generate in the next quarter/year?
- How will seasonality trends and new product launches impact revenue?
- How quickly are we expected to grow over the next 5 years?
When done right, revenue forecasting can power key business functions:
- Financial planning: Building P&L statements, budgets, valuation
- Sales planning: Setting quotas, territory mapping, compensation
- Marketing planning: Demand generation budgeting, growth modeling
- HR planning: Hiring goals, resource allocation across teams
- Manufacturing planning: Inventory needs, capacity expansion
- Executive planning: Strategy setting, investment decisions
While revenue forecasting attempts to predict future revenues, it differs from a revenue projection which is typically more aspirational. Let’s understand the differences.
Revenue Forecasting vs. Revenue Projections vs. Sales Forecasts
These three terms are used quite often when it comes to budgeting and strategic planning but they mean different things.
- Revenue Forecasts model the actual monetary revenue expected based on sales forecasts, historic performance, market conditions and statistical modeling. It provides the most likely, evidence-based scenario.
- Revenue Projections are what leadership desires to happen—an optimistic target rather than a data-driven expectation. Projections represent an aspirational revenue goal.
- Sales Forecasts predict expected sales bookings and pipelines based on leading indicators like open opportunities. They are an input into revenue forecasts.
Now, let’s understand the types of revenue forecasts that you may come across.
Key Types of Revenue Forecasts
There are also different types of revenue forecasts based on methodology and time span:
- Short-term vs. Long-term - Short-term forecasts focus on immediate pipeline conversion, while long-term forecasts take a broader market-based view.
- Top-down vs. Bottom-up - Top-down forecasting starts with macro assumptions and allocates them across business units. Bottom-up rolls-up forecasts built from ground realities.
- Operational vs. Financial - Operational forecasts model near-term revenue streams. Financial forecasts take a holistic P&L view including costs and expenses.
- Deterministic vs. Probabilistic - Deterministic forecasts provide a single expected outcome. Probabilistic forecasts model a range of outcomes and probabilities.
Now, let's examine some key business uses and benefits of revenue forecasting.
Why is revenue forecasting important?
Accurate revenue forecasts can be the difference between success and failure for a business. Here are a few ways forecasting powers planning across the organization:
1. Budgeting with Realistic Precision
For finance teams, the single biggest use of forecasts is to build organization-wide budgets.
Budgets dictate how much gets spent on everything from R&D investments to marketing programs and payroll. Without reliable revenue forecasts, budgets devolve into guesswork.
For example, assume a company's revenue was $5M last year. Now the CFO needs to build next year's budget.
With intelligent forecasts, finance can model that based on new product launches, a 10% industry growth rate, and sales team expansions, revenues are likely to reach around $7.5M next year.
The CFO can now budget for expenses accordingly - say $1M for new engineering hires, $500K for more marketing, $150K for sales operations software etc.
Without forecasts, the CFO is flying blind. Maybe she pads the budget with a 20% increase to $6M. But if actual revenues only end up at $5.5M, suddenly there's a multi-hundred thousand dollar budget shortfall, requiring drastic cuts.
Conversely, if revenues actually reach $8M but budgets are based on last year's numbers, the company is now missing key growth opportunities due to under-investment.
2. Optimize Operations Management
Beyond budgets, forecasts guide operational decisions across departments:
- Sales: Forecasts feed territory assignments, quota setting, compensation planning, and capacity modeling whereas under-forecasting leaves money on the table.
- Marketing: Forecasts dictate digital and outbound campaign budgets and funnel targets where bad forecasts can waste spending and lead to missed opportunities.
- Product: Prioritizing the roadmap requires expected revenues from new features so bad forecasts can result in misplaced priorities.
- HR: Hiring and workforce planning requires expected growth rates and flimsy forecasts risk talent shortages or bloat.
Across the board, teams depend on forecasts to optimize operational management for future success amid constraints.
3. Fuel Strategic Decisions
Forecasts also provide the quantified confidence executives need to drive growth through major strategic moves:
- Funding rounds: Forecasts build credibility on growth potential to establish valuations. Weak forecasts undermine bids for capital.
- M&A valuation: Pre-transaction due diligence depends on target revenue forecasts. Bad forecasts lead to overpayment or lost deals.
- Market expansion: Breaking into new regions or verticals requires quantifying addressable revenues and investment payback.
- New product prioritization: High-impact opportunities are identified by revenue potential under constrained resources.
- Executive recruitment: Attracting star senior talent requires painting a compelling growth.
Creating reliable revenue forecasts empowers executives to place decisive strategic bets amid uncertainties, as opposed to shooting blind.
4. Track Performance to Plan
Revenue forecasts also provide a scorecard against which actual results can be monitored. Comparing real revenue performance vs. forecasted expectations then allows deviations to be easily flagged. With this information at hand, teams can course-correct before small misses snowball into major disasters.
Without forecasts as the reference point, there is no way to reliably track progress against potential. Revenue actuals in a vacuum don't reveal whether performance is on-target or off-course.
What are the types of revenue forecast models?
Now that we understand the fundamentals of revenue forecasting, let's examine some of the most common revenue forecasting models and techniques.
Broadly, forecasting approaches can be divided into two families:
- Quantitative models take a data-driven statistical approach to identifying trends and patterns in historical data that can be used for future predictions.
- Qualitative models incorporate expert perspectives, market analyses and contextual business insights to predict future revenues.
There are four common forecasting models namely linear regression, time series, bottom-up, and top-down. The best way to perform revenue forecasting is by combining multiple models to benefit from each of them.
Let's explore some of these popular models.
1. Linear Regression Models

Linear regression analyzes historical data to model how changes in key variables impact revenue.
Regression provides a data-backed view into drivers of revenue growth and contraction.
However, regression models are only as good as the input data. They may miss complex real-world dynamics that are not reflected in historical data. Approaching them as helpful guiding tools rather than absolute truth is important.
Key Benefits
- Quantifies the relationship between revenue drivers and outcomes
- Calculates the impact of each variable on revenues
- Models complex interactions between multiple variables
- Provides data-driven revenue projections
How It Works
Simple linear regression uses one variable, often time, to predict revenue.
For example, it can help a business quantify how much additional revenue every $1 increase in marketing spend has historically generated. This insight can be used to forecast revenue under different scenarios.
Multiple linear regression incorporates additional factors simultaneously like marketing spend, sales activities, market dynamics etc.
The model examines historical data to calculate coefficients measuring each variable's unique relationship with revenue. These insights feed the predictive model to forecast expected revenue under different scenarios.
Considerations
- Regression modeling requires large volumes of accurate historical data
- Predictive power diminishes beyond modeled relationships
- Difficult to model nonlinear variable interactions
Regression provides a data-backed view into drivers of revenue growth and contraction. It brings statistical rigor to projecting the top and bottom-line impact of decisions around pricing, hiring, product launches, geographical expansion and more.
However, these models are only as good as the input data. They may miss complex real-world dynamics that are not reflected in historical data. Approaching them as helpful guiding tools rather than absolute truth is important.
2. Time Series Forecasting

Time series analysis detects historical patterns in data over time. This helps tease out seasonal and cyclical trends from broader growth trajectories and random noise.
It decomposes revenue time series into:
- Trend - Overall upward/downward trajectory
- Seasonality - Cyclical patterns
- Noise - Random unexplained variations
Time series models maximize signals and minimize noise in historical data for sophisticated revenue projections tailored to the business. These models can incorporate recent data, balancing responsiveness to change with smoothing noise and help you extract actionable insights for reporting and forecasting.
Key Benefits
- Models trends and seasonality specific to the business
- Highlights time-based nuances impacting revenue
- Provides granular, frequently updating forecasts
How It Works
Time series techniques like moving averages, exponential smoothing, and ARIMA modeling analyze a revenue time series to optimize the predictive modeling of its components.
For example, enterprise software revenues may spike every fourth quarter due to a year-end budget flush. Media subscriptions may dip in the summer months when travel is high. Understanding these nuances helps make more contextual and accurate forecasts.
You can then use the insights generated from the time series forecasts to smoothen the growth curve giving you more predictable revenue.
Considerations
Time series models need sufficient history to detect reliable patterns. They may miss entirely new market dynamics or one-off events, unlike the past. Hence, combining them with human judgment is important.
3. Bottom-Up Forecasting

Bottom-up forecasting taps insights from sales, account management and other frontline teams to build projections. They incorporate pipeline health, competitive threats, and market mood along with historical data.
How It Works
Let’s take an example organization with sales, marketing, finance, and leadership teams. Here’s how bottom-up forecasting would work:
- The sales team starts by analyzing the health of its current pipeline and expected deal cycles to forecast expected conversion rates by product line and region.
- Meanwhile, marketing examines recent campaign performance and lead generation trends to estimate new MQLs by campaign channel. They apply conversion rates to project new SQLs.
- Finance consolidates these detailed bottom-up forecasts from each department. They identify and resolve any inconsistent methodologies or assumptions between teams.
- Leadership reviews the consolidated forecast and makes final top-down adjustments to determine the official revenue projection.
Key Benefits
- Incorporates insights from sales, account management, and other frontline teams
- Reflects pipeline health, competitive dynamics, and micro-market nuances
- Promotes buy-in through the inclusion of cross-functional inputs
Considerations
Inconsistent assumptions between teams can skew the overall forecast. Guidance from leadership on industry outlook, macroeconomic factors and growth objectives helps align assumptions and methodologies.
4. Top-Down Forecasting

Top-down forecasting starts with the big-picture view of the total addressable market, growth trajectories, economic conditions and business strategy. Leadership sets goals and divides revenue targets across functions.
This ensures strategic alignment between long-term goals and short-term operations. However, seemingly arbitrary targets could demotivate teams without context on the rationale so with top-down forecasting, you need to ensure two-way communication and transparency from leadership.
How It Works
Let’s look at top-down revenue forecasting through an example.
- The executive/leadership team starts with the overall revenue growth target based on market outlook and strategic goals. They divide this target across sales, marketing and customer success based on revenue impact capacity.
- Each team gets their individual revenue target along with guidance on growth assumptions like pricing, conversions, expansions etc.
- Teams build goal-aligned execution plans around sales territories, campaigns, and account targeting to meet their top-down number.
- Leadership reviews department plans to ensure coordination and consistent assumptions are in place.
Considerations
- Teams lack insights into the rationale behind seemingly arbitrary targets
- Overlooks micro-market nuances and competitive dynamics
- Requires reconciliation of opposing projections
Blending both top-down and bottom-up approaches for revenue forecasting can help set realistic targets based on market conditions while aligning activities to growth objectives.
What is the Best Method for Revenue Forecasting?
The best forecasting method depends on your use case. Let’s understand this with two examples.
A SaaS company with recurring subscription revenue may find time series analysis to be very effective. That’s because, studying historical revenue patterns over time, seasonal cycles and trends become apparent. Statistical time series models can help quantify these patterns to accurately predict recurring revenues.
On the other hand, for a retail chain opening new store locations, a bottom-up approach could prove more useful. Each new store manager could prepare detailed forecasts for their location based on demographics, nearby competitors, marketing plans etc. Aggregating these bottom-up projections provides a realistic the overall revenue forecast.
The point is, every business is situated differently. The ideal approach depends on:
- Data availability - length of revenue history, presence of relevant drivers/variables
- Revenue characteristics - recurring/seasonal patterns, level of variability
- Business structure - centralized/decentralized, product diversity
- Strategic context - expanding to new markets/geographies, introducing major new offerings
Leaders need to understand revenue drivers in their industry and business and use the insights to tailor the forecasting methodology to their specific situation and objectives.
Combining methods can also be beneficial. For example, a short-term quarterly forecast may use time series analysis to leverage recent revenue trends. And for the annual budget, a bottom-up approach could then add local market perspectives for a comprehensive view.
The key is adapting forecasting approaches to match business realities which provides the accuracy and insights required for confident decision-making across the organization.
Revenue Forecasting Models: Best Practices
What are some of the best practices for ensuring accurate revenue forecasting when using these revenue forecasting models? Let’s look at 4 of the best practices that you should consider following.
1. Start with high-quality data
Remember this—garbage in, garbage out. Even the most advanced model cannot compensate for poor-quality data. Invest in processes and systems to collect accurate, complete revenue data, with proper change logs and auditing.
2. Eliminate outdated information
Stale data loses relevance quickly. Establish mechanisms to continually gather the latest data on revenue drivers. This could involve surveys, sales team feedback, customer interviews etc.
3. Reduce the length of planning cycles
Annual plans using old assumptions miss market shifts. Re-forecast more frequently using the latest data to stay agile. Quarterly or even monthly cycles are preferable.
4. Avoid a futile bid for perfection
Obsessing over tiny accuracy improvements is counterproductive beyond a point. Focus on balancing usefulness and cost when selecting model sophistication.
How Factors Can Help Your Business Drive Revenue
Let's face it—optimizing your GTM strategy is tedious, and time-consuming without having all the right data in one place.
You have your metrics in different silos across marketing, sales, and revenue and piecing together a complete picture feels impossible. You could have leaks in your funnel, but cannot find the exact pages. Attribution has become a shot in the dark. And you're pouring money into campaigns without knowing if they’re working or not.
This is where Factors comes in.
Factors integrates all your disparate data sources—CRM, MAP, web analytics, social media, ad platforms—into one unified view.
You can quickly pull custom reports to get insights and answers on the fly. Factors also leverages leading IP resolution technology to reveal anonymous website traffic. Helping you discover up to 64% of untapped traffic and turn them into known, sales-ready accounts. More accounts to market means more pipeline and revenue.
With unified data and a complete view of your funnel, you gain the power to make strategic decisions that move the revenue needle. Scale what works, fix leaks, attribute MQLs to campaigns, analyze account journeys—Factors has you covered.
Don’t shoot in the dark. Book a demo with Factors to see how we can help you get better insights and data to power your forecasting models and make data-driven decisions to boost pipeline and growth
Optimize Revenue Forecasting for Smarter Business Decisions
Accurate revenue forecasting models help businesses predict future income and make informed financial, sales, marketing, and operational decisions.
Key forecasting models include:
1. Linear Regression & Time Series Analysis: Use historical data to identify trends and predict future revenue.
2. Bottom-Up Forecasting: Builds projections from frontline sales insights, offering a granular view of potential income.
3. Top-Down Forecasting: Starts with macro-level market insights and allocates revenue targets across departments.
Choosing the right model depends on business type, data availability, and forecast horizon. By leveraging predictive analytics and market insights, businesses can refine strategies, improve budgeting, and drive sustainable growth.
FAQs
1. What is revenue forecasting and why is it important?
Revenue forecasting is the process of predicting future revenue for a company using historical data, predictive modeling, and insights. Accurate forecasts empower data-driven planning and growth decisions across functions like finance, sales, marketing and operations. Reliable revenue forecasts are mission-critical for budgeting, managing operations, fueling strategic growth moves and tracking performance.
2. What are the top revenue forecasting models?
Popular models include linear regression to model revenue drivers, time series analysis leveraging historical patterns, bottom-up forecasting aggregating projections from frontline teams, and top-down forecasting starting with leadership’s total target. Combining approaches provides flexibility to tailor models to business needs and data availability.
3. How often should you update revenue forecasts?
Outdated assumptions lose relevance quickly, so forecasts should be refreshed frequently. Quarterly or monthly re-forecasting cycles are preferable to stay agile versus annual plans. Access to latest revenue driver data enables more responsive modeling.
4. What are some common pitfalls of revenue forecasting?
Potential pitfalls include unpredictable market shocks, limitations of available data, human errors in model assumptions, and finite resources to build sophisticated models. Perfection is unrealistic but maximizing useful accuracy is key.
5. What data is needed for accurate revenue forecasts?
Quality historical revenue data is the foundation. Relevant drivers like market trends, sales activities, product changes, and economic indicators help explain revenues. Updated inputs prevent stale assumptions. Data challenges need pragmatic solutions.
6. How can technology enable better revenue forecasts?
Tools like CRM, account intelligence and analytics tools like Factors, etc. provide key sales and marketing data inputs. Purpose-built FP&A software centralizes data for modeling and reporting. Technologies like AI and machine learning can boost forecasting sophistication.
7. What best practices improve revenue forecasting?
Best practices include maintaining high-quality data, eliminating outdated information, shortening planning cycles, combining modeling approaches, and focusing models on business needs. Avoid needless complexity but leverage enough sophistication to meet objectives.
.avif)
Customer Acquisition Funnel - The Complete Guide For 2025
The average website conversion rate across B2B is just about 2%. This means businesses miss out on most (~98%) brand-aware accounts already visiting their website. A deep understanding of your customer journeys and the ability to identify hidden opportunities becomes essential to make the most of this potential pipeline.
This is where a customer acquisition funnel comes in.
The customer acquisition funnel helps track how prospective customers flow through defined stages of the buyer journey to become loyal buyers. The funnel starts broad, capturing initial awareness and interest before narrowing down to hot leads, evaluating solutions, and finally making the purchase.
This guide covers everything you need to know about building, analyzing, and optimizing the customer acquisition funnels, including:
- Mapping the stages of the modern customer journey
- Tracking key funnel performance metrics
- Diagnosing and addressing bottlenecks stunting conversion
- Leveraging tools to unlock data-driven funnel insights
- Applying proven best practices to optimize acquisition
By the end, you’ll understand how a well-oiled customer acquisition funnel can drive sustainable business growth with minimal effort. Let's dive in!
TL;DR
- The customer acquisition funnel includes five core stages: Awareness, Interest, Consideration, Decision, and Customer, each requiring tailored marketing strategies.
- Mapping your funnel helps identify roadblocks, improve conversion rates, allocate resources more effectively, and support accurate growth projections.
- Using tools like Factors helps track and analyze customer interactions, making it easier to optimize strategies and improve customer acquisition over time.
- A well-built funnel requires ongoing testing and optimization, ensuring that marketing efforts are always aligned with customer needs and market changes.
What is a customer acquisition funnel?
The customer acquisition funnel is a structured path a potential customer follows from initial awareness of a product to ultimately becoming a paying customer. It consists of clearly defined stages that segment the customer journey into measurable phases.
Here is a simple example depicting the critical stages in a typical customer acquisition funnel:

As you can see:
- The funnel is broad at the initial awareness stage, where many prospects learn about your offerings.
- It narrows as prospects display increased levels of engagement. This represents fewer prospects remaining actively engaged as the funnel progresses toward a purchase decision.
- At the end of the funnel, the smallest number of highly qualified prospects convert into paying customers.
The overarching goal of mapping the customer acquisition funnel is to establish a data-driven view of how prospective customers move through defined stages on their path to conversion.
It provides actionable insights to optimize marketing and sales processes across the entire customer lifecycle—maximize conversion rates, decrease acquisition costs, and improve retention over time.
Actively optimizing a customer acquisition funnel offers significant benefits, including:
- Identifying roadblocks within the customer journey to conversion.
- Determining the effectiveness of current acquisition strategies.
- Enabling more efficient allocation of marketing and sales resources.
- Supporting more accurate forecasting of future conversions and revenue.
- Fostering customer-centric thinking across the organization.
All of which helps you fix funnel leaks and continually improve your conversion ratio. With that clear, let's explore why the customer acquisition funnel is a high-return investment for any growth-oriented business.
Why is the customer acquisition funnel Important?
There are several compelling reasons why taking the time to thoughtfully map out and optimize your customer acquisition funnel is worthwhile:

1. It Aligns Teams and Strategies to Common Business Goals
The mapped customer journey gives every department—marketing, sales, product, customer service, etc.—a shared understanding of customers' complete experience. And a unified perspective enables better coordination of strategies across teams to optimize the journey.
For example, marketing can pass warm leads to sales quickly. Product can identify and fix usability issues that could lead to drop-offs, and the service can follow up with customers post-purchase to improve retention.
Without this alignment, teams can end up working in silos and creating a fragmented, inconsistent customer experience.
2. It Highlights Optimization Opportunities
Along with aligning teams, acquisition funnels help analyze conversion rates and drop-off points at each customer journey stage.
It also highlights areas where customers are struggling or abandoning the process. These issues represent tangible opportunities to optimize specific steps in the journey to make it easier and more seamless for customers.
For instance, a drop in conversions from free trial signup to paid signup may indicate friction in the onboarding flow or payments. If you have a system that identifies the issues, you can address them by reducing the steps for onboarding or changing your payment gateways.
3. It Informs More Impactful Resource Allocation
The mapped customer journey visually shows which parts of the process work well vs. underperforming. The data can make prioritizing budgets, staffing, technology solutions, and other resources easier. More funds can be allocated to the journey's branches needing improvement. Meanwhile, resources focused on high-performing portions may be redirected or minimized.
4. It Allows More Accurate Growth Projections
With historical data on customer volume and conversion rates mapped to each phase, you can better predict future acquisition and growth trends. Forecasting models can extrapolate forecasted customer volumes and associated revenue expansion over time.
This provides vital input for broader financial planning activities like budgeting, growth strategy, hiring plans, etc. Accurate projections set realistic goals versus arbitrary targets.
5. It Creates a Customer-First Mindset
Walking step-by-step through the customer experience encourages team members to view things from the customer's perspective. This naturally promotes greater empathy for and understanding of customer needs across the organization.
For example, seeing a high drop-off during an onboarding flow could prompt an engineer to simplify the process for faster time to value. This customer-centric mindset powered by the journey map establishes a critical foundation for customer-obsessed cultures.
Now that we've covered why mapping the customer journey is so valuable let's understand the critical stages of a typical acquisition funnel.
The Stages of the Customer Acquisition Funnel

The customer acquisition funnel is generally broken down into five core stages:
1. Awareness
This first stage is when potential customers become aware that a company and its products exist.
For example, someone may see an ad for a SaaS company offering project management software. The goal here is to build broad awareness and "get on the radar" of prospects.
Typical marketing activities within the awareness stage include:
- Digital advertising campaigns - search, display, social media, etc.
- Traditional advertising - television, radio, print, out-of-home
- Public relations and earned media outreach
- Content marketing - blogs, videos, guides, case studies
- Search engine optimization and website enhancements
2. Interest
At this stage, aware prospects start developing a genuine interest in the company. For example, someone who saw the project management software ad may now go to the website and download an ebook on productivity tips for managers. Marketing now provides targeted information and materials to nurture leads, convey relevance, and prompt engagement.
Common tactics used in the interest stage include:
- Promotional content - ebooks, whitepapers, email nurturing campaigns
- Targeted search and display advertisements
- Social media engagement - likes, shares, follows, clicks
- Customer testimonials and reviews
3. Consideration
In the consideration stage, interested prospects actively evaluate whether the solution fits their needs. For example, the lead may sign up for a free software trial to test it out. Marketing in this stage focuses on differentiation and incentives to drive trials and consultations.
Typical consideration stage activities include:
- Free trials of your product
- Live product demonstrations and consultations
- Multi-touch email campaigns
- Retargeting advertisements
- Sales representative calls and meetings
4. Decision
Here, prospects have narrowed options and are nearing a purchase decision. For example, the lead may be at a stage where they’re now comparing the project management tool against 1-2 competitors.
Marketing provides final convincing arguments to close the sale.
Some of the common tactics used in the decision stage involve:
- Special promotional pricing or discounts
- Highly targeted and personalized advertisements
- Aggressive sales follow-ups and closes
- Frictionless point-of-sale or checkout experiences
5. Customer
This is the final stage, where prospects complete a purchase to become customers. Marketing aims to drive loyalty, retention, referrals, and repeat sales. For example, the new customer is onboarded to the software and offered additional training and resources to improve the experience with your product.
Post-purchase activities include:
- New customer onboarding and implementation
- Satisfaction surveys and user feedback collection
- Loyalty or VIP programs
- Customer retention and win-back campaigns
- Referral programs
- Remarketing and cross-selling campaigns
Note this is only a framework to get you started. As companies implementing acquisition funnels mature, they develop custom funnels that work best for them. So, feel free to modify the stages as you see fit.
How to Build Your Customer Acquisition Funnel
With the understanding of what a good customer acquisition funnel can do and the stages involved, how can you implement one for your business? Here are a few simple steps you can follow:
Step 1: Conduct Customer Research to Map Buying Journeys
Start by truly understanding your target customers through qualitative and quantitative research. Learn what motivates them, their pain points, and the detailed buying process.
Analyze any existing sales and marketing funnels—conduct focus groups, surveys, interviews, and advisory boards to uncover the fundamental stages prospects go through to become buyers.
For example, after going through multiple transcripts, an enterprise software company may determine these high-level funnel stages:
- Awareness - Learn about the product from YouTube or communities
- Interest - Book a demo or register for a trial
- Consideration - Book demos and trials with other vendors for a detailed comparison
- Decision - Select finalist and negotiate contracts
- Customer - Onboard and train employees
This process is primarily manual. However, running your meeting transcripts through ChatGPT can help you gain insights quickly without reading transcripts or rewatching the meetings.
Step 2: Catalog Omnichannel Touchpoints and Interactions
Next, catalog every existing and potential marketing, sales, support, and product touchpoint you have with prospects. Do this across all marketing channels, from the first touchpoint to the sale.
Spend time brainstorming different ways your existing buyers interacted with your brand. For instance, an enterprise CRM company may identify these example touchpoints:
- Awareness - Tradeshow booth, 3rd party reviews
- Interest - Targeted social media ads, analyst content offers
- Consideration - Free trial signup, sales consultation
- Decision - Contract negotiations, training previews
- Customer - Onboarding calls, support portal, feedback surveys
List all possible touchpoints, including community mentions, YouTube videos, newsletters, and other channels, even if you don’t actively pursue them.
Step 3: Implement Analytics Tracking
Put in place tracking across your website, ads, email, and other digital channels. The list of touchpoints from Step 2 will guide where to add analytics tracking.
You also want a unified tracking platform that combines data for a holistic view. While most analytics are channel-specific, a platform like Factors compiles cross-channel data.
This gives a complete picture of how customers interact from initial contact to sale. You can see touch points across devices, channels, and time to understand the full path to conversion.
Step 4: Set Clear Conversion Rate and Revenue Benchmarks
With unified tracking implemented, closely analyze the performance of each marketing channel and touchpoint. Assess critical metrics like:
- Cost per lead for ads and campaigns
- Lead to customer conversion rates by channel
- Average sales cycle length after first contact
- Average deal size by lead source

This analysis identifies your highest and lowest-performing acquisition sources. See which parts of your funnel have the most friction or gaps.
For example, you may find newsletter leads convert at 2X the rate of cold calls. Or that leads coming from an event have larger deal sizes than web leads. This insight shows where optimization can make the most significant impact.
Step 5: Continuously Test and Optimize
While you can theoretically call an acquisition funnel “complete,” it never really is. You need to optimize it through A/B and multivariate testing continuously. This allows you to experiment with multiple versions to find the messaging systematically, offers, and flows that maximize conversion rates and prospect velocity.
For example, if your cold email outreach has a high volume but needs to improve on conversions, start testing.

Similarly, create a priority list for other channels based on opportunity areas revealed in the channel analysis.
You can run these tests to optimize content, calls-to-action, page layouts, forms, and more at each funnel stage. The goal is to move prospects seamlessly toward conversion.
Step 6: Keep Testing New Marketing Channels
You’ll often hear, “Stick to what works.” The advice is spot on. You must commit to your proven marketing strategies long enough to see accurate results. But clinging onto a dying marketing channel is a disaster waiting to happen.

For instance, when TikTok emerged, short videos became “the thing” that made many brands like NoGood exceptionally popular for their niche. But if you choose not to experiment with new channels when they’re still nascent, you will miss the benefits of being an early adopter. Stay ahead of the curve through ongoing assessments.
How Factors Helps Track & Improve the Customer Acquisition Funnel
For most businesses, tracking your acquisition funnel takes a lot of work. Customer data lives across many systems—your website, ads, email, CRM, etc.
And connecting all this data to analyze the customer journey manually is tedious and error-prone. It takes a lot of work to get a complete picture.
This is where Factors comes in.

Factors automatically brings together customer data from all your systems in one place. This provides a unified view of each customer's entire journey in your acquisition funnel.
With Factors, you quickly see how customers flow through your funnel by visualizing engagement across your ads, website, email campaigns, sales reps interactions, and more.

For example, you can see that a prospect first clicked on a Google ad, visited specific landing pages on your site, downloaded an ebook from your blog, was contacted by a sales rep, and ultimately converted by purchasing your product.
Factors stitches these events together into an interactive visual timeline for each customer account. You can instantly analyze the key steps and paths that drive conversions.

You can also break down funnel performance by critical segments like geography, product line, or customer type. If your funnel is working better for small businesses versus enterprises, Factors makes this clear.
Beyond just reporting, Factors provides powerful analytics to optimize your funnel:
- Identify which marketing channels drive awareness and interest most effectively.
- See where prospects fall out of your funnel and diagnose why.
- Calculate conversion rates and sales velocity at each funnel stage.
- Uncover friction points in the customer journey on your website.
- Determine which sales reps convert leads most efficiently.
- Predict which prospects will likely convert next using machine learning.
With Factors, you get the complete picture of your acquisition funnel in one place. This enables you to continuously optimize marketing, product, sales, and other processes to acquire more valuable customers cost-effectively.
Customer Acquisition Funnel Template
Customer Acquisition Funnel Template
Objective: Track and optimize the customer journey from awareness to conversion to enhance business growth and streamline marketing and sales efforts.
1. Funnel Stages
The customer acquisition funnel consists of five core stages that reflect the buyer's journey:
1.1 Awareness
Objective: Introduce your brand to potential customers.
Activities:
- Digital advertising (search, display, social media)
- Traditional advertising (TV, radio, print)
- Public relations, earned media
- Content marketing (blogs, videos, case studies)
- SEO and website optimization
Metrics to Track:
- Website traffic
- Ad impressions
- Content engagement (clicks, views, shares)
2. Interest
Objective: Nurture initial curiosity and convert awareness into engagement.
Activities:
- Downloadable resources (ebooks, whitepapers)
- Social media engagement
- Email nurturing campaigns
- Customer testimonials and reviews
Metrics to Track:
- Leads generated
- Content downloads
- Engagement (social media interactions, email open rates)
3. Consideration
Objective: Help prospects evaluate your solution and build trust.
Activities:
- Free trials or demos
- Sales consultations or webinars
- Retargeting ads
- Multi-touch email campaigns
Metrics to Track:
- Trial signups
- Consultation bookings
- Click-through rates (CTR) on retargeting ads
4. Decision
Objective: Close the sale by overcoming objections and offering final incentives.
Activities:
- Special discounts or promotions
- Personalized follow-ups and calls
- Frictionless checkout or point-of-sale experiences
Metrics to Track:
- Conversion rate
- Sales cycle length
- Revenue generated from promotions
5. Customer
Objective: Onboard and retain customers to foster loyalty and advocacy.
Activities:
- Onboarding calls and product training
- Customer satisfaction surveys
- Loyalty programs or referral incentives
- Retargeting and cross-selling
Metrics to Track:
- Customer retention rate
- Net Promoter Score (NPS)
- Referral program participation
2. Funnel Optimization Strategies
Identify Bottlenecks
Track drop-offs at each stage to identify where prospects are losing interest or getting stuck.
Resource Allocation
Direct more resources (budget, personnel, tools) toward areas with the highest conversion potential.
A/B Testing
Continuously experiment with different strategies at each stage, such as email subject lines, landing page designs, or ad copy.
Cross-Channel Analytics
Ensure data from all touchpoints (website, ads, email, social, sales reps) is tracked in one unified system.
3. Key Performance Indicators (KPIs)
Conversion Rate by Stage
Measure how effectively prospects move from one stage to the next.
Cost per Lead (CPL)
Track the cost of acquiring leads through various channels.
Lead to Customer Conversion Rate
Calculate how many leads convert to paying customers.
Sales Velocity
Measure how quickly prospects move through the funnel from initial contact to conversion.
4. Continuous Improvement
Monitor Funnel Performance
Use analytics platforms to track engagement and optimize the funnel in real time.
Test New Marketing Channels
Stay ahead of emerging channels and test their impact on your funnel.
Optimize for Customer Experience
Ensure that each touchpoint offers value and aligns with customer expectations to minimize friction.
5. Tools & Resources
Factors Analytics
Use analytics tools (e.g., Factors) to visualize your funnel performance, track interactions, and uncover insights for optimization.
CRM Systems
Keep detailed records of customer interactions to improve lead nurturing.
Marketing Automation
Automate emails, retargeting ads, and other communications to streamline funnel management.
Customer Acquisition Funnel Review
Review your customer acquisition funnel regularly to ensure that it’s aligned with your business goals, customer needs, and the evolving market landscape. Adjust your strategies as needed to increase efficiency and conversions.
Give Your Conversion Rates a Boost with Customer Acquisition Funnels
Constructing, tracking, and optimizing a customer acquisition funnel provides tremendous benefits for businesses striving for sustainable scalability and revenue growth. It offers an adjustable data-driven framework for:
- Holistically visualizing the customer journey within your company.
- Pinpointing problems impacting conversions and sales velocity.
- Continuously improving marketing and sales processes.
- Cost-effectively acquiring more high-value customers.
The bottom line—taking the time to build and leverage the customer acquisition funnel outlined in this guide is a vital, high-ROI activity for any growth-oriented business.
To recap, with a well-designed and optimized customer acquisition funnel, you can:
- Map the unique stages customers move through on their journey to purchase.
- Identify your most effective acquisition strategies and channels.
- Uncover conversion bottlenecks stunting growth.
- Optimize resource allocation and activities.
- Predict future customer acquisition and revenue performance.
{{CTA_BANNER}}
The customer acquisition funnel is indispensable for sustainably scaling up conversions and sales in highly competitive markets. So, use the available tools to make the most of your traffic effortlessly!
Want to know how Factors can help you on this journey? Book a demo with Factors and let our analytics and attribution experts guide you.
FAQs on Customer Acquisition Funnel
1. What is a customer acquisition funnel?
A customer acquisition funnel is a structured path potential customers follow from first becoming aware of a product to ultimately making a purchase. It consists of stages that segment the customer journey, helping businesses understand and optimize each step to drive higher conversions.
2. Why is optimizing a customer acquisition funnel important?
Optimizing a customer acquisition funnel helps businesses identify roadblocks, improve conversion rates, allocate resources efficiently, and make more accurate growth projections. It also fosters a customer-first mindset, enhancing the overall customer experience and increasing long-term retention.
3. What are the key stages of the customer acquisition funnel?
The key stages are:
- Awareness: Building broad awareness of the product.
- Interest: Engaging prospects with relevant content.
- Consideration: Encouraging leads to evaluate the solution.
- Decision: Finalizing the purchase decision.
- Customer: Onboarding, retention, and loyalty-building.
4. How can tools like Factors help optimize the acquisition funnel?
Factors aggregates customer data across multiple channels, providing a unified view of the entire customer journey. It helps businesses track funnel performance, diagnose issues, and identify the most effective marketing and sales strategies, enabling continuous funnel optimization and improved conversions.

Predictive Lead Scoring: How AI Helps Optimize Sales and Marketing
Sales and marketing teams struggle to identify and prioritize leads that are highly likely to convert. Manually scoring leads is time-consuming and often results in guessing and methodology inconsistencies.
What if there was a way to automatically score leads based on their conversion likelihood using data-driven insights and machine learning algorithms? This would allow teams to focus on the most promising prospects, personalize outreach, and improve conversion rates significantly.
The answer—predictive lead scoring.
Predictive lead scoring optimizes lead management by identifying leads most likely to convert using AI and historical data. This article will explore predictive lead scoring, its benefits, and how it transforms lead management strategies.
What is Predictive Lead Scoring?
At its core, predictive lead scoring ranks leads based on their likelihood of converting into customers.
It’s a modern approach, evolved from traditional, manual lead-scoring methods.
Previously, sales and marketing teams manually assigned scores to leads based on factors like demographic information and behavior.
This approach was time-consuming and often relied on gut instincts rather than data.
But, as platforms became more advanced, so did their methodologies for lead scoring. In recent years, many platforms have also started using AI to power their lead scoring instead of rule-based scores.
Most lead scoring models use the following pieces of data to make sense of what stage of the buyer’s journey the lead could be at:
- CRM data
- Website behavior
- Social media interactions
- Email Engagement
- Demographic information
With this data, AI algorithms can identify patterns and correlations that indicate a lead’s likelihood of converting. You can use a lead scoring tool to identify and prioritize customers interested in your product.
The idea behind predictive lead scoring is to eliminate the unnecessary blockers that slows and help them make real-time decisions based on the right data. Let’s further explore the benefits of predictive lead scoring
5 Benefits of Predictive Lead Scoring
Predictive lead scoring can be quite powerful and lead to several impactful benefits, including:
- Increased Efficiency: When you prioritize leads based on their likelihood of conversion, your sales team can focus their time and resources on the most promising opportunities. This leads to higher conversion rates, shorter sales cycles, and improved efficiency.
- Better Alignment Between Sales and Marketing: Predictive lead scoring helps bridge the gap between sales and marketing teams. Once you establish a common framework for evaluation, both teams can work together more effectively, ensuring that marketing efforts generate high-quality leads and sales teams follow up on the most valuable prospects.
- Personalized Engagement: You can tailor your engagement strategies to match the preferences and needs of individual leads. , When you know what influences a prospect’s buying decision, you can deliver targeted content, personalized offers, and customized communication that resonates with each lead, increasing the likelihood of conversion.
- Improved Resource Allocation: When you can predict which leads are most likely to convert, you can easily move resources from other leads to focus on them.
- Data-Driven Decision Making: Instead of relying on guesswork and intuition, predictive lead scoring helps you base your decisions on actual customer behavior and preferences. Basing decisions on objective data can help you optimize your sales and marketing strategies, identify areas for improvement, and continuously refine your approach.
Implementing predictive lead scoring has various other benefits that you realize as you start using it within your day-to-day workflows.
Let’s now see how predictive lead scoring works.
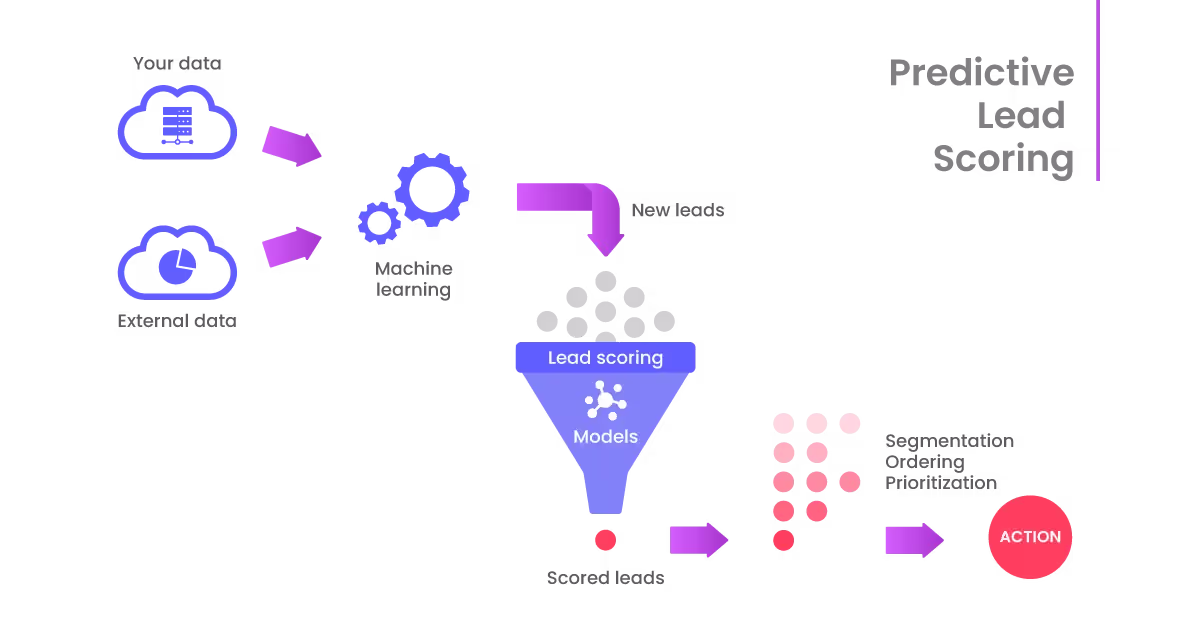
How Predictive Lead Scoring Works
Let's examine the process of predictive lead scoring and how it uses data, analytics, and automation to identify and prioritize the leads most likely to become customers. We'll explain each step so you can understand how it all fits together.
1. Know Your Leads
Collect detailed information about your leads from different sources. This includes basic data like job titles and company size, activity data like website visits and email engagement, and any other information that helps you understand their needs, interests, and buying likelihood.
The better you know your leads, the easier it is to evaluate their potential.
2. Add Mined Information
You can improve your lead data by using data mining techniques and adding information from third-party data sources. This means pulling valuable insights from unorganized data like social media posts and web forums and combining them with the lead records you already have. You can find hidden patterns, connections, and details that make your lead-scoring model more accurate.
3. Apply Predictive Analytics
Now, here's where things get interesting. Once you have the improved lead data, you can use predictive analytics algorithms. These algorithms look at past data to find the main factors and patterns that match up with successful conversions.
Suppose your historical purchase data shows that leads from the healthcare industry who visit your pricing page or attend a webinar are 80% more likely to convert than the average lead.
Predictive analytics algorithms can detect this pattern and assign a higher lead score to prospects who exhibit similar behavior.
Using methods like logistic regression, decision trees, and machine learning, you can create a predictive model that gives each lead a score based on how likely they are to convert.
4. Identify Sales Ready Leads
After the predictive model is set up, you can use it on your current lead database to create scores for each lead. These scores show how likely a lead is to become a customer, with higher scores meaning a better chance of conversion.
With this information, you can rank and group your leads based on their buying readiness so your team can focus on the most promising opportunities.
5. Prioritize Highest Value Leads
The leads with the highest scores are the real standouts—they're the most valuable and ready to buy. These are the people whose traits and behaviors most closely match successful conversions in the past.
These high-value leads can help your sales team make the most of their time and resources, increasing their chances of closing deals and growing revenue.
The above steps are automatically handled with predictive lead scoring after you integrate the data.
The result is a ranked list of the high-fit and high-intent leads.
This helps your sales team target the right leads at the right time with personalized outreach strategies. Predictive lead scoring also helps achieve higher conversion rates and grow your business, as your team can connect with potential leads while they’re still hot.
What Data is Used for Predictive Lead Scoring?
Creating an effective predictive lead scoring model requires considering a wide range of factors influencing a lead’s likelihood to convert. These factors can be grouped into several categories:
Demographic Data
Demographic information, such as age, location, industry, and company size, can provide valuable insights into a lead’s potential fit for your product or service. For example, if you’re selling enterprise software, leads from larger companies may be more likely to convert than those from small businesses.
Behavioral Signals
A lead’s behavior can tell you a lot about their level of interest and engagement with your brand. Some key behavioral signals to consider include:
- Website visits: How often does a lead visit your website, and which pages do they view?
- Content engagement: Do they download whitepapers, attend webinars, or engage with your blog posts?
- Email interactions: Do they open and click through your emails?
- Social media activity: Do they follow your company on social media or engage with your posts?
External Data Sources
Predictive lead scoring models can also incorporate information from external sources, in addition to data from your systems, such as:
- Social media data: Insights from a lead’s social media profiles and activity can provide valuable context about their interests and behavior. You can even use intent data to drive your pipeline further.
- Third-party data providers: Companies like Clearbit and 6sense can provide additional firmographic and technographic data to enrich your lead profiles. Factors integrates with both the data providers, helping you reveal an industry-leading 64%+ anonymous accounts.
When put together, you get a complete picture of the journey of the lead going from
Challenges with Predictive Lead Scoring
While AI-powered lead scoring can be a powerful tool, there are also some challenges and considerations to keep in mind:
Highly Dependent on Data Quality
The accuracy of predictive lead scoring models depends heavily on the quality of the data they’re trained on. If the data is incomplete, inconsistent, or inaccurate, the model’s predictions will be less reliable. Ensuring that data is properly collected, cleaned, and maintained is crucial.
Regular Model Training
Predictive models require continuous refinement and retraining to stay accurate as new data comes in. This means that implementing AI-powered lead scoring is not a one-and-done process, but rather an ongoing commitment.
Cannot Replace Human Judgment
While AI can provide valuable insights and predictions, it’s important to remember that it’s ultimately a tool to augment human decision-making, not replace it entirely. Sales and marketing teams should use AI-powered lead scoring as one input among many when prioritizing their efforts.
Take Advantage of Predictive Lead Scoring!
Predictive lead scoring offers clear benefits: it increases conversion rates, shortens sales cycles, improves sales and marketing alignment, and optimizes resource allocation.
However, it is a challenge to implement.
You must either rely on internal developer resources and sufficient data to ensure success or partner with third-party tools specializing in this area and have access to extensive datasets for accurate lead scoring and account intelligence features.
Enter Factors.
A powerful platform that combines data from across your marketing stack and channels to get you the best insights under a single roof. Factors automatically assigns lead scores based on data from your CRM and the ads you run, the pages your visitors view, and more to give you a holistic score that considers as much relevant data as possible.
Factors also partners with Clearbit and 6sense to help you reveal anonymous accounts browsing your website or interacting with other marketing channels, which enhances your account-based marketing.
Get ready to level up your marketing stack. Hop on a demo call with Factors and see how you can benefit from Factors today!

Account-Based Marketing Team Structure: Key Roles and Responsibilities to Drive Success
Account-based marketing (ABM) is unlike traditional marketing. Instead of trying to reach the masses, you focus on a small set of high-value accounts.
The ABM team crafts individually tailored content, advertisements, and emails for the target accounts, increasing the likelihood of conversion. For instance, consider a company that sells cybersecurity solutions to financial institutions. The target accounts are large banks and credit unions looking to upgrade their cybersecurity measures.
The ABM team creates tailored content such as case studies, whitepapers, and infographics. They also design advertisements highlighting the revenue losses from security breaches. All the content is tailor specifically for the financial industry, and sometimes even for specific companies.
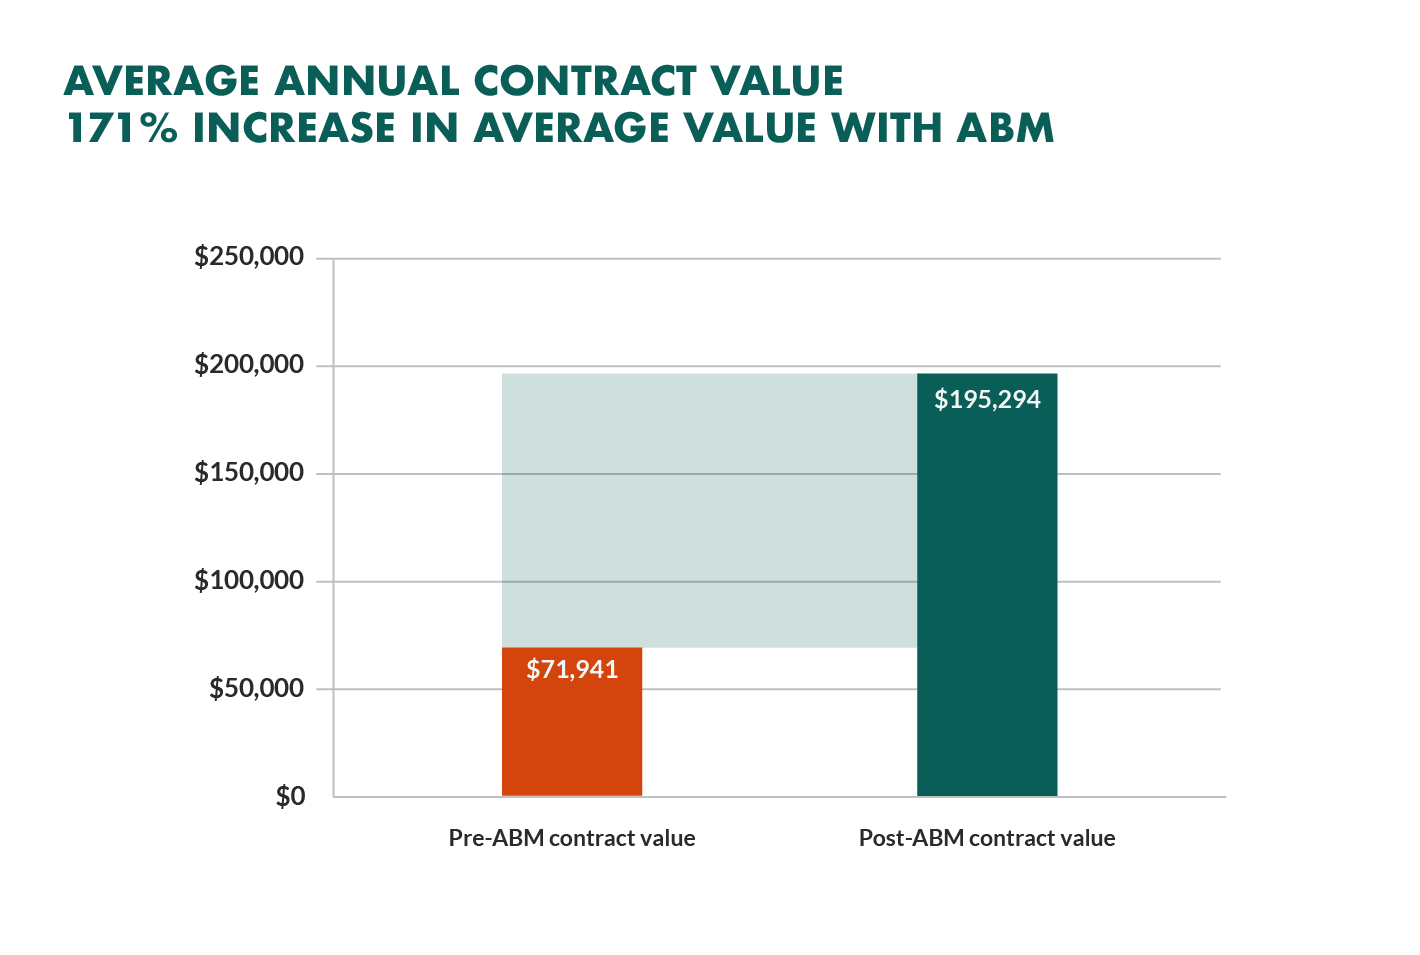
This targeted approach makes ABM a powerful strategy. Businesses that used ABM strategies saw revenue growth of 208% and an average increase of 171% in their annual contract values.
But you need a strong account-based marketing team structure to succeed. Without a proper team, even the most ambitious ABM strategy can quickly fall apart.
That’s why it’s important to know the key players and qualities of a good ABM team member before you begin structuring your ABM department.
TL;DR:
- Account-based marketing (ABM) focuses on high-value accounts, requiring a well-structured team and diverse skill sets
- Key team members include C-level executives, data analysts, strategists, designers, and content creators
- CEO, CMO, and CRO provide strategic direction, align ABM with company goals, and drive revenue growth
- Operations, Marketing, and Sales Managers oversee and execute various aspects of ABM campaigns
- Execution-based roles include Performance Marketers, Graphic Designers, Content Marketing and Strategy, Social Media Marketers, and Copywriters
- Proper team structure is critical for ABM success. It requires collaboration, strategic thinking, adaptability, and strong communication skills
- Tools like Factors.ai can optimize ABM efforts by providing insights into customer journeys, visitor tracking, and marketing ROI optimization
Account-Based Marketing Team Structure
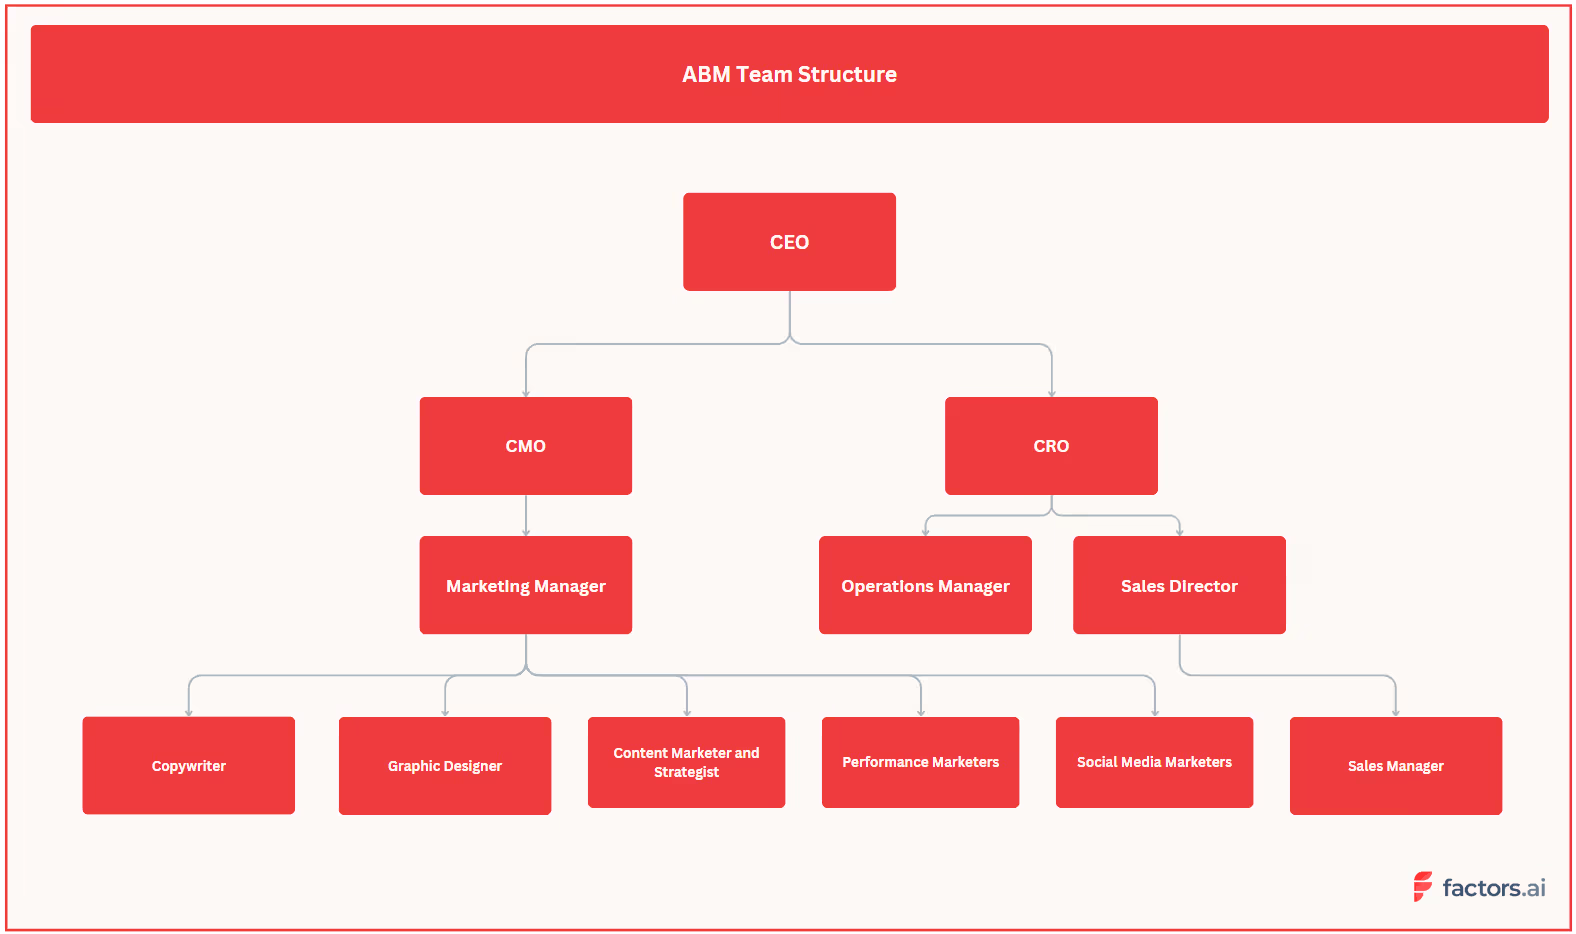
The account-based marketing team brings together people of diverse skill sets and varying levels of expertise to come together with a focused vision.
C-Suite and Directors
The C-Suite and Directors in the ABM team have higher-level access to company information and the long-term vision to align the team towards a singular goal.
Chief Executive Office (CEO)
Before any ABM campaign is planned out, the team needs to understand the long-term vision of the company. That’s where a CEO comes into play. With the top level view of the company, the CEO can assist the ABM team plan things out, provide feedback on strategies, and assist with connecting the team to high-value accounts through their networks.
Some of the key responsibilities of the CEO in terms of the ABM team are:
- Setting the company's vision and long-term strategy
- Providing leadership and guidance to the executive team
- Building and managing relationships with key stakeholders
- Representing the company to the public and media
- Work with stakeholders for account scoring
Chief Marketing Officer (CMO)
The CMO has a critical role in the ABM team. This person helps define the strategy and keeps the ABM team aligned to the company’s goals at all times. The responsibilities may vary, but a CMO is generally involved in:
- Providing strategic direction and guidance for the ABM program
- Aligning ABM initiatives with the company's overall marketing strategy
- Collaborating with the sales team to identify target accounts and prioritize outreach efforts
- Ensuring that the ABM team has the necessary resources and tools to execute campaigns effectively
Chief Revenue Officer (CRO)
The CRO manages all things revenue and has the highest level access to the company’s inflow and outflow. A CRO can help the ABM team to:
- Bring the sales and marketing teams together to create a cohesive ABM strategy
- Ensure high-quality leads and revenue growth through the ABM program
- Approve budgets to execute campaigns as and when required
- Measure and analyzing the ROI of campaigns
- Collaborate with the marketing team to help refine the ABM strategy over time
Sales Directors
Sales directors are responsible for driving revenue growth by managing the sales team and maintaining relationships with key clients. The sales directors might be involved in:
- Collaborating with the marketing team to identify target accounts and prioritize outreach efforts
- Providing feedback on the effectiveness of ABM campaigns in generating leads and driving revenue
- Helping to refine the ABM strategy over time based on sales team feedback
- Ensuring that the sales team is aligned with the ABM program and has the necessary resources to engage with target accounts effectively.
Managerial Roles in ABM
The success of an Account-Based Marketing (ABM) campaign is heavily dependent on the leadership and management of the team. Managers oversee and help with executing various aspects of ABM campaigns.
Operations Manager
The Operations Manager oversees ABM campaigns from planning to execution. They ensure that all tasks are completed on time and that the team works efficiently. The ops manager also helps the ABM team manage the budget and execute tasks cost-effectively.
Some of the key responsibilities of the Operations Manager in ABM include:
- Overseeing the development of the ABM strategy and ensuring it aligns with the company's overall goals
- Managing the budget for the ABM campaign and ensuring that expenses are within the allocated budget
- Setting up systems and processes to track the progress of the ABM campaign
- Collaborating with the Marketing and Sales team to ensure that the campaign is effective in generating leads and revenue
- Reporting on the progress of the ABM campaign to senior management
Generally, the operations manager needs to be on top of things to ensure proper execution of the campaigns.
Depending on the org structure in the company, operations manager may also keep track of the key ABM metrics like customer acquisition, customer retention, and customer engagement.
This can help determine whether the current marketing strategies are effective and whether they need to be modified.
Marketing Manager
The Marketing Manager is responsible for the creative aspects of the ABM campaign, such as developing the messaging and designing the creatives. They work closely with the Operations Manager to ensure that the campaign is executed according to plan. Some of the key responsibilities of the Marketing Manager in ABM include:
- Developing the messaging and creatives for the ABM campaign
- Identifying the right channels to reach the target accounts
- Developing and executing marketing campaigns that align with the ABM strategy
- Measuring the effectiveness of marketing campaigns and making necessary adjustments
- Collaborating with the Sales team to ensure that marketing efforts are aligned with sales objectives
Since a major part of the marketing manager’s role is understanding analytics and data, they can greatly benefit from marketing analytics tools like Google Analytics, Factors.ai, and Microsoft Clarity.
These tools can help measure the performance of marketing campaigns, track visitors and engagement, perform revenue attribution, and identify areas for improvement.
Sales Manager
The Sales Manager is responsible for working with the Sales team to ensure that the ABM campaign is generating leads and revenue. They work closely with the Operations and Marketing Managers to ensure that the campaign is executed smoothly.
Some of the key responsibilities of the Sales Manager in ABM include:
- Collaborating with the Marketing team to identify high-value accounts
- Identifying decision-makers and key contacts within the target accounts
- Developing and executing a personalized outreach strategy for each account
- Reporting on the progress of the ABM campaign to senior management
- Nurturing relationships with key clients and ensuring their needs are met
Sales managers can also choose to employ a conversational ABM strategy to improve the sales team output. This strategy uses chatbots as the first point of contact, helping sales teams filter clients and improve conversions.
Strategy and Execution-Based Roles
While the senior-level team members provide strategic direction, the execution-based roles do the groundwork for ABM campaigns.
Performance Marketers
Performance marketers are responsible for creating and executing paid advertising campaigns. They come up with strategies to target the right audience, work with graphic designers to design ads, and monitor campaigns’ performance to optimize results. The responsibilities of performance marketers include:
- Creating the target audience and segmenting for better targeting
- Keeping track of campaign performance metrics using analytics tools like Factors and Google Analytics
- Collaborating with designers, content strategists, and copywriters to design and create ad copy and landing pages
Graphic Designers
Graphic designers play a crucial role in creating personalized and tailored designs for the ABM campaigns. But generic designs will fail to meet the standards here.
ABM designs need to capture the attention of your target audience and make a lasting impact.
Graphic designers must deliver their highest quality work, bringing creativity and innovation to the table. The designers must also have a deep understanding of the target account's preferences and expectations to truly resonate and drive engagement.
Here are some key responsibilities and qualities of a graphic designer in an ABM team:
- Collaborate with the marketing and strategy teams to create designs that resonate with target accounts
- Craft graphics for various marketing materials, such as display ads, social media posts, landing pages, and email campaigns
- Ensure that all visual elements are consistent with the company's branding and visual identity guidelines
- Optimize and repurpose graphic content for use on different social media platforms
Content Marketing and Strategy
Content is an important part of any ABM campaign. For instance, the content strategy team begins identifying topics that are important to your target audience.
The content marketing team then creates blog posts, whitepapers, and case studies around the topics to rank on search engines and be shared with the target accounts.
They may also collaborate with the sales team to identify content gaps and create additional content that speaks to the pain points of target accounts.
Some of the major responsibilities of the content marketing and strategy team may include:
- Conducting keyword research to optimize content for SEO
- Developing content that speaks to the pain points of target accounts
- Creating a content calendar to ensure consistency in messaging
- Developing and executing on a social media strategy to promote content
- Measuring and analyzing the performance of content to make data-driven decisions
Social Media Marketers
Social media marketers are responsible for ensuring regular engagement with the target accounts. They mould the social presence in a way that the target accounts find value in following your company profile—thus giving you direct access to these accounts. The responsibilities of social media marketers include:
- Creating and managing social media accounts
- Developing social media strategies that align with the ABM campaign's objectives
- Creating social media content that resonates with the target audience
- Engaging with the target audience on social media channels
Copywriters
Copywriters are responsible for creating compelling copy that resonates with the target audience. They work closely with content strategists to ensure that the copy aligns with the ABM campaign's objectives. The responsibilities of copywriters include:
- Creating copy for ad campaigns, landing pages, and other marketing materials
- Collaborating with content strategists to ensure that the copy aligns with the ABM campaign's objectives
- Conducting research to identify the pain points of the target audience
- Writing compelling copy that resonates with the target audience
Why is team structure important for ABM?
The process of an ABM campaign goes from designing the strategy, to gathering data and analyzing it, and finally executing the campaign based on the findings. But because of the highly personalized nature, account based marketing involves stakeholders from multiple teams for insights and feedback.
ABM teams need a lot of ad-hoc decision-making and creativity, so everyone on the team works towards a common goal, communicates effectively, and supports each other.
This is why proper team structure is critical to the success of ABM campaigns. It allows for seamless integration of strategies and effective collaboration among team members.
Apart from the basic understanding of the role and being able to collaborate with a diverse set of individuals, here are a few qualities of a great ABM team member:
- Use data and analytics to guide decisions and actions
- Ability to find creative solutions to challenges
- Adapt to changing situations and priorities
Achieve ABM Success With a Strong Team
A strong and effective team is crucial to the success of any ABM initiative. With the right mix of talent, expertise, and collaboration, your ABM team can unlock the full potential of your marketing efforts and drive meaningful results.
But to truly take your ABM to the next level, you need the right tools and technologies at your disposal. That's where Factors.ai comes into play. It offers deep insights into customer journeys, anonymous visitor tracking, and marketing ROI optimization, helping you to identify sales-ready accounts, automate analytics, and prove the revenue impact of every touchpoint.
With Factors, you can reduce your CAC, improve ROI, and accelerate revenue growth seamlessly. Schedule a demo today and see for yourself how Factors can transform your ABM approach and drive more pipeline with less spend.
FAQs
1. What qualities should I look for when building my ABM team?
Here are some of the qualities to look for in an ABM team member.
- Strong collaboration skills
- Strategic thinking.
- Analytical mindset
- Adaptability for constantly changing environment
- Creativity
- Strong communication skills
2. How do I create an ABM team?
Creating an ABM team involves understanding your end goals and finding people to fill the talent and skill gaps within your marketing and sales teams. However, here are the general steps to build your ABM team.
- Establish the end results you want to achieve with an ABM team
- Based on the goals, identify what skills and expertise is needed for your marketing team. This could include account management, data analysis, content creation, and project management
- Hire people with the required skill sets and establish clear roles and responsibilities for each of the new team members
- Create an open environment for the team to collaborate with the stakeholders as an when required for the successful execution of your ABM campaigns

LinkedIn Intent Data: The Missing Ingredient in Your B2B Sales Strategy?
LinkedIn Intent Data: The Missing Ingredient in Your B2B Sales Strategy?
With over 900 million members across 200 countries and 4 out of 5 members driving business decisions, LinkedIn is a crucial platform for B2B sales and marketing teams. 97% of B2B marketers use LinkedIn for lead generation. But how can you ensure that your LinkedIn ads and marketing efforts are influencing conversions?
Enter LinkedIn intent data.
LinkedIn intent data shows if a prospect has interacted with or shown interest in your LinkedIn ads, allowing you to gauge their likelihood of converting. In this article, we'll discuss how this data can benefit both marketing and sales teams, and how Factors can help you make the most of this valuable information.
TL;DR
- LinkedIn intent data reveal prospects' level of interest and engagement with ads.
- It helps illuminate the "dark funnel" of hidden interactions and potential leads.
- Benefits include audience segmentation, ad optimization, retargeting, and lead scoring.
- Marketers can use intent data to optimize campaigns and improve targeting.
- Sales teams can use intent data to prioritize high-intent accounts and personalize outreach.
- Factors is a tool that integrates LinkedIn intent data with CRM data for deeper insights.
What Is LinkedIn Intent Data?
LinkedIn intent data is a crucial piece of information that reveals the level of interest and engagement prospects have with your LinkedIn ads. By analyzing this data, you can gain valuable insights into the buyer's journey and identify potential leads who are more likely to convert.
This information is vital in today's competitive B2B landscape, where understanding the preferences and needs of your target audience can significantly improve your sales and marketing efforts.
Why Is LinkedIn Intent Data Important?
In B2B, the buyer's journey is often complex and multifaceted. Prospects interact with various touchpoints before making a purchase decision. Unfortunately, not all of these interactions are visible or easily tracked, leading to the existence of a "dark funnel."
What is the dark funnel?
The dark funnel is part of the buyer's journey where prospects have been exposed to your LinkedIn ads, content, or other marketing materials but haven't directly engaged with them or converted immediately.
These “hidden” interactions can make it challenging to assess the true impact of your marketing efforts and identify valuable leads who may convert later in their journey.
How does Linkedin intent data help?
LinkedIn intent data illuminates the dark funnel by providing insights into prospects' level of interest and engagement with your ads, even if they haven't directly interacted with them. Here are a few ways in which it can help you gain a deeper understanding of the dark funnel:
- Segment your audience based on their intent data: By analyzing LinkedIn intent data, you can segment your audience into different categories based on their level of engagement and interest in your ads. This will help you create tailored account-based marketing campaigns that address the unique needs and preferences of each segment, increasing the chances of converting these prospects. For instance, if you run an e-learning platform, you can segment users who have engaged with your ads about coding courses and target them differently than users who’ve shown interest in a writing course.
- Optimize your ad creatives and targeting: Understanding the preferences of prospects within the dark funnel can help you optimize your LinkedIn ad creatives and targeting strategies to better resonate with your audience. Then, fine-tuning your ads based on intent data insights can improve the overall effectiveness of your marketing efforts. For example, if you find that prospects in the dark funnel are engaging more with video ads than image-based ads, you can allocate more budget to video ad campaigns and optimize targeting to reach more people likely to be interested in your product.
- Retarget potential leads: With this data at hand, you can retarget prospects with tailored content and offers. If a prospect has engaged with content about a particular product or service on your website, but didn't complete a purchase, you can retarget them with a special discount or offer, encouraging them to revisit your site and complete the transaction.
- Enhance lead scoring and prioritization: By incorporating intent data, you may find that a group of people have engaged heavily with your ads and content, but haven't reached out directly yet. For instance, if you're a B2B software company, your sales team can reach out to prospects who've shown a high level of engagement with specific features of the software. They can demo the tool while keeping the focus of the conversation on the feature of interest.
LinkedIn Intent Data For Marketers: Unlock The Potential Of Your Ads
As marketers, we aim to reach the right audience, deliver a message that resonates with them, and ultimately drive conversions. Linkedin buyer intent data is highly valuable in achieving these objectives and gaining valuable insights into audience engagement. With this, you can optimize your LinkedIn marketing strategy in several ways:
- Know if ads are reaching the intended audience: Linkedin’s intent data gives you insights into who is interacting with your ads. This information is then curated in an account-level format so your ABM teams can filter accounts with the highest interest in buying your product or service.
- Optimize LinkedIn ads based on engagement: Analyzing LinkedIn intent data can tell which ad formats, visuals, and copy resonate most with your audience. You can then make data-driven decisions to optimize your ads, boosting engagement and conversion rates.
- Know which kind of ad copy resonates with the audience: By examining the intent data from different ad variations, you can identify the messaging that best captures your audience's attention. This empowers you to tailor your ad copy and creatives to better appeal to your target audience, leading to more clicks, higher engagement, and ultimately, more conversions.
- Combine LinkedIn intent data with third-party intent data for a holistic approach: By integrating this data with third-party intent data (from sources like G2, TrustRadius, etc.), you can create a more comprehensive understanding of your prospects' needs throughout their buying journey. This enables you to deliver targeted, relevant content and ads that address their pain points and move them closer to conversion.
How To Use LinkedIn Buyer Intent To Improve Pipeline Velocity
Pipeline velocity is a key performance indicator (KPI) for sales teams, as it measures the speed at which leads move through the sales funnel and ultimately convert into customers. Leveraging LinkedIn buyer intent data can significantly improve pipeline velocity by helping you prioritize high-intent accounts, personalize outreach, and align sales and marketing efforts. Here's how:
- Prioritize high-intent accounts for account-based marketing (ABM): LinkedIn buyer intent data can help sales and account-based marketing (ABM) teams identify high-intent accounts, those that have shown significant interest in your LinkedIn ads, and are more likely to convert into customers. By prioritizing these high-intent accounts, your team can focus its efforts on the most promising leads, increasing the chances of closing deals and improving overall pipeline velocity.
- Use intent data and deanonymization to personalize outreach: Using LinkedIn buyer intent data, you can tailor your sales outreach to the specific needs and interests of your prospects. Adding Factors to the mix, you can also deanonymize website traffic and know about the company and industry that they work in. With this, you can gain deeper insights into their pain points, preferences, and points of friction. This allows your sales team to craft personalized messages that address these concerns and demonstrate the value of your product or service, helping to move prospects through the sales funnel more quickly.
- Align sales and marketing based on intent data: Regularly analyzing LinkedIn buyer intent data can help you identify trends and patterns in your prospects' behavior, allowing you to optimize your sales and marketing tactics accordingly. This is also good for reporting on the effectiveness of campaigns. For example, you may discover that certain types of content or ad formats resonate better with your target audience, leading to higher engagement and faster movement through the sales funnel.
- Add intent data into CRM and marketing automation platforms: Integrating LinkedIn buyer intent data into your CRM and marketing automation platforms can help automate lead scoring, segmentation, and nurturing efforts based on prospects' engagement and intent. This allows your sales and marketing teams to efficiently focus their efforts on high-intent leads, ultimately improving pipeline velocity.
- Enhance Account Scoring: Incorporating LinkedIn buyer intent data into your account scoring methodology can provide a more accurate assessment of a prospect's likelihood to convert. The combination of data from multiple sources allows your sales and marketing teams to better score leads. Add to that Factors’ account scoring features, and you can automate your prioritization process for the teams too.
Make The Most Of Your LinkedIn Intent Data with Factors
Leveraging buyer intent data from LinkedIn effectively can help you identify the users with the highest interest and modify your approach to better target the accounts. Factors enables you to maximize the potential of this data to drive results. Here's how:
1. Integrated data analysis
Factors helps combine Linkedin intent data with data from other sources, such as CRM platforms, ads, website, and more. This integrated approach enables you to gain a holistic understanding of your prospects' buyer journey, helping you identify high-intent accounts and optimize your marketing and sales strategies accordingly.
2. Visual user timelines for enhanced attribution
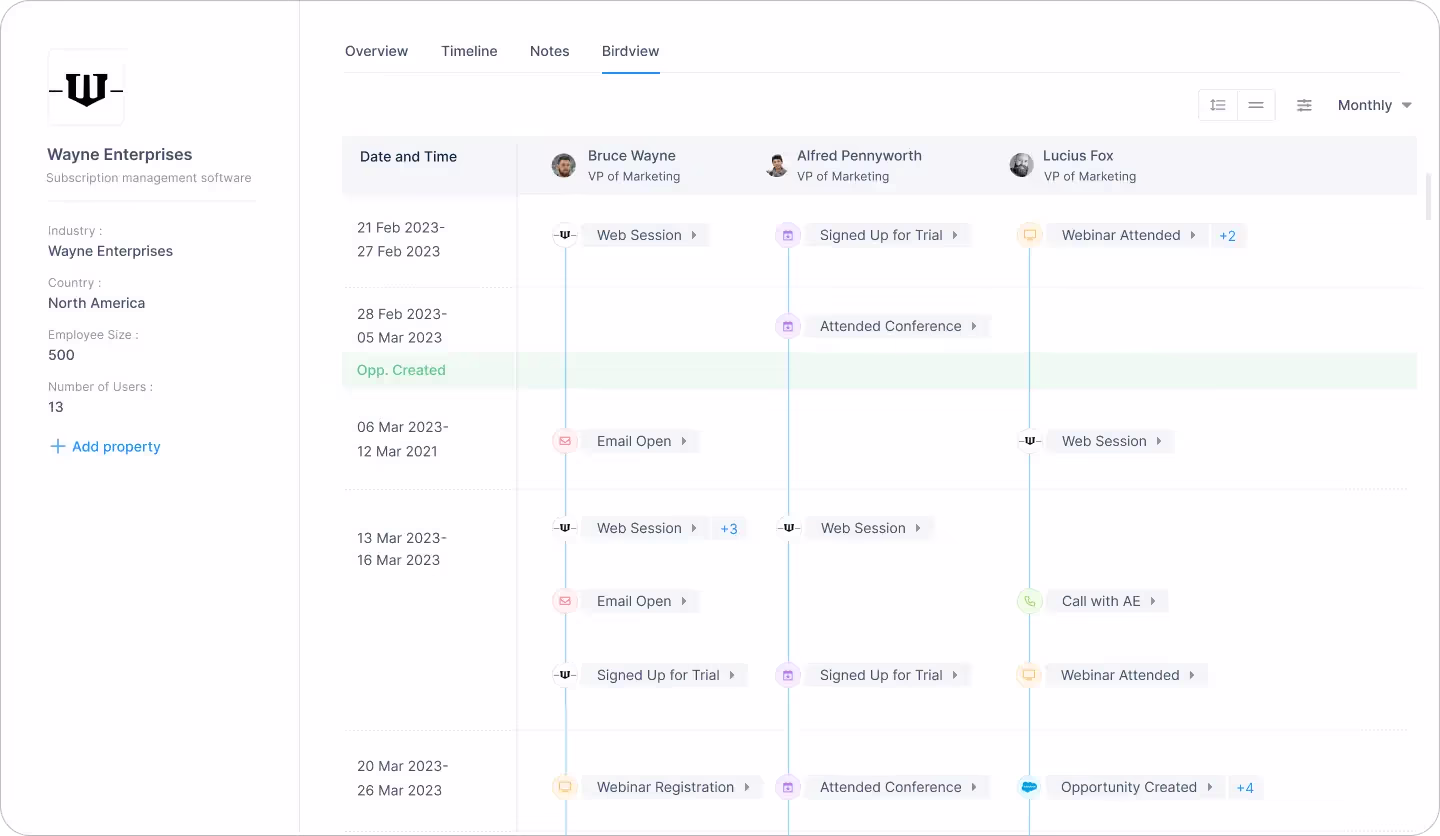
Factors offers a visual user timeline that lets you track and analyze your prospects' interactions with your LinkedIn ads over time. You can also view if the same user has interacted with your brand over other platforms or campaigns that you already track. This gives you a holistic view of an individual user's journey and engagement with your brand across multiple touchpoints.
3. Account intelligence
Factors' account intelligence capability allows users to identify anonymous companies visiting your website, along with their intent and firmographics. Your ABM teams can then personalize outreach by understanding their interactions with your content and ads to improve conversions.
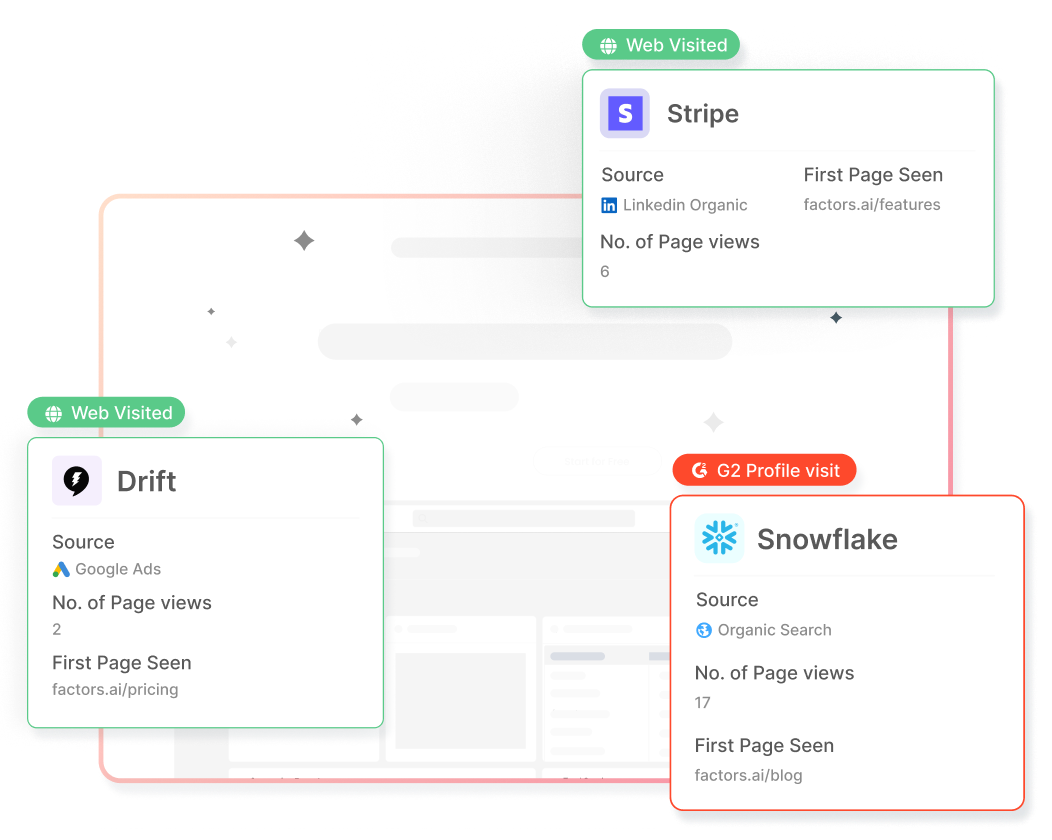
4. Optimize ad engagement and performance
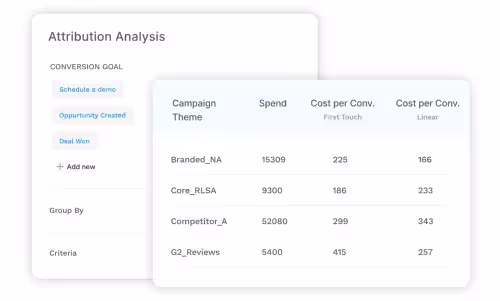
Factors uses Linkedin ad engagement data and audience insights to help you optimize your Linkedin ad campaigns. Knowing which ads resonate with your target audience and generate the most engagement can help you refine your campaigns to maximize returns and drive conversions. You can also uncover the ad formats, content types, and messaging that resonate best with your target audience and increase the likelihood of conversions.
5. Account scoring
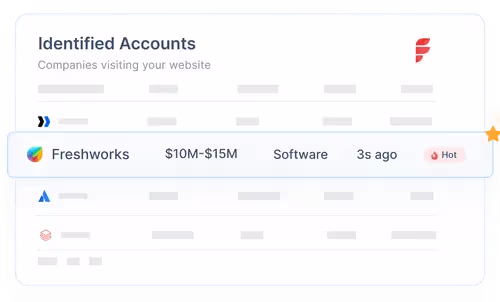
Factors' account scoring feature helps prioritize prospects based on their engagement and intent, enabling sales teams to focus their efforts on high-value targets. By combining intent data with firmographics, technographics, and engagement history, you can create a comprehensive account score that helps your sales team prioritize their efforts and focus on the most promising opportunities.
FAQs
1. How does LinkedIn calculate buyer intent?
LinkedIn calculates buyer intent by analyzing user engagement with your company's ads, content, and other interactions on the platform. This includes factors such as clicks, likes, comments, shares, and time spent viewing your content. By tracking these interactions, LinkedIn can identify which users are genuinely interested in your products or services, signaling potential buyer intent.
2. How can you use intent data for sales?
Intent data can be used by sales teams to prioritize high-intent accounts, personalize outreach efforts, align sales and marketing initiatives, optimize sales tactics, and enhance account scoring. By leveraging intent data, sales teams can focus their resources on the most promising leads, creating more targeted and effective sales strategies that drive revenue growth and improve pipeline velocity.
Bring the Power of LinkedIn Buyer Intent Data to B2B Sales
Leveraging LinkedIn buyer intent data can revolutionize your sales and marketing efforts, enabling you to prioritize high-intent accounts, personalize outreach, and align your teams for maximum impact.
By using powerful tools like Factors, you can gain a comprehensive view of buyer journeys and make data-driven decisions to boost pipeline velocity and drive revenue growth. Don't miss out on valuable opportunities – uncover the potential of LinkedIn buyer intent data and elevate your B2B sales strategy today.
.webp)
The Ultimate Guide to Marketing Analytics for SaaS Companies
Marketing analytics has become an integral part of any successful marketing strategy.
The industry is expected to grow at a CAGR of 14.8% between 2023 and 2028. Meanwhile, businesses of all sizes must spend the time to upgrade their in-house tech and employee skill-set to stay ahead of the curve.
But with the industry peppering buzzwords and jargon, marketing analytics can seem more complicated than it actually is.
In this guide, we’ll work to make the complex simpler. We’ll discuss what marketing analytics is, why it is necessary, which teams and people in a company should look into it, common limitations and pitfalls, and more. Let’s get started.
What is Marketing Analytics?
Marketing analytics refers to the analysis of data to gain insights into the performance of marketing campaigns and activities. It relies on the number of leads generated, conversion rates, customer acquisition cost (CAC), and customer lifetime value (LTV). Analyzing these metrics can help marketers and founders pave the way for marketing campaigns.
For instance, marketing analytics can help businesses understand which marketing channels or strategies are generating the most leads or conversions, and which ones may need improvement. It can also help identify trends and patterns in customer behavior, preferences, and buying habits, enabling businesses to make more informed decisions about their marketing efforts.
This is done through the use of tools like Google Analytics, Looker Studio, Factors.ai, and others for data visualization, statistical analysis, and predictive modeling.
The data is analyzed from various sources, such as website traffic, social media platforms, email campaigns, and Customer Relationship Management (CRM) systems.
The Benefits of Marketing Analytics
Marketing analytics offers multiple benefits in a B2B context. It helps businesses with interpreting data and making the most accurate and informed decisions. But that’s just one aspect of it. Let’s take a look at some other benefits of marketing analytics:
Improves Targeting
Marketing analytics enables you to identify the most relevant and receptive audience for your product or service. Then combining demographic, psychographic, and behavioral metrics, you can create a detailed customer persona that represents your ideal target audience. This data-driven approach allows you to tailor your messaging, offers, and content to resonate with these individuals, ultimately leading to higher conversion rates.
For instance, suppose your marketing analytics reveals that your most engaged customers are millennial entrepreneurs in the tech industry. In that case, you can fine-tune your marketing campaigns by focusing on the channels they frequent—such as LinkedIn and Twitter. Then begin creating content around industry trends, tips for startup growth, or case studies of successful tech entrepreneurs while subtly pitching your product or services.
Reduces Cost of Acquisition
The cost of acquiring a new customer can often exceed the expenses related to retaining an existing one. The average customer acquisition cost (CAC) including all SaaS industries is $704. Marketing analytics helps businesses identify the most cost-effective channels and methods for customer acquisition by studying metrics like cost-per-click, cost-per-lead, and return on ad spend.
.avif)
Let’s take an example here. Say your marketing analytics data shows that LinkedIn ads are generating a lower cost per acquisition (CPA) and higher conversion rate compared to Facebook ads. In this case, you can shift a larger portion of your ad budget to LinkedIn, driving down your overall cost of acquisition.
Improves the Customer Experience
86% of buyers are willing to pay more for brands that offer great customer experience. And SaaS companies doing $1 billion annually can expect to earn an additional $1 billion with just 3 years of investing in customer experience.
Analyzing customer feedback data can help SaaS marketers identify areas of improvement in their products or services. This leads to a better overall experience for customers. Marketing analytics can also help companies understand customer touchpoints, identify gaps in their communication strategies, and improve customer support.
Helps with Customer Retention
As time goes by, fewer and fewer customers stick around. This can be clearly demonstrated with the retention curve.
.avif)
However, spending money to retain existing customers is often more cost-effective than acquiring new ones.
Existing customers are 50% more likely to buy a product and spend 31% more on average than new customers. Marketing analytics can help businesses identify patterns and trends in customer behavior that may indicate potential churn or dissatisfaction.
For instance, if your marketing analytics reveals that customers who don't engage with your email campaigns are more likely to churn, you can modify your campaigns to launch a re-engagement strategy. You can target these at-risk customers with personalized content and offers to reignite their interest and loyalty. Sometimes, special pricing or preferential rates go a long way for customers.
Unveils Upselling Opportunities
Upselling is a powerful strategy in the B2B SaaS world. An average SaaS business generates 16% of its annual contract value (ACV) from upselling to customers. Companies doing $40 to $75 million annually can attribute twice as much revenue to upselling. With marketing analytics, you identify existing customers who are most likely to benefit from and be receptive to upgrading their current plans or purchasing additional products or services.
For instance, with marketing analytics data you may notice a few high-usage customers that could benefit from improved speed or better service offerings in your higher plans. Personalizing an upsell for those businesses and accounts can help you better improve your bottom lines in the long run.
What’s the Difference Between Product Analytics and Marketing Analytics?
Product analytics and marketing analytics are two important types of analytics that businesses need to use for making informed decisions. Unfortunately, these terms are used interchangeably and can cause confusion. Let’s look at the differences between product analytics and marketing analytics.
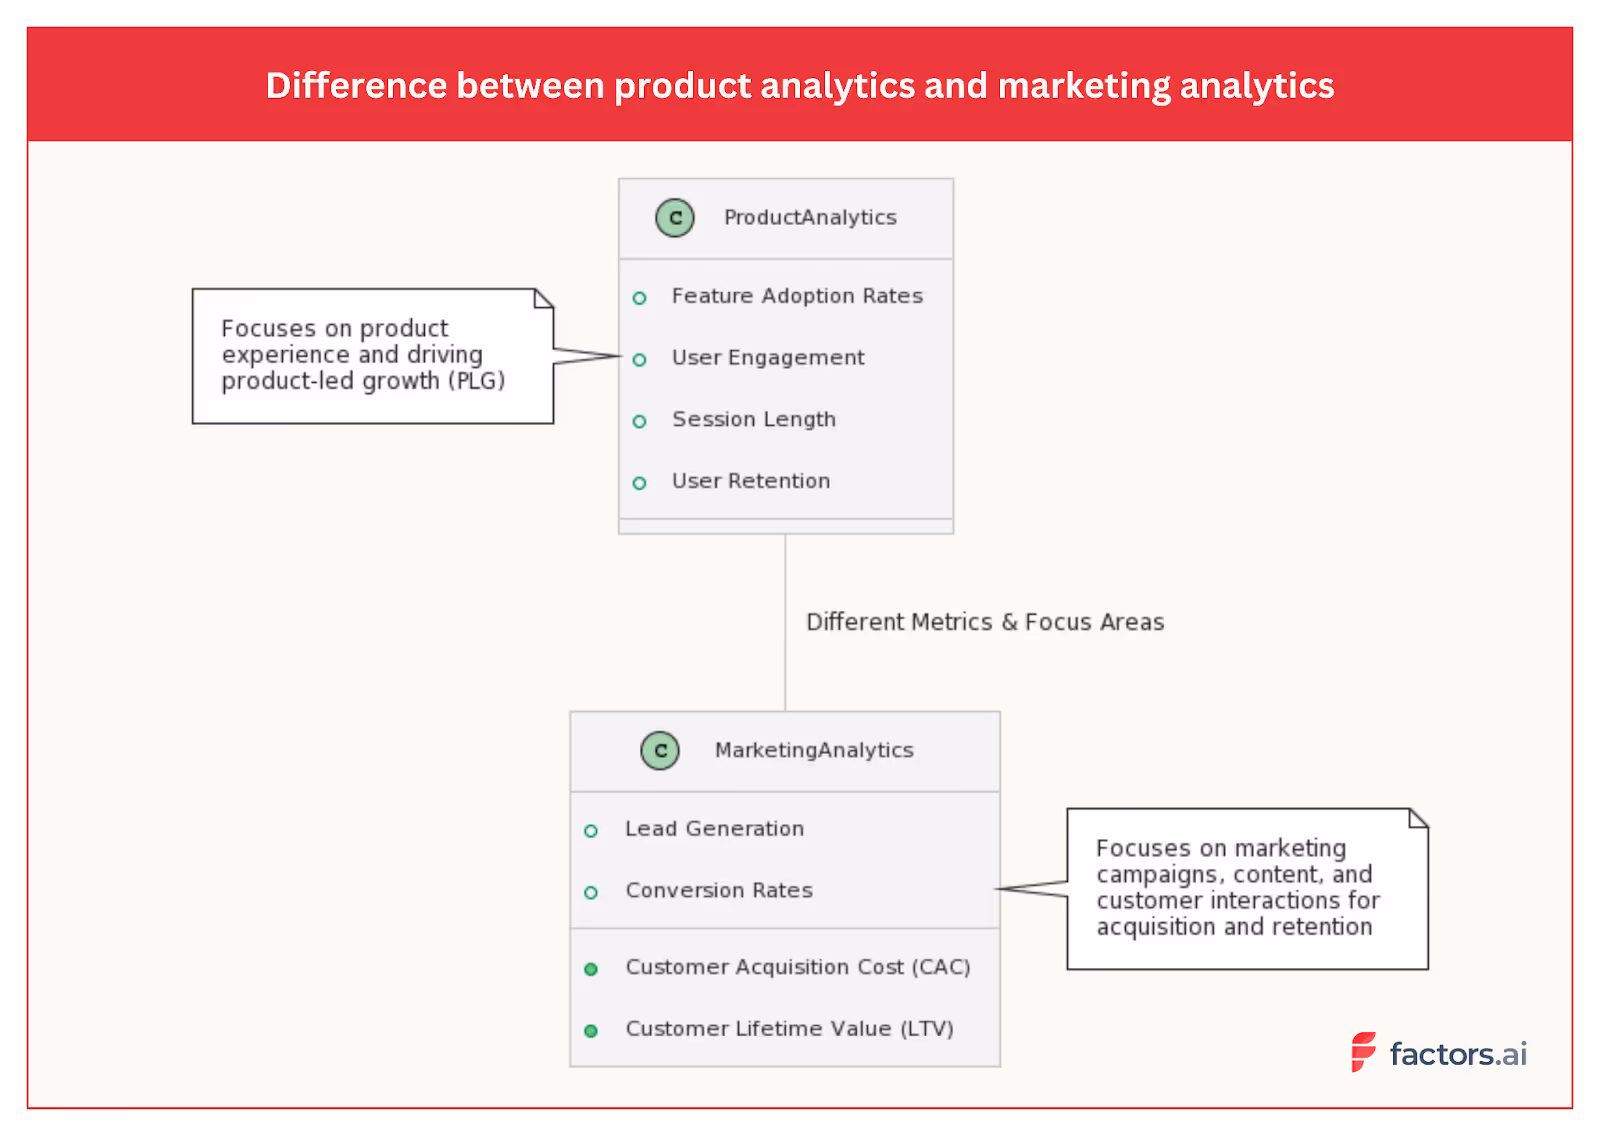
Product analytics analyzes the product experience. This type of analytics is generally performed on the data of users already using the product. It focuses on understanding how users interact with a product, including feature adoption, engagement, and product usage. With product analytics, the goal is to drive product-led growth by identifying areas for improvement, prioritizing feature development, and optimizing user experience.
Marketing analytics, on the other hand, helps identify how effective your marketing campaigns are. It helps identify how easily customers can find your product or website, what channels are working best for your marketing, and how many users are converting into paid users through the journey. Metrics for marketing analytics include lead generation, conversion rates, customer acquisition cost (CAC), and customer lifetime value (LTV).
For B2B businesses, both product and marketing analytics are important for driving growth. Product analytics helps businesses optimize product offerings and user experience. Marketing analytics helps companies improve their marketing strategies, target their audience more effectively, and allocate resources better.
Are Marketing Analytics and Marketing Attribution the Same Thing?
Marketing analytics and marketing attribution are complementary, yet distinct, disciplines within the realm of digital marketing. While both are essential for evaluating and optimizing marketing efforts, they serve different purposes and bring unique insights to the table. In this article, we will delve into the nuances of each concept, highlighting their primary focus, use cases, metrics, tools, and more.
Marketing Analytics vs Marketing Attribution - Quick Comparison
Marketing Analytics
Marketing analytics encompasses the measurement, management, and analysis of marketing performance data to optimize marketing effectiveness and maximize return on investment (ROI). Its primary focus is to provide a comprehensive understanding of marketing efforts, from the impact of individual campaigns to the overall health of a marketing strategy.
Use Cases:
- Identifying high-performing marketing channels
- Calculating customer acquisition cost (CAC) and customer lifetime value (LTV)
- Evaluating marketing ROI
- Tracking customer engagement and retention
- Analyzing data to inform marketing strategy and decision-making
Metrics:
Here are some of the marketing analytics metrics that you must keep a watch on.
- Customer acquisition cost (CAC): This metric helps you identify the cost of acquiring a new customer. It accounts for all the marketing and promotional costs involved in reaching and converting the customer.
- Lifetime value (LTV): Once a customer is converted, how long do they remain a paying customer? To find this value, note the length of time that each customer has stayed with your business and the total revenue generated by each. Then, multiply the average revenue per customer by the average length of time (lifespan). For example, if you have 100 customers paying, on average, $300 per month for 6 months, your customer lifetime value will be $300 x 6 = $1800.
- Churn Rate: How many of your customers are dropping off after they turn into paying customers? In fact, you can even count the churn rate for your free users as this can help you start digging deeper into the reasons why they don’t sign up for one of your paid plans.
- Retention Rate: This is the opposite of the churn rate. Here we check how many customers stick around for a specific period of time and more. For example, you may want to consider a customer as a retained one if they continue to pay for your SaaS for longer than 3 consecutive months.
- Return on investment: This metric is a must for businesses, no matter the industry. In the case of B2B SaaS businesses, this metric lets you understand how much money you are making based on the marketing spend.
Tools:
- Google Analytics: This is the most popular tool for marketing analytics—majorly because it’s free of cost. Google Analytics provides a wealth of information about traffic, user behavior, and much more.
- Factors: Factors is a powerful marketing analytics platform that specializes in B2B visitor identification, account analytics, and more. It integrates with your existing marketing stack and helps businesses reveal anonymous website visitors, decode customer journeys, and drive marketing ROI.
- Adobe Analytics: Adobe Analytics has a range of tools for tracking customer behavior, segmenting users, and identifying trends to improve overall marketing performance.
- Mixpanel: Mixpanel is more focused on product analytics. It enables businesses to monitor user interactions within web and mobile applications.
- Tableau: Tableau helps marketers transform raw marketing data into interactive visualizations that are easy to understand and share.
- HubSpot: HubSpot provides businesses with a holistic view of their performance and the tools necessary to optimize their strategies. From tracking website traffic and user behavior to measuring the effectiveness of email campaigns and social media outreach, it enables companies to make smarter marketing decisions and achieve better results.
Marketing Attribution
Marketing Attribution is the process of determining the value and impact of various touchpoints along the customer journey, helping marketers understand which channels, campaigns, and tactics are most effective in driving conversions and other desired outcomes. Attribution primarily focuses on assigning credit to specific marketing efforts that contribute to a conversion, sale, or other predefined goals.
Use Cases:
- Evaluating the effectiveness of individual marketing channels and campaigns
- Identifying the most influential touchpoints in the customer journey
- Optimizing marketing spend and resource allocation
- Informing marketing strategy and tactics based on attribution insights
- Tailoring messaging and targeting to maximize conversion potential
Attribution Models:
There are several attribution models available that help businesses assess the impact of their marketing efforts. Here is a breakdown of some of the most common types:
- Single-Touch Attribution: Assigns credit to a single touchpoint, either the first touch or the last touch. Common single-touch models include First-Touch Attribution, Last-Touch Attribution, and Last Non-Direct Touch Attribution.
- Multi-Touch Attribution: Distributes credit across multiple touchpoints throughout the customer journey. Examples of multi-touch models are Linear Attribution, U-Shaped Attribution, and Time Decay Attribution.
- Position-Based Attribution: This attribution model allocates credits based on the position of a touchpoint in the customer journey. For instance, it gives 40% of the credit to both the first and last ad interactions and corresponding keywords. The remaining 20% is spread across the other ad interactions on the user journey.
- Custom Attribution: Utilizes data and machine learning algorithms to create custom attribution models tailored to the unique needs of a specific business or industry. This approach allows for a more accurate representation of the customer journey and the impact of various marketing channels and tactics.
Tools:
- Factors: Factors is an AI-driven marketing attribution platform that provides detailed insights into the impact of each touchpoint on your customer journey. With its advanced modeling capabilities, Factors helps businesses make informed decisions on marketing spend and resource allocation.
- Adobe Marketo Measure: A part of the Adobe Marketo suite, Measure offers powerful marketing attribution and revenue planning features. By connecting marketing and sales data, Measure enables businesses to accurately attribute revenue to specific marketing efforts.
- Dreamdata: Dreamdata is a B2B revenue attribution platform that allows you to track and analyze the performance of your marketing efforts across all channels. By unifying data from various sources, Dreamdata provides a holistic view of your customer journey and helps optimize your marketing strategy.
- Ruler Analytics: Ruler Analytics is a marketing attribution platform that connects closed revenue data with the customer journey. It provides insights into which marketing channels are driving conversions, allowing businesses to optimize their efforts and improve ROI.
Who Should Be Thinking About Marketing Analytics at SaaS Companies?
Marketing analytics helps businesses measure the effectiveness of their marketing campaigns, optimize strategies, and make data-backed decisions to drive growth. But who should be thinking about marketing analytics at SaaS companies? Generally, it is CMOs, marketing executives, and CROs who stay updated with this information.
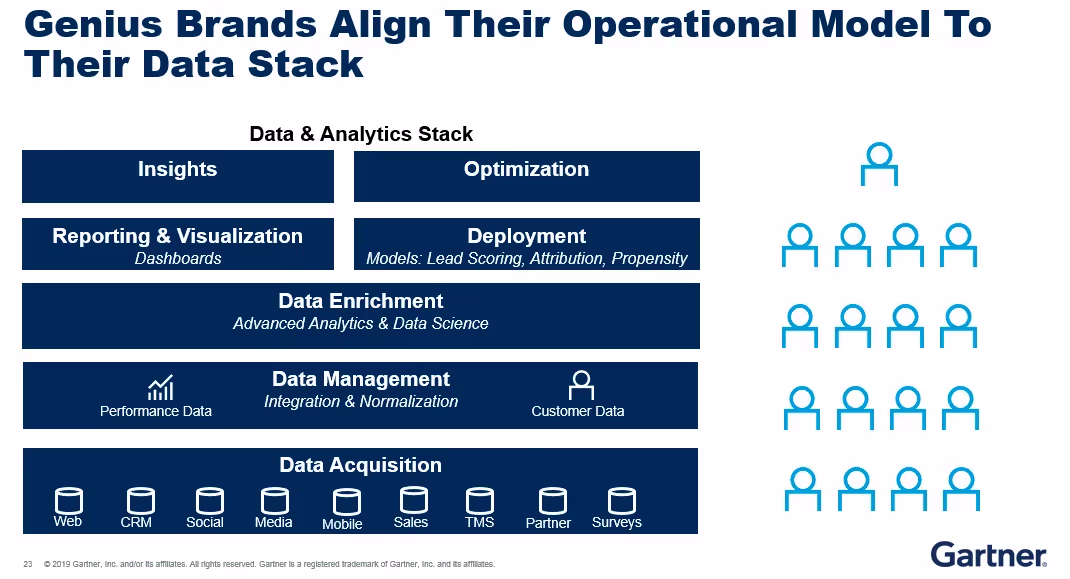
But, there's more to the story.
While it's essential for top-level executives and decision-makers to understand marketing metrics, it's not practical for everyone involved to monitor every single metric. Requiring the marketing team to constantly share their progress is counter-intuitive to progress as well. That’s where dashboards help teams stay in sync and keep tabs on what’s happening within marketing.
Dashboards offer a streamlined and efficient way to stay on top of the effectiveness of marketing strategies. They present data in a visually appealing and easy-to-understand format, allowing for quick insights and adjustments when needed. Here are a few benefits of dashboards.
- Enhanced collaboration: A well-designed dashboard helps teams across the board to stay updated with the changes in marketing. It also reduces the communication required to get data from individual teams as everyone can directly pull data from the dashboards. This increases transparency between teams.
- Increased accountability: Because of the increased transparency, teams, and individuals have accountability for the tasks assigned to them. This allows for greater productivity across teams and helps things progress faster.
- Customization: Dashboards are designed to be completely customizable. You do not need to showcase the same verbose data to everyone involved. Dashboards can help you summarize and visualize the required data based on who you want to demonstrate or showcase the data to.
If you want to implement a marketing dashboard within your company, we have an in-depth article on CMO dashboards. This will guide you through the process of designing a dashboard that serves the unique needs of your SaaS app development company.
Addressing Common Marketing Analytics Challenges
As businesses continue to evolve and adapt to the digital era, marketing analytics has become a vital aspect of marketing success. However, there are several common challenges that marketers face when trying to harness the power of data analysis.
Siloed data
The importance of seamless data integration cannot be overstated. With various marketing tools and platforms being used simultaneously, data can become fragmented and difficult to consolidate. Apart from that, customer data can get siloed at each of the touchpoints as well.
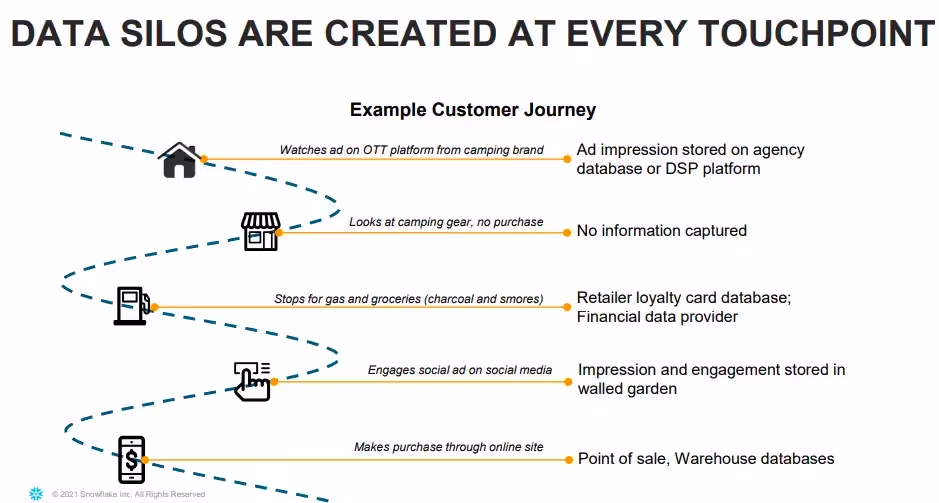
This siloed data can lead to an incomplete view of your marketing efforts and hinder your ability to make data-driven decisions. Marketing attribution tools like Factors combine data from multiple platforms and create a unified timeline that helps you view all the touchpoints of your customers in a single place.
Not knowing what to track
Identifying the right metrics to track is essential for marketing success. Focusing on the wrong metrics or not tracking them at all can lead to misguided decision-making. In fact, tracking a metric incorrectly can lead to worse outcomes than not tracking it at all.
For example, if you incorrectly attribute the success of your conversions to your paid ads, you may end up spending more on the wrong channel and wasting your marketing efforts.
Incorrect understanding of metrics
Metrics should be analyzed in tandem with other data to gain meaningful insights. For example, if the cost of acquisition in one quarter is dramatically lower than that of the previous two quarters, it could be the direct result of pausing a poor-performing marketing campaign.
But only looking at the CAC may lead to incorrect conclusions—CAC is going lower and thus your profits are going up.
Lack of automation and limited visualizations
Manual data analysis can be time-consuming, and error-prone, and ultimately limit your ability to make the most of it. Automating data collection and analysis processes is essential for maximizing efficiency and accuracy. Also, visualizing data through intuitive dashboards and reports enables easier understanding for everyone involved.
Factors address these common challenges by offering a powerful marketing analytics platform featuring seamless integrations, automation, and advanced visualization capabilities. Comprehensive marketing analytics and attribution solutions like Factors help overcome these challenges and ultimately achieve better results from your marketing efforts.
Top Marketing Analytics Use Cases for SaaS Companies
Marketing analytics can provide valuable insights and drive growth in various aspects of a SaaS company’s marketing efforts. The three key use cases for marketing analytics include acquisition and conversion tracking, campaign performance analysis, and customer segmentation and personalization. Here’s what each of them means:
1. Acquisition and Conversion Tracking
Acquisition and conversion tracking allows SaaS businesses to monitor how efficiently their marketing efforts are attracting and converting customers. For example, a SaaS company offering project management software might use acquisition and conversion tracking to analyze the sources of their website traffic. This could include social media platforms, search engines, and email marketing campaigns. They can then determine which channels are most effective in driving new users to sign up for their software. If the analysis reveals that content and SEO are generating a high number of sign-ups, the company can allocate more resources to that platform to capitalize on its success.
2. Campaign Performance Analysis
Campaign performance analysis evaluates the effectiveness of marketing campaigns and helps improve the campaigns through data. This involves monitoring click-through rates, conversion rates, and cost per acquisition, to determine the overall success of each campaign.
Imagine a SaaS company specializing in human resources software launches a Google Ads campaign targeting HR managers.
Campaign performance analysis can be used here to evaluate the effectiveness of the ads. If the data indicates that one type of ad is outperforming the others, the company can optimize the campaign by allocating a higher budget to the more successful ad. This constant analysis and improvement can lead to more efficient marketing campaigns and higher ROI.
3. Customer Segmentation and Personalization
Customer segmentation and personalization involve grouping customers based on shared characteristics and tailoring marketing messages and offers to meet their specific needs.
For instance, a SaaS company that provides email marketing software could segment its customers into groups based on their industry, company size, or the frequency of their email campaigns.
They could then create content and offers targeted at each segment. A small e-commerce business might receive tips on how to maximize its email open rates during the holiday season. A large enterprise client, on the other hand, might receive a case study showcasing how their email marketing success has successfully scaled email campaigns for similar organizations.
Grow your business with streamlined marketing analytics
Marketing analytics is a powerful tool for driving growth and improving marketing performance in B2B companies. Focusing on key use cases, such as acquisition and conversion tracking, campaign performance analysis, and customer segmentation and personalization, will enable you to make data-driven decisions and optimize your marketing efforts.
As a result, you'll attract more customers, improve customer satisfaction, and ultimately, increase your company's revenue. Don't miss out on the potential that marketing analytics can unlock for your SaaS company—start harnessing the power of data with Factors.ai today.
FAQs
Why is marketing analytics important?
Marketing analytics makes marketing effective. It offers deep insights into the preferences and behavior of your customers. It allows you to shape the marketing campaigns in accordance with your customer’s expectations and helps you make data-backed decisions rather than relying on intuition and experience.
What are the three types of analytics that can be used in marketing?
Descriptive analytics, predictive analytics, and prescriptive analytics.
- Descriptive analytics analyzes historical data to understand past performance.
- Predictive analytics uses data and statistical algorithms to forecast future outcomes
- Prescriptive analytics provides recommendations on how to optimize marketing efforts based on data-driven insights.

