

Good Reads
Fix pipeline pains. Solve GTM puzzles. Read strategic brain dump.
Written for marketers who want real solutions to a leaking pipeline (and their dark circles).
Want to read more from us?


I’m looking for…

Generative AI vs LLM: Understanding the Core Difference
Understand generative AI vs LLM, real differences, use cases, and how B2B marketers use both for growth, reporting, and pipeline.
.avif)
TL;DR
- Generative AI is the broad category of AI systems that create new content across text, images, audio, video, and code. LLMs are one specific type of generative AI, focused primarily on language.
- The confusion between generative AI and LLMs exists because ChatGPT became the face of both concepts at the same time, while they do overlap, but they aren't identical.
- For B2B marketing teams, LLMs handle the intelligence layer: campaign summaries, email drafts, intent signal analysis, and reporting. Broader generative AI tools handle the creative layer: ad visuals, video explainers, and landing page mockups.
- Mid-market B2B teams often benefit faster from these tools than enterprises because they can move without months of procurement and governance review.
You know that one person who calls every sneaker “Nike”?
Even if it’s Adidas. Or Puma. Or something completely different. At some point, you stop correcting them, but also… you know the difference matters.
That’s basically what’s happening with AI in most B2B teams right now.
“Generative AI.”
“LLMs.”
“AI agents.”
“Automation.”
All getting lumped together like they’re the same thing, when they’re actually doing very different jobs under the hood. And here’s where it starts to pinch a little.
Because when teams blur the line between generative AI vs LLM, they misdesign systems. They expect a chatbot to behave like a workflow engine… a content generator to understand pipeline context… and buy tools thinking they’re getting intelligence, when what they’re really getting is output.
It’s like hiring a brilliant copywriter and then being surprised they can’t run your CRM (I mean, hello?!)
The problem is not the tech actually… it’s the mental model.
Most teams are trying to plug “AI” into their stack without deciding what role it’s supposed to play. Is it there to generate? To reason? To act? To orchestrate? Those are different layers, and collapsing them into one idea is how you end up with systems that look good in a demo but fall apart in real workflows.
So let’s get to it in a way that actually helps.
Generative AI vs LLM: the one clear answer you need first
I'll start with the answer, because you shouldn't have to scroll through six paragraphs of context before reaching the point.
- Generative AI is the broader category. It refers to any AI system designed to create new outputs from prompts or instructions. Those outputs can be text, images, audio, video, code, 3D assets, or synthetic data. If an AI system is producing something that didn't exist before, it falls under the generative AI umbrella.
- LLMs, or large language models, are one specific type of generative AI. They're built to understand and generate human language. Think writing, summarizing, classifying, reasoning, and conversation. Every LLM is a form of generative AI, but not every generative AI system is an LLM.
Here's the analogy that might help a little more… generative AI is the umbrella. LLMs are one very well-known section standing under it. Image generators, music tools, and video creation systems are other sections under that same umbrella, each handling a different type of output.
The reason confusion runs so deep is this: ChatGPT became the public face of AI practically overnight, and it happens to be both an LLM and a generative AI product. People started using "GenAI" and "LLM" as synonyms because their first encounter with either concept was the same product. The terms overlap in that specific case, but they aren't identical in meaning. Understanding that distinction changes how you evaluate tools, allocate budget, and think about what AI can actually do for your team beyond writing blog posts.
What is generative AI, really?
Generative AI describes a class of AI systems that produce net-new outputs from prompts, instructions, or input data. The keyword is "generative." These systems don't just analyze existing information or categorize it into buckets. They create something new based on patterns they've learned during training.
What makes the category interesting is its range. Generative AI spans multiple modalities, which is a fancy way of saying it works across many different types of output. Text is the modality most people think of first, but it's only one piece of the picture. Image generation, audio synthesis, video creation, code generation, and even 3D asset production all fall under the generative AI umbrella. Each modality typically relies on different underlying architectures and training approaches.
To make this concrete, here are a few examples across modalities. ChatGPT and Claude generate text. DALL·E and Midjourney generate images. Sora and Runway produce video content. Tools like Suno generate music. GitHub Copilot generates code. Each of these is a generative AI system, but they use very different technical foundations to do their work.
If you look under the hood,, these systems rely on different model architectures depending on what they're producing. Text generation typically uses transformer-based models (which is the architecture behind LLMs). Image generation often uses diffusion models, which learn to create images by gradually refining noise into coherent visuals. Earlier image tools used GANs, or generative adversarial networks, where two neural networks essentially compete with each other to produce realistic outputs. The architecture varies, but the principle stays constant: the system generates something new rather than simply retrieving or classifying existing information.
This is where the Gen AI vs LLM distinction becomes practically useful. When someone on your team says "we need generative AI," the right follow-up question is always about the output type. Do you need generated text? Generated images? Generated video? The answer determines which subset of generative AI you actually need, and that changes the tooling conversation entirely. A team looking for ad creative generation needs a different tool (and budget) than a team looking for automated campaign reporting summaries.
What is an LLM?
A large language model is an AI model trained on enormous text datasets to understand and generate human language. The "large" in LLM refers to both the size of the training data and the number of parameters (adjustable values) within the model. These models learn the statistical relationships between words, phrases, and concepts at a scale that allows them to produce remarkably fluent, contextual language output.
What LLMs are genuinely good at is a longer list than most people expect.
- The obvious capability is writing, whether that's drafting emails, generating blog outlines, or producing ad copy variants.
- LLMs also excel at summarization, pulling key points from lengthy documents or transcripts.
- They handle information extraction well, identifying specific data points within unstructured text.
- Can assist with coding, suggest SQL queries, classify text into categories, answer questions based on provided context, and reason through multi-step problems involving language.
That versatility is exactly why they've become the default AI tool for so many knowledge workers.
The world of LLMs has also grown immensely, and the names worth knowing have shifted even in the past year. The GPT family from OpenAI remains the most widely recognized.
- Anthropic's Claude has earned a strong reputation for nuanced reasoning and longer context handling.
- Google's Gemini has pushed into multimodal territory, handling both text and visual inputs.
- Meta's Llama models have become the go-to choice for teams that want open-source flexibility.
Each model has its own strengths, but they all share the core LLM architecture: transformer-based, trained on massive text corpora, designed to work with language.
One important nuance that keeps blurring the boundaries: modern LLMs are increasingly multimodal. GPT-4 and Gemini can process images alongside text. Some models can generate or interpret audio. This means the clean line between "LLMs handle language" and "other generative AI handles everything else" is getting fuzzier with every major model release. For practical purposes, though, the core strength of LLMs remains language. They're at their best when the input is text, the output is text, and the task involves understanding, reasoning, or generating language.
The major difference between Generative AI and LLMs
The difference between LLM and generative AI is essentially a category-versus-member relationship. Generative AI is the broad field. LLMs are one specific type within it. Comparing them directly is a bit like comparing "vehicles" to "sedans." Every sedan is a vehicle, but not every vehicle is a sedan. Every LLM is generative AI, but not every generative AI system is an LLM.
Here's a comparison table that lays out the practical distinctions:
The table is useful for quick reference, but true understanding comes from considering specific scenarios. If someone on your team asks for a logo concept or a set of ad visuals for a LinkedIn campaign, an image-generation model (a broader generative AI model) is the better fit. If someone needs a pipeline analysis summary or a first draft of a nurture email sequence, an LLM is usually the stronger choice. The right tool depends on the output type and the task, not on which term sounds more impressive in a strategy deck.
Where things get a tad confusing is in multi-step workflows… a content repurposing workflow might use an LLM to summarize a webinar transcript, then pass that summary to an image generation tool to create social media visuals. Both are generative AI. Only one is an LLM. The workflow uses both, and that's increasingly how real teams operate. The distinction between LLM vs generative AI isn't about choosing one. It's about knowing which component does what within a larger process.
One more thing worth noting. When people casually debate AI vs. LLM, they're usually conflating three nested categories. AI is the broadest term, covering everything from rule-based systems to machine learning to deep learning. Generative AI is a subset of AI. LLMs are a subset of generative AI. Keeping those layers straight prevents a lot of confused conversations in planning meetings.
Generative AI vs LLM for B2B marketing teams
Now let's get specific about where this distinction actually shows up in your day-to-day workflows. Because for most B2B marketing teams, the question isn't "what's the theoretical difference?" It's "which tool do I reach for when I have a specific job to do?"
Where LLMs win for B2B teams
LLMs shine when the task involves language, analysis, or reasoning over text. For B2B marketers, that covers a surprisingly large portion of the workload that eats up your week.
- Campaign summaries
Instead of manually pulling insights from ad platform dashboards and writing a narrative for your leadership team, an LLM connected to your data can generate a first draft that highlights spend, performance trends, and anomalies. You still review and refine it, but the initial synthesis goes from 90 minutes to 10.
- Ad copy variants
Feed an LLM your value proposition, target persona, and a few constraints, and you'll get a dozen variations to test. The quality of those variants depends heavily on how good your prompt and context are, but the speed advantage is undeniable compared to writing each version from scratch.
- SDR email drafts (speed advantage)
When your sales development team needs personalized outreach for a list of accounts, an LLM can generate first drafts tailored to each company's industry, size, and likely pain points. The SDR still needs to review and edit, but the starting point is dramatically better than a blank email.
- CRM note summarisation
Sales reps leave notes in varying formats and levels of detail. An LLM can synthesize weeks of scattered CRM notes into a coherent account summary before a quarterly review or handoff conversation. That alone can save hours of prep time across a team.
- Attribution explanation
Most attribution data lives in dashboards that show numbers but don't explain them. An LLM can take that data and produce a plain-English narrative: "LinkedIn campaigns contributed to 34% of pipeline this quarter, with the strongest influence coming from the product demo ads targeting mid-market accounts." That translation from data to story is exactly what LLMs do well.
- Website visitor intent summaries
When your analytics platform identifies anonymous companies visiting specific pages, an LLM can cluster those signals and produce a summary: "These 12 accounts are showing research-stage behavior around your integration features." That kind of synthesis turns raw data into something your demand gen team can actually act on.
Where broader generative AI wins
Broader generative AI tools earn their place when the output isn't text. For B2B teams, that typically means creative production tasks that used to require a designer, a video editor, or a significant agency budget.
Ad creatives are the most common entry point. Image generation tools can produce visual concepts for LinkedIn carousel ads, display banners, and social media posts. The quality has improved enough that many mid-market teams use AI-generated visuals for A/B testing before investing in polished designs for the winners.
Video explainers have become remarkably accessible. Tools that generate short video content from scripts and visual prompts can produce product overview videos, feature announcement clips, and even short customer story summaries. The output isn't replacing a full production team, but it's filling a gap that many B2B companies simply left empty before because video was too expensive or slow to produce.
Product demo voiceovers, sales deck visuals, and landing page mockups all follow a similar pattern. Generative AI tools handle the first draft or the initial concept, which means your creative team spends less time starting from zero and more time refining and polishing.
Webinar snippets are a great example of how LLMs and broader generative AI work together. An LLM transcribes and summarises the webinar. A video generation tool cuts highlight clips. An image tool creates promotional visuals. The LLM drafts social copy to accompany each clip. That's a multi-tool workflow where both categories of generative AI contribute to the end result.
The honest take on what B2B teams actually need
Here's the thing I keep coming back to when teams ask about this comparison. Most B2B teams don't need "AI" in some grand, transformative sense. They need fewer bottlenecks. They need the campaign summary to not take a full morning. They need the email sequence to not sit in a backlog for two weeks. They need the webinar recap to not require three meetings to plan.
LLMs and broader generative AI tools both serve that goal, just for different types of output. The teams getting real value aren't debating generative AI LLM definitions in Slack threads. They're identifying their slowest workflows and testing whether an AI tool can cut the turnaround time in half. That's a much more productive starting point than any theoretical comparison.
How does Factors.ai use LLMs and Generative AI thinking?
I want to ground this conversation in something practical, because theoretical distinctions only matter if they change what you actually do. Factors.ai sits at the intersection of revenue data and marketing intelligence, which means both LLMs and broader generative AI thinking show up in how the platform helps B2B teams work.
- Revenue reporting that answers questions in plain English
One of the most frustrating parts of B2B marketing is the gap between having data and understanding data. Most teams have plenty of numbers. They have pipeline figures, campaign spend data, attribution percentages, and conversion rates spread across multiple platforms. What they don't have is a fast way to turn those numbers into answers.
An LLM connected to CRM and ad platform data can bridge that gap. Instead of building a custom dashboard view to answer "which LinkedIn campaigns influenced pipeline last month," you can ask the question in natural language and get a synthesized response. The same goes for questions like "which accounts are surging in engagement this quarter" or "where are we overspending relative to pipeline contribution." The LLM doesn't replace the data. It makes the data conversational and accessible to people who don't want to build pivot tables at 4pm on a Thursday.
That shift matters more than it might seem on the surface. When reporting becomes something you can query rather than something you have to build, the frequency of insight goes up. Teams start asking better questions because the cost of asking is lower.
- Demand gen acceleration through intent signal analysis
Demand generation in B2B involves a lot of signal interpretation. Which accounts are showing buying intent? What stage of the journey are they in? What should the next outreach step be? These questions require synthesizing data from multiple sources, and that synthesis is exactly where LLMs add value.
An LLM can summarize intent signals across website visits, content downloads, ad engagement, and third-party data to produce account-level intelligence. It can cluster accounts by likely buying stage, separating early-research accounts from those showing evaluation behavior. It can even recommend next-best actions based on what's worked for similar accounts in the past.
That said, none of this can replace a demand gen strategist's judgment. What it does is compress the time between "we have signals" and "we have a plan." The strategist still decides what to do, but they're working from a synthesized brief instead of raw data exports.
- The content engine: one asset becomes many
This is where LLMs and generative AI thinking converge most naturally. Every B2B team has a content multiplication problem. You produce a webinar, and it should become a blog post, a set of LinkedIn posts, ad copy, an email nurture sequence, and a few sales enablement snippets. In practice, that repurposing often stalls because someone has to sit down and manually create each derivative asset.
A generative AI workflow can turn that one webinar into all of those assets. The LLM handles the text-based outputs: blog draft, social copy, email drafts, and enablement summaries. Image and video tools handle the visual outputs: social graphics, short video clips, and presentation visuals. The quality still needs human review and editing, but the zero-to-first-draft stage that used to take days gets compressed into hours.
The real advantage in all of this isn't the AI output itself. Honestly, first drafts from AI tools are not really publish-ready without significant editing. The advantage is operational speed with context. When your AI tools are connected to your actual revenue data, campaign performance, and account intelligence, the output starts in a much better place than a generic prompt ever could. Context turns a mediocre AI draft into a useful starting point, and that's the difference between a tool you actually adopt and one that sits unused after the first month of excitement fades.
Common myths B2B teams still believe about generative AI and LLMs
I've had enough conversations with marketing leaders to know there's a set of misconceptions that keeps circulating, regardless of how much the technology evolves. These myths aren't harmless. They shape buying decisions, set wrong expectations, and sometimes prevent teams from getting value they could have accessed months earlier.
Myth 1: LLM and generative AI are the same thing
This is the myth this entire article exists to address, so I won't belabor it. LLMs are a subset of generative AI, not a synonym for it. The confusion comes from ChatGPT being the most visible example of both categories simultaneously. Knowing the difference matters because it changes which tools you evaluate and what you expect them to produce. A team that thinks "generative AI" only means text generation will miss opportunities in creative production, video, and design workflows. A team that thinks "LLM" means any AI that creates things will be confused when their text model can't generate the LinkedIn ad banner they were hoping for.
Myth 2: LLMs are going to replace marketers
This one has been floating around since GPT-3, and it still generates anxiety in every team I talk to. The reality is more nuanced and, frankly, less dramatic. LLMs are exceptionally good at removing administrative work. Drafting, summarising, formatting, synthesising data into narratives, producing first versions of repetitive content. These tasks consume a shocking amount of a marketer's week, and LLMs can compress them significantly.
What LLMs can't do is the strategic work. They can't decide which market segment to prioritise next quarter. They can't sense that a competitor's positioning shift requires a messaging overhaul. They can't read the room in a pipeline review meeting and adjust the narrative on the fly. Strategy, judgment, and relationship intelligence remain firmly human skills. The marketers who thrive alongside LLMs will be those who let the tools handle the production layer while they focus on the decision layer.
Myth 3: Bigger model means better ROI
There's an understandable assumption that the most powerful, most parameter-heavy model must be the best choice for any task. In practice, workflow design matters far more than raw model size for most B2B marketing applications. A smaller, faster model with good prompts, proper context, and a well-designed workflow will often outperform a massive model used with generic prompts and no integration into your actual data.
I've seen teams spend months evaluating the "best" LLM when the bottleneck was never the model. It was the lack of a clear workflow connecting the model to their CRM data, their campaign assets, and their reporting cadence. The model is the engine, but without the chassis, the wheels and someone who knows where to drive, the engine just revs in place.
Myth 4: Only enterprises can benefit from generative AI
This one actively frustrates me, because I've watched mid-market B2B teams move faster with these tools than many enterprise organisations. The reason is simple: mid-market teams have shorter procurement cycles, fewer layers of approval, and less legacy infrastructure to integrate around. An enterprise might spend six months on an AI governance review before anyone touches a tool. A 200-person B2B company can test an LLM workflow in a week and have it running in production by the end of the month.
The ROI argument actually favours smaller teams in many cases. When you have a lean marketing team wearing multiple hats, the time saved by automating reporting summaries, content drafts, and data synthesis directly translates to capacity for strategic work. That trade-off is more impactful per person on a small team than on a 50-person marketing department where the tasks were already distributed across specialists.
Which one should your business invest in?
Instead of giving a vague "it depends," here's a decision framework you can actually use in your next planning conversation.
- If your primary pain point is writing, reporting, or research, lean into LLM-led workflows. This covers campaign performance summaries, SDR email generation, CRM data synthesis, content drafting, and any task where the input and output are primarily language. The tools are mature, the integration options are growing, and the time savings are measurable within weeks.
- If your primary pain point is creative production, invest in broader generative AI tools. This covers ad visual creation, video content, presentation design, landing page mockups, and any workflow where the output is visual or multimedia. These tools are improving rapidly, and they're closing the gap between "AI-generated draft" and "actually usable creative asset" faster than most people expected.
- If your primary pain point is growth efficiency, use both. And honestly, this is where most B2B teams land once they've spent a few months experimenting. The teams generating the most value aren't treating this as a binary choice. They're building workflows where LLMs handle the intelligence and language layer while broader generative AI tools handle the creative and multimedia layer. A single webinar becomes a full content package. A quarterly review becomes a data-enriched narrative. A target account list becomes a personalized outreach sequence with matching visuals.
The decision is about identifying your highest-friction workflows and matching the right tool type to each one. Start with the workflow that costs your team the most time relative to its value, test an AI tool against it, measure the improvement, and expand from there. That's more productive than any grand AI strategy document.
One more thought on this. The smartest companies heading into 2026 aren't spending their energy debating LLM vs generative ai as an either-or question. They're combining both into workflows tied directly to revenue outcomes. Pipeline influenced, deals accelerated, content velocity increased, reporting cycles shortened. When you frame AI investment in terms of revenue impact rather than technology categories, the distinction between generative AI and LLMs becomes a practical architecture decision rather than a philosophical debate.
In a nutshell
Here's what this all comes down to, in terms you can actually take into your next team conversation.
Generative AI is the broad category of AI systems that create new content. It spans text, images, audio, video, code, and more. LLMs are a specific, language-focused subset within that category. They're built for writing, summarising, reasoning, and any task that involves understanding or generating text. Every LLM is generative AI, but most generative AI systems aren't LLMs.
For B2B marketing teams, LLMs cover the intelligence layer: campaign reporting, email drafts, intent signal summaries, CRM synthesis, and data-to-narrative translation. Broader generative AI tools cover the creative layer: ad visuals, video content, presentation mockups, and multimedia production. The most effective teams aren't choosing between these categories. They're building workflows that use both, connecting language models to their revenue data while using creative AI tools to scale their content production.
The practical starting point is to audit your slowest, most repetitive workflows. Identify whether each one is primarily a language task or a creative production task. Match the right tool type to each. Test it for two weeks, measure time saved and output quality, and expand from there. Skip the grand AI strategy. Start with one workflow that's costing you time, fix it, and let the results build momentum for everything that follows.
Frequently asked questions about generative AI vs LLM
Q1. Is ChatGPT generative AI or an LLM?
It's both. ChatGPT uses a large language model architecture (specifically, the GPT family of models) as its core technology. At the same time, it sits firmly within the generative AI category because it creates new text outputs from prompts. The reason people often confuse the two terms is that ChatGPT was their first encounter with both concepts simultaneously.
Q2. What is the main difference between LLM and generative AI?
An LLM is a specific type of AI model focused on language tasks: writing, summarization, reasoning, classification, and conversation. Generative AI is the broader category that includes LLMs alongside image generators, video tools, music creation systems, and any other AI that produces new content. The relationship is a subset one. All LLMs are generative AI, but generative AI includes many systems that aren't LLMs.
Q3. Is generative AI better than an LLM?
This isn't a useful comparison because they aren't competing alternatives. Generative AI is a category, and LLM is one model type within that category. Asking whether generative AI is "better" than an LLM is like asking whether "vehicles" are better than "trucks." The answer depends entirely on your specific task. If you need text-based output, an LLM is your tool. If you need image, video, or audio output, you'll reach for a different type of generative AI.
Q4. Can B2B marketers use both LLMs and generative AI?
Absolutely, and most effective teams already do. LLMs handle the intelligence and writing tasks: drafting content, summarizing campaign data, generating email sequences, and synthesizing account signals. Broader generative AI tools handle creative assets: ad visuals, video clips, presentation graphics, and landing page mockups. A typical workflow might use an LLM to summarize a webinar transcript and then use image and video tools to create promotional assets from that summary.
Q5. Is AI vs LLM the same comparison as generative AI vs LLM?
No, these are different comparisons because AI, generative AI, and LLM exist at three different levels. AI is the broadest category, encompassing everything from simple rule-based automation to machine learning to deep learning. Generative AI is a subset of AI, specifically the portion that creates new content. LLMs are a subset of generative AI, specifically focused on language. When someone asks about AI vs. LLM, they're comparing a massive field to one specific branch within it, which makes the comparison far wider than generative AI vs LLM.

Clay for GTM engineering: how modern revenue teams build scalable growth systems
Learn how Clay powers GTM engineering with automations, enrichment, Apollo workflows, outbound systems, and scalable B2B growth playbooks.
TL;DR
- Clay is a workflow and enrichment orchestration platform that lets GTM teams build automated outbound, lead routing, research, and personalization systems without stitching together a dozen point solutions.i
- The clay GTM engineer role is emerging as one of the most valuable positions in modern revenue teams, combining ops thinking, marketing instincts, and systems architecture.
- Using Apollo inside Clay is one of the most common setups in B2B, where Apollo acts as the contact database and sequencing layer while Clay handles orchestration and enrichment logic.
- Clay's real ROI shows up in pipeline velocity, hours saved, and data coverage, not in vanity metrics like records enriched.
- Pairing Clay with intent and attribution platforms like Factors.ai creates signal-to-action systems where data actually triggers pipeline, not just dashboards.
When I started thinking of this article… it made me think of what really goes on in B2B… the chaos looks a bit like that meme of Charlie Kelly with red strings going everywhere (added below)… except the strings are Zapier automations, enrichment tools, and half-documented workflows named “final_v7_really_final.”

Your outbound engine technically runs… but in the same way, a group project somehow works when one overachiever carries it. Under the hood, it’s held together by vibes, Slack archaeology, and that one RevOps person who knows which zap not to touch. The second someone says, “Hey, can we layer in job-change signals?” It feels like asking Tony Stark to rebuild the suit mid-flight.
That exact moment, when you realize your GTM system is less a “scalable machine” and more a “Jenga tower after three espresso shots,” is why Clay has blown up as a category. Clay didn’t just show up as another data vendor with slightly better coverage. It basically said, “What if you could actually build your go-to-market system like a product instead of babysitting it like a fragile pet?”
This piece breaks down what Clay actually does for GTM teams, the workflows that are worth your time, how it plays with tools like Apollo.io, and most importantly, how to tell if any of this is driving real pipeline or just giving your dashboards main-character energy.
What is Clay for GTM engineering?
Let’s start with the basics, because ‘GTM engineering’ still means different things depending on who you ask.
By definition, GTM engineering is the practice of building systems that help sales, marketing, and RevOps scale revenue without adding headcount linearly. It’s the discipline of turning manual, repetitive go-to-market work into automated, repeatable infrastructure. Think of it as the engineering layer underneath your outbound, enrichment, routing, and personalization motions. GTM engineering teams are structured to build and optimize revenue-generating systems, acting as the connective tissue between product, sales, and marketing to ensure seamless data flow and transform operations into growth engines.
Clay is one of the breakout platforms in this space, and it’s worth understanding why. At its core, Clay is a workflow, enrichment, and signal orchestration platform. GTM teams use it to build automated systems for outbound prospecting, data enrichment, lead routing, account research, and personalized messaging. But calling it “an enrichment tool” undersells what it actually does. GTM infrastructure is built to be modular and vendor-agnostic, enabling teams to iterate quickly without being locked into a single process.
What makes Clay different from the dozen other tools in the space is that it combines several capabilities that used to require separate products. You get access to multiple data providers in a single layer, so you aren’t switching between ZoomInfo, Clearbit, and three other tabs. You get AI-powered workflows that can run research, generate copy, and make decisions. You get spreadsheet-like logic that makes it accessible to people who aren’t developers. And you get CRM syncing, trigger-based automation, and personalization at scale, all within the same interface.
The result is that Clay gives teams infrastructure, not just another prospecting tool. It’s the difference between buying a hammer and building a workshop. When people talk about clay GTM automation software and growth engineering, they’re really talking about this shift from point solutions to composable systems. GTM engineering has evolved due to the commoditization of sales tactics and the rise of AI, which has enabled no-code automation and rapid testing of targeted approaches. Teams that use Clay well don’t just send more emails. They build machines that identify the right accounts, enrich them with the right data, personalize the right message, and route the right leads to the right reps, all without someone manually copying data between four browser tabs.
That’s the promise, anyway. The reality depends a lot on how you set it up, which is exactly what the rest of this article covers.
Why has Clay become a GTM engineering favorite?
Most articles about Clay say something like, "Clay is great for outbound." That's true, but it's a bit like saying a smartphone is great for making calls. Technically correct, deeply incomplete.
The real reason Clay won the hearts of GTM teams has less to do with outbound specifically and more to do with three structural shifts in how revenue teams operate.
- It compresses tool sprawl
Before Clay, a typical outbound and enrichment stack looked something like this: Apollo for contact data, ZoomInfo for firmographics, PhantomBuster for scraping, Zapier for connecting everything, Google Sheets for staging data, a handful of GPT prompts for personalization, and two or three enrichment vendors for email verification and technographic data. Every tool had its own login, its own pricing model, its own quirks. And the person who set it all up was usually the only one who understood how it worked.
Clay centralizes much of that motion into a single platform. You still might use some of those tools alongside Clay, but the orchestration, the logic, the data flow, it all lives in one place. That compression alone saves hours every week and makes systems dramatically easier to maintain. When someone leaves the team, the workflows don't leave with them.
- It turns ops into experiments
Here's a subtler point that most Clay articles miss. Traditional RevOps changes take weeks. You want to add a new enrichment step to your lead routing? That's a ticket to the ops team, a sprint planning discussion, a Salesforce admin's involvement, and maybe a two-week turnaround. By the time it ships, the campaign window might be closed.
Clay flips that timeline. A competent operator can build, test, and launch a new workflow in hours. That speed transforms how teams think about growth experiments. Instead of committing to one outbound strategy for the quarter, you can run five variations in a month and see which ones actually generate pipeline. The tool rewards iteration, not just planning.
- It rewards technical marketers
There's a new archetype emerging in B2B teams: the operator who understands APIs, conditional logic, enrichment layers, prompt engineering, and lead routing, but who also thinks like a marketer. They aren't pure engineers, and they aren't pure marketers. They're somewhere in between.
Clay became the playground for that archetype. Its interface is approachable enough that you don't need to write code, but powerful enough that someone with systems thinking can build genuinely sophisticated workflows. The rise of Clay tracks almost perfectly with the rise of this hybrid operator role, and that's not a coincidence. The tool and the role co-evolved.
If you've ever worked with someone who could look at a messy spreadsheet and see an automated system waiting to be built, you know the type. Clay gives those people superpowers.
What does a Clay GTM engineer actually do?
The clay GTM engineer role is one of those positions that didn't exist three years ago and is now showing up in job descriptions across Series B through public companies. But the title can be misleading, because it sounds narrower than it actually is.
A Clay GTM engineer doesn't just "use Clay." They own the systems that make revenue operations scalable. The tool happens to be Clay, but the job is really about designing, building, and maintaining the automated infrastructure that sales, marketing, and RevOps depend on.
Here's what that looks like in practice, broken into the four main system categories.
- Outbound systems
This is where most Clay GTM engineers start. Outbound systems include ICP list building, where you define and source accounts that match your ideal customer profile. They include contact sourcing, finding the right decision-makers within those accounts. Email verification comes next, making sure you aren't burning your domain by sending to dead addresses. And finally, sequence triggers, determining when and how contacts enter outbound campaigns.
A strong Clay GTM engineer doesn't just set these up once. They build them as repeatable, self-refreshing systems that continuously feed the sales team with qualified prospects.
- RevOps systems
This is where the role gets more operational. RevOps systems built in Clay handle CRM hygiene, keeping your Salesforce or HubSpot data clean without someone manually deduplicating records every Friday. They handle territory assignment, making sure leads get routed to the right rep based on geography, company size, or segment. Lead routing logic lives here, as do duplicate cleanup workflows that catch the same company showing up under three different names.
These are systems that determine whether your CRM is a source of truth or a source of arguments.
- Growth systems
Growth systems are where Clay GTM engineers get creative. These include intent-based campaigns, where you trigger outreach based on signals like hiring patterns, funding rounds, or technology adoption. Competitor audience lists fall here too, identifying companies that use a competitor's product and building targeted replacement campaigns. Expansion triggers help existing customers get flagged for upsell when their usage or headcount changes. And job-change alerts track when a champion moves to a new company, opening a warm introduction opportunity.
These systems are often the highest-leverage work a Clay GTM engineer does, because they turn passive data into active pipeline.
- Intelligence systems
Finally, there's the research and intelligence layer. Pre-call briefs that automatically compile relevant information about a prospect before a sales call. Account research workflows that pull together funding history, recent news, tech stack, and org structure. Stakeholder maps that identify the buying committee within a target account.
These systems don't generate leads directly, but they make every sales conversation better. And in complex B2B deals, better conversations translate directly to higher win rates.
The best Clay GTM engineers are part operator, part marketer, part systems thinker. They don't just execute tasks. They look at a revenue process and ask, "What would this look like if it ran itself?" That combination of strategic vision and technical execution is what makes the role so valuable, and so hard to hire for.
- Core Clay workflows for B2B teams
Theory is helpful, but workflows are where Clay actually earns its keep. Here are five of the most impactful clay outbound workflows and operational systems that B2B teams build inside the platform. Each one solves a real problem that most teams currently handle manually or don't handle at all.
Workflow 1: website visitor to SDR outreach
This is one of the most popular Clay workflows, and for good reason. Here's how it works, step by step.
- Detect the company visit. Using a tool like Factors.ai or another visitor identification platform, you identify which companies are visiting your website.
- Enrich the account. Clay pulls in firmographic data, employee count, industry, tech stack, and other qualifying information.
- Find decision-makers. Based on your ICP criteria, Clay identifies the right contacts within that account, typically director-level and above in relevant departments.
- Push to CRM. Qualified accounts and contacts get synced directly into your CRM with all enrichment data attached.
- Alert the SDR. A Slack notification or CRM task gets triggered so the sales rep knows exactly who to reach out to and what context to use.
The whole process runs automatically. What used to require a marketing ops person, a spreadsheet, and a two-day turnaround now happens in near real-time.
Workflow 2: job-change trigger campaign
Champions changing companies is one of the warmest outbound signals in B2B sales. Someone who bought your product at their last company and just started a new role is far more likely to buy again. Clay makes it straightforward to build a system around this.
The workflow monitors a list of key contacts for job changes. When it detects a new role, it enriches the new company to confirm it fits your ICP. If it qualifies, Clay triggers a warm introduction outreach sequence. The messaging references the existing relationship, which dramatically improves response rates compared to cold outreach.
This is the kind of workflow that sales teams love because it feels personal and timely, even though it's entirely automated.
Workflow 3: competitor customer mining
This workflow is a bit more creative. The goal is to identify companies that currently use a competitor's product and build targeted outreach campaigns aimed at switching them over.
Clay can pull signals from review sites, job boards (companies hiring for specific tools often list them in job descriptions), technographic data providers, and other public sources. Once you've built a list of competitor customers, you enrich those accounts with the same process as any other target list, find the right contacts, personalize messaging around their current pain points, and push them into a sequence.
It's not subtle, but it works, especially when paired with genuine differentiation messaging rather than generic "we're better" claims.
Workflow 4: inbound lead enrichment
Not every Clay workflow is about outbound. Inbound enrichment is equally valuable. When a form fill arrives, whether it's a demo request, a content download, or a webinar registration, the lead data is usually sparse. You get a name, an email, maybe a company name. That's not enough for intelligent routing or scoring.
Clay enriches that lead with employee size, tech stack, geography, funding stage, and other qualifying data. It then scores the lead based on your criteria and routes it to the correct team or rep. High-intent, high-fit leads go straight to an AE. Lower-scoring leads get nurtured. This happens in minutes rather than the hours or days it takes when ops teams handle it manually.
Workflow 5: personalization at scale
This is where Clay's AI capabilities really shine. The workflow pulls recent funding news, hiring trends, company announcements, and other contextual data for each prospect. It then generates custom email intros and personalized talking points that reference those specific details.
The key distinction here is that this isn't the lazy "I noticed you went to [University]" personalization that prospects have learned to ignore. It's contextual personalization tied to business events. A prospect who just raised a Series B and is hiring five SDRs is going to care about different messaging than one that just went through layoffs.
Here's a summary of how each workflow connects to its core business impact:
These five workflows cover the most common use cases, but they're really just starting points. The beauty of Clay is that once you understand the logic, you can compose entirely new workflows by combining enrichment steps, AI actions, and integrations in whatever order your use case requires.
Using Apollo inside Clay: what are the best setups?
One of the most common questions teams ask when evaluating Clay is, "Does it replace Apollo?" The honest answer is: it depends on what you're using Apollo for. But for most teams, the better question is how to use both together.
Apollo and Clay solve overlapping but distinct problems. Apollo is primarily a contact database and outbound sequencing tool. It's excellent at giving you a large, searchable database of B2B contacts and letting you build email sequences. Clay, on the other hand, is a workflow orchestration platform. It's built for composing multi-step processes that pull data from many sources, apply logic, and push results to wherever they need to go.
Using Apollo inside Clay is one of the most popular setups in the GTM engineering world, and here are the four configurations that work best.
Setup 1: Apollo contacts plus Clay enrichment
This is the simplest integration. You use Apollo as your primary contact source because its database is large and reasonably affordable. Then you pull those contacts into Clay and layer on deeper enrichment from additional data providers. Apollo might give you the name, title, company, and email. Clay adds technographic data, funding information, hiring signals, and social profiles from other sources.
The result is a contact record that's far richer than what any single provider can offer.
Setup 2: Apollo lists plus Clay personalisation
In this setup, you build your ICP-based lists inside Apollo, export them into Clay, and then use Clay's AI workflows to generate personalised messaging for each contact. Apollo handles the "who," and Clay handles the "what to say." This is especially powerful for teams that want to run personalised outbound at scale without manually researching every prospect.
Setup 3: Clay signals plus Apollo sequences
This is arguably the most sophisticated setup. Clay acts as the decision engine, determining which accounts and contacts should receive outreach based on signals like website visits, intent data, job changes, or firmographic fit. Once Clay identifies a qualified prospect, it pushes that contact directly into an Apollo sequence.
In this configuration, Clay decides who gets outreach, and Apollo sends it. The intelligence layer and the execution layer are cleanly separated, which makes both easier to optimise.
Setup 4: Apollo database plus Clay multi-source verification
Email deliverability is a perennial headache for outbound teams. This setup uses Apollo's email data as a starting point, then runs it through Clay's multi-source verification workflow. Clay cross-references Apollo's emails against other providers and verification services, flagging risky addresses before they ever enter a sequence.
It's a simple workflow, but it can save your domain reputation from the kind of bounce-rate spikes that take months to recover from.
Here's a comparison of how each setup divides responsibilities:
Clay replaces parts of Apollo for advanced teams that want full workflow control. But many companies use both together, letting each tool do what it does best. The goal isn't to reduce your tool count for the sake of it. The goal is to build a system where data flows smoothly from identification to enrichment to outreach without manual handoffs.
Clay vs traditional sales tech stacks
To really understand what Clay changes, it helps to compare the traditional sales tech stack against a Clay-first approach. Most B2B teams have accumulated their tools over years, adding one vendor at a time whenever a new need emerged. The result is a stack that technically works but requires significant manual effort to keep running.
Here's how the two approaches compare:
The cost comparison is interesting but often misunderstood. Clay isn't always cheaper in terms of raw software spend. If you add up Clay's subscription plus the credits for data providers, it can rival or exceed the cost of individual tools. The savings show up elsewhere.
The biggest ROI from Clay is often fewer operational delays, not cheaper software. When a new campaign idea goes from concept to live workflow in a day instead of three weeks, the value isn't just time saved. It's opportunities captured that would have otherwise been missed. A lead that gets enriched and routed in five minutes converts at a meaningfully higher rate than one that sits in a queue for two days.
There's also the compounding benefit of reduced coordination overhead. In a traditional stack, launching a new workflow requires alignment between marketing, sales ops, and sometimes engineering. In a Clay-first stack, one operator with the right context can do it independently. That doesn't eliminate the need for cross-functional collaboration on strategy, but it removes the bottleneck on execution.
The honest caveat is that Clay-first stacks require a different kind of skill set. You need someone who understands data flows, conditional logic, enrichment sources, and campaign strategy. If your team doesn't have that person, Clay's power goes largely untapped. The platform is leverage, but leverage requires someone at the other end of the lever.
How Clay powers Factors.ai-style GTM systems
Here's where things get a little exciting, and where most Clay content doesn't go deep enough.
Clay is powerful on its own, but it becomes transformational when paired with intent and attribution data platforms. Factors.ai is a good example of this. It surfaces intent signals, paid ad engagement, website journey data, and funnel-stage movement for target accounts. That's incredibly valuable information, but unfortunately, information alone doesn't create pipeline. Action does.
The problem most teams face is that they have dashboards full of intent data and no automated system to act on it. A marketing manager looks at a list of high-intent accounts every Monday, shares it with the sales team in a Slack channel, and hopes someone follows up. By Friday, most of those accounts have gone cold. It's the marketing equivalent of watching fish jump in a lake and deciding you'll bring a net tomorrow.
Clay closes that gap. Here's what a signal-to-action GTM system looks like when you combine the two platforms:
- Factors.ai detects the signal. A target account visits your pricing page three times, engages with a LinkedIn ad, and a second contact from the same company downloads a case study. Factors.ai identifies this as a high-intent account and flags the funnel stage.
- Clay enriches the account. The account data flows into Clay, which enriches it with firmographics, technographics, and employee data. Clay identifies the buying committee, typically the VP of Marketing, the Director of Demand Gen, and the RevOps lead.
- Clay builds personalized outreach. For each contact in the buying committee, Clay generates contextual messaging based on the company's recent activity, industry, and the specific pages they visited.
- Clay pushes alerts and sequences. The relevant AE gets a Slack notification with a pre-call brief. Contacts get pushed into a personalized outbound sequence. The CRM gets updated automatically with account stage, enrichment data, and activity history.
The entire flow, from signal to action, happens without a human manually reviewing a dashboard or copying data between tools. That's what signal-to-action GTM systems look like. The data doesn't just sit in a report. It triggers pipeline.
This is the architecture that the most sophisticated B2B teams are building right now, and it's why the combination of intent platforms and orchestration tools is so much more powerful than either category alone. Factors.ai tells you who's interested and how interested they are. Clay turns that intelligence into coordinated, personalized action across the entire buying committee.
If you're building a modern GTM stack, the question isn't whether to use intent data or automation. The question is how to connect them into a closed loop where every qualified signal gets acted on before it goes cold.
What metrics should you track to measure Clay ROI?
One of the fastest ways to undermine a Clay implementation is to measure it with the wrong metrics. Teams love to report things like "we enriched 50,000 records this month," which sounds impressive but tells you absolutely nothing about business impact. It's the revenue operations equivalent of measuring success by how many emails you sent rather than how many replies you got.
Here's a framework for measuring Clay's actual ROI, organised into four categories that matter.
- Pipeline metrics
These are the metrics that connect Clay directly to revenue. They're the ones your leadership team actually cares about.
- Meetings booked from Clay-sourced or Clay-enriched contacts. This is the most direct measure of whether your workflows are generating real engagement.
- Opportunities created from accounts that entered the pipeline through Clay workflows. Track these separately from other sources so you can see Clay's incremental contribution.
- Pipeline influenced captures situations where Clay didn't source the lead but enriched it, routed it faster, or personalized the outreach. Attribution here gets fuzzy, but directional tracking still matters.
- Efficiency metrics
These measure whether Clay is actually saving time and reducing manual work, which is one of its core value propositions.
- Hours saved per week across your ops, sales, and marketing teams. Estimate this by comparing how long workflows used to take manually versus how long they take now.
- Records enriched automatically versus records that required manual research. The ratio tells you how much of your enrichment process is truly automated.
- Manual tasks removed is a count of the specific activities that people no longer need to do because a Clay workflow handles them. Lead routing, data entry, email verification, these are all quantifiable.
- Quality metrics
These tell you whether Clay is making your outbound and operations better, not just faster.
- Reply rate uplift on emails sent to Clay-enriched, personalized contacts versus a control group. This is one of the clearest signals of whether personalization workflows are actually working.
- Lead acceptance rate, meaning the percentage of Clay-sourced leads that sales actually accepts as qualified. If reps are rejecting half the leads, your enrichment or targeting logic needs work.
- Data coverage percentage measures how many fields in your CRM are filled for Clay-enriched records versus others. Higher coverage means better routing, scoring, and personalization downstream.
- Revenue metrics
These are the hardest to attribute directly to Clay, but they're the most important for long-term justification.
- CAC reduction over time as Clay workflows replace more expensive manual processes or reduce the number of tools in your stack.
- Sales cycle reduction for deals that were sourced or influenced by Clay workflows. Faster enrichment and better personalization should compress the time from first touch to close.
- Win rate lift on triggered outreach, specifically measuring whether signal-based outbound (job changes, intent spikes, competitor signals) converts at a higher rate than standard cold outreach.
The key principle across all of these is to measure outcomes, not activity. Clay can generate a lot of activity very quickly. What matters is whether that activity translates into pipeline and revenue. If you can't draw a line from a Clay workflow to a business outcome, either the workflow needs refinement or the measurement framework does.
Common mistakes teams make with Clay
Every tool that promises efficiency also has the potential to amplify bad habits. Clay is no exception. Here are the five most common mistakes teams make, along with how to avoid them. Sharing these isn't meant to discourage adoption. It's meant to help teams get value faster by skipping the learning curve that others have already paid for.
Mistake 1: Building workflows before defining your ICP
This is the most common and most expensive mistake. Teams get excited about Clay's capabilities and immediately start building outbound workflows before they've clearly defined their ideal customer profile. The result is beautifully automated outreach to companies that were never going to buy.
Automation of bad targeting equals faster failure. You can enrich and personalise messages for 10,000 contacts a week, but if those contacts aren't in your ICP, you're just burning through credits and domain reputation at an impressive clip. Always start with a clearly defined, validated ICP. Then build the workflows.
Mistake 2: Over-personalizing with nonsense
AI-generated personalization is powerful, but it has a failure mode that's surprisingly common. Teams use Clay's AI features to generate "personalized" email intros that reference a prospect's recent LinkedIn post, their company's latest blog article, or some other surface-level detail. The problem is that these references often feel forced, irrelevant to the actual value proposition, or slightly off in tone.
"I loved your post about leadership in Q4" doesn't build trust when it's obviously generated by a machine that doesn't actually have opinions about leadership in Q4. Effective personalization ties the prospect's context to a specific problem your product solves. Everything else is AI fluff that erodes credibility.
Mistake 3: No owner for workflow maintenance
Clay workflows are systems, and systems need maintenance. Data providers change their APIs. Enrichment fields get deprecated. Scoring logic needs updating as your ICP evolves. If nobody is responsible for keeping workflows current, they degrade quietly until someone notices that leads haven't been routed correctly for three weeks.
Every Clay implementation needs a clear owner, someone who monitors workflow health, reviews output quality regularly, and updates logic as the business evolves. This is one of the core responsibilities of the clay GTM engineer role, and teams that skip this hire (or don't assign the responsibility to someone) end up with brittle systems.
Mistake 4: Buying Clay without process maturity
Clay amplifies systems. It doesn't create them. If your team doesn't have a clear outbound process, buying Clay won't give you one. You'll just end up with an expensive platform that nobody knows how to use effectively.
The teams that get the most value from Clay are the ones that already have a defined sales process, a working CRM, and at least a basic understanding of their target market. Clay takes those foundations and makes them dramatically more efficient. Without the foundations, it's a sports car with no road.
Mistake 5: Ignoring measurement entirely
This connects directly to the metrics section above, but it's worth calling out as a distinct mistake because it's so common. Teams build impressive Clay workflows, see activity increase, and assume everything is working. But without pipeline attribution, without tracking which workflows generate meetings and opportunities, there's no proof that the investment is paying off.
No pipeline attribution means no proof… and no proof means that when budget review season comes around, Clay is one of the first tools on the chopping block. Build measurement into your workflows from day one, not as an afterthought three months later.
Is Clay worth it?
his is the question that every tool evaluation eventually comes down to, and the honest answer is that it depends on your team’s situation.
Clay is worth the investment if you run outbound seriously. That means it’s a core revenue channel, not an occasional experiment. If outbound accounts for a meaningful percentage of your pipeline, Clay’s workflow capabilities will almost certainly pay for themselves in time saved and conversion improvements.
It’s also worth it if you need cleaner GTM data. If your CRM is riddled with incomplete records, inconsistent formatting, and outdated contact information, Clay’s enrichment workflows can systematically improve data quality across your entire database. Clean data compounds. Every downstream process, routing, scoring, personalization, reporting, works better when the underlying data is accurate.
Teams that want leaner operations will find Clay valuable because it lets a smaller ops team do more. One strong Clay GTM engineer can replace work that previously required two or three people handling manual enrichment, data entry, and list building. Traditional methods like hiring more sales reps or scaling manual processes are not effective anymore; organizations need more innovative, systems-driven approaches.
If you need automation speed, the ability to go from idea to live workflow in hours rather than weeks, Clay delivers on that promise. And if you have RevOps or growth ownership, meaning someone on the team is actually responsible for building and maintaining these systems, Clay gives them an incredibly powerful toolkit.
On the other hand, Clay may be overkill for certain teams. If your total addressable market is very small, say under 500 companies, the overhead of setting up automated workflows might not be justified when manual outreach would be just as effective. If you don’t run outbound as a motion at all, Clay’s core value proposition doesn’t apply. If you don’t have an ops owner who can build and maintain workflows, the platform will gather dust. And if your CRM discipline is poor, meaning your team doesn’t consistently use the CRM as a system of record, Clay will just pipe clean data into a messy environment.
Note: Clay is not magic software. It’s a leverage software and multiplies the effectiveness of good processes and good people. If those foundations exist, Clay can be one of the highest-ROI tools in your stack. If they don’t, it’s an expensive shelf decoration.
The GTM engineering tools landscape is evolving quickly, and Clay has positioned itself at the center of that evolution. GTM engineering acts as the connective tissue for organizations preparing for a systems-oriented future, ensuring seamless integration between product, sales, and marketing. For teams that are ready for it, the platform delivers a genuine competitive advantage. For teams that aren’t, it’s better to invest in the foundations first and adopt Clay when you have the maturity to use it well.
In a nutshell
Clay has become the operating system for a new generation of GTM teams, and for good reason. It compresses tool sprawl, turns ops into experiments, and rewards the kind of technical marketers who think in systems rather than campaigns. Central to this shift is the focus on building scalable GTM infrastructure and robust GTM operations, enabling teams to automate repetitive tasks and free up time for more strategic work.
The core insight from this entire piece is that Clay’s value isn’t in any single feature. It’s in the ability to compose multi-step workflows that connect data enrichment, AI logic, and CRM automation into coherent systems. Whether you’re building a website visitor to SDR outreach pipeline, running job-change trigger campaigns, or pairing Clay with intent data from platforms like Factors.ai, the pattern is the same: identify signals, enrich the data, personalize the action, and route it to the right person.
If you’re evaluating Clay for your team, start by defining your ICP and mapping your current manual processes. Identify the workflows that consume the most time or create the most bottlenecks. Build those first inside Clay, measure their impact on pipeline metrics, and expand from there, automating wherever possible to maximize efficiency.
The teams getting the most from Clay GTM engineering aren’t the ones with the most complex workflows. They’re the ones who built the right workflows, assigned a clear owner, and measured outcomes from day one. As GTM engineers have become essential for building automated revenue engines, dedicated GTM engineering teams are now recognized as critical to enhancing go-to-market strategies. That’s the playbook worth following.
Frequently asked questions about Clay for GTM engineering
Q1. What is Clay in the context of GTM engineering?
Clay is a workflow orchestration and enrichment platform. While many see it as a data vendor, GTM engineers use it as a "workshop" to build automated systems. It allows you to pull data from multiple sources (Apollo, LinkedIn, firmographic providers), apply AI-driven logic to that data, and push the results directly into CRMs or sales sequences.
Q2. What does a GTM Engineer actually do with Clay?
A Clay GTM Engineer occupies a hybrid role between RevOps, Marketing, and Engineering. Their responsibilities typically include:
- Building Outbound Systems: Sourcing lists, verifying emails, and setting up triggers.
- CRM Hygiene: Automating deduplication and lead routing.
- Signal-to-Action Workflows: Identifying "intent" (like a job change or website visit) and automatically triggering a personalized sales outreach.
- Account Intelligence: Compiling automated pre-call briefs for AEs.
Q3. Should I use Apollo OR Clay?
For most teams, the answer is both. They serve distinct purposes:
- Apollo: Best for its massive contact database and email sequencing engine.
- Clay: Best for multi-source enrichment and complex logic. A common setup is using Apollo as the "source" for contacts and Clay as the "brain" that enriches those contacts and writes personalized messaging before pushing them back into an Apollo sequence.
Q4. How does Clay help with personalization at scale?
Clay uses AI to go beyond basic merge tags (like First_Name). It can:
- Scrape a company's recent news or job postings.
- Use AI to summarize that news into a specific business challenge.
- Draft an email intro that connects that challenge to your product’s value proposition. This ensures personalization is contextual rather than just a superficial mention of a prospect's university or city.
Q5. How do Factors.ai and Clay work together?
This is a high-leverage "signal-to-action" system:
- Factors.ai identifies an anonymous company visiting your pricing page.
- Clay automatically picks up that company name, finds the relevant decision-makers (e.g., the VP of Sales), and enriches their contact info.
- Clay triggers a personalized Slack alert to the AE or pushes the contact into a "High Intent" email sequence immediately.

Signal-based Outbound Workflows: how GTM engineers trigger outreach with buyer intent
Learn how GTM engineers use buyer intent signals to trigger outbound workflows, enrich accounts, route leads, and create pipeline faster.
TL;DR
- Signal-based outbound workflows replace static lead lists with real-time buyer intent signals, triggering outreach only when accounts show genuine buying behaviour like pricing page visits, hiring spikes, or competitor research.
- The five-step signal workflow loop (detect, score, enrich, trigger, learn) gives GTM engineers a repeatable system for converting intent into pipeline, not just activity.
- First-party signals like repeat website visits and product usage expansion are often more reliable than third-party data, but the strongest programmes layer both together with ICP fit filters.
- Metrics like signal-to-meeting rate, pipeline per signal source, and win rate by signal type matter far more than open rates or reply rates when measuring signal programme health.
- The next wave of agentic outbound systems will monitor accounts autonomously, draft contextual outreach, and adjust playbooks in real time, making speed-to-signal the new competitive advantage.
You’re an SDR… you've spent forty-five minutes researching an account, crafting a personalized email, referencing a recent blog post they published, and maybe even a mutual LinkedIn connection. You hit send with the confidence of someone who's done their homework. Two weeks later… you learn the company signed with a competitor three months ago, and your perfectly crafted email landed in the inbox of someone who'd already made up their mind long before you showed up.
That feeling, the sinking realization that your timing was completely off, is the core problem with traditional outbound… you weren't wrong about the account… you weren't wrong about the message… you were wrong about the moment. And in B2B sales… the moment is almost everything.
Signal-based outbound workflows exist because of this exact gap. Instead of starting with a list and hoping your timing is decent, these systems start with a signal, a real buying behavior that suggests someone is actively in-market, and then they trigger the right outreach at the right time. It's a fundamental shift in how GTM engineers think about pipeline generation, and it's reshaping how the best B2B SaaS teams operate in 2026.
In this article, I’ll walk you through what signal-based prospecting actually looks like, why it works better than volume-driven outbound, and how to build a system that turns buyer intent signals into revenue instead of noise.
What are signal-based outbound workflows, exactly?
At the simplest level… a signal-based outbound workflow is an automated outreach system that fires when real buying behavior appears. Instead of relying on static lead lists or mass cold outreach, these workflows watch for specific actions, events, or patterns that suggest an account might be ready to buy. When those signals cross a confidence threshold, the system triggers a sequence of actions, whether that's alerting a rep, launching an email sequence, or syncing an account to an ad audience.
The distinction from traditional outbound is straightforward. Traditional outbound asks, "Who should we contact?" Signal-based outbound asks, "Who is showing intent right now?" That single reframe changes everything downstream, from how reps spend their time to how pipeline gets generated.
The signals themselves can take many forms. A cluster of pricing page visits from the same company. A target account hiring for a role that suggests they're building out a function your product supports. A funding announcement that changes their budget picture. Competitor searches that indicate active evaluation. Product usage spikes that hint at expansion readiness. Three different people from the same organisation visiting your site within a week.
Each of these moments represents a window where outreach moves from interruption to relevance. The best outbound in 2026 feels less like a cold call and more like a well-timed conversation that the prospect didn't know they needed but is glad showed up. That's the promise of intent-based outbound, and when it's engineered properly, it delivers.
What makes this approach genuinely different isn't the technology alone. It's the philosophy behind it. You're no longer optimising for volume or hoping that sheer activity creates enough at-bats to hit quota. You're optimising for timing, and timing compounds in ways that volume never can. A perfectly timed email to a genuinely interested buyer converts at rates that make spray-and-pray outbound look almost absurd by comparison.
Why is traditional outbound losing efficiency?
If you've managed an SDR team in the last two years, you've probably noticed the trendlines moving in the wrong direction. Reply rates declining. More emails needed per meeting booked. Reps spending increasing amounts of time on research that doesn't convert. The legacy SDR playbook, build a list, write sequences, blast them out, measure activity, is losing steam, and there are structural reasons why.
- The first is that buyers research anonymously before they ever want to talk to sales. By some estimates, B2B buyers complete the majority of their evaluation process before engaging with a vendor directly. They're reading your content, visiting your pricing page, comparing you against competitors, all without filling out a form or raising their hand. Your SDR team can't time outreach to a journey they can't see, which means most cold emails arrive either far too early or embarrassingly late.
- The second problem is inbox saturation. Every B2B buyer with a LinkedIn profile and a company email gets dozens of cold outreach messages weekly. The bar for earning attention keeps rising, but most outbound teams are still competing on volume rather than relevance. When everyone's sending "quick question" emails, nobody's email stands out. Domain reputation issues compound this, as high-volume sending patterns trigger spam filters more aggressively than they did even a year ago.
- Then there's the manual research bottleneck. Reps spend hours trying to figure out who to contact, what to say, and whether the timing makes sense. Most of that research yields dead ends or stale information because CRM data decays fast. Job titles change, companies get acquired, budgets shift quarterly. The data your rep is working from might have been accurate six months ago, but the buying landscape has moved on.
Unfortunately, the cost of bad timing is now higher than the cost of bad copy. Even a brilliantly written, deeply personalized email gets ignored if it lands in someone's inbox three months before they're ready to evaluate solutions. In B2B SaaS, where buying committees involve five to ten stakeholders and sales cycles stretch across quarters, timing isn't a nice-to-have. It's the single variable that determines whether your outreach gets a response or gets archived.
Traditional outbound isn't dead, but it's become remarkably inefficient when it operates blind. The teams that are still growing pipeline consistently aren't sending more emails. They're sending fewer emails to better-timed accounts, and that distinction matters enormously.
Which signals do GTM engineers actually use?
Not all signals are created equal, and one of the first mistakes teams make is treating every data point like a buying signal. A single blog visit from a random IP isn't a signal. Three decision-makers from a target account visiting your pricing page within 48 hours, that's a signal. The difference is pattern recognition and intent confidence.
GTM engineers typically organise signals into four categories, each with different reliability levels and use cases.
- First-party signals
These come from your own properties and tools, which makes them the most reliable because you control the data quality. They include website visits (especially to high-intent pages like pricing, demo requests, and comparison pages), repeat visits from the same account, trial signups, product usage expansion, and webinar engagement. First-party intent data is the foundation of most signal programmes because it reflects direct interaction with your brand.
- Third-party signals
These originate outside your owned ecosystem and require enrichment tools or data partners. Funding rounds change a company's budget picture. Hiring spikes for specific roles suggest they're building a function your product supports. Tech stack changes (like switching away from a competitor's tool) indicate active evaluation. Review site research on platforms like G2 or Capterra means they're comparing options. Search intent data reveals what topics and solutions accounts are actively researching.
- Relationship signals
These are often the most actionable and the most overlooked. A former champion changing jobs to a new company is one of the strongest buying signals in B2B, because they already know and trust your product. An existing customer acquiring another company creates expansion potential. A new executive hire at a target account often triggers a 90-day window where new tools get evaluated and purchased.
- Dark funnel signals
These are the hardest to measure but often the earliest indicators of intent. Direct traffic spikes to your site from a specific account suggest they've heard about you through word-of-mouth or offline channels. Branded search increases mean your company name is being actively researched. Multiple anonymous visits from the same account, even without form fills, indicate growing interest that hasn't surfaced yet.
Here's a comparison of these signal types at a glance:
The nuanced take that separates good signal programmes from noisy ones is this: not every signal deserves outreach. A funding announcement from a company outside your ICP is just news. A pricing page visit from a two-person startup when you sell enterprise software is noise. Signals need three things before they should trigger action: ICP fit, timing relevance, and intent confidence. Without all three, you're just automating irrelevance at speed, which is arguably worse than doing nothing.
How do signal-based workflows operate step by step?
The beauty of a well-designed signal workflow is that it looks simple from the outside but requires careful engineering underneath. GTM engineers build these systems as loops, not linear processes, because signals keep arriving and the system needs to keep learning. Here's the practical framework most high-performing teams follow.
Step 1: Detect
Everything starts with collection. Signals flow in from multiple sources: your CRM, website analytics, ad platforms, product telemetry, LinkedIn activity, and third-party enrichment tools. The engineering challenge here is unification. Most teams have signal data scattered across six or seven tools, and without a central layer that stitches it together at the account level, individual signals remain isolated data points rather than a coherent picture.
This is where real-time prospecting signals matter most. A pricing page visit that takes three days to surface in a report is no longer real-time. Detection needs to happen within minutes or hours, not days. The faster you detect, the more relevant your response can be, and relevance decays quickly in B2B buying cycles.
Step 2: Score
Not all detected signals carry the same weight, so scoring is where engineering judgment becomes critical. A pricing page visit typically scores high because it suggests active evaluation. A blog read scores medium, it shows interest but not necessarily buying intent. A careers page visit is contextual, it might mean they're growing (a positive signal) or that a job seeker stumbled onto your site (noise).
Funding rounds are timing indicators rather than direct intent signals. They suggest budget availability but don't confirm interest in your specific product. The scoring model needs to account for these differences, weighting signals based on their historical correlation with pipeline creation.
The best scoring models are composite. They don't just look at a single signal in isolation. They look at signal combinations. One pricing page visit is interesting. Three pricing page visits from different people at the same company, combined with a G2 comparison page view, is a strong composite signal that warrants immediate action.
Step 3: Enrich
Once an account crosses your scoring threshold, the next step is enrichment. Raw signals tell you that something is happening. Enrichment tells you who to contact and what to say. This step adds contact details for the buying committee, maps roles and seniority levels, identifies the technology stack already in use, assigns territory ownership, and adds firmographic data like revenue band and employee count.
Enrichment transforms an anonymous signal into an actionable account profile. Without it, your SDR gets a Slack notification that says "Company X visited pricing" and has to spend thirty minutes figuring out who to email. With enrichment, that same notification arrives with three contacts, their roles, and the context needed to write a relevant first touch.
Step 4: Trigger action
This is where the workflow becomes visible. Based on the signal type, score, and enriched data, the system triggers a specific action. Common triggers include an AE Slack alert for high-value accounts, SDR task creation in the CRM for accounts that need personal outreach, a personalised outbound sequence launch, LinkedIn audience sync for account-based advertising, or even a direct mail trigger for enterprise prospects.
The trigger should match the signal strength. A dark funnel signal might warrant adding an account to an awareness ad campaign. A strong first-party signal like repeated pricing page visits from multiple stakeholders warrants a direct call from the account executive. Matching signal strength to response intensity is one of the subtleties that separates effective programmes from ones that burn through prospect goodwill.
Step 5: Learn
The final step closes the loop, and it's the one most teams skip. Every triggered workflow should track downstream outcomes: meetings booked, pipeline created, and revenue closed, all tied back to the original signal source. Over time, this data reveals which signals actually predict revenue and which ones generate activity without results.
This learning step is where the system gets smarter. You discover that pricing page visits from accounts with more than 200 employees convert to meetings at three times the rate of visits from smaller companies. Or that champion job-change signals produce pipeline with 40% higher win rates. These insights feed back into your scoring model, making every subsequent cycle more precise.
This is where GTM engineers outperform traditional ops teams. They design systems that improve themselves, not spreadsheets that need manual updating every quarter. The engineering mindset treats outbound as a product to be iterated, not a process to be managed, and that distinction produces compounding returns over time.
What does buyer intent-triggered outreach actually look like?
Abstract frameworks are useful, but nothing clarifies a concept like concrete scenarios. Here are four patterns that GTM engineering teams run regularly, each triggered by a different signal type.
Example 1: The pricing page spike
Three visitors from a single target account hit your pricing page within 48 hours. None of them fill out a form, but your signal detection layer identifies the company through IP-to-account matching and cross-references it against your ICP criteria.
The workflow fires automatically. First, it identifies the company and confirms it meets your firmographic filters. Then it enriches the account with buying committee contacts, pulling in the VP of Marketing, the Director of Revenue Operations, and the CFO. The account owner receives a Slack notification with the signal context and contact details. Within two hours, a warm outreach sequence launches, referencing the specific pain points that pricing page visitors typically care about, like implementation timelines, ROI benchmarks, and contract flexibility.
The key here isn't the automation. It's the speed. That 48-hour window of concentrated interest might close by the end of the week. Teams that detect and respond within hours have a fundamentally different conversion rate than teams that discover the same signal in a weekly report.
Example 2: The VP of Marketing hire
A target account announces a new VP of Marketing. This is a classic relationship signal because new leaders almost always evaluate their existing tool stack within their first 90 days. They want to put their stamp on the function, and they're actively looking for better solutions.
The workflow triggers an intro playbook designed specifically for new executive hires. It sends benchmark content relevant to their industry, positioning your brand as a knowledgeable resource rather than a pushy vendor. Simultaneously, a 14-day outreach sequence begins, carefully paced to avoid overwhelming someone who's still settling into their new role. The messaging acknowledges the transition and offers value before asking for a meeting.
This playbook works because it respects the buyer's context. A new VP doesn't want another sales pitch in week one. They want to look smart and make informed decisions. Signal-triggered outreach that matches this mindset converts remarkably well.
Example 3: Product usage expansion
Your freemium product shows an interesting pattern. An account that started with two users six weeks ago now has fourteen active users across three departments. Nobody's asked about upgrading, but the usage trajectory is unmistakable.
The workflow notifies the account's sales owner with a usage summary and growth chart. It also triggers an in-app message offering a team plan consultation, framed as a way to unlock collaboration features rather than a hard upgrade push. The sales owner reaches out with a personalized note referencing the team's growing adoption, which feels relevant and helpful rather than invasive.
Product-led growth signals like these are some of the highest-converting triggers available, because the prospect has already experienced your product's value firsthand. Outreach at this moment isn't cold. It's a natural extension of an existing relationship.
Example 4: Competitor search intent
Third-party intent data reveals that a target account has been researching alternatives to a competitor's product. They've visited comparison pages, read reviews, and searched for terms like "alternative to [Competitor Name]."
The workflow triggers two parallel actions. On the advertising side, the account gets added to a LinkedIn campaign serving comparison content and customer case studies. On the outbound side, an SDR sends a personalized email that addresses common switching concerns, like data migration, onboarding timelines, and integration compatibility. The messaging doesn't trash the competitor. Instead, it positions your product as the logical next step for teams that have outgrown their current solution.
What makes this scenario powerful is that the prospect has already self-identified as being in evaluation mode. Your outreach doesn't need to create demand. It needs to capture demand that already exists, and that's a much easier conversation to start.
How should you build the modern GTM engineering stack?
Building signal-based outbound workflows requires a layered architecture where each layer has a clear job. Teams that try to solve everything with a single tool inevitably hit limitations, while teams that buy dozens of point solutions create integration nightmares. The sweet spot is a deliberate, five-layer stack where each layer feeds the next.
- Data layer
This is your foundation. It includes your CRM (typically Salesforce or HubSpot), your data warehouse (Snowflake, BigQuery, or similar), website event tracking, and ad platform data. The goal of this layer is to consolidate every interaction and attribute that matters into a single, queryable source of truth. Without a clean data layer, every subsequent layer operates on shaky ground.
- Signal layer
This is where intent detection, enrichment, and identity resolution happen. Tools at this layer watch for buying signals across your first-party and third-party data sources, resolve anonymous website visitors to known accounts, and enrich those accounts with firmographic and contact data. The signal layer transforms raw data into actionable intelligence.
- Workflow layer
This is the orchestration engine. It takes scored, enriched signals and routes them to the right actions. Common tools here include n8n, Clay, Hightouch, and various reverse ETL platforms. The workflow layer is where GTM engineers spend most of their time, building the logic that determines what happens when a signal fires, who gets notified, and what sequence launches.
- Activation layer
This is where the outreach actually happens. Email platforms, LinkedIn outreach tools, SDR task queues, ad audience syncs, and direct mail triggers all live here. The activation layer executes the decisions made by the workflow layer, and it needs to be fast. A workflow that triggers a Slack notification in real time but takes 24 hours to launch an email sequence loses much of its timing advantage.
- Measurement layer
The final layer closes the loop. Pipeline attribution and closed revenue tracking, tied back to the original signal source, tell you which workflows actually produce results. Without this layer, you're flying blind, unable to distinguish high-performing signals from noise.
Here's an opinion that's earned through watching dozens of teams build these stacks: too many teams buy tools before defining triggers. They get excited about a shiny new intent platform or enrichment tool and then try to figure out what to do with the data afterward. That's backwards. Triggers should decide tools, not the other way around. Start by defining the five or ten signal scenarios you want to operationalize, then evaluate which tools support those specific workflows. You'll end up with a leaner, more effective stack.
The other common mistake is over-engineering the stack before proving the concept. You don't need every layer fully built to start. Many teams begin with a simple two-step workflow: detect pricing page visits, alert the account owner via Slack. That alone, if executed quickly and consistently, can generate meaningful pipeline while you build out more sophisticated workflows over time.
How does Factors.ai power signal-based outbound?
Building the stack described above requires stitching together multiple tools and data sources, which is exactly where most GTM teams struggle. Factors.ai addresses this by providing a unified signal layer that connects the dots across your website, CRM, ad platforms, and account data without requiring a custom data engineering project.
Here's what that looks like in practice.
Factors.ai unifies signals from your website visits, CRM activity, and ad engagement into a single account-level view. Instead of checking three dashboards to understand what a target account has been doing, you see the complete picture in one place. It detects in-market companies by identifying accounts that match your ICP and are showing buying behavior, even when those visitors haven't filled out a form.
The platform reveals account engagement trends over time, so you can distinguish between a single casual visit and a sustained pattern of growing interest. This trend data is what separates genuine buying signals from random noise. It also syncs audiences directly to LinkedIn and Google ad platforms, letting you run account-based outbound workflows that combine personalized email sequences with targeted advertising.
When a high-scoring account crosses your intent threshold, Factors.ai routes it to the appropriate sales owner automatically. No manual list pulls, no weekly report reviews, no lag between signal detection and rep notification. The speed advantage this creates is substantial in competitive markets where multiple vendors are trying to reach the same in-market accounts.
On the measurement side, Factors.ai ties pipeline outcomes back to the signals that initiated them. You can see which signal types generate the most meetings, which workflows produce the highest pipeline value, and where your GTM investments are actually paying off.
An example workflow with Factors.ai
Consider this scenario. A target account visits your pricing page twice, engages with a LinkedIn ad comparing your product to a competitor, and matches your ICP criteria for industry, company size, and tech stack. Factors.ai detects this composite signal, scores it above your threshold, enriches the account with buying committee contacts, and pushes it into your outbound queue instantly.
The account owner gets a Slack notification with full context. The SDR launches a sequence within the hour. A LinkedIn retargeting campaign starts running comparison content to other stakeholders at the same company. All of this happens without anyone manually checking a report or building a list. That's the difference between signal-based outbound and traditional prospecting. The system does the detection and routing work, freeing your team to focus on the conversations that actually create pipeline.
Which metrics matter more than open rates?
Here's where most outbound teams get their measurement fundamentally wrong. They obsess over vanity metrics like open rates and reply rates because those numbers are easy to track and they move quickly. But an open rate tells you almost nothing about whether your signal programme is working. Someone opening your email might be curious, confused, or just clearing their inbox. It's a measure of subject line performance, not pipeline creation.
When you're running sales trigger workflows, the metrics that actually matter are the ones that connect signal detection to revenue outcomes. Here are the ones worth tracking.
Signal-to-meeting rate measures how often a detected signal converts into a booked meeting. This is your leading indicator for signal quality. If you're triggering on hundreds of signals but booking very few meetings, either your signals are too weak, your scoring is off, or your outreach isn't matching the intent context.
Time-to-first-touch after signal tracks how quickly your team responds after a signal fires. In our experience, the half-life of a buying signal is shorter than most teams assume. A response within two hours converts meaningfully better than one that takes two days. This metric keeps your team honest about execution speed.
Meetings per 100 triggered accounts normalize your performance across different signal volumes. It lets you compare the effectiveness of different signal types on an apples-to-apples basis, regardless of how many accounts each signal source produces.
Pipeline per signal source tells you which signals generate the most pipeline value, not just the most activity. You might find that competitor research signals produce fewer meetings than pricing page visits but generate larger deal sizes. Without this metric, you'd over-invest in the higher-volume, lower-value signal.
Win rate by signal type reveals which signals correlate with deals that actually close. Some signals are great at generating meetings but produce prospects who evaluate and ultimately choose someone else. Win rate by signal type helps you understand which signals indicate genuine buying readiness versus casual exploration.
CAC by triggered workflow connects your signal programme costs (tools, enrichment credits, rep time) to customer acquisition. This is your efficiency metric. If a specific workflow costs significantly more per acquired customer than others, it might need refinement or retirement.
Rep efficiency, hours saved quantifies how much time your sales team reclaims by not manually researching accounts. If your signal workflows save each SDR ten hours a week, that's ten hours redirected toward conversations and closing, and that reallocation often matters more than any individual metric improvement.
Open rate measures curiosity. Pipeline measures value. The teams that build their dashboards around the second set of metrics consistently outperform the ones still celebrating 45% open rates on emails that never generate a meeting.
What are the common mistakes that kill signal programmes?
I've watched teams invest significant resources in signal-based prospecting only to see the programme underperform or quietly get abandoned. The failure rarely happens because the concept is wrong. It happens because of execution mistakes that compound over time. Here are the most common ones.
- Treating all signals equally is probably the most frequent mistake
Teams get excited about having signal data and start triggering outreach on everything. A blog visit, a funding round, a job posting, they all get the same response. But a blog visit from a random visitor and a pricing page visit from a decision-maker at an ICP account are completely different events. Without signal weighting and scoring, you drown your sales team in low-quality alerts, and they start ignoring all of them.
- Triggering outreach too slowly undermines the entire value proposition of signal-based outbound
If your workflow detects a signal on Monday but the outreach doesn't launch until Thursday, you've lost the timing advantage that makes this approach work. Speed-to-action after signal detection is a critical design requirement, and teams that treat it as optional consistently underperform.
- Poor data hygiene corrupts your signal quality from the source
If your CRM has duplicate records, outdated contacts, or misassigned territories, even the best signal detection produces garbled outputs. Enrichment layers help, but they can't fix foundational data problems. Cleaning your data before building signal workflows isn't glamorous, but it's essential.
- No ownership routing means signals arrive without clear accountability
If a signal fires and nobody knows who's responsible for acting on it, the signal dies in a queue. Every workflow needs a clear owner, typically mapped to territory or account assignment, so that signals convert to action without ambiguity.
- Generic messaging after rich signals is a particularly frustrating waste
Your system detected that a VP of Marketing visited the pricing page three times after reading a case study. And then the outreach says, "Hi, I noticed you might be interested in improving your marketing operations." That's like having a detailed map and choosing to drive blindfolded. If your outreach ignores the reason the workflow triggered, the signal was wasted. Messaging needs to be contextual to the specific signal that initiated it.
- No feedback loop to revenue means you never learn which signals work
Without tracking meetings, pipeline, and closed deals back to signal sources, your programme can't improve. You end up with a collection of workflows running on assumptions rather than evidence.
- Over-automation with zero human judgment is the trap that technology-first teams fall into
Full automation works well for simple, high-confidence signals. But some signals require human interpretation before action. A competitor search signal combined with a recent executive departure might mean the account is in chaos and not ready to evaluate new tools. Automation should handle the detection and routing, but humans should retain judgment over nuanced situations.
- Ignoring existing customer expansion signals is the opportunity cost that almost never shows up in outbound strategy discussions
Most signal programmes focus entirely on new logo acquisition. But expansion signals from existing customers, like product usage growth, new department adoption, or champion promotions, often convert faster and at lower cost than any new logo signal. If your signal programme only looks outward, you're leaving revenue on the table.
What does the future of agentic outbound systems look like?
The current generation of signal-based outbound workflows still requires significant human design and maintenance. GTM engineers build the workflows, define the triggers, write the scoring logic, and update the playbooks. The next wave of outbound automation workflows will shift much of this work to AI agents that operate autonomously.
Imagine AI agents monitoring your entire target account universe around the clock, detecting signal patterns that humans would miss because the volume is too high to review manually. These agents won't just flag signals. They'll auto-generate outreach drafts tailored to the specific signal context, the account's industry, and the individual recipient's role and likely priorities. The GTM engineer's job shifts from building every workflow manually to setting strategic parameters and letting autonomous playbooks execute within those guardrails.
Budget allocation will become signal-responsive as well. Instead of setting quarterly ad budgets by channel, AI agents will dynamically shift spend toward account segments showing the strongest intent signals. If enterprise accounts in financial services suddenly show a spike in competitor research, the system reallocates budget to serve those accounts comparison content within hours, not weeks.
Multi-threading buying committees, one of the most time-intensive parts of enterprise sales, becomes automated. When a signal fires on one stakeholder, the system identifies the full buying committee and engages them in parallel across email, LinkedIn, and advertising. No rep needs to manually research org charts or guess who else should be in the loop.
CRM updates happen without rep input, because the agent tracks engagement, logs activity, and adjusts account scores based on real-time behavior. Reps spend their time on conversations, not data entry, which is frankly how it should have worked all along.
Speed-to-signal may become more important than speed-to-lead. The traditional GTM metric has been how fast you follow up on a lead that raises their hand. In the agentic future, the competitive metric becomes how fast your system detects a buying signal before the prospect even self-identifies. The teams that see intent earliest and respond fastest will capture disproportionate pipeline, and the gap between signal-aware and signal-blind organizations will widen dramatically.
We're not fully there yet, but the trajectory is clear. The GTM engineering teams that are building signal infrastructure today are laying the foundation for agentic systems tomorrow. The teams that wait will find themselves trying to retrofit autonomous capabilities onto legacy processes, and that's a much harder migration path.
In a nutshell…
Signal-based outbound workflows represent a genuine shift in how B2B SaaS teams generate pipeline. Instead of starting with a list and hoping for good timing, you start with a buying signal and engineer the right response. The five-step framework of detect, score, enrich, trigger, and learn gives GTM engineers a repeatable system that improves with every cycle.
The most important lesson from this entire piece is that signals alone aren't enough. You need ICP fit, intent confidence, and fast execution to convert a signal into a meeting. Teams that nail all three consistently outperform teams with better copy, larger SDR teams, or bigger tech budgets. Timing, when combined with relevance, is the most powerful lever in outbound.
If you're building a signal programme from scratch, start small. Pick one high-confidence signal type, like pricing page visits from ICP accounts, and build a single workflow that detects it, enriches the account, and alerts the right rep within hours. Measure the results against your existing cold outbound benchmarks. Once you prove the concept, expand to additional signal types and more sophisticated automation.
Track the metrics that connect to revenue, not activity. Signal-to-meeting rate, pipeline per signal source, and win rate by signal type tell you whether your programme is working. Open rates and send volumes don't.
For modern B2B SaaS teams, outbound should no longer start with a list. It should start with a signal, and the entire system you build around that signal is what separates engineered revenue from random activity.
Frequently asked questions about signal-based outbound workflows
Q1. What are signal-based outbound workflows?
Signal-based outbound workflows are automated sales systems that trigger outreach when buyers show real intent signals. These signals include website visits to high-intent pages, hiring announcements for relevant roles, funding events, product engagement spikes, and competitor research activity. Instead of relying on static lists or manual prospecting, the workflow detects buying behavior in real time and routes the right action to the right rep, making outreach timely and relevant rather than random.
Q2. Why are signal-based workflows better than cold outbound?
Signal-based workflows improve every key variable in the outbound equation: timing, relevance, reply rates, and rep efficiency. Cold outbound relies on volume, hoping that enough emails create enough conversations. Signal-based outbound targets accounts when their interest is highest, which means fewer emails generate more meetings. Reps spend less time researching and more time selling, and prospects receive outreach that actually matches where they are in their buying process.
Q3. What signals work best for B2B SaaS outbound?
The highest-converting signals for B2B SaaS include pricing page visits from multiple stakeholders, competitor research activity on review sites, hiring growth for roles your product supports, trial and product usage expansion, executive hires at target accounts, and multi-user engagement from the same company domain. First-party signals tend to be more reliable than third-party ones, but the strongest programmes layer both together and filter for ICP fit before triggering outreach.
Q4. Who typically owns signal workflows in a GTM team?
Signal workflows are usually owned by GTM engineers, RevOps teams, or growth operations professionals. These roles sit at the intersection of sales strategy, data infrastructure, and workflow automation. They work closely with sales and marketing to define which signals matter, build the detection and routing logic, and measure downstream impact on pipeline and revenue. In some organizations, this function lives within a centralized revenue team that spans both sales and marketing operations.
Q5. How does Factors.ai help with signal-based outbound?
Factors.ai provides the unified signal layer that many GTM teams struggle to build on their own. It brings together account signals from your website, CRM, and ad platforms into a single view, identifies in-market companies that match your ICP, reveals engagement trends over time, and helps teams understand which accounts are genuinely warming up versus just browsing casually.
Instead of relying on static lead lists or guesswork, sales teams can prioritize outreach based on real buying intent, recent activity, funnel stage, and fit. That means reps spend less time chasing cold accounts and more time speaking to companies already showing signs of interest.
It also helps marketing and sales work from the same playbook. Marketing can drive the right accounts into campaigns, while sales can act on those signals quickly with timely, personalized outreach. The result is outbound that feels sharper, faster, and far more relevant.

Waterfall data enrichment workflow: a practical guide for GTM engineers
Learn how GTM engineers build waterfall data enrichment workflows that improve match rates, lower tool costs, and power better outbound.
TL;DR
- A waterfall data enrichment workflow sends records through multiple data vendors in sequence, so each provider only fires when the previous one misses, which improves match rates and controls costs.
- No single vendor covers every geography, job function, or data field. Waterfalls combine strengths instead of betting on one source.
- Provider order should be driven by your ICP, not generic vendor rankings. A US mid-market SaaS motion needs a different sequence than an EMEA enterprise one.
- The biggest hidden cost in enrichment isn't credits. It's bad data entering your CRM and corrupting routing, scoring, and outbound.
- Start with one funnel stage, two or three complementary vendors, and a clear confidence threshold. Measure by pipeline impact, not fill rate.
Ever seen a GTM team that collects data vendors the way some people collect skincare serums? One for emails, one for mobiles, one for intent, one “specialist” tool for EMEA… and another because the founder met them at an event. Six contracts later, the CRM still looked like a family WhatsApp group: duplicate names, missing numbers, random job titles, and at least three people listed as “Head of Growth????”
That’s usually how the problem starts… with the belief that buying more data automatically creates better data. It doesn’t. It creates overlap, gaps, conflicting records, and a finance team slowly losing the will to live.
Now… B2B teams stopped asking, “Which provider is best?” and started asking, “How do we make multiple providers work intelligently together?” That question leads to waterfall enrichment.
Waterfall enrichment is a sequencing model where your records pass through providers one by one, in a deliberate order. If the first source can’t find a direct email, the next one tries. If mobile is missing, another source steps in. If firmographics are stale, a specialist vendor refreshes them. You only pay for what you need, when you need it.
It’s like… Ocean’s Eleven, and everyone has a role, but nobody needs to do everything. Before we move ahead, here’s a cute meme for you…

In this guide, I’ll break down how waterfall enrichment works, how modern GTM teams decide provider order, what fields are actually worth enriching, and why this approach often beats throwing budget at one “all-in-one” data platform that promised the moon and delivered a CSV.
What is a waterfall data enrichment workflow?
A waterfall data enrichment workflow is a system where records pass through multiple data vendors in a predefined sequence. If the first provider returns a match, great, the record moves on. If it fails or returns low-confidence data, the record cascades to the next provider in line. Then the next, and so on, until the record is enriched or the waterfall is exhausted.
The logic is straightforward. Think of it like calling a list of restaurants on a Friday night. You try your first choice, and if they're fully booked, you move to the second. You don't call all ten at once and pay ten cover charges. You work down the list until you get a table.
The reason this architecture exists is simple: no single vendor owns the truth. One provider might be excellent at US-based SaaS contacts and their work emails. Another might have superior coverage of EMEA mobile numbers. A third might specialise in firmographic data like revenue bands, employee counts, and tech stack signals. Each has strengths, and each has gaps. A waterfall lets you combine those strengths without paying for overlapping coverage.
Here's what makes a waterfall enrichment system distinctive from just "using multiple tools":
- Sequential logic. Providers fire in a deliberate order, not all at once.
- Higher coverage. You get composite match rates that exceed any single source.
- Cost control. Fallback vendors only process the records that earlier providers missed.
- Flexibility. You can enrich contacts, accounts, intent signals, and technographics through the same architectural pattern.
- Confidence scoring. Each step can include a threshold. If a provider returns data but at low confidence, the record still cascades.
Most teams think of enrichment as a data problem. Fill the empty fields, move on. But the real product of a waterfall isn't data. It's decision confidence. When your SDR picks up a lead, do they trust the email? When your routing logic assigns a territory, is the company size accurate? When your ABM campaign targets an account, is the firmographic data fresh?
A waterfall is a confidence engine. Every step in the sequence is designed to increase your team's trust in the record before it hits a human's workflow.
Why do GTM engineers choose waterfalls over a single provider?
The instinct to consolidate makes sense on paper. One vendor, one contract, one integration, one dashboard. It's clean. Marketing leaders often prefer this approach because it simplifies procurement and vendor management. But GTM engineers see the problem from a different angle, because they're the ones who deal with the downstream consequences when that single source falls short.
Here's what typically goes wrong with a single-source setup:
- Coverage gaps. Your vendor might cover 70% of your ICP, but the 30% it misses are often the exact accounts your sales team cares about most.
- Geography blind spots. A provider strong in North America might return almost nothing useful for UK, DACH, or ANZ contacts.
- Missing critical fields. You get emails but no phone numbers. Or you get titles but no department classifications.
- Stale job data. People change roles roughly every 2.5 years. A single provider's refresh cycle might not catch that quickly enough.
- Vendor lock-in. When renewal comes around, your negotiating power is essentially zero because switching costs feel enormous.
GTM engineers prefer waterfalls because they solve for outcomes. A waterfall delivers higher composite match rates, which directly translates to lower bounce risk in outbound sequences. It enables better routing logic because more fields are populated accurately. And the blended cost per enriched lead is often lower than a premium single-source contract, because fallback vendors only process the leftovers.
There's a mindset difference worth naming here. Marketing leaders tend to buy data tools. They evaluate vendors, compare feature lists, negotiate contracts. GTM engineers buy systems that survive scale. They think about what happens when lead volume doubles, when you expand into a new region, when a vendor's data quality degrades quietly over six months. A waterfall is designed for those realities. It's modular, so you can swap a vendor without rebuilding the whole pipeline. It's measurable, so you can track which provider is actually earning its cost. And it's resilient, because no single point of failure can tank your data quality overnight.
Industry conversations around B2B data enrichment have shifted noticeably in this direction. The consensus among RevOps and GTM engineering teams is that waterfall enrichment consistently outperforms single-source setups for coverage, especially when your ICP spans multiple segments or geographies.
How does a modern waterfall workflow actually work?
Understanding the concept is one thing. Seeing the architecture is another. Let me walk through what a real-world waterfall looks like, from input to CRM, with the decision points in between.
Where records enter the waterfall
Your waterfall needs a trigger, some event that creates or updates a record and kicks off the enrichment sequence. The most common input sources for B2B teams include:
- CRM leads and contacts created manually or via import.
- Demo request form fills from your website.
- Anonymous website visitors identified through reverse-IP or fingerprinting tools.
- Event and conference badge scans uploaded as CSV lists.
- Product signups from a free trial or freemium tier.
- Imported lists from partnerships, webinars, or co-marketing campaigns.
Each of these enters the waterfall at slightly different states of completeness. A demo form fill might already have a name, company, and email, but lack seniority and phone number. A website visitor record might have nothing but a company domain. The waterfall's job is to take whatever you've got and make it actionable.
The enrichment sequence, step by step
Here's a simplified version of how most GTM engineering workflows structure this:
- Normalise the company domain. Strip out subdomains, clean up formatting inconsistencies, and match to a canonical domain. This is the key that unlocks everything else.
- Check the CRM for existing records. Before you spend a single credit, see if the record already exists with usable data. Deduplication before enrichment saves real money.
- Query Provider A for primary fields. This is typically your strongest, broadest vendor. You're looking for work email, job title, seniority, and basic firmographics.
- If email is missing, cascade to Provider B. Provider B might specialise in contact discovery or have different sourcing methods that catch what A missed.
- If phone is missing, cascade to Provider C. Direct dials and mobile numbers are notoriously patchy. A dedicated phone-data provider often fills this gap.
- If confidence is low, run a verification pass. An email validation tool or phone verification API checks that what you've collected is actually deliverable.
- Push the enriched record to your CRM and sales engagement tool. Include source tags that identify which provider contributed each field.
- Trigger routing rules. With clean, enriched data, your lead routing logic can actually work. Assign by territory, segment, or account tier.
The tools GTM engineers commonly use to orchestrate this vary by team maturity. Some build directly in Clay, which handles multi-step enrichment natively. Others use n8n or similar workflow automation platforms. More mature teams build on Reverse ETL tools like Hightouch to sync enriched data from a warehouse back into the CRM. And some teams, especially at scale, build internal APIs that wrap vendor endpoints into a single enrichment service.
The key principle is that the waterfall is orchestrated, not manual. Nobody's logging into three vendor dashboards and copy-pasting results. The sequence fires automatically, the cascading logic runs on rules, and the output lands cleanly in the CRM with metadata attached.
A quick visual of the flow
What makes this architecture elegant isn't any single step. It's the fact that each step has a clear purpose and a clear condition. You don't waste vendor credits on records that are already complete. You don't skip verification just because a provider returned a result. And you never push untagged data into Salesforce where nobody can trace where it came from.
How should you choose the right provider order?
This is the section where most blog posts on waterfall enrichment get lazy. They'll tell you to "use the best provider first" and leave it there. That advice is useless because "best" depends entirely on who you're selling to.
The provider order in your waterfall should be driven by your ICP, not by some universal vendor ranking. A provider that's outstanding for US mid-market SaaS contacts might be mediocre for EMEA financial services. Your sequence needs to reflect your specific win conditions.
If you're selling to US SaaS mid-market
This is the most common ICP for B2B SaaS teams, and fortunately, it's also the best-covered by most data vendors. Your sequence might look like this:
- Lead with a provider that has strong US contact data. Names like Apollo, ZoomInfo, or Cognism often have dense coverage in this segment.
- Follow with an org-chart provider. If you need to map buying committees or identify multiple stakeholders at target accounts, a provider with organisational hierarchy data is valuable as a second step.
- Close with a mobile number specialist. Direct dials are the hardest field to source accurately. A dedicated provider as the final fallback maximises your chance of getting a usable number.
If you're selling to Europe
EMEA changes the calculus significantly. GDPR compliance isn't optional, and coverage from US-centric providers drops off sharply for markets like Germany, France, or the Nordics.
- Start with a GDPR-compliant source. Providers like Cognism or Lusha that have invested heavily in European compliance and sourcing should lead.
- Add a regional specialist. Some vendors focus specifically on DACH or UK contacts and have sourcing methods that global providers don't replicate.
- Finish with an email verifier. European email deliverability standards are strict, and bounce rates from unverified contacts will damage your sender reputation fast.
If you're running an ABM motion
ABM shifts the priority from individual contacts to account-level intelligence. Your waterfall's early steps need to focus on firmographics and signals before expanding to contacts.
- Firmographic data first. Revenue band, employee count, industry classification, HQ location. These determine whether the account even qualifies
- Buying signals second. Intent data, hiring patterns, technology adoption signals. These tell you whether the account is active in a buying cycle.
- Contact expansion third. Once you've confirmed the account is worth pursuing, you expand to individual contacts within the buying committee.
The critical takeaway here is to avoid ranking vendors globally. Rank them by win condition. Your ICP dictates the sequence, and if you serve multiple ICPs, you might need multiple waterfall configurations running in parallel.
I've seen teams spend weeks debating which vendor is "the best" as if it's a universal truth. The better question is: which vendor is best for the 60% of records that look like our closed-won deals from last quarter? Start there, and let the waterfall handle the rest.
Which fields are worth enriching (and which ones can you skip)?
Not all enrichment is created equal. Some fields directly impact revenue decisions, routing accuracy, and outbound performance. Others look useful in a dashboard but never actually influence a workflow. GTM engineers who've been through a few rounds of vendor evaluations learn this distinction quickly.
- High-value fields that earn their cost
These are the fields that, when populated accurately, change what your team can do:
- Verified work email. The foundation of outbound. Without it, nothing else matters.
- Seniority level. Knowing whether someone is a Director, VP, or IC determines messaging, routing, and whether they're a decision-maker.
- Department. Marketing, Sales, Engineering, Finance. This drives which sequence or campaign a contact enters.
- Revenue band. Determines segment (SMB, Mid-Market, Enterprise) and shapes everything from pricing to sales motion.
- Employee count. A proxy for company complexity and potential deal size.
- HQ geography. Drives territory assignment, compliance considerations, and timezone-aware outreach.
- Tech stack. Tells you what the prospect already uses, which influences competitive positioning and integration messaging.
- Hiring growth signals. A company actively hiring in your buyer's department is often a signal of budget and initiative.
- CRM owner history. Knowing who previously owned the account prevents embarrassing overlaps and wasted effort.
- Fields that teams over-invest in
Some fields sound valuable in a vendor pitch but rarely move the needle in practice:
- Random social media links. A prospect's Twitter handle almost never influences B2B outbound effectiveness.
- Vanity scores. Proprietary "fit scores" or "intent scores" from vendors that don't share their methodology are hard to trust or action.
- Excessive intent categories. Fifty granular intent topics sound impressive, but if your SDRs can't translate them into a personalised opening line, they're noise.
- Low-confidence phone numbers. A phone number that rings to a main switchboard or is six months out of date wastes more rep time than having no number at all.
The pattern I notice with most teams is this: they over-enrich noise and under-enrich routing fields. They'll pay for intent categories they never look at while leaving seniority and department blank because those fields "seemed basic." Basic fields are basic because they're essential. They power your lead scoring, your routing rules, your segment definitions. Without them, your fancy intent data has nowhere to go.
When you're building your waterfall, start by listing the fields that your routing logic, scoring model, and outbound sequences actually consume. Those are the fields worth enriching. Everything else is optional until those are covered.
Real-world use-cases for B2B teams
Waterfall enrichment is a pattern, not a product. The same architectural logic applies across very different GTM motions, but the specific implementation changes depending on the use case. Here are the ones I see most often in B2B teams that take their contact enrichment process seriously.
- SDR outbound
This is the most obvious use case and the one that usually justifies the first waterfall investment. The workflow is straightforward: identify target accounts, enrich them overnight or in real-time, auto-create contacts in the CRM, and surface them in the SDR's engagement tool by morning.
The waterfall's value here is direct. Higher match rates on email and phone mean more contacts per account that the rep can actually reach. Better title and seniority data means fewer messages wasted on contacts who aren't decision-makers. And because the waterfall tags each field with its source, your sales ops team can track which vendor is actually driving the conversations that lead to meetings.
One team I worked with went from a 55% email match rate with a single vendor to 78% with a three-provider waterfall. The cost per enriched lead dropped by about 20% because the fallback vendors were only processing the leftover records. The sales impact wasn't subtle.
- Inbound speed-to-lead
Every minute between a form submission and a sales response matters. Studies have shown the conversion rate drops dramatically after the first five minutes. A waterfall enrichment workflow that fires on form submission can enrich the record within seconds, before the routing logic even kicks in.
Imagine this: someone fills out your demo form with just their name and work email. In the background, the waterfall resolves their company, pulls firmographic data, identifies their seniority, checks for existing CRM records, and pushes the enriched lead into the right rep's queue. By the time the rep opens the notification, they already know they're talking to a VP of Marketing at a 200-person SaaS company. That context changes the entire conversation.
- ABM ad audiences
If you're running account-based advertising on LinkedIn or Google, the quality of your target account list determines everything. A waterfall can enrich your account list with firmographic and technographic data, then sync the enriched segments directly into your ad platforms.
The enrichment here isn't about individual contacts. It's about making sure your account list is accurately segmented by revenue, industry, tech stack, and geography so your ad spend goes where it matters. Without enrichment, you're targeting a generic list and hoping the platform's native targeting fills the gaps. With it, you're controlling the targeting yourself.
- Territory planning
Balancing sales territories fairly is a challenge that gets harder as your team grows. If your CRM data on company headcount, revenue, and geography is incomplete, your territory assignments will be skewed. Some reps get a book of high-potential accounts. Others get a book of unknowns.
Waterfall enrichment lets you fill those gaps systematically. Enrich every account in the CRM with employee count, revenue band, and HQ location, and suddenly your territory model has the inputs it needs to divide the book equitably. RevOps teams who've done this often discover that their old territory assignments were significantly imbalanced once the data gaps were filled.
- Pipeline attribution
This use case connects enrichment to revenue visibility, and it's where the value of the entire workflow becomes most tangible. When you can map anonymous website visitors to enriched account records, and then tie those accounts to pipeline and revenue, you've closed the loop between marketing activity and business outcomes.
Without enrichment, your anonymous traffic is just a number in Google Analytics. With it, you can say "we had 47 visits from target accounts this week, 12 of which are in active pipeline." That's the difference between marketing reporting and revenue intelligence. This is also where Factors.ai's relevance becomes particularly strong, but I'll get to that shortly.
Cost control, governance, and the match rate math
This section never gets the attention it deserves in enrichment conversations…. and that’s why we’ll spend some time here. Most teams focus on vendor features and match rates during the buying process, then don't revisit the economics until the renewal bill arrives. GTM engineers who treat enrichment as a system, not a purchase, think about cost structure from the start.
How does blended economics actually work?
The beauty of a waterfall is that you don't pay every vendor for every record. Your primary provider handles the bulk of the volume. The second provider only processes the records that the first one missed. The third provider only processes what both missed.
Here's a concrete example:
If you'd queried all three vendors for every record in parallel, your total cost would have been $100,000 (10,000 × $10). The waterfall achieves 92% coverage for roughly 28% of the parallel cost. That's not a marginal saving. It's a fundamentally different cost model.
The blended cost per enriched lead in this example is about$3. If you'd used only Provider A, you'd have 70% coverage at$2 per lead. The waterfall gets you to 92% at$3 per lead. That extra 22% coverage often represents the accounts your sales team cares about most, the ones that are harder to find.
Governance rules that prevent data rot
Cost control isn't just about vendor credits. The biggest hidden cost in enrichment is wrong data entering your CRM and silently corrupting everything downstream. A bad email means a bounced sequence. A wrong title means a misrouted lead. A stale company size means a deal that gets assigned to the wrong segment and the wrong rep.
Here are the governance rules that mature teams enforce:
- Never overwrite manually entered CRM fields. If a sales rep has updated a contact's phone number or title from a live conversation, that's the freshest data you have. Your enrichment workflow should respect it.
- Timestamp every enrichment source. Every field should carry metadata showing which provider populated it and when. This makes troubleshooting possible and vendor performance audits straightforward.
- Store confidence scores. If a provider returns a result with 60% confidence, treat it differently than one with 95% confidence. Your routing and scoring logic should consume confidence as an input, not just the field value.
- Re-enrich stale records on a 90 to 180-day cycle. People change jobs. Companies grow. Revenue bands shift. A record enriched six months ago might already be misleading your team.
- Audit duplicate vendors quarterly. Over time, teams accumulate overlapping data subscriptions. A quarterly review ensures you're not paying two vendors for the same coverage.
I've seen teams who obsess over vendor credit pricing while ignoring the cost of a bad Salesforce record that sends a deal down the wrong path. If you aren't measuring the accuracy of what enters your CRM, you're optimising the wrong thing.
Common mistakes GTM engineers make with waterfall enrichment
Even experienced GTM engineers stumble on some of these. Waterfall enrichment is conceptually simple, but the operational details have sharp edges that only show up at scale.
- Querying every provider for every record
This is the most expensive mistake and the most common one for teams transitioning from single-source enrichment. The whole point of a waterfall is conditional execution. If you're sending every record through every vendor "just to be safe," you're running parallel enrichment at waterfall's cost structure. Pick one approach and commit.
- No confidence thresholds
A match isn't a match isn't a match. Provider A might return an email with 95% confidence and Provider B might return one with 50% confidence. Without thresholds, your system treats both identically. Setting confidence floors, even simple ones like "only accept emails above 80% confidence," prevents low-quality data from entering your workflows.
- No deduplication before enrichment
If you don't check for existing CRM records before firing the waterfall, you'll burn credits enriching records you already have. Worse, you might create duplicates that confuse your routing and attribution. A CRM dedup check should always be the first step in the sequence.
- Overwriting rep-entered CRM data
Your SDR just had a call with a prospect who told them their direct number. Your enrichment workflow fires overnight and overwrites it with a switchboard number from Provider B. This happens more often than anyone admits, and it erodes sales team trust in the system.
- Ignoring stale data refresh cycles
Enrichment isn't a one-time event. B2B contact data decays at roughly 30% per year. If you enriched your database twelve months ago and haven't touched it since, nearly a third of it is suspect. Build re-enrichment into your workflow as a recurring process, not a one-off project.
- Buying more data before fixing routing logic
I've seen teams purchase a third enrichment vendor while their lead routing was still assigning leads randomly because the department field was empty. More data doesn't help if your system can't use the data it already has. Fix your routing and scoring logic first, then identify which missing fields are actually blocking those systems.
- No reporting on hit rate by vendor
If you don't measure which vendor is contributing what percentage of successful enrichments, your waterfall is just expensive plumbing. Monthly reporting on hit rate, cost per enriched record, and data quality by vendor is how you know whether your sequence is optimised or just running.
The common thread in all these mistakes is treating enrichment as a procurement problem rather than an engineering problem. Buying data is easy. Building a system that turns data into reliable decisions at scale is the actual work.
How does Factors.ai fits into the waterfall enrichment workflow?
Most enrichment tools solve the same problem: fill in missing fields on a known record. Factors.ai occupies a different position in the workflow because it starts a step earlier, at the point where you don't even know who's on your website yet.
Here's where Factors.ai connects to the waterfall pattern:
- Identifying anonymous website companies
Before you can enrich a record, the record has to exist. Factors.ai resolves anonymous website traffic into company-level identities. That gives your waterfall an entirely new input source: accounts that are actively visiting your site but haven't filled out a form.
- Enriching accounts before sales outreach
Once Factors.ai identifies a visiting company, that account can enter your enrichment waterfall. The result is a fully enriched account record, with firmographics, contacts, and engagement context, ready for outbound before the prospect has ever raised their hand.
- Triggering account scoring models
Enriched account data feeds your scoring logic. Factors.ai combines website engagement signals with enrichment data to help you prioritize which accounts are worth pursuing right now, not just which accounts look good on paper.
- Syncing audiences to LinkedIn and Google
Enriched account segments can be pushed directly into ad platforms for retargeting or ABM campaigns. This closes the gap between your enrichment system and your paid media execution.
- Connecting enrichment to pipeline outcomes
This is the piece most enrichment tools don't touch. Factors.ai lets you see which enriched accounts actually progressed through pipeline and which ones converted. That feedback loop is what turns enrichment from a cost centre into a measurable revenue input.
- Showing which enriched accounts actually convert
When you can tie enrichment back to closed revenue, you can calculate the actual ROI of your waterfall. Not just "we enriched 10,000 records" but "the records we enriched sourced$4.2 crore in pipeline this quarter."
- Many tools enrich records
Factors.ai helps enrich the decisions your team makes about which accounts to pursue, when to pursue them, and how to measure whether the pursuit was worth it. That's a different category of value than filling in a phone number.
How do you build your first waterfall workflow in seven steps?
If you've read this far and you're ready to build, here's a practical checklist that takes you from "we should do waterfall enrichment" to "it's running and measurable." The goal is to start focused, prove value quickly, and expand from there.
Step 1: Define your ICP segments
Before you choose a single vendor, write down who you're actually selling to. Industry, company size, geography, department of your buyer, seniority of your buyer. Be specific. "B2B SaaS companies in the US with 50 to 500 employees" is a segment. "Companies that might buy our product" is not.
Your ICP definition drives everything downstream: which vendors to evaluate, what order to put them in, and which fields to prioritise. Skip this step and you'll build a waterfall optimised for the wrong audience.
Step 2: List the fields that impact revenue decisions
Go through your lead scoring model, your routing rules, and your outbound sequences. Which fields do they actually consume? If your routing depends on company size and geography, those are high-priority enrichment fields. If your scoring model uses department and seniority, those go on the list too.
Be ruthless here. Only list fields that directly influence a workflow or decision. "Nice to have" fields can come later.
Step 3: Benchmark your current missing-field rates
Pull a report from your CRM showing what percentage of records are missing each of the fields you identified in Step 2. This gives you a baseline. If 60% of your leads are missing seniority data, you know exactly what your waterfall needs to fix first.
This step also reveals which fields are your biggest bottleneck. Some fields might already be at 90% coverage and don't need waterfall treatment. Others might be at 30% and are actively breaking your workflows.
Step 4: Choose two to three vendors with complementary strengths
Notice I said complementary, not "best." You want vendors whose coverage overlaps as little as possible. If Provider A is strong in US email but weak in EMEA phone, Provider B should be the reverse. Evaluate vendors against your ICP specifically, not their general marketing claims.
Request trial access and run a sample of 500 to 1,000 records from your CRM through each vendor independently. Compare match rates by field and by segment. This test takes a few days and saves you months of regret.
Step 5: Set routing and confidence logic
Define the rules that govern your waterfall. What confidence threshold triggers a cascade to the next provider? Which fields are mandatory versus optional? What happens when no provider returns a match? Do you flag the record for manual research or let it pass through unenriched?
Also decide your overwrite rules. Should enrichment data overwrite existing CRM values? For which fields? Under what conditions? These rules seem minor until the first time your enrichment workflow overwrites a rep's hand-entered data, and then they become very important very fast.
Step 6: Push into CRM with source tags
Every field that enters your CRM from the waterfall should carry metadata. Which provider supplied it, when it was enriched, and what the confidence score was. This isn't just good hygiene. It's the foundation for vendor performance reporting and data quality audits.
Set up your CRM fields to accommodate this metadata. Most teams use custom fields or a structured notes field. The exact implementation depends on your CRM, but the principle is non-negotiable: untagged enrichment data is untraceable enrichment data.
Step 7: Review monthly by pipeline impact, not vanity fill rate
This is where most teams get the measurement wrong. They track "percentage of fields filled" as their primary metric and call it a day. Fill rate is a fine operational metric, but it doesn't tell you whether your enrichment is actually working.
The metrics that matter are downstream: Has outbound reply rate improved? Has lead routing accuracy increased? Are reps spending less time researching contacts? Most importantly, has pipeline from enriched records grown? If you can connect enrichment to pipeline impact, you've built a system that justifies its own budget. If you can only show fill rates, you've built a cost line that finance will question every quarter.
One last piece of advice: start with one funnel stage, not your whole database. Pick inbound leads, or a specific outbound segment, or your ABM target account list. Build the waterfall for that slice, prove it works, measure the impact, and then expand. Teams that try to enrich everything on day one end up with a complex system and no clear evidence that it's working.
In a nutshell…
Waterfall data enrichment workflows exist because the B2B data landscape is fragmented by design. No single vendor covers every geography, every job function, every field your team needs. Instead of hoping one provider will solve everything, GTM engineers build sequential systems that combine multiple vendors' strengths while controlling costs.
The architecture is straightforward: records cascade through providers in a deliberate order, each vendor only fires on what the previous one missed, and every field enters the CRM with source tags and confidence scores. The economic model is compelling because you pay progressively, not universally.
What separates teams that get real value from this pattern is discipline. They define their ICP before choosing vendors. They prioritize fields that drive routing and scoring, not vanity metrics. They set confidence thresholds and overwrite rules. They measure by pipeline impact, not fill rate. And they treat enrichment as a recurring process, not a one-time project.
If you're just getting started, pick one funnel stage, two or three complementary vendors, and a clear set of fields that actually matter to revenue. Start small, instrument everything, and learn where your gaps really are before adding more complexity. You do not need a sprawling RevOps science experiment on day one. You need a system that works reliably.
Because that’s the real shift here. Good enrichment is not about having the most providers or the biggest database. It’s about getting the right data to the right team at the right moment, without wasting money or polluting your CRM in the process.
In a market where speed matters, territory precision matters, and sales teams have zero patience for bad records, waterfall enrichment stops being a backend nice-to-have. It becomes operating leverage.
FAQs for waterfall data enrichment workflow
Q1. What exactly is a waterfall data enrichment workflow?
A waterfall workflow is a sequential system where a record (lead or account) is sent to multiple data vendors in a specific order. If Vendor A fails to find a match or returns low-confidence data, the record "cascades" to Vendor B, then Vendor C. This process continues until the required fields are filled or all providers are exhausted.
Q2. Why should I use a waterfall instead of one premium provider?
No single data vendor has 100% coverage. A provider might be elite at US-based SaaS contacts but have massive blind spots in EMEA or APAC. Using a waterfall allows you to:
- Increase Match Rates: Blending multiple sources typically pushes match rates 20–40% higher than any single tool.
- Reduce Costs: You only pay for credits from secondary vendors when your primary (usually cheaper) vendor misses.
- Improve Accuracy: You can set "confidence thresholds" so that low-quality data from one vendor is automatically challenged by another.
Q3. How do I decide the order of my vendors?
The order should be determined by your Ideal Customer Profile (ICP) and geography, not vendor popularity.
- Primary Vendor: Your most cost-effective tool with the broadest coverage for your main market.
- Secondary Vendor: A specialist in the gaps of your primary tool (e.g., a specialist in mobile numbers or European GDPR-compliant data).
- Final Fallback: A high-cost, high-accuracy "premium" source that you only use for the hardest-to-find records.
Q4. Which fields are most important to enrich?
Focus on the fields that drive routing, scoring, and messaging. GTM engineers prioritize:
- Verified Work Email: The absolute baseline for outbound.
- Seniority & Department: Essential for routing leads to the right sales pod.
- Revenue & Employee Count: Used to segment accounts (SMB vs. Enterprise).
- Technographics: Knowing a prospect's tech stack (e.g., "Do they use Salesforce?") allows for highly personalized outreach.
Q5. How does Factors.ai fit into this workflow?
Most enrichment tools require you to already have a lead's name or email. Factors.ai starts a step earlier by identifying anonymous website visitors at the company level. Once a high-intent company is identified, it can be pushed into your waterfall workflow to find the right contacts (e.g., the VP of Marketing) before they even fill out a form.
Q6. What are the common "hidden costs" of enrichment?
The biggest cost isn't vendor credits; it's bad data integrity.
- Overwriting Rep Data: If a rep manually enters a phone number from a live call, your workflow should never overwrite it with automated data.
- Data Decay: B2B data decays at roughly 30% per year. Without a "refresh" cycle (re-enriching every 90–180 days), your CRM will eventually be filled with "ghost" contacts.

Automated sales prospecting tools: Streamlining outreach & lead generation
Learn how automated sales prospecting tools improve outreach, lead quality, and pipeline growth for B2B teams using smarter signals and workflows.
TL;DR
- Automated sales prospecting replaces guesswork with data-driven targeting, helping B2B teams identify the right accounts at the right time instead of blasting cold lists.
- Most prospecting is a prioritization problem, where reps spend hours on accounts that were never going to convert.
- The strongest prospecting stacks work in four layers: data collection, intelligence and scoring, automated action, and revenue measurement.
- Predictive sales intelligence shifts the focus from "who fits your ICP" to "who is actively changing in ways that signal buying intent right now."
- First-party signals from your own website, ads, and CRM consistently outperform third-party databases for building warm, high-conversion prospect lists.
It's 9:14 on a Monday morning… your SDR team is already deep into a spreadsheet someone exported from LinkedIn Sales Navigator last Thursday. Half the contacts have moved companies… a quarter of them work at organizations that don't remotely match your ICP. By the time anyone picks up the phone or sends a personalized email, the list is stale and the day is half gone. You've seen this cycle before… everyone has.
The irony is that the people responsible for filling your pipeline spend most of their time on work unrelated to selling.
This is the problem automated sales prospecting was built to solve… not by making reps faster at doing the wrong things, but by fundamentally changing what they spend their time on. When the right signals surface the right accounts at the right moment, your team stops guessing and starts acting on real buyer behavior. The shift sounds incremental on paper, but it transforms how pipeline gets built.
Over the next few sections, I'm going to unpack how modern B2B prospecting tools actually work, what separates the genuinely useful ones from the noise, and where most teams go wrong even after they invest in automation. Whether you're an SDR leader tired of watching reps burn hours on research or a RevOps leader trying to connect marketing signals to sales action, this piece is designed to give you a practical, opinionated framework.
What is automated sales prospecting?
I’ll get to the definition first… automated sales prospecting is the use of software, data enrichment, AI, and workflow logic to identify ideal accounts, prioritize leads, personalize outreach, and trigger sales actions. All without relying on manual spreadsheets, gut instinct, or the kind of guesswork that makes pipeline forecasting feel like astrology.
That definition needs an immediate clarification, though. Automated prospecting isn't the same thing as spam automation. The distinction matters more than most people realize. Spam automation takes a bad list and blasts it faster. Automated prospecting takes a smart list and acts on it more effectively. One creates noise. The other creates pipeline. The tools are similar; the intent and architecture behind them are completely different.
To make it more tangible, here's what automated prospecting looks like in practice. It's identifying companies visiting your pricing page before your rep even knows they exist. It's alerting an SDR when a target account's intent score spikes after they attended a webinar and clicked a retargeting ad in the same week. It's auto-building ICP-matched lists from first-party engagement data rather than purchased contact databases. It's triggering a personalized email sequence the moment a dormant account re-engages with your content.
You'll notice something about all those examples. None of them start with "send more emails." They all start with a signal, an observable behavior that suggests someone might be ready for a conversation. That's the biggest mental shift teams need to make. The primary value of automation isn't speed. It's the removal of randomness from pipeline creation. When you stop relying on volume and start relying on signals, your conversion rates change dramatically and your reps stop dreading Monday mornings.
Think of it this way. A sales team without automation is playing darts in the dark. A sales team with good automation still has to throw the darts, but someone turned the lights on first.
Why does manual prospecting break at scale?
Manual prospecting works fine when you've got three reps and fifty target accounts. Everyone knows the list, everyone remembers who they called last week, and nobody steps on each other's toes. That's a nice stage of company life, and it doesn't last very long.
The moment you scale to twenty reps, five hundred accounts, and multiple go-to-market motions running simultaneously, the cracks become impossible to ignore. SDRs start spending the first two hours of every day researching accounts instead of reaching out to them. Reps contact companies too early, before any buying intent exists, or too late, after the prospect already signed with a competitor. Duplicate outreach happens across teams because nobody has a shared view of who owns what. Your CRM decays steadily as contacts change jobs, companies get acquired, and firmographic data goes stale without anyone updating it.
The numbers paint a pretty grim picture of how reps actually spend their time. Research consistently shows that salespeople dedicate less than a third of their working hours to actual selling. The rest goes to administrative tasks, data entry, internal meetings, and the kind of lead research that automation was specifically designed to eliminate. That ratio gets worse as your team grows, because complexity multiplies faster than headcount.
Here's the part that most sales leaders don't say out loud, though. The core problem with manual prospecting at scale isn't that reps are lazy or undisciplined. It's that prioritization is genuinely hard when you don't have signal data. When every account on the list looks roughly the same on paper, reps default to recency bias, alphabetical order, or whoever they happen to remember from last quarter's pipeline review. Most prospecting problems are actually prioritization problems disguised as activity problems. Teams don't need to make more calls. They need to make the right calls, and the only way to do that consistently at scale is to let data and automation handle the sorting.
The thing is that high-volume, low-conversion outbound isn't just inefficient. It actively damages your brand. When prospects receive generic outreach that demonstrates zero awareness of their situation, they form impressions that are hard to reverse later. Manual prospecting at scale doesn't just fail to work. It creates a negative compound effect that makes future outreach harder.
How do modern prospecting tools actually work?
Most people think of prospecting tools as fancy contact databases with an email button attached. That's like describing a car as a metal box with wheels. Technically correct, but it misses everything that matters about how it actually functions.
Modern automated lead generation platforms work in four distinct layers, and understanding those layers changes how you evaluate and buy these tools. Too many teams skip straight to the action layer and wonder why their results are mediocre. So let's walk through all four.
Layer 1: the data layer
This is the foundation. It's where the tool collects and organizes raw information about potential accounts and contacts. Firmographics tell you the company size, industry, revenue range, and location. Technographics reveal what software they already use. Hiring signals show you which departments are growing. Website visit data captures anonymous traffic from target accounts. Engagement data from your ads, emails, and content rounds out the picture.
Without a clean, reliable data layer, everything built on top of it falls apart. Garbage in, garbage out applies to sales prospecting with the same severity it applies to everything else in data science.
Layer 2: the intelligence layer
This is where raw data becomes actionable insight. The intelligence layer applies scoring models, intent prediction, and account prioritization logic to determine which accounts actually deserve attention right now. Not every company that fits your ICP is worth pursuing today. The intelligence layer separates "good fit" from "good fit that's actively showing buying signals."
Account prioritization software sits squarely in this layer. It takes signals from the data layer and translates them into ranked lists, heat scores, or tiered segments that help reps focus their energy where it's most likely to produce results. This is the layer most teams underinvest in, and it's the layer that makes the biggest difference.
Layer 3: the action layer
Now we're in familiar territory. The action layer is where outbound sales automation lives. Email sequences get triggered. CRM records get updated. Tasks get routed to SDRs. Alerts fire when high-priority accounts engage. Contacts get added to nurture campaigns or meeting booking flows.
Most teams buy tools primarily for this layer, because the outcomes are visible and tangible. But here's the contrarian insight that most prospecting blog posts won't tell you: the action layer is only as good as the intelligence layer feeding it. Automating outreach without intelligent prioritization is just automating noise. You're sending faster, not smarter.
Layer 4: the measurement layer
The final layer connects prospecting activity to revenue outcomes. Meetings booked. Opportunities created. Pipeline sourced. Deals closed. Without this layer, you're measuring vanity metrics like emails sent and open rates, which tell you almost nothing about whether your prospecting is actually working.
The measurement layer is what allows you to iterate. It shows you which workflows produce pipeline, which signals actually predict conversion, and where your process leaks value. Teams that operate without it are flying blind, optimizing for activity rather than outcomes.
The mistake I see repeatedly is teams shopping for Layer 3 tools when their real bottleneck is Layer 2. They've got plenty of outreach infrastructure but no intelligent prioritization feeding it. If your reps are busy but your pipeline isn't growing, the problem probably isn't your sequencing tool. It's the absence of a signal-driven intelligence layer telling reps who to prioritize and when.
Core features to look for in B2B prospecting software
Knowing the four layers is useful for understanding how prospecting tools work conceptually. But when you're actually evaluating platforms, you need a concrete checklist of capabilities. Not every tool covers every feature, and that's fine. What matters is knowing which ones are non-negotiable for your team and which ones are nice-to-have.
Here's what the best sales tools for B2B teams tend to include:
- CRM integration
If the tool doesn't sync cleanly with your CRM, you'll create data silos that make the rest of your stack less useful. Bi-directional sync is the standard now. Anything less creates friction your team will resent.
- Verified company and contact data
Enrichment quality varies wildly between providers. Look for tools that verify contact information regularly, not just at the point of initial collection. Bounce rates above five percent are a red flag that your data source isn't being maintained.
- Buying signal detection
This includes website intent, ad engagement, content downloads, and event attendance. The tool should surface accounts that are actively researching your category, not just accounts that passively match your ICP filters.
- Multi-touch attribution visibility
You need to see the full journey an account takes before it enters pipeline. Which channels influenced the account? Which touchpoints happened before the SDR's outreach? Without this visibility, you can't optimize your prospecting motions.
- Lead scoring
A scoring model that combines fit data with engagement data gives reps a reliable way to prioritize their daily work. Static scores based on firmographics alone aren't enough anymore. Dynamic scoring that updates in real time based on behavior is the benchmark.
- Sales workflow automation
Automated task creation, lead routing, and sequence triggers reduce the manual steps between signal detection and outreach. Every manual step is a place where deals slip through the cracks.
- Sequence triggers
The ability to automatically enroll accounts into specific outreach sequences based on behavior. For example, a pricing page visit triggers a different sequence than a blog content download.
- Territory routing
As your team grows, clean territory management becomes essential. The tool should route accounts to the right rep based on geography, segment, or account ownership rules without manual intervention.
- Reporting tied to revenue
Activity metrics are table stakes, and the reporting you actually need connects prospecting inputs to pipeline outputs. Meetings booked per workflow, opportunity conversion by signal type, and sourced pipeline by channel are the metrics that drive decisions.
One pattern I'd encourage you to resist is the temptation to buy six "best-in-class" point solutions and stitch them together with integrations and Zapier workflows. It sounds rational on paper, and it almost always creates a fragmented mess in practice. Fewer tools with cleaner data flows will consistently outperform a sprawling stack where data quality degrades at every handoff between systems. Your ops team will thank you later.
Predictive sales intelligence
If the previous sections described the machinery of automated prospecting, this section is about the brain. Predictive sales intelligence is what separates tools that help you prospect faster from tools that help you prospect smarter.
At its core, predictive sales intelligence refers to systems that analyze behavioral, firmographic, and intent signals to estimate which accounts are most likely to buy in the near future. Instead of treating your entire TAM as equally worth pursuing, these systems build probabilistic models that surface the accounts with the highest conversion likelihood right now. The difference between "who fits" and "who is ready" is the difference between a static list and a dynamic, prioritized pipeline.
The signals that feed predictive models are more diverse than most people expect. Funding rounds indicate a company has fresh capital and may be evaluating new vendors. Repeated visits to your category or pricing pages suggest active research behavior. Engagement with your paid ads across multiple sessions reveals sustained interest rather than casual browsing. Rapid employee growth in specific departments, like hiring five new SDRs in a quarter, signals that the company is investing in the exact function your product supports. Even competitor research activity, when detectable through intent data providers, can indicate a buying window.
The academic evidence behind this approach is increasingly solid. Machine learning models applied to account prioritization have shown measurable improvements in meeting booking rates across B2B contexts. That shouldn't surprise anyone. When you give reps a ranked list based on hundreds of behavioral signals instead of a flat spreadsheet sorted by company size, the quality of their conversations improves because the timing of their outreach improves.
Here's where I want to push the thinking a bit further than most articles go. The conventional wisdom says prospecting starts with ICP definition: "find companies that look like our best customers." That's necessary but insufficient. The future of prospecting isn't just "who fits." It's "who is changing right now." A company that matched your ICP six months ago and has been stable ever since is a worse prospect than a company that marginally fits your ICP but just raised a Series B, hired a new VP of Sales, and visited your website three times this week.
Change is the strongest buying signal. Predictive sales intelligence is, at its best, a system for detecting change at scale. Companies don't buy software because they're static. They buy because something shifted, a new leader, a new goal, a new pain point, a new budget, and the timing aligned with a vendor who showed up at the right moment. If your prospecting engine can identify those moments of change faster than your competitors can, you win the conversation before it even starts.
That's why I'd argue predictive intelligence is the single most important investment a B2B sales team can make in its prospecting stack. Better data is nice. Faster sequences are nice. But knowing which accounts to call this week, and why, is what actually creates pipeline.
Best automated sales prospecting workflows for B2B teams
Theory is important, but workflows are where prospecting actually happens. The difference between a team that "has automation" and a team that gets results from it usually comes down to whether they've designed specific, signal-driven workflows for their most common prospecting scenarios. Let me walk through five workflows that consistently produce pipeline for B2B teams using sales workflow automation.
Workflow 1: website intent to SDR alert
This is the foundational workflow, and it's surprising how many teams still haven't implemented it properly. When a target account visits your pricing page twice within a week, the system automatically creates a task for the assigned SDR with context about the visit. The rep doesn't have to check a dashboard or wait for a weekly report. They get a notification with the account name, pages visited, visit frequency, and any existing CRM data about the account.
The key to making this workflow effective is setting the right threshold. A single blog visit isn't enough signal. Two pricing page visits within seven days, or a combination of pricing and case study page visits, gives the rep enough confidence that the outreach won't feel random to the prospect.
Workflow 2: paid ad engagement to sales follow-up
Your marketing team spends significant budget running LinkedIn ads to target accounts. When one of those accounts actually clicks through and engages, that signal should route directly to the owning rep. The workflow is straightforward: target account clicks a LinkedIn ad, the system matches the account, and the rep receives a notification to follow up with context about which ad and campaign triggered the engagement.
This workflow bridges the gap between marketing spend and sales action in a way that manual handoffs never reliably achieve. It also gives your marketing team a direct line of sight into how their campaigns influence outbound conversations, which is the kind of cross-functional visibility that RevOps teams dream about.
Workflow 3: dormant pipeline revival
Every B2B company has a graveyard of closed-lost opportunities that went cold for reasons that had nothing to do with product fit. Budget got cut. Timing wasn't right. The champion left. When one of those accounts re-engages, visiting your website, downloading content, or clicking an ad, the system should automatically flag it for re-engagement.
The workflow triggers a re-open playbook: update the CRM status, assign the account back to the original rep or a new owner, and queue a personalised sequence that acknowledges the previous relationship. Dormant pipeline is one of the most underutilised assets in B2B sales, and this workflow turns it into a reliable source of warm opportunities.
Workflow 4: territory expansion signals
Your existing customer shows website traffic from a new geographic region you don't currently serve them in. Or their subsidiary in a different market starts researching your product category. The system detects the new engagement pattern and notifies the account executive responsible for expansion.
This workflow is particularly valuable for companies with land-and-expand motions. It surfaces growth opportunities that reps would otherwise miss because they're focused on their existing contacts within the account, not monitoring for new signals from adjacent parts of the organisation.
Workflow 5: champion movement tracking
Your best buyer champion just changed jobs. They moved to a new company that fits your ICP. This is one of the strongest buying signals in B2B, because that person already knows your product, already trusts your team, and is likely evaluating tools for their new role.
The workflow detects the job change through LinkedIn data or contact enrichment updates, identifies whether the new company fits your ICP, and triggers a referral outreach sequence. The messaging is warm and personal because the relationship already exists. Champion tracking is one of those workflows that feels almost unfair when it works, because the conversion rates are dramatically higher than cold outreach.
Each of these five workflows starts with a signal, not a calendar reminder or a manager's request. That's the design principle worth remembering. The best prospecting workflows are event-driven, not schedule-driven. They fire when something happens, not when someone remembers to check.
How Factors.ai improves prospecting with first-party signals
Most sales prospecting tools rely heavily on third-party databases for their data layer. Those databases are useful, but they come with inherent limitations. The data is shared with every competitor who subscribes to the same provider. It decays faster than vendors acknowledge. And it often lacks the granularity needed to determine whether an account is actively engaged with your brand, or just passively sitting in a segment that matches your filters.
Factors.ai takes a different approach by building prospecting intelligence from your own first-party data. That distinction matters more than it might seem at first glance.
Here's what that looks like in practice. Factors.ai captures website visitor intelligence, identifying which companies are visiting your site even when individual visitors don't fill out a form. It connects CRM opportunity data to upstream marketing activity, so you can see the full journey an account took before it became pipeline. It pulls in ad engagement signals from your paid campaigns, showing you which target accounts are responding to your LinkedIn or Google ads. And it maps attribution paths across channels, giving you a clear picture of how accounts move from awareness to engagement to sales conversation.
All of this combines into account-level journey visibility. Your reps don't just get a list of companies that fit your ICP. They get a ranked view of companies that are actively engaging with your brand across multiple channels. The difference between "this company matches your filters" and "this company visited your pricing page twice, clicked your LinkedIn ad, and downloaded your integration guide this week" is the difference between cold outreach and warm, informed prospecting.
The practical implication is significant. Your best prospecting list is often already on your website. You just haven't identified it yet. Factors.ai makes that identification possible without requiring prospects to self-identify through form fills or demo requests. For teams running ABM motions or coordinating sales and marketing signals through a RevOps function, that first-party intelligence layer becomes the connective tissue between marketing spend and sales action.
The platform's approach also solves a problem that plagues teams using multiple disconnected tools. When your website data, ad data, CRM data, and attribution data all live in one system, you don't have to stitch together account journeys manually. The signals are already unified, which means your reps can act on them immediately instead of waiting for someone in ops to build a report.
How do you choose the right sales intelligence solution?
Not every team needs the same prospecting stack, and buying the wrong tool for your stage is one of the fastest ways to waste budget while creating shelfware that nobody uses. The right sales intelligence solution depends heavily on your company's size, sales motion, and existing infrastructure. Here's how I'd think about the decision across three common scenarios.
- Early-stage SaaS (under 50 employees, small sales team)
At this stage, you need speed and affordability above all else. Your ICP is still evolving. Your sales process isn't fully codified. You don't have a RevOps team to manage complex integrations. The right move is a simple enrichment tool paired with a sequencing platform that gets reps into conversations quickly. Look for tools with low setup time, clean contact data, and basic CRM sync. Don't overthink scoring models or attribution at this stage, because you don't have enough data volume to make those features meaningful yet.
- Mid-market B2B (50 to 500 employees, growing sales org)
This is where the prioritization layer becomes critical. You've got enough pipeline volume that reps can't manually evaluate every account. You need signal-based scoring, clean lead routing, and tight CRM integration. Look for platforms that offer buying intent signals, territory management, and the ability to trigger workflows based on account behavior. Your ops team should be able to configure routing rules without engineering support.
- Enterprise (500+ employees, complex go-to-market)
Enterprise teams need governance, territory controls, custom scoring models, and attribution reporting that connects prospecting activity to revenue outcomes. The tool needs to support multiple sales motions running simultaneously without data conflicts. Role-based access, audit trails, and custom reporting become non-negotiable at this scale. Look for platforms that offer API flexibility and play nicely with your existing data warehouse.
If you already run paid ads to target accounts
There's a fourth scenario worth calling out specifically. If your marketing team invests meaningful budget in paid campaigns targeting named accounts, you should strongly consider platforms that unify marketing and sales signals in a single view. The biggest leak in most ABM motions is the gap between ad engagement and sales follow-up. When those signals live in separate systems, the handoff between marketing and sales is slow, lossy, and often invisible. A platform that captures ad engagement alongside website intent and CRM data eliminates that gap.
The meta-principle across all four scenarios is the same: buy for the bottleneck you actually have, not the bottleneck you imagine having eighteen months from now. Overbuying tooling is nearly as harmful as underbuying it, because unused features create complexity without creating value.
Common mistakes teams make with prospecting automation
Buying the right tools is half the battle. Using them correctly is the other half, and this is where a surprising number of teams stumble. After watching dozens of B2B teams implement prospecting automation, I've noticed the same mistakes recurring with almost predictable regularity. Let me walk through the most common ones so you can sidestep them.
- Automating bad ICP lists
Automation amplifies whatever you feed it. If your ICP definition is vague or outdated, automation just helps you reach the wrong accounts faster and in greater volume. Before automating anything, pressure-test your ICP against your actual closed-won data from the last twelve months. If your ICP says "mid-market SaaS" but your best customers are all financial services companies with 200 to 500 employees, your automation will be optimized for the wrong audience.
- Measuring emails sent instead of meetings created
This one is depressingly common. Teams implement outbound sales automation and then celebrate activity metrics: emails sent, sequences completed, open rates. None of those metrics tell you whether your prospecting is actually creating pipeline. The only metrics that matter are meetings booked, opportunities created, and pipeline sourced. Everything else is an intermediate indicator at best and a vanity metric at worst.
- Ignoring inbound signals while chasing cold outbound
Some teams invest heavily in outbound automation while completely ignoring the fact that their website is generating intent signals from accounts that are already interested. Warm signals from inbound behavior almost always convert at higher rates than cold outbound to accounts that haven't engaged with your brand. A balanced prospecting strategy works both channels and prioritizes accounts showing active engagement.
- No ownership between sales and marketing
Prospecting automation works best when there's clear ownership of the handoff between marketing signals and sales action. If marketing generates intent signals but nobody on the sales side is responsible for acting on them within a defined SLA, those signals expire, and the investment is wasted. The workflow needs a named owner on both sides.
- Too many tools, no system
I mentioned this earlier, but it's worth repeating because it's so prevalent. Six disconnected tools with manual integrations create more work than they save. Data degrades at every handoff between platforms. Reps lose trust in the system because the data they see in one tool contradicts what they see in another. A smaller, well-integrated stack almost always outperforms a sprawling one.
- Using AI personalization with zero relevance
The latest trend is using generative AI to "personalize" outreach at scale. The problem is that AI-generated personalization often reads as exactly what it is: a machine-generated sentence inserted at the top of a template. If the underlying signal driving the outreach isn't relevant to the prospect's actual situation, a personalised first line doesn't save it. Bad prospecting at scale is just faster irrelevance, regardless of how clever the opening sentence sounds.
The common thread across all six mistakes is the same: teams focus on the automation part and neglect the intelligence part. The tools aren't the problem. The inputs, logic, and measurement frameworks surrounding them are where most implementations fall short.
What does the future of automated sales prospecting look like in the AI era?
Prospecting is shifting faster right now than it has in the last decade, and most of that acceleration is driven by AI capabilities that are moving from experimental to practical. Here's what I think the next two to three years look like for B2B teams investing in this space.
- AI research agents building account briefs. Instead of SDRs spending thirty minutes researching an account before writing an email, AI agents will compile account briefs automatically. They'll pull in recent funding news, leadership changes, technographic updates, social activity from key contacts, and relevant buying signals into a single brief that's ready when the rep starts their day. The research phase of prospecting is about to compress from hours to seconds.
- Intent scoring from first-party journeys. Third-party intent data has been the default for years, but it's noisy and shared with every competitor. The shift is toward first-party journey scoring, where the intent model is built from your own website, ad, and CRM engagement data. This produces sharper, more proprietary signals that your competitors don't have access to. Tools like Factors.ai are already moving in this direction, and the trend will only accelerate.
- Cross-channel signal orchestration. Right now, most teams process signals from different channels in isolation. Website intent sits in one tool, ad engagement sits in another, and CRM activity lives in a third. The future state is cross-channel orchestration, where a single platform combines all those signals into a unified account score that updates in real time. That score triggers different workflows depending on the signal combination, not just individual channel activity.
- Autonomous SDR workflows. We're not far from a world where certain prospecting workflows run entirely without human intervention. Account shows intent, system verifies ICP fit, AI generates contextual outreach, email sends, and a meeting booking link routes to the right rep's calendar. The human enters the picture at the conversation stage, not the research or outreach stage. That's a fundamental restructuring of the SDR role, and teams that embrace it early will have a significant productivity advantage.
Use real-time next-best-action prompts… instead of reps deciding what to do next based on their own judgment, the system will recommend the next best action for each account. "This account just visited your pricing page for the third time. Call now." Or "This dormant opportunity just re-engaged. Send the case study sequence." These prompts turn prospecting from a planning exercise into a response exercise, which is a much better use of human selling time.
The teams that win in this environment won't be the ones with the loudest outbound engines. They'll be the fastest signal responders, the teams that detect buying intent earliest and act on it with the most relevance. Speed-to-signal is replacing speed-to-send as the defining competitive advantage in B2B prospecting.
In a nutshell…
This article covered a lot of ground, so here's what I'd want you to walk away with.
Automated sales prospecting works when it combines five things: accurate data that doesn't decay between quarterly list refreshes, intelligent prioritization that ranks accounts by likelihood to buy rather than just ICP fit, timely outreach triggered by real engagement signals rather than calendar cadences, human messaging that demonstrates genuine understanding of the prospect's situation, and revenue measurement that connects prospecting activity to pipeline outcomes instead of email open rates.
The four-layer framework, data, intelligence, action, and measurement, gives you a practical way to evaluate your current stack and identify where the gaps are. Most teams are over-invested in the action layer and under-invested in intelligence. If your reps are busy but your pipeline isn't growing, that imbalance is probably the reason.
Predictive sales intelligence shifts prospecting from static list-matching to dynamic change detection. Accounts don't buy because they fit your ICP. They buy because something changed, and your team showed up at the right moment. Building your prospecting engine around first-party signals, the engagement data you already own from your website, ads, and CRM, gives you a signal advantage that third-party databases can't match.
The five workflows I outlined, from website intent alerts to champion movement tracking, give your team a concrete starting point for turning signal data into sales conversations. Pick the one that aligns most closely with your biggest pipeline gap and implement it first. Don't try to build all five simultaneously.
For B2B teams looking to build real pipeline rather than just send more emails, the next frontier is better timing on the right accounts. The tools exist. The signals are there. The question is whether your team is set up to detect and act on them faster than the competition.
Frequently asked questions about automated sales prospecting
Q1. What is automated sales prospecting?
Automated sales prospecting uses software, data enrichment, AI, and workflow automation to identify, prioritize, and engage potential buyers. It replaces manual research and guesswork with signal-driven targeting. The goal is to surface the right accounts at the right time, so reps spend their energy on conversations rather than list building.
Q2. Are automated prospecting tools worth the investment?
Yes, but only if they reduce manual work and improve opportunity creation, not just email volume. A tool that helps your team send ten thousand more emails per month but doesn't increase meetings booked is a cost center, not a growth lever. Evaluate ROI based on pipeline sourced and meetings created, not activity metrics.
Q3. What is predictive sales intelligence?
Predictive sales intelligence uses behavioral and firmographic signals to predict which accounts are most likely to buy in the near future. It analyses patterns like website visits, ad engagement, funding events, and hiring signals to rank accounts by conversion probability. The result is a prioritized list that helps reps focus on accounts with active buying intent rather than treating every ICP-matched company as equally worth pursuing.
Q4. What are the best sales tools for B2B teams?
The best stack for most B2B teams includes a CRM as the system of record, an enrichment tool for verified company and contact data, an intent signal platform for detecting buying behavior, a sequencing tool for automated outreach, and an attribution layer to connect prospecting to revenue. The specific vendors matter less than how cleanly the tools integrate with each other.
Q5. How does Factors.ai help with sales prospecting?
Factors.ai helps B2B teams identify engaged accounts using first-party signals from their website, paid ads, and CRM. It surfaces which companies are visiting your site, maps their engagement across channels, and provides account-level journey visibility. This allows sales teams to prioritize warm opportunities based on real engagement rather than relying solely on third-party data.
Q6. Can small B2B companies use prospecting automation?
Absolutely. Even startups with small sales teams can automate core prospecting workflows like ICP list building, lead routing, and outreach triggers based on website activity. The key for smaller teams is starting with one or two high-impact workflows rather than trying to automate everything at once. A simple workflow that routes pricing page visitors to your rep can meaningfully improve pipeline quality without requiring enterprise-grade tooling.

B2B SaaS go-to-market strategy: Aligning sales, marketing, and revenue goals
Build a B2B SaaS go-to-market strategy that aligns sales, marketing, and revenue teams for stronger pipeline, faster growth, and lower CAC.
TL;DR
- A B2B SaaS go-to-market strategy is the continuous operating system for how your company acquires, converts, and expands revenue every quarter.
- Most GTM strategies break because teams optimize for local metrics (leads, meetings, efficiency) instead of shared revenue outcomes, creating expensive misalignment.
- The modern GTM model is account-centric, built on buying signals, multi-touch influence, and full-funnel visibility rather than linear funnels and form fills.
- Aligning sales and marketing around shared metrics like qualified pipeline, opportunity rate, and CAC payback eliminates the finger-pointing that slows growth.
- Intent data, feedback loops, and revenue operations tie the engine together, but only when they trigger action rather than sit in dashboards.
Some B2B SaaS companies treat go-to-market strategy like a New Year’s resolution.
Big energy in January. Fancy plans. A few expensive tools. Bold declarations about pipeline. By March, sales is freelancing, marketing is boosting random campaigns, RevOps is stressed, and everyone is pretending the attribution model just needs “more time.”
I say this with love.
Most GTM problems don’t come from weak teams or weak products. They come from building growth around disconnected incentives. Marketing is rewarded for leads. Sales is rewarded for closed revenue. Finance wants lower CAC. Leadership wants faster growth. Nobody is technically wrong, which is exactly why it gets messy.
Meanwhile, your buyer is on a journey designed by committee. They click an ad, download a guide, get three emails, receive a cold call from someone who has no idea what they downloaded, then vanish forever into the CRM graveyard.
Iconic.
A proper B2B SaaS go-to-market strategy should make the business feel coordinated. The right accounts should be clear. Teams should know what matters. Metrics should connect to revenue. Buyers should feel understood, not processed.
This blog is for companies tired of operating like three separate startups sharing one logo. We’ll cover how to define your ICP properly, choose the right GTM motion, align teams around numbers that matter, and use intent data before competitors smell the opportunity first.
Because growth gets a lot easier when everyone stops playing different sports..
What is a B2B SaaS go-to-market strategy, really?
Most blog posts will tell you a go-to-market strategy is a plan for launching a product. That definition made sense in 2010 when software shipped once and sales teams did the rest. It doesn’t hold up in a world where SaaS companies reprice quarterly, release features biweekly, and enter new segments every year.
A better definition would be this… a B2B SaaS go-to-market strategy is the operating system for how your company acquires, converts, expands, and retains revenue. It’s the connective tissue between your ideal customer profile, your positioning, your pricing and packaging, your acquisition channels, your sales motion, your revenue ownership model, and your expansion playbook, as well as essential components such as messaging strategy, unique value proposition, pricing strategy, distribution channels, and thorough market research. Remove any one of those layers and the system develops cracks.
What makes SaaS GTM fundamentally different from traditional go-to-market planning is that it never stops. You don’t launch once and move on. Every quarter presents a new GTM moment that demands recalibration. Moving upmarket from SMB to mid-market is a GTM shift. Introducing a product-led growth motion alongside your sales-led one is a GTM shift. Expanding internationally, reducing CAC pressure, improving win rates against a specific competitor, all of these are GTM problems wearing different clothes.
The SaaS go to market strategy, then, isn’t a document you write before launch and file away. It’s a living system you revisit constantly. The companies that treat it that way tend to compound their growth. The ones that treat it as a one-time exercise tend to wonder why their metrics plateau after the initial traction wears off.
Think of it like an operating system for a computer. The hardware (your product) matters, but without an OS that coordinates everything, the machine doesn’t function well. Your GTM strategy is that coordination layer for revenue.
Why do most SaaS GTM strategies break?
Here's something that doesn't get said often enough: most SaaS growth strategies fail not because they lack ideas, but because they're assembled from disconnected departmental plans.
- Marketing builds a plan to hit lead targets. Sales builds a plan to hit quota. Finance builds a plan to improve unit economics. Product builds a plan for adoption. Customer success builds a plan for retention. Each plan looks reasonable in isolation. But nobody owns the full buyer journey from first anonymous visit to expansion revenue, and the gaps between these plans become expensive fast.
- The hidden tax of this misalignment shows up in specific, measurable ways. Paid spend generates a flood of leads that SDRs quietly ignore because they don't match what sales actually wants to work. SDRs who do engage those leads end up booking demos with accounts that were never a great fit. Sales closes some of those poor-fit deals to hit quarterly numbers. Then churn rises three quarters later, CAC payback stretches beyond anything the financial model assumed, and someone calls a meeting to "fix the funnel."
- A broken GTM strategy often looks busy from the outside and expensive from the inside. The dashboards show activity everywhere. Campaigns are running, sequences are firing, content is publishing, and reps are calling. But when you trace the path from spend to revenue, the leakage is staggering.
- The root cause is structural, not motivational. People aren't being lazy or difficult. They're responding rationally to their own incentive structures. When marketing is rewarded for MQL volume, they'll optimize for it. When sales is rewarded for closed-won revenue, they'll focus on deals they think they can close this quarter, regardless of long-term fit. The b2b gtm strategy breaks when each team's success metric can be hit while the company's overall revenue health deteriorates.
This fix: Fixing this isn't about adding more meetings or building bigger Slack channels. It requires rethinking what teams are measured on and how they share information. That's where the modern GTM model comes in.
The new GTM model: revenue alignment first
For years, the default SaaS funnel looked like a simple conveyor belt. Traffic flows in, leads get captured, demos get booked, deals get closed. It was clean, linear, and reassuring. It was also increasingly disconnected from how B2B buyers actually behave.
The old model assumed buyers followed a predictable sequence: see ad, click, fill out form, talk to sales, buy. The reality in most B2B buying cycles is far messier. Buyers self-educate extensively before they ever talk to your team. They read your blog, check your G2 reviews, ask peers on Slack communities, watch your webinar on 2x speed, and compare your pricing page against two competitors. By the time they fill out a demo form, they've already formed an opinion. And they did most of that research in channels you can't easily track, the dark funnel that marketing teams increasingly acknowledge but struggle to measure.
The modern go to market framework for SaaS reflects this reality. Instead of tracking a linear path from traffic to leads to demos, it starts with accounts and tracks buying signals across multiple touchpoints. The sequence looks more like this: identify target accounts, detect buying signals (site visits, ad engagement, content consumption, competitor research), influence those accounts through coordinated multi-touch campaigns, convert engaged accounts into qualified opportunities, and then expand revenue within those accounts over time.
This move from lead-centric to account-centric thinking changes everything about how teams operate. Marketing isn't just generating form fills. They're warming and influencing buying committees across channels. Sales isn't waiting for inbound leads. They're prioritising accounts that are already showing intent. Revenue operations isn't just reporting on what happened. They're routing signals in real time so teams can act.
Your GTM model should be account-centric, not form-fill centric. When you organize around accounts instead of individual leads, you naturally break down the walls between departments because everyone is looking at the same unit of analysis.
Step 1: How do you define your ICP by revenue potential?
Most companies define their ideal customer profile with two variables: industry and employee count. "We sell to mid-market SaaS companies with 200-1000 employees." That's a starting point, not a strategy. It describes a huge population of companies, most of whom will never buy from you.
A sharper ICP uses a four-layer model that goes well beyond firmographics.
- Layer 1: Firmographic. This is the baseline. Industry, company size, region, funding stage, business model. It tells you who could theoretically be a customer. Most teams stop here, and that's why their targeting stays broad.
- Layer 2: Technographic. What tools are they already using? What does their tech stack look like? A company running a mature marketing automation platform alongside a CRM signals very different readiness than one still managing contacts in spreadsheets. Stack maturity tells you how sophisticated their buying process is and how your product fits into their existing workflow.
- Layer 3: Behavioral. This is where it gets interesting. Which companies are visiting your high-intent pages like pricing, comparisons, and case studies? Which ones are clicking your ads repeatedly? Who's consuming competitor content or researching your category on review sites? Behavioral signals tell you who's actively in a buying cycle, not just who fits your demographic profile.
- Layer 4: Economic. What's the realistic deal size? Does this account have expansion potential, meaning multiple teams, growing headcount, or use cases that deepen over time? What's their likely retention profile based on similar customers you've served? This layer filters for accounts that don't just convert but stay long enough to be profitable.
The best ICP isn't defined by who can buy. It's defined by who buys fast, stays long, and expands. That distinction changes your entire targeting strategy because it shifts the conversation from volume to quality. You'd rather have 200 perfectly matched accounts in your pipeline than 2,000 that vaguely fit your firmographic criteria.
Tools like Factors.ai make this layered approach practical by identifying companies visiting your site anonymously. You don't need to wait for a form fill to know that a high-fit account is researching your category. When you can see that a Series B fintech with a mature tech stack has visited your pricing page three times this week, your ICP model moves from theory to action.
Step 2: How do you choose the right GTM motion?
Not every SaaS company should run the same playbook, and the GTM motion you choose should match your product's complexity, your average contract value, and the way your buyers actually make decisions. There are three primary motions, and most serious companies eventually evolve into a hybrid.
- Product-led growth (PLG) works best for low-friction products where individual users can sign up, experience value quickly, and eventually pull their team in. Think collaboration tools, developer utilities, and design platforms where the product itself does the selling. The beauty of PLG is its efficiency. The challenge is that it struggles when implementation requires multiple stakeholders, security reviews, or significant onboarding.
- Sales-led growth (SLG) fits high-ACV products with complex buying committees. When six people need to agree on a purchase and the contract involves legal review, procurement negotiation, and custom implementation, you need a sales team guiding that process. SLG is more expensive per acquisition but essential when deal complexity demands human navigation.
- Marketing-led growth (MLG) relies on strong content engines, inbound demand generation, and SaaS demand generation programmes that create category awareness and capture existing demand. It's powerful for building pipeline at scale but works best when combined with sales capacity to convert that demand into revenue.
Here's a comparison of when each motion fits:
Many founders copy PLG because it sounds modern and capital-efficient. But if your product implementation genuinely requires six stakeholders to agree, a security review, and a three-month onboarding, you need sales involved. There's no shame in that. The motion should match the buyer's reality, not the founder's aesthetic preference.
Most SaaS companies that reach meaningful scale end up running a hybrid motion. PLG handles the bottoms-up adoption and self-serve segment. Sales-led covers the upmarket deals. Marketing-led fuels the demand that feeds both. The trick is making these motions share data and operate against the same revenue targets rather than running as parallel tracks.
Step 3: How do you align sales and marketing around shared metrics?
If you only implement one idea from this entire piece, make it this one. Sales and marketing alignment isn't a culture problem. It's a measurement problem. When marketing is measured on MQL volume and sales is measured on closed-won revenue, conflict is guaranteed by design. The incentive structures literally pull in different directions.
Marketing optimizes for lead volume because that's what their dashboard rewards. They'll run campaigns that generate high form-fill rates regardless of lead quality. Sales ignores most of those leads because they've learned from experience that "marketing leads" rarely convert. Both teams then blame each other in the quarterly review, and leadership calls for "better alignment" without changing the underlying metrics.
The fix is to replace vanity KPIs with shared revenue metrics that both teams own. Here's what that shift looks like in practice:
When marketing knows they'll be evaluated on qualified pipeline rather than raw lead count, they start caring about lead quality. When sales knows that marketing's contribution to pipeline is visible and measured, they start engaging with marketing-sourced accounts more seriously. The SaaS revenue strategy becomes a shared language instead of a source of internal friction.
Account engagement scoring is particularly powerful here. Instead of arguing about whether a lead is "qualified" based on a form fill, both teams can look at the same account engagement score that aggregates website visits, ad interactions, content consumption, and sales touchpoints. A high engagement score means the account is active and warming. A low score means it needs more nurturing before sales invests time.
This shared measurement model doesn't eliminate healthy tension between teams. Sales will still push marketing for better targeting, and marketing will still push sales for faster follow-up. But that tension becomes productive because it's oriented around the same outcome rather than competing ones.
Step 4: How do you build a full-funnel channel strategy?
One of the most common mistakes in SaaS pipeline strategy is asking a single channel to do everything. I've seen teams expect SEO to generate bottom-funnel demos, paid ads to build long-term brand awareness, and webinars to somehow serve as the entire pipeline engine. Each channel has a natural strength, and the best GTM teams deploy channels deliberately at different funnel stages.
- Awareness channels
At the top of the funnel, you're trying to get on the radar of accounts that don't know you yet. SEO-driven content, thought leadership on LinkedIn, video ads, partnerships with complementary tools, and podcast appearances all work well here. The goal isn't conversions. It's recognition. You want decision-makers at your target accounts to have heard your name and associated it with a relevant point of view before they ever enter a buying cycle.
- Consideration channels
Once accounts are aware and exploring options, different channels take over. Retargeting campaigns keep you visible as they research. Webinars let you demonstrate expertise in a more interactive format. Comparison pages help buyers who are actively evaluating alternatives. ROI calculators give them a reason to engage with your value proposition concretely. Case studies provide the social proof that moves accounts from "interesting" to "credible."
- Decision channels
When accounts are close to a buying decision, the playbook shifts again. ABM campaigns targeted at specific buying committees deliver personalized messaging. Direct outreach from sales carries more weight when the account is already warmed. Peer proof, whether through customer references or community discussions, addresses the last-mile hesitation. Buying committee nurture ensures you're not just influencing one champion but reaching the CFO, the VP of Engineering, and whoever else has veto power.
The critical insight here is that each channel has a job description. SEO is not your SDR team. Paid ads aren't an onboarding experience. Webinars won't magically create pipeline if the accounts attending them don't match your ICP. When you assign channels to specific funnel stages and measure them against stage-appropriate metrics, your entire SaaS demand generation effort becomes dramatically more efficient.
A practical way to operationalize this is to map every active channel to a funnel stage and a specific metric. If LinkedIn video ads are an awareness channel, measure them on reach and engagement within your target account list. If comparison pages are a consideration asset, measure them on time-on-page and demo request rate. This clarity prevents the "is this channel working?" debates that consume hours in marketing meetings.
Step 5: How do you use intent data to prioritize accounts?
Here's where a modern B2B GTM engine gains its sharpest competitive edge. Every company in your market is running campaigns, publishing content, and reaching out to prospects. The teams that win aren't necessarily doing more of these activities. They're doing them at the right time, aimed at the right accounts.
Intent data makes this possible by telling you which accounts are actively in a buying cycle before they raise their hand. The sources of intent vary, and the best strategies layer multiple signals together.
- Website visits to high-value pages
An anonymous company visiting your pricing page, your integration docs, or your competitor comparison page three times this week is signaling something meaningful. That's very different from someone who read a top-funnel blog post once and bounced.
- Content consumption patterns
When an account downloads your ROI guide, watches your product demo video, and then reads two case studies in the same week, that's not casual browsing. That's research behavior that typically precedes a buying conversation.
- Ad engagement
Repeated clicks on your paid campaigns from the same account suggest growing interest. Single clicks might be noise. Patterns are signal.
- CRM reactivation signals
Accounts that went cold six months ago and suddenly start re-engaging with your content or visiting your site again deserve immediate attention. They've already been through your sales process once, which means the re-entry barrier is much lower.
- Competitor research activity
Third-party intent data can reveal when accounts are actively researching your competitors or your product category on review sites and comparison platforms.
The critical point that many teams miss is that intent data without routing is useless. Knowing that a high-fit account is showing buying signals is only valuable if that knowledge triggers a specific action. That action might be syncing the account into a targeted LinkedIn audience, triggering a Slack alert to the account's assigned SDR, adding them to a personalized email sequence, or moving them up in the sales prioritization queue.
Factors.ai connects these dots by turning anonymous website activity into identified accounts and then routing those signals to the systems where your team can act on them. The data doesn't just live in a dashboard. It flows into your audience syncs, your alerts, your sequences, and your account prioritization workflows. That's the difference between having intent data and actually using it.
Step 6: How do you create feedback loops between teams?
Even with shared metrics, the right GTM motion, and solid intent data, alignment erodes without deliberate information exchange. Most companies lose momentum here because feedback loops feel like overhead until you realize how much pipeline they save.
The most effective GTM teams I've observed run a weekly operating cadence that's short, structured, and focused on decisions rather than status updates. Each team brings something specific to the table.
Marketing brings: the top engaged accounts from the past week, channel performance data showing what's working and what's underperforming, and content gaps they've identified based on search demand or sales conversations they've overheard.
Sales brings: the objections they're hearing most frequently, the reasons deals are being lost, any shifts in the personas or job titles showing up in buying committees, and insights about how prospects are describing their problems in their own language.
Revenue operations brings: funnel leakage analysis showing where accounts are dropping off, attribution data revealing which touchpoints are genuinely influencing pipeline, and forecast trends that signal whether the current trajectory will hit quarterly targets.
This cadence works because it creates a recurring data habit, not a recurring meeting habit. The difference is important. A meeting where people share updates is a status call. A meeting where people share data that changes what they do next week is a feedback loop. If marketing hears that sales is losing deals because prospects don't understand a specific integration, marketing can create content addressing that objection within days. If sales sees that a particular webinar is driving unusually high account engagement, they can prioritize those attendees in their outreach.
The revops strategy here is connective tissue. Revenue operations ensures the data is clean, the attribution is trustworthy, and the funnel reporting is honest. Without that layer, marketing and sales end up arguing about whose numbers are right instead of discussing what to do next.
One practical tip: keep these meetings to 30 minutes. The moment they stretch to an hour, attendance drops and the cadence collapses within a month. Brevity forces focus, and focus is what makes feedback loops survive past the first quarter of enthusiasm.
GTM metrics that actually matter
If your leadership team's dashboard is dominated by traffic and lead volume, you're measuring effort rather than outcomes. A SaaS pipeline strategy lives and dies on metrics that connect activity to revenue. Here are the ones worth tracking seriously.
- Pipeline created by segment
Not total pipeline. Pipeline broken down by ICP segment, GTM motion, and source. This tells you where your best opportunities are actually coming from and whether your targeting is working.
- Opportunity rate
What percentage of qualified accounts convert into real sales opportunities? This is the single best indicator of alignment between marketing targeting and sales acceptance criteria.
- Win rate
Not just overall win rate, but win rate sliced by source channel, segment, and deal size. If your win rate on marketing-sourced opportunities is dramatically different from outbound-sourced ones, that tells you something important about messaging and targeting.
- Sales cycle length
How long does it take from first qualified touchpoint to closed deal? If this is getting longer despite more activity, something in your GTM is creating friction rather than removing it.
- CAC payback period
How many months of revenue does it take to recover the cost of acquiring a customer? This metric forces discipline because it connects acquisition spending to actual retention and monetisation.
- Expansion revenue
Revenue from existing customers through upsells, cross-sells, and seat expansion. If your GTM strategy only focuses on new logos, you're leaving the most efficient revenue source underinvested.
- Retention by source
Do customers acquired through certain channels retain better than others? This is a backtest of your ICP and GTM motion. If paid search customers churn at twice the rate of inbound organic customers, that's a signal about targeting quality.
- Multi-touch ROI
Which combinations of touchpoints are most efficiently producing revenue? This goes beyond single-channel attribution to understand how channels work together.
- Account penetration
Within your target account list, how many accounts have you reached? How many are engaged? How many are in pipeline? This gives you a clear picture of how effectively your GTM engine is working through your addressable market.
Traffic growth without pipeline growth is just prettier reporting. I've watched teams celebrate doubling their blog traffic while their pipeline stayed flat for three consecutive quarters. Vanity metrics feel good in the moment, but they don't survive scrutiny when the board asks why growth is stalling.
Common mistakes SaaS teams make with GTM
After watching dozens of SaaS teams build and rebuild their GTM strategies, the same mistakes surface repeatedly. Recognising them early saves quarters of wasted effort and budget.
- Targeting everyone
When your ICP is "any company with more than 50 employees," you're not targeting. You're hoping. Broad targeting leads to diffused messaging, wasted ad spend, and a pipeline full of accounts that don't convert. Narrowing your ICP feels scary because it means saying no to potential revenue, but the math consistently favours focus over breadth.
- Too many channels too early
Startups with small teams often try to be everywhere simultaneously: SEO, paid search, LinkedIn ads, webinars, events, podcasts, email, partnerships. Each channel gets 10% of the attention it needs to work, and none of them perform. Picking two or three channels and executing them well beats half-hearted presence across eight.
- Measuring clicks over pipeline
Click-through rates and impression volumes are activity metrics, not outcome metrics. When channel reviews focus on clicks rather than on how many qualified opportunities each channel influenced, teams optimize for the wrong thing. The channel with the best CTR might be generating the worst pipeline.
- Misaligned SDR handoffs
Marketing generates engaged accounts. SDRs don't follow up quickly enough, or they follow up with generic messaging that ignores the context of what the account was engaging with. The handoff between marketing engagement and sales outreach is one of the leakiest points in most funnels. Speed and context both matter here.
- Ignoring expansion revenue
New logo acquisition dominates most GTM conversations, but expansion within existing accounts is typically the highest-margin, shortest-cycle revenue available. SaaS teams that don't build expansion into their GTM strategy are overworking acquisition to compensate.
- No owner for GTM systems
Someone owns the CRM. Someone owns the marketing automation platform. Someone owns the ad accounts. But who owns the system of systems, the way data flows between platforms, the rules for routing intent signals, the definition of a qualified account? Without a RevOps function (or at least a designated owner), the GTM tech stack becomes a collection of tools rather than an integrated engine.
- Copying enterprise tactics as an SMB startup
Field marketing events, multi-threaded ABM campaigns, and dedicated SDR pods make sense at certain scales. Running them when you have twelve customers and a team of five is a recipe for burning cash on infrastructure you can't yet leverage. Match your GTM complexity to your stage.
- Running ABM with no data foundation
Account-based marketing sounds compelling in theory. In practice, it requires knowing which accounts to target, what they're doing, and when they're active. Without reliable account identification and engagement data, ABM becomes expensive guesswork with nice-looking account lists.
How does Factors.ai helps modern SaaS GTM teams
Most of the problems discussed in this article share a common root: teams can't see the full picture. Marketing doesn't know which accounts sales is working. Sales doesn't know which accounts marketing has warmed. Neither team can see anonymous website activity, and RevOps can't build attribution because the data lives in separate silos.
Factors.ai addresses this by providing the visibility layer that modern GTM teams need to operate as one unit. Here's how the capabilities connect to the challenges we've covered.
- Anonymous account identification
Most B2B website traffic is anonymous. Factors.ai identifies the companies behind that traffic, so your team knows when target accounts are researching your product without waiting for a form submission. This directly enables the intent-based prioritisation discussed in Step 5.
- LinkedIn and paid audience syncing
When Factors.ai identifies high-intent accounts, it can sync those accounts into your LinkedIn ad audiences and other paid platforms automatically. Your ad spend concentrates on accounts that are already showing buying signals rather than spraying broadly.
- Multi-touch attribution
Instead of arguing about which channel "gets credit," Factors.ai shows how multiple touchpoints work together to influence pipeline. This supports the shared metrics model from Step 3 by giving both teams a single source of truth.
- Shared dashboards for sales and marketing
Both teams see the same account engagement data, the same pipeline metrics, and the same channel performance. This eliminates the "your numbers vs. my numbers" dynamic that destroys alignment.
- Pipeline source clarity
Every opportunity traces back to the touchpoints that influenced it. When leadership asks "what's driving pipeline?", the answer comes from data rather than opinion.
- Account-level engagement tracking
Instead of tracking individual leads, Factors.ai tracks engagement at the account level. This fits the account-centric GTM model and gives teams a complete picture of how buying committees interact with your brand across channels.
Instead of debating which team gets credit, give everyone the same view of what actually moved pipeline. When the data is shared and trusted, alignment becomes a natural consequence rather than a forced initiative.
Final framework: build a GTM engine
After everything we’ve covered, the pattern should be clear. Companies that build strong SaaS growth engines do three things consistently, regardless of their size, segment, or stage.
- They choose focus over channel chaos. Rather than trying every channel and tactic simultaneously, they identify the two or three motions that match their ICP and buying process, then execute those deeply. They resist the temptation to add more until the core motions are working predictably. This focus feels limiting at first but compounds quickly because resources concentrate where they matter most, helping to build a competitive advantage in the crowded SaaS market.
- They align teams around revenue outcomes. Shared metrics aren’t a nice-to-have. They’re the structural foundation that prevents the departmental optimization trap. When marketing, sales, and customer success all orient around qualified pipeline, opportunity rate, and CAC payback, the internal friction that plagues most SaaS companies dissolves. People still have different roles, but they’re pulling in the same direction, driving recurring revenue, revenue growth, and customer retention by fostering strong customer relationships and long-term customer relationships.
- They use data to prioritize accounts continuously. Static target account lists built once a quarter don’t keep pace with how quickly buying intent shifts. The strongest GTM teams refresh their prioritization weekly based on intent signals, engagement scores, and pipeline stage data. Revenue operations SaaS teams sit at the center of this, ensuring the data flows correctly and the prioritization rules stay current, enabling the business to expand its customer base and deliver tangible value that meets evolving customer demands.
The go-to-market framework for SaaS that works in practice isn’t a one-time strategy document or a set of team-level OKRs. It’s an operating rhythm where targeting, messaging, channel allocation, and team coordination all adjust based on what the data says is happening in the market right now. This approach is essential for any SaaS business looking to position its SaaS product effectively, achieve sustainable growth, and maintain a strong foothold in the dynamic SaaS market.
Your buyers experience one company. If sales, marketing, and revenue ops feel separate internally, the market feels it externally. The companies that close that gap are the ones that grow predictably, and predictability is what separates a SaaS startup from a SaaS engine.
In a nutshell…
Building a B2B SaaS go-to-market strategy that actually works requires structural changes, not just better slide decks or more meetings. Start by defining your ICP with the four-layer model (firmographic, technographic, behavioral, and economic) so your targeting is precise enough to matter. Choose a GTM motion that matches how your buyers actually purchase, whether that's product-led, sales-led, or hybrid.
Replace the metrics that create conflict between teams (MQL volume for marketing, closed-won for sales) with shared ones like qualified pipeline, opportunity rate, and CAC payback. Build your channel strategy with clear funnel-stage assignments so every channel has a defined job. Layer in intent data to prioritize accounts that are actively showing buying signals, and route those signals into workflows where your team can act immediately.
Create weekly feedback loops where marketing, sales, and RevOps share data that changes next week's actions, not just last week's status. Track the nine metrics covered in this piece to keep your leadership team focused on outcomes rather than activity.
If you take one thing away, it's this: your GTM strategy should feel like a single engine, not three departments running parallel plans. The companies that operationalize this consistently are the ones that hit revenue targets predictably rather than heroically.
Frequently asked questions about B2B SaaS go-to-market strategy
Q1. What is a B2B SaaS go-to-market strategy?
It's a structured, continuous plan for how a SaaS company acquires, converts, and grows customers through aligned product, sales, marketing, and revenue operations. Unlike traditional launch planning, a SaaS GTM strategy operates as an ongoing system that adapts to pricing changes, new segments, product updates, and competitive shifts every quarter.
Q2. How is a GTM strategy different from a marketing strategy?
Marketing is one component within the broader GTM system. A full go-to-market strategy includes positioning, pricing and packaging, channel selection, sales motion design, onboarding, expansion playbooks, and revenue accountability across teams. Marketing strategy focuses specifically on demand generation and brand, while GTM strategy coordinates the entire revenue engine.
Q3. What is the best GTM motion for SaaS?
It depends entirely on your average contract value, product complexity, and buying process. Low-friction tools with quick time-to-value often suit a product-led growth motion. Enterprise products with large buying committees typically need a sales-led or hybrid approach. Most scaling SaaS companies eventually run a hybrid motion that combines elements of PLG, SLG, and marketing-led growth across different segments.
Q4. Why do SaaS GTM teams struggle with alignment?
The most common reason is that teams optimize for their own metrics instead of shared revenue outcomes. When marketing is measured on lead volume and sales is measured on closed deals, both teams can technically hit their targets while the overall business underperforms. Replacing departmental KPIs with shared metrics like qualified pipeline and CAC payback resolves this structural conflict.
Q5. How can intent data improve a SaaS GTM strategy?
Intent data helps you prioritize accounts that are already showing buying signals, such as visiting your pricing page, engaging with competitor content, or consuming multiple pieces of your content in a short period. This improves efficiency because your sales and marketing resources focus on accounts with the highest likelihood of converting, rather than spreading effort evenly across your entire target list. The key is routing intent signals into actionable workflows rather than letting them sit in a dashboard.

Why your business needs SEO: a comprehensive guide for B2B
Learn why your business needs SEO for pipeline, trust, and sustainable growth. A B2B guide with real impact metrics and modern search insights.
TL;DR
- SEO captures demand that already exists. Buyers search before they buy, and your visibility during that research phase shapes whether you make the shortlist or get ignored entirely.
- The value of SEO extends well beyond Google rankings, it influences AI overviews, ChatGPT citations, Perplexity answers, and how your brand shows up across an expanding search ecosystem.
- For B2B companies, SEO shortens sales cycles, builds category authority, and lowers customer acquisition costs in ways paid channels can't sustain alone.
- Now, SEO means buyer-intent research, revenue-stage content, technical hygiene, and first-party data loops. It doesn't mean keyword stuffing or publishing hundreds of thin posts.
- A focused 90-day plan covering technical foundations, revenue content, and scaling winners can move the needle faster than most teams expect.
A friend recently asked me recently, “Why do we need SEO? We already run ads… isn’t SEO, ‘dead’?”
Cute question.
Because the minute real buyers have a real problem, they don’t lovingly wait for your next campaign. They go searching, open tabs, compare options, read reviews, stalk competitors, and build a shortlist before your sales team even knows they exist.
That’s where SEO earns its keep.
Ads are like paying for VIP entry every night. SEO is getting your name on the guest list permanently. One stops when budget does. The other keeps pulling people in while you sleep.
And search isn’t just Google anymore… it’s LinkedIn, YouTube, AI tools, Reddit threads, review sites, and that one chaotic forum where buyers overshare everything.
This guide is anything but dusty SEO jargon. It’s about why search still prints money for smart businesses, and how to make it work for revenue, not vanity charts.
Why does your business needs Search Engine Optimization (the short answer first)?
Your business needs SEO because buyers search before they buy. That behaviour hasn't changed in twenty years, and it isn't changing now. What has changed is where those searches happen and how many of them occur before a buyer ever fills out a form or books a call.
SEO helps you show up when demand already exists. It builds trust before sales conversations begin, lowers acquisition costs over time, and creates compounding traffic that paid ads can't sustain on their own. When someone searches "best account identification tools" or "LinkedIn ads attribution," they're signalling intent. If your brand doesn't appear in that moment, a competitor's brand does.
There's a common misconception worth addressing early. SEO isn't "free traffic." It requires investment in content, technical infrastructure, and ongoing optimisation. But the return model is fundamentally different from paid channels. With ads, you rent attention for as long as you're willing to pay. With SEO, you build owned visibility that appreciates over time, like an asset on your balance sheet rather than a line item on your P&L.
This distinction matters most when ad costs rise, and they always do. Every B2B marketer I know has watched CPCs creep up year over year across Google and LinkedIn. SEO doesn't eliminate that pressure, but it reduces your dependence on it. It gives you a channel where the cost per visit trends downward as your content library matures, even while paid channels trend the other way.
The other underappreciated benefit is timing. SEO helps buyers discover you before they speak to sales. By the time your SDR sends that first email, the prospect has already read your comparison page, scanned your pricing approach, and formed an opinion. That pre-education changes the entire dynamic of the first conversation.
What does SEO do for your business?
Most explanations of SEO stop at "it helps you rank higher on Google." That's true, but it's a bit like saying a gym membership helps you lift heavy things. Technically correct, functionally incomplete. The real question is what ranking higher actually does for your business operations, and the answer touches more functions than most teams realize.
- Demand capture
The most direct function is capturing demand that already exists. When someone types "best ABM software" or "account identification tools" into a search bar, they're actively looking for a solution. They've recognised a problem, and they're evaluating options. SEO puts your brand in front of those buyers at the exact moment their intent is highest. You don't have to convince them they have a problem. You just have to show up with a credible answer.
- Trust creation
Buyers trust brands that repeatedly appear during their research. If a prospect searches three different questions over two weeks and your content shows up each time, you've established familiarity before anyone on your team has sent a single email. That kind of ambient brand presence is incredibly difficult to manufacture through paid channels alone, because it requires consistency across a range of topics rather than a single ad placement.
- Buyer education
SEO pages answer objections before demo calls happen. A well-structured pricing page, a comparison post, or a use-case breakdown does the heavy lifting that an SDR would otherwise have to do in real time. When your content addresses the "but does it integrate with Salesforce?" question before the prospect even asks it, you've shortened the path to a meaningful conversation. Think of it as pre-selling without the sales pitch.
- Pipeline support
Organic visitors don't always convert on their first visit, and that's fine. They become remarketing audiences, email subscribers, or they return weeks later when the buying committee expands. SEO feeds the top of your funnel in a way that quietly supports every downstream conversion channel. The visitor who reads your blog post today might become the demo request next month after seeing your LinkedIn ad twice.
- Market intelligence
Here's a function that rarely gets mentioned. Your keyword data is a real-time window into what buyers care about right now. When search volume shifts from "marketing attribution" to "AI-powered attribution," that's a signal. When a new comparison query like "[your competitor] vs [emerging player]" starts gaining traction, that's market intelligence you didn't have to commission a research firm to find. SEO is often your cheapest research department and quietest salesperson, working in parallel.
SEO is now bigger than Google rankings
If your mental model of SEO is still "rank on page one of Google," you're working with an outdated map. The territory has expanded dramatically, and businesses that only optimise for traditional blue links are leaving visibility on the table across an entire ecosystem of surfaces.
Modern SEO now influences how your brand shows up in Google's AI Overviews, those summary boxes that appear above organic results. It affects whether ChatGPT cites your content when someone asks for software recommendations. It shapes how Perplexity synthesises answers from across the web and whether Bing Copilot surfaces your brand in conversational queries. It even determines whether your expertise shows up in Reddit threads and community discussions that feed into these AI systems.
Businesses no longer compete only for blue links. They compete for answers. When a buyer asks an AI assistant "what's the best way to track account-level website visits," the answer gets assembled from content that's well-structured, authoritative, and consistently present across the web. If your content isn't part of that mix, you're invisible in a growing share of how people actually find information.
This is why I think of modern SEO as a search visibility stack rather than a single channel. The stack has multiple layers, and each one reinforces the others.
The search visibility stack:
- Traditional rankings. Your pages appearing in organic search results for relevant queries. This is still the foundation, and it still drives the majority of organic traffic for most businesses.
- AI answer inclusion. Your content being cited or synthesised in AI Overviews, ChatGPT responses, and Perplexity answers. This layer is growing rapidly and favours content that's well-structured and clearly authoritative.
- Brand mentions across the web. Your company being referenced in third-party articles, roundups, directories, and discussions. These mentions feed both traditional authority signals and the training data that AI systems draw from.
- Review and community trust signals. Your presence on G2, Capterra, Reddit, and industry forums. AI systems increasingly weight community consensus when generating recommendations.
Each layer of this stack feeds into the others. Strong organic rankings lead to more brand mentions. Brand mentions improve authority signals. Authority signals increase the likelihood of AI citation. And AI citations drive awareness that loops back into branded searches and direct visits.
The practical implication is that SEO strategy can't be siloed into "content and backlinks." It has to account for how your brand shows up across every surface where buyers search, ask, or research. The companies that understand this shift will have a structural advantage over those still chasing keyword positions in isolation.
What is the business value of SEO in B2B?
In B2B, the sales cycle is longer, the buying committee is bigger, and the stakes per deal are higher. All three of these conditions make SEO disproportionately valuable compared to B2C, where the purchase decision might happen in minutes. When someone’s evaluating a SaaS platform that’ll cost their company six figures a year, they don’t impulse buy from an ad. They research extensively, and that research happens through search.
Mastering SEO basics is essential for any business online, as it lays the foundation for business success and online success by improving visibility and authority in search engines.
SEO does three powerful things for B2B companies specifically.
- First, it captures in-market demand. People searching for solutions already feel the pain. They know they have a problem with attribution, or account identification, or campaign analytics, and they’re actively looking for something to fix it. This is the highest quality organic search traffic you can acquire because the intent is already there. You don’t have to create awareness. You just have to be present when the search happens.
- Second, it creates category leadership. When prospects repeatedly encounter your insights across multiple searches, your brand feels larger than your actual size. A 50-person company that dominates search results for its category can feel like a 500-person company to a buyer doing research. That perception gap is powerful, especially for startups competing against established players with bigger sales teams and larger ad budgets.
- Third, it shortens sales cycles. Educated buyers need fewer calls. When a prospect has already read your comparison page, studied your integration documentation, and explored your use-case content, the first sales conversation can skip the basics entirely. Good SEO makes your first sales meeting feel like the third. The buyer already knows what you do, roughly how it works, and why it might be relevant to their situation.
The types of content that drive this value are specific and worth naming. Pricing pages reduce sticker shock before a call happens. Comparison pages (“Factors.ai vs [competitor]”) position your strengths directly against alternatives. Use-case pages (“SEO for B2B SaaS” or “attribution for demand gen teams”) help buyers see themselves in your product. Integration pages answer the “does it work with my stack?” question. And ROI calculators give procurement teams internal ammunition to push a deal forward.
Each of these page types sits at the bottom of the funnel, where search intent is closest to a purchase decision. They’re not vanity content. They’re pipeline content, and they compound in value every month they rank.
While B2B companies benefit greatly from SEO, local businesses also see significant gains by leveraging local SEO strategies. Optimizing for local SEO helps local businesses appear in local search results, especially for 'near me' queries, attracting nearby customers and driving foot traffic. This approach, combined with a focus on organic search traffic, is crucial for both small and large businesses aiming for sustained business success and online success.
Why SEO outperforms paid channels over time
I want to be careful with this section because the answer isn't "SEO is better than paid, full stop." The real answer is more nuanced, and it depends on your time horizon and your tolerance for compounding versus immediate returns.
Here's how the two channels compare across the dimensions that matter most for B2B growth:
The core distinction is an economic one. Ads rent attention. SEO builds equity. Every blog post, comparison page, or resource you create is an asset that can generate returns for months or years. A paid campaign, by contrast, delivers value only for as long as you're funding it. The moment you pause spend, visibility disappears.
For SaaS companies, this distinction becomes increasingly urgent as customer acquisition cost (CAC) pressure mounts. Most B2B SaaS companies I've spoken with have seen paid CPCs rise 15-30% year over year across Google and LinkedIn. That trend creates a compounding problem: you need more budget each quarter just to maintain the same volume. SEO offers a structural counterweight to that pressure because its cost per acquisition moves in the opposite direction over time.
But I want to offer a balanced view here, because the most effective growth strategies use both channels together. Paid campaigns are exceptional for testing messaging, capturing demand in new categories, and driving immediate pipeline when you need it. SEO provides the durable foundation that makes your paid spend more efficient, because retargeting audiences built from organic visitors typically convert at higher rates than cold audiences.
The fragility shows up when companies rely only on paid. If your entire pipeline depends on ad spend and that budget gets cut, whether from a downturn, a leadership change, or a budget reallocation, your pipeline disappears with it. SEO creates a safety net that keeps generating leads even during budget pauses. Relying only on paid is expensive fragility. Combining both gives you resilient, compounding growth.
What happens when businesses ignore SEO
This is the section I wish more founders would read before deciding that SEO can wait until "later." The cost of ignoring SEO isn't just missed traffic. It's a compounding disadvantage that gets harder to reverse the longer you wait.
- When you don't invest in SEO, your competitors own the category searches that your buyers use. Every query like "best [your category] software" or "[your category] comparison" returns results filled with competitor brands. Your potential buyers see those brands, read their content, and build trust with them, all before they know you exist. By the time your sales team reaches out, the prospect has already formed preferences shaped entirely by your competitors' content.
- The second problem is economic. Without organic traffic as a counterbalance, your CPCs rise with no fallback channel. You're entirely dependent on paid acquisition, which means every budget cut or platform policy change directly threatens your pipeline. I've seen companies lose 30% of their lead volume overnight when a Google Ads policy change affected their top-performing campaigns. The ones with strong SEO barely noticed because organic kept generating leads through the disruption.
- Then there's the outbound dependency problem. Without SEO, your sales team carries the entire burden of pipeline generation through cold outreach. That's an expensive, labor-intensive model that doesn't scale well, and it puts enormous pressure on individual reps to generate conversations from scratch. SEO-sourced leads arrive warmer because the buyer initiated the interaction. Without that channel, every conversation starts cold.
- The brand visibility gap might be the most damaging long-term consequence. During the research phase of any B2B purchase, buyers scan multiple sources across weeks or months. If your brand never appears during that journey, you're functionally invisible. Your expertise might be exceptional, but if nobody finds it, it behaves like it doesn't exist. I've seen brilliant technical teams with genuinely superior products lose deals to competitors whose only advantage was search visibility.
- There's also a newer dimension to this problem. AI tools now cite sources when answering buyer questions, and those citations draw heavily from well-established, SEO-optimized content. If your competitors have invested in SEO and you haven't, AI assistants will recommend their products and reference their content. You won't just be invisible in Google results. You'll be invisible in the AI layer too, and that layer is growing fast.
- Finally, existing content decays when it isn't maintained. Most companies have blog posts, documentation, or resource pages that could rank if they were optimized. Without an SEO strategy, that content sits unused, generating no traffic and no pipeline value. It's like having inventory in a warehouse that nobody knows exists.
What SEO looks like now…
There's a meaningful gap between what most people imagine when they hear "SEO" and what effective, real SEO actually involves today. The outdated version lives in many marketing leaders' mental models: stuff keywords into pages, build some backlinks, watch the rankings climb. That version hasn't worked well for years, and it's actively counterproductive.
Real SEO starts with deep buyer-intent research, not keyword volume research. The difference matters. Volume tells you how many people search for a term. Intent tells you what they're trying to accomplish when they search. A query like "what is ABM" signals educational intent from someone early in their learning journey. A query like "best ABM platforms for mid-market" signals evaluation intent from someone ready to compare options. Effective SEO maps content to these intent stages, not just to high-volume terms.
From there, real SEO ties content to revenue stages. Top-of-funnel content builds awareness and captures early research queries. Mid-funnel content (comparison pages, use-case breakdowns, integration documentation) supports active evaluation. Bottom-of-funnel content (pricing pages, ROI calculators, demo landing pages) supports purchase decisions. Each piece has a defined role in the buyer journey, and each one gets measured against pipeline contribution, not just traffic.
Technical hygiene is the unglamorous foundation that makes everything else work. Pages need to load quickly, render correctly for search crawlers, and be properly indexed. Internal linking needs to connect related content in a logical structure that helps both readers and search engines understand your site's architecture. Structured data and schema markup help search engines parse your content more accurately, which matters increasingly for AI answer generation.
First-party data feedback loops are what separate sophisticated SEO programmes from basic ones. This means using your CRM data, account identification tools, and analytics platforms to understand which organic content actually influences pipeline and revenue. When you can see that a specific blog post was the first touchpoint for 12 closed-won accounts last quarter, you can double down on that content pattern. Without that feedback loop, you're optimizing blind.
Refreshing existing content that's already performing is often more valuable than creating new content from scratch. Pages that rank on page two or have high impressions but low click-through rates represent immediate opportunities. Updating them with better information, clearer structure, and stronger calls to action can move them onto page one faster than publishing something entirely new.
It’s just as important to know what real SEO is not, because some myths refuse to die.
SEO is not keyword stuffing like it’s 2011. Search engines got wise to that years ago. It’s not publishing 100 forgettable blog posts and calling it a strategy. Volume without value is just clutter with ambition. It’s not celebrating traffic spikes while ignoring whether any of that traffic turned into pipeline, qualified leads, or actual revenue.
And it’s definitely not sending monthly ranking reports with zero business context. If your SEO report talks about impressions and positions but says nothing about pipeline, opportunities, or revenue, that isn’t a growth report. It’s website trivia.
SEO for B2B companies: the Factors.ai lens
Most SEO advice is written for e-commerce or media companies where the conversion event is simple: someone clicks, someone buys, someone subscribes. B2B is structurally different because the conversion event is complex, the buyer is usually a committee, and the journey spans weeks or months across multiple channels and touchpoints.
For B2B teams, SEO should connect to accounts, not only sessions. Knowing that you had 5,000 organic visits last month is interesting but incomplete. Knowing that 47 target accounts visited your comparison page from organic search, and 12 of those accounts later entered the pipeline, is actionable intelligence. That’s the shift in thinking that separates B2B SEO from generic SEO advice.
This is where a Factors.ai-style approach becomes relevant. When you can identify which companies visited your organic pages (not just anonymous session counts), you unlock a fundamentally different way of measuring SEO. You can track which keywords lead to pipeline by connecting the search query to the account that visited to the opportunity that eventually closed. You can see which pages influence enterprise opportunities specifically, rather than treating all traffic as equal.
As you begin your SEO journey, leveraging free tools like Google Analytics and Google Search Console is essential for measuring and monitoring your search traffic. These tools help you understand which keywords and pages drive valuable visits and conversions, providing actionable insights for ongoing optimization.
The organic versus paid assist path analysis is another layer most teams miss. A buyer might first discover your brand through an organic blog post, then see a LinkedIn ad two weeks later, then return directly to request a demo. In a last-touch model, direct gets the credit. In an account-level view, you can see that organic initiated the relationship. That visibility changes how you allocate resources between channels.
Content performance measurement changes too when you think at the account level. Instead of asking “which blog posts get the most traffic,” you can ask “which blog posts are read by accounts that eventually close.” Those are often different lists. A niche comparison page with 200 monthly visits might influence more revenue than a broad thought leadership post with 5,000 visits, but you’d never know that from a standard analytics dashboard.
Additionally, optimizing your Google Business Profile is a crucial step for improving local B2B visibility and attracting potential customers searching for your services in your area.
Traffic is nice to see, but revenue-by-account is wayyy better. That’s the lens that makes SEO a revenue function rather than a marketing vanity metric, and it’s the lens that earns SEO a permanent seat at the pipeline review table.
How to measure SEO impact properly
The measurement problem in SEO is that the easiest metrics to track are often the least useful for making business decisions. Rankings, organic sessions, and indexed page counts are all visible in standard tools, and they're all fine as diagnostic indicators. But they don't answer the question that your CFO or VP of Sales actually cares about: what revenue came from search this quarter?
Let's separate the basic metrics from the ones that actually drive decisions.
Basic metrics (diagnostic, not decisive):
- Organic sessions (total volume)
- Keyword rankings (positional tracking)
- Click-through rate from search results
- Number of indexed pages
These tell you whether your SEO programme is technically healthy and directionally growing. They're useful for the SEO team's internal reviews, but they shouldn't be the centerpiece of your executive reporting. A ranking improvement from position 8 to position 4 is meaningless if it doesn't translate into more pipeline.
Better metrics (business outcomes):
- Demo requests originating from organic landing pages
- Pipeline value influenced by organic touchpoints
- Customer acquisition cost for organic versus paid channels
- Assisted conversions where organic was part of the journey
- Opportunity rate by landing page (which pages produce qualified pipeline)
- Growth in returning branded searches (a signal of awareness driven by content)
These metrics connect SEO activity to business results. They require more setup, usually involving CRM integration and proper UTM tagging, but they transform SEO reporting from a traffic story into a revenue story.
The executive dashboard question should be straightforward. When your leadership team asks about SEO performance, the answer should sound like: "Organic search influenced £420K in pipeline this quarter, sourced 34 demo requests, and our organic CAC is 62% lower than our paid CAC." That's a conversation about business value, not about keyword positions.
Getting to this level of measurement isn't trivial. It requires connecting your analytics platform to your CRM, implementing proper attribution tracking, and establishing clear definitions for what "organic-sourced" and "organic-influenced" mean in your context. But the investment in measurement infrastructure pays for itself by making every subsequent SEO decision more informed and defensible.
One underrated metric deserves special mention: the ratio of branded to non-branded organic traffic over time. When your non-branded organic traffic grows (people finding you through category and problem-based searches), it means your SEO is capturing new demand. When your branded traffic grows alongside it, it means that awareness is converting into recognition. Both trends together signal a healthy, compounding SEO programme.
The 90-day SEO action plan for businesses
Strategy without a timeline is just a wish. If you're convinced that SEO deserves investment but aren't sure where to start, here's a practical 90-day framework that moves from foundations to revenue content to scale. Each phase builds on the previous one, so the sequence matters.
Days 1–30: fix the foundations
Before you create a single new page, make sure your existing site isn't sabotaging itself. This phase is about technical hygiene and measurement infrastructure.
- Run a comprehensive technical crawl. Use a tool like Screaming Frog or Sitebulb to identify crawl errors, broken links, redirect chains, and orphaned pages. Fix the critical issues first: pages returning 404 errors, redirect loops, and any pages accidentally blocked from indexing.
- Audit your indexing. Check Google Search Console to see which pages are indexed and which aren't. If important pages aren't being indexed, investigate why. Common culprits include noindex tags left over from staging environments, thin content that Google deems unworthy of indexing, and poor internal linking that leaves pages isolated.
- Improve page speed. Run your key landing pages through PageSpeed Insights and address the highest-impact issues. Image compression, lazy loading, and eliminating render-blocking scripts typically deliver the biggest improvements. Page speed affects both rankings and user experience, so this work pays dividends across channels.
- Clean up metadata. Review title tags and meta descriptions for your top 20 pages. Ensure each title tag is unique, under 60 characters, and includes relevant keywords naturally. Make sure meta descriptions are compelling and under 155 characters. These small changes can meaningfully improve click-through rates from search results.
- Set up proper analytics. Ensure your Google Analytics (or equivalent) is properly tracking organic traffic by landing page, and that UTM parameters are configured correctly for any campaigns. Connect your analytics to your CRM if possible, so you can trace organic visits through to pipeline and revenue. This measurement foundation makes every subsequent decision smarter.
Days 31–60: build revenue content
With the technical foundation solid, this phase focuses on creating the content that directly supports pipeline generation. Prioritize bottom-of-funnel and mid-funnel content over top-of-funnel blog posts.
- Create comparison pages. Build pages that compare your product to key competitors. Buyers search for these queries when they're actively evaluating options, so the intent is extremely high. Be honest and specific in comparisons. Credibility matters more than spin.
- Build solution and use-case pages. Create pages for each major use case your product supports. "SEO analytics for B2B SaaS" or "account identification for enterprise sales" are the kinds of pages that connect buyer problems to your capabilities. Each page should clearly articulate the problem, your approach, and the outcome.
- Develop high-intent blog clusters. Identify 3-5 topic clusters around your primary keywords and create 2-3 articles per cluster. Each cluster should have a pillar page (comprehensive overview) linked to supporting articles (specific subtopics). This structure signals topical authority to search engines and creates natural internal linking paths.
- Optimize existing high-potential pages. Using Search Console data from Phase 1, identify pages that rank on page two or have high impressions but low clicks. Update these with better content, stronger headers, clearer structure, and improved metadata. Moving an existing page from position 12 to position 6 is often faster than ranking a new page from scratch.
Days 61–90: scale the winners
By this phase, you'll have data on what's working. The goal now is to amplify successful content and extend its reach.
- Refresh pages showing strong impressions. Pages that are gaining impressions but not yet converting well are your best optimization candidates. Add clearer CTAs, improve the content depth, and strengthen internal links pointing to these pages. Small improvements on pages that already have momentum can produce outsized results.
- Add strategic calls to action. Review your top-performing organic pages and ensure each one has a clear, relevant CTA. A comparison page should link to a demo request. A use-case page should offer a relevant resource or consultation. Match the CTA to the intent stage of the content so it feels like a natural next step rather than an interruption.
- Strengthen internal linking. As your content library grows, internal linking becomes increasingly powerful. Link new articles to relevant existing pages and vice versa. Create clear pathways from educational content to evaluation content to conversion pages. Good internal linking helps both readers and search engines navigate your site's expertise.
- Repurpose into other channels. Your best-performing organic content is a goldmine for other channels. Turn key insights into LinkedIn posts. Extract statistics or frameworks for email newsletters. Convert comparison content into sales enablement materials. SEO content shouldn't live in isolation. It should fuel your entire marketing engine.
This 90-day plan won't transform your organic channel overnight. But it creates the infrastructure and content foundation that makes compounding growth possible. Most teams that follow a structured approach like this see measurable movement in organic traffic and pipeline contribution within the first quarter, with accelerating returns in the quarters that follow.
In a nutshell…
SEO is (and never was) a nice-to-have marketing experiment. It's a core growth function for any B2B business that wants sustainable pipeline, lower acquisition costs, and visibility across an expanding ecosystem of search surfaces.
The buyers you want to reach are searching right now, across Google, AI assistants, and community platforms. They're reading comparison pages, scanning use-case content, and forming preferences weeks before they ever talk to a salesperson. Your presence (or absence) during that research phase directly shapes whether you make the shortlist.
The value of SEO compounds over time in a way that paid channels can't. Every page you build, every technical improvement you make, and every content refresh you publish adds to a growing asset base that generates returns long after the initial investment. That doesn't mean you should abandon paid channels. It means you should build the organic foundation that makes your entire growth engine more resilient and more efficient.
If you're starting from scratch or restarting after a period of neglect, the 90-day framework in this piece gives you a practical starting point. Fix your technical foundations first, then build the revenue-stage content that captures high-intent demand, then scale what works. Measure against pipeline and revenue, not just traffic and rankings. And connect your SEO data to account-level insights so you can see which content actually influences the deals that close.
The companies that treat SEO as a strategic investment, rather than a checkbox, will have a compounding advantage that gets harder for competitors to replicate with each passing quarter. The best time to start was a year ago. The second-best time is this month.
Frequently asked questions about why your business needs SEO
Q1. Is SEO worth it for small businesses?
Yes, and often more so than for larger companies. When your ad budget is limited, SEO provides a way to compete for visibility without paying per click. Small businesses with strong local or category demand can capture significant traffic by creating focused, high-quality content around the specific queries their buyers use. The investment is proportionally smaller too, since you're targeting a narrower set of keywords rather than competing across broad categories.
Q2. How long does SEO take to show results?
Most businesses see initial movement within 3-6 months, including improved rankings, growing impressions, and early traffic gains. Meaningful compounding, where organic traffic becomes a reliable and growing pipeline source, typically takes 6-12 months. The exact timeline depends on your site's existing authority, the competitiveness of your target keywords, and how aggressively you invest in content and technical improvements. The important thing to understand is that SEO returns accelerate over time rather than remaining flat, so the patience invested in the early months pays back disproportionately later.
Q3. What is the purpose of SEO?
The purpose of SEO is to help the right buyers find and trust your business through search. It's about being visible at the moment someone is actively looking for a solution you provide, whether that's through a traditional Google search, an AI assistant query, or a community research thread. Effective SEO doesn't just drive traffic. It drives relevant traffic from people who are already experiencing the problem your product solves, which is why it tends to produce higher-quality leads than most other channels.
Q4. Is SEO still relevant with AI search?
Absolutely. AI search tools like ChatGPT, Perplexity, and Google's AI Overviews don't replace SEO. They rely on it. These systems synthesize answers from content that's well-structured, authoritative, and widely referenced across the web, which is exactly what strong SEO produces. Companies with robust SEO programmes are more likely to be cited in AI-generated answers, which creates a new layer of visibility beyond traditional rankings. Ignoring SEO in the AI era actually makes you less visible, not more, because you're absent from the content pool that AI systems draw from.
Q5. Can B2B SaaS companies rely only on paid ads?
They can in the short term, but the economics tend to deteriorate. CPCs across Google and LinkedIn have been rising steadily, which means the cost of maintaining the same lead volume increases every quarter. Without organic traffic as a counterbalance, your entire pipeline is dependent on sustained ad spend, creating a fragility that becomes painfully obvious during budget cuts or platform policy changes. The strongest B2B SaaS growth engines use paid and organic together, with paid driving immediate demand and SEO building the durable foundation that improves efficiency over time.
Q6. What industries benefit most from SEO?
Most industries benefit, but SEO is particularly powerful in high-consideration categories where buyers research extensively before making a decision. SaaS, legal services, healthcare, financial services, education, and professional services all see strong returns from SEO because their buyers conduct multiple searches across a longer decision timeline. The more complex and expensive the purchase, the more research happens, and the more valuable it is to be present throughout that research journey.

Launching your successful SEO campaign
See how to build an SEO campaign using search engine optimization (SEO) as part of your digital marketing strategy. Learn B2B tactics, tracking, execution, and ROI frameworks.
TL;DR
- An SEO campaign is a time-bound, goal-led growth initiative, not the same thing as ongoing SEO maintenance. It combines content, technical fixes, authority building, and measurement around specific business outcomes.
- Most B2B SEO campaigns underperform because they optimize for keywords and traffic volume instead of buying journeys and pipeline influence.
- Effective SEO campaign management follows a weekly rhythm that ties every action back to revenue metrics, not just ranking positions.
- SEO campaign tracking should measure four layers: visibility, engagement, buyer behavior, and revenue influence. If your reporting stops at sessions, your campaign stops too early.
- The strongest B2B campaigns layer SEO with paid media and ABM to create compounding returns across channels.
A few years ago, B2B companies could get away with treating SEO like a content treadmill. Publish blogs, celebrate traffic spikes, screenshot rankings for the monthly deck, repeat. It looked productive enough that nobody asked too many difficult questions. In 2026, that era is over. CFOs want efficiency. Sales teams want pipeline. Leadership wants to know why 80,000 monthly visits somehow produced three lukewarm demo requests and one intern downloading an ebook.
That’s why the phrase SEO campaign needs a serious upgrade. It can’t mean “we’re posting regularly” anymore. It has to mean a coordinated growth motion designed to attract the right buyers, move them through consideration, and create measurable revenue impact. If it doesn’t connect to pipeline, it’s a hobby wearing business-casual clothes.
I’ve seen smart teams spend months polishing content calendars while competitors quietly win with ten sharper pages tied directly to commercial intent. More output rarely fixes weak strategy. Better targeting does.
This guide is for B2B marketers who are done chasing vanity graphs and vague awareness wins. We’ll break down what an SEO campaign should actually look like in 2026, why many underperform despite “doing everything right,” how to build one across funnel stages, and how to measure success in language your finance team won’t side-eye.
What is an SEO campaign?
Let’s start with the definition (of course)… since the term ‘SEO’ (search engine optimization (SEO)), gets used loosely enough to mean almost anything. An SEO campaign is a time-bound, goal-led initiative that combines content creation, technical SEO, internal linking, authority building, and measurement to improve search visibility for specific business outcomes. The key phrase there is “time-bound” and “goal-led.” It isn’t the same thing as ongoing SEO, which is the maintenance engine that keeps your existing rankings healthy and your site technically sound.
Think of the difference this way… ongoing SEO is like keeping your car serviced so it runs reliably. An SEO campaign is like planning a road trip to a specific destination, with a route, a timeline, and a reason for going. Both matter, but they serve different purposes. A campaign has a defined scope and aims to improve the website's SEO through website optimization and strategic planning. It might be “rank for account-based marketing software within six months” or “build category demand around our new product launch before Q3.” There’s a finish line, and there are measurable milestones along the way.
What makes this definition especially important in 2026 is that the search landscape itself has shifted. An SEO campaign today doesn’t just mean ranking on a traditional search engine results page. It means earning visibility across AI-generated search experiences, featured snippets, recommendation engines, and citation surfaces that pull from your content even when users don’t click through. If your campaign strategy was designed entirely around blue links and blog posts, it’s already behind the curve. The goal hasn’t changed, which is getting found by buyers who are actively looking. But the surfaces where that discovery happens have multiplied, and your campaign needs to account for all of them. This involves optimizing web pages, improving site structure, and ensuring multiple pages are interconnected to enhance topical relevance and user experience as part of comprehensive search engine optimization (SEO) best practices.
Why do most SEO campaigns underperform?
Here's the uncomfortable truth that most SEO guides skip over: the majority of B2B SEO campaigns fail to move pipeline. Not because the teams are lazy or the content is terrible, but because the entire approach is built around the wrong unit of analysis. Most campaigns optimize pages. The good ones optimize buying journeys.
The gap between those two approaches explains almost every SEO disappointment I've seen up close. Let me walk through the most common reasons campaigns stall.
- The first is keyword lists with no revenue prioritization. A team exports 500 keywords from their favorite research tool, sorts by volume, and starts writing. Nobody asks which of those keywords a qualified buyer would actually type. The result is a mountain of content that attracts visitors who will never become customers. It's the marketing equivalent of building a beautiful shop on a street where none of your customers walk.
- The second is traffic goals disconnected from ICP traffic. Setting a target like "grow organic sessions by 40%" sounds ambitious until you realize that most of those sessions might come from students, job seekers, or people in industries you don't serve. Volume without qualification is a vanity metric dressed up as a KPI.
- The third is too much blog volume paired with too little authority depth. Publishing four posts a week means nothing if none of them are comprehensive enough to earn trust, links, or featured placements. Search engines in 2026 reward depth and expertise, not publishing frequency. Ten shallow posts will lose to one genuinely authoritative guide every time.
- The fourth is the absence of a CRO layer after ranking. You've earned page-one visibility for a valuable keyword. Congratulations. But the page has no clear call to action, no demo path, and no way to identify the companies visiting it. Ranking without conversion design is like filling a stadium and forgetting to put on the show.
- The fifth, and possibly the most damaging, is SEO tracked in isolation from the CRM. When organic performance lives in a Google Analytics dashboard that nobody in Sales ever sees, the campaign becomes invisible to the people who influence budget decisions. Teams celebrate clicks while pipeline stays flat, and eventually someone asks the question that nobody can answer: What did all this SEO actually do for us?
If your SEO dashboard ends at sessions, your campaign ends too early. The tracking problem isn't technical. It's structural. And until you fix it, every campaign will feel like it's working without proving that it is.
The B2B SEO campaign model
So what does a better approach look like? For B2B teams, especially those selling complex products with long sales cycles, I'd suggest thinking about SEO campaigns through a five-layer model. Each layer serves a distinct function in moving a buyer from awareness to closed deal, and skipping any one of them creates a gap that weakens the whole system. Crucially, this model should be aligned with your business objectives and built on a deep understanding of your target audience to ensure every SEO campaign supports broader organizational goals and resonates with the right buyers.
The demand capture layer is what most SEO campaigns focus on, and it’s important. These are the keywords your buyers already type when they’re actively looking for a solution. Here, your strategy should be to rank pages for high-intent keywords, ensuring your content is discoverable at the moment of need. But if you stop here, you’re only capturing existing demand and ignoring the much larger pool of potential buyers who don’t yet know they have a problem you solve.
That’s where demand creation comes in… this layer is about creating content with a genuine point of view, not just keyword-optimised answers to common questions. Prioritize creating quality content that makes someone think differently about a category—this is what separates brands that lead a market from brands that just participate in one.
The trust layer is the part most B2B campaigns underinvest in. Buyers in complex sales cycles don’t convert after reading one blog post. They need proof. Case studies, direct comparisons, and pages that address the specific objections their buying committee will raise. Without this layer, your funnel leaks at exactly the point where it matters most.
The conversion layer is where content meets pipeline. Every important landing page needs a clear next step that feels natural, not aggressive. A demo CTA on a pricing page makes sense. A demo CTA halfway through an educational guide about industry trends does not. The conversion design should match the buyer’s intent at each stage.
And the measurement layer ties everything together. Without it, you’re guessing at impact. With it, you can see which pages influence pipeline, which content accelerates deals, and where organic search fits into the broader revenue picture. Modern SEO isn’t “rank and wait.” It’s pipeline engineering, and each of these five layers is a load-bearing wall in that structure.
How to plan an SEO campaign by funnel stage
One of the biggest mistakes in B2B SEO planning is treating all keywords and content the same way. A blog post explaining what revenue attribution means serves a fundamentally different purpose than a comparison page evaluating the top five attribution tools. Lumping them together under "SEO content" creates confusion about goals, metrics, and expected timelines.
A smarter approach is to plan your campaign explicitly by funnel stage, with distinct goals, keywords, and assets for each.
- ToFu campaign: educate the market
The goal at the top of funnel is awareness and education. You're reaching people who are early in their research, possibly before they've even identified a specific need. Keywords here tend to be informational: "what is revenue attribution," "SEO campaign meaning," or "best practices for demand generation." The search volume is often higher, but the intent is lower. These visitors aren't ready to buy yet… they're learning.
The assets that work at this stage are comprehensive guides, glossary pages, and downloadable templates. The purpose isn’t conversion. It’s to earn trust, build brand familiarity, and get indexed for the broad terms that establish your authority in a category. Don’t measure ToFu content by demo requests. Measure it by engagement depth, returning visitors, and whether those visitors later show up in MoFu or BoFu journeys.
- MoFu campaign: help buyers compare options
The middle of funnel is where buying intent starts to crystallize. Someone searching "best B2B attribution tools" or "SEO campaign management software" has already identified a problem and is now evaluating options. These keywords are more competitive, but they're also more commercially valuable.
The assets here are comparison pages, detailed use-case breakdowns, and ROI-focused content that helps buyers build an internal business case. MoFu content should answer the question “why should I choose this approach (or this vendor) over the alternatives?” If your comparison pages are thin, two-paragraph summaries with a product plug at the end, they won’t rank and they won’t convince anyone. Give buyers the depth they need to make a decision. Additionally, acquiring relevant backlinks to your MoFu content is essential for improving your website’s authority and rankings, as search engines value high-quality, topic-related links pointing to your pages.
- BoFu campaign: convert qualified buyers
At the bottom of funnel, buyers are ready to act. They're searching for specific brand names, pricing information, demo options, and reviews. Keywords like "Factors.ai alternatives," "Factors.ai pricing," or "B2B attribution tool demo" signal purchase intent that's about as strong as it gets in organic search.
The assets at this stage are product pages, buyer guides, and proof content like case studies and testimonials. These pages should be conversion-optimized with clear CTAs, fast load times, and messaging that directly addresses the buyer’s final concerns. BoFu content often gets the least investment in B2B SEO campaigns because it doesn’t produce impressive traffic numbers. But a single BoFu page that converts at 8% is worth more than a hundred ToFu posts that convert at 0.1%.
Here’s the takeaway you need to hear: you’re probably over-investing in ToFu and starving BoFu. It feels productive to publish educational content because the volume metrics look good. But if your campaign doesn’t have dedicated BoFu pages for the queries buyers type right before they purchase, you’re handing that last-mile traffic to competitors who do.
SEO campaign management: the weekly operating rhythm
Talking about SEO campaign management in abstract terms is easy. "Prioritise, execute, iterate." That sounds nice in a strategy deck, but it doesn't tell you what to actually do on a Tuesday afternoon. What separates teams that generate pipeline from SEO and teams that just generate blog posts is an operating rhythm. A structured weekly cadence that ties every action back to business outcomes.
Here's a practical framework I've seen work well for B2B SaaS teams. It's not the only way to do it, but it forces the right conversations at the right frequency.
- Monday: Performance review. Start the week by looking at what moved. Check ranking changes for priority keywords. Identify any pages where click-through rate has dropped, since that often signals a SERP feature change or new competitor. Most importantly, review which organic pages influenced pipeline in the past seven days. This last point is the one most teams skip, and it's the one that matters most.
- Tuesday: Content sprint. This is your dedicated creation and optimisation day. Update ageing pages that have started to slip in rankings. Publish new cluster content that fills gaps in your pillar topics. The key here is to treat content updates with the same urgency as new content. A page that ranked on page one six months ago and has since dropped to page two is often faster to recover than a new page is to rank from scratch.
- Wednesday: Technical fixes. Address crawl errors, improve page speed, fix broken internal links, and audit your site architecture. Technical SEO work rarely feels urgent, which is exactly why it tends to pile up until something breaks. A weekly slot prevents that. Even thirty minutes of focused technical cleanup each week compounds into a significantly healthier site over a quarter.
- Thursday: SERP intelligence. This is your competitive awareness day. Look at what's changed in the search results for your priority keywords. Are new competitors showing up? Have AI-generated snippets shifted? Has a competitor refreshed a page that now outranks you? SERP intelligence isn't about reacting to every small change. It's about spotting patterns early enough to adjust your campaign before you lose ground.
- Friday: Revenue sync. End the week by connecting SEO activity to revenue outcomes. Review leads generated by organic pages, opportunities created, and assisted pipeline. This is the meeting where SEO campaign management stops being a marketing exercise and starts being a business conversation. If your Friday sync only covers rankings and traffic, you're missing the point.
This weekly rhythm turns SEO campaign management from a vague responsibility into a disciplined operating system. It also makes it much easier to communicate value to leadership, because you're not waiting for a quarterly review to connect the dots between organic search and revenue.
SEO campaign tracking that ties to revenue
If there's one section of this guide that earns its weight in pipeline, it's this one. The way most teams track SEO campaigns is fundamentally incomplete. They measure rankings, traffic, maybe bounce rate, and call it a day. Those metrics tell you whether your pages are visible. They don't tell you whether your campaign is actually working as a business investment.
Effective SEO campaign tracking operates on four distinct layers, each answering a different question about campaign health.
Layer 1: Visibility metrics
This is the foundation. You need to know whether your pages are being seen. The core metrics here are keyword rankings for priority terms, share of voice relative to competitors, and the number of indexed pages in your target clusters. Visibility metrics tell you whether your campaign has a pulse. They don't tell you whether it's generating value.
Layer 2: Engagement metrics
Once a page is visible, the next question is whether anyone cares. Click-through rate from the SERP is your first signal. A page ranking at position three with a 1.2% CTR is underperforming, and the fix is usually the title tag or meta description, not the content itself. Beyond CTR, look at engaged sessions (visitors who spend meaningful time on the page), scroll depth, and navigation patterns. Are readers moving from your blog post to your product page, or are they bouncing back to Google?
Layer 3: Buyer metrics
This is where tracking gets genuinely useful for B2B teams. Buyer metrics capture the actions that signal commercial intent. Demo requests originating from organic pages. Returning visitors who've come back multiple times before converting. Multi-touch visits where a single account engages with three or four organic pages before raising their hand. These metrics bridge the gap between "someone read our content" and "someone is considering buying from us." Without this layer, you can't distinguish between an educational reader and a potential customer.
Layer 4: Revenue metrics
The final layer is the one that earns budget and headcount. Track opportunities that were influenced by organic touchpoints. Measure pipeline sourced from organic landing pages. Calculate revenue influenced by SEO content across the full buyer journey, not just first-touch or last-touch. And compare your organic customer acquisition cost against paid search to demonstrate efficiency.
Here's the strong point of view I want to leave you with on this: SEO campaign tracking should answer "Did we create revenue momentum?" not "Did keyword number fourteen move to number nine?" If your tracking stack can't answer the first question, it doesn't matter how precisely you can answer the second one.
Content strategy and keyword research for an SEO campaign
Most SEO content strategies I've reviewed follow the same playbook. Find keywords, write blog posts, build a few pillar pages, and hope the internal links do their job. It works to a point, but it leaves a lot of value on the table for B2B teams. A smarter content strategy for an SEO campaign organizes content by commercial function, not just by keyword cluster.
I think about it in four categories, and each one plays a different role in moving the pipeline needle.
- Capture content
This is high-intent content designed to intercept buyers who are already searching for solutions. Product pages, feature pages, and landing pages targeting commercial keywords fall here. Capture content should be your highest-quality work because it targets visitors with the strongest purchase intent. These pages need sharp copy, fast load times, clear CTAs, and structured data that helps search engines understand exactly what you offer.
- Convert content
Convert content helps buyers make a decision. Comparison pages, alternatives posts, and pricing explainers belong in this category. When someone searches "Factors.ai vs [competitor]" or "best B2B attribution tools 2026," they're deep in the evaluation phase. The content that shows up needs to be honest, detailed, and structured in a way that makes comparison easy. A well-built comparison page can influence more pipeline than a dozen blog posts about general industry trends.
- Defend content
This category gets overlooked constantly, and it's a mistake. Defend content protects your brand in the search results. It includes pages optimized for your own brand queries, competitor comparison pages where you control the narrative, and reputation-management content. If someone searches your brand name and the first result is a negative review or a competitor's comparison page, you've lost control of your own story. Defend content ensures that doesn't happen..
- Expand content
Expand content is thought leadership that earns mentions, links, and citations. It's the content that positions your brand as a category expert. Original research, proprietary data analysis, and strong-opinion pieces that challenge conventional thinking all fall here. This content doesn't always rank for high-volume keywords, but it attracts the backlinks and brand mentions that strengthen the authority of everything else on your site.
One workflow note that reflects how modern SEO teams actually operate: start with your Google Search Console data before opening any third-party keyword tool. GSC shows you what queries you're already appearing for, where your CTR is underperforming, and which pages are close to ranking positions that would drive meaningful traffic. The insights are free, they're specific to your site, and they often reveal opportunities that keyword tools miss entirely. Use external tools to expand your research after you've mined what GSC already tells you.
Technical SEO that protects campaign ROI
Technical SEO is the part of the campaign that nobody wants to talk about in planning meetings. It's not glamorous. It doesn't produce shareable dashboards. And it's almost impossible to attribute revenue to it directly. But here's what it does: it protects every investment you make in content, links, and strategy from being silently undermined by technical issues your visitors never see.
I like to think of technical SEO as growth insurance. You don't notice it when it's working. You notice it painfully when it fails.
Crawl budget is the first area to watch, especially for larger sites. Search engines allocate a limited amount of crawling resources to each domain, and if your site wastes that budget on duplicate pages, redirect chains, or low-value parameter URLs, your important pages may not get crawled and indexed on a useful timeline. For B2B SaaS sites with hundreds or thousands of pages, managing crawl budget isn't optional. It's the difference between your new product page being indexed in days versus weeks.
Duplicate content and canonical tags go hand in hand. If you have multiple URLs serving substantially similar content (which is common with filtered views, staging environments, or UTM parameters), search engines need clear canonical signals to know which version to index. Without them, your pages compete against each other instead of against competitors.
Schema markup helps search engines understand the structure and meaning of your content. For B2B sites, FAQ schema, how-to schema, and organisation schema can improve how your pages appear in search results. It doesn't guarantee rich results, but it increases your eligibility for them.
Core Web Vitals remain a ranking factor, and they directly affect user experience. A page that loads slowly, shifts layout during loading, or takes too long to become interactive frustrates visitors and signals poor quality to search engines. The good news is that most Core Web Vitals issues have well-documented fixes. The bad news is that they tend to accumulate quietly until someone actually audits them.
Site architecture and internal linking depth determine how effectively search engines discover and prioritize your content. A page that sits four clicks deep from your homepage with only one internal link pointing to it is telling search engines it's not very important. If that page is a high-priority BoFu asset, your architecture is actively working against your campaign goals.
Finally, log file analysis gives you something no other SEO data source can: a record of exactly how search engine bots interact with your site. Which pages they crawl most frequently, which they ignore, and where they encounter errors. It's the closest thing to a direct conversation with the search engine about how it perceives your site.
Technical SEO rarely creates wins alone, but it blocks them silently all the time. A weekly technical maintenance habit, even a small one, prevents the kind of accumulated neglect that eventually requires an expensive, disruptive audit to fix.
SEO, paid media, and ABM: the hidden multiplier
Most B2B marketing teams treat SEO, paid media, and account-based marketing as separate channels with separate budgets, separate dashboards, and separate teams. That's understandable from an organizational perspective. It's also a missed opportunity that costs you compounding returns.
The strongest B2B campaigns I've seen don't run these channels in parallel. They run them as reinforcing loops, where the data from one channel actively improves the performance of the others. Let me give you some concrete examples of what that looks like.
- First, retargeting organic visitors on LinkedIn. Someone visits your high-intent SEO page about "B2B attribution tools." They read the comparison section, scroll to the pricing overview, and leave without converting. In a silo model, that visitor is gone. In an integrated model, they see a LinkedIn ad the next day featuring a case study from a company like theirs. The organic visit created the awareness. The paid touchpoint nudges the conversion. Neither channel gets full credit, and both deserve partial credit.
- Second, identifying companies visiting SEO pages. If you can see that a target account visited your "revenue attribution for B2B SaaS" page three times in the past two weeks, that's an intent signal your sales team can act on immediately. Without account-level visibility, those visits are just anonymous traffic in your analytics.
- Third, using paid media to accelerate pages that already convert organically. If a page is ranking on page one and converting at a strong rate, running paid ads for the same or related keywords can capture additional SERP real estate and increase total conversion volume. It's a much better paid media bet than bidding on keywords where you have no organic presence at all.
- Fourth, using SEO data to guide paid keyword bets. Your Google Search Console data tells you which queries are driving impressions and clicks. If you're ranking at position six for a high-value keyword and the CTR is low, running a paid ad for that exact keyword lets you capture the traffic while your organic position improves. It's a bridge strategy that most teams don't think about because the SEO and paid teams don't share data.
This is where the idea of what is an SEO business starts to evolve. An SEO business, in the modern definition, isn't just about search rankings. The SEO business definition has expanded to include any organisation that treats organic search as a core revenue channel, integrated with the rest of its go-to-market motion. When you unify channels instead of treating SEO as a silo, the whole system performs better than any individual channel could on its own.
90-day SEO campaign example for B2B SaaS
Theory is useful, but most marketing leaders I know want to see what an SEO campaign actually looks like in practice, week by week. Here's a realistic 90-day plan for a B2B SaaS company that's ready to move from ad hoc SEO efforts to a structured campaign with clear revenue goals.
Days 1 to 30: Foundation
The first month is entirely about preparation. Rushing into content production before the foundation is solid is how campaigns end up producing volume without direction.
- Run a full technical and content audit. Identify crawl errors, broken links, duplicate content, orphaned pages, and any indexation issues. Fix the critical ones immediately and log the rest for the Wednesday technical slots in your weekly rhythm.
- Map keywords to your ICP and buying journey. Don't just find high-volume keywords. Identify which terms your ideal customers actually search at each funnel stage, and map them to specific content assets you'll create or optimize.
- Fix indexation problems. If important pages aren't indexed, nothing else you do will matter. Submit priority pages for indexation, resolve canonical conflicts, and clean up your sitemap so it reflects the pages you actually want search engines to find.
- Define your campaign KPIs. Be specific. "Improve rankings" is not a KPI. "Rank in the top five for eight priority commercial keywords by day 90, generating at least 15 demo requests from organic traffic per month" is a KPI. Make sure your KPIs include at least one revenue-layer metric.
Days 31 to 60: Build
The second month is about creating and optimizing the content that will drive your campaign results.
- Publish eight high-intent pages. Focus on MoFu and BoFu content first, since these pages target buyers closer to a purchase decision and will generate pipeline faster than ToFu guides. Comparison pages, use-case pages, and product-focused content should take priority.
- Refresh ten existing assets. Look at pages that are ranking between positions five and fifteen. These are your "striking distance" opportunities. Update them with fresher data, better structure, stronger CTAs, and improved internal links. A refreshed page can jump from page two to page one within weeks, something a brand-new page rarely achieves.
- Add conversion CTAs to every priority page. Every page that targets a commercial keyword should have a clear, contextually appropriate next step. Don't slam a demo button on a ToFu educational guide. Do add a soft CTA like a related resource download or email capture. On BoFu pages, make the demo or trial CTA prominent and easy to find.
Days 61 to 90: Scale
The third month is about amplifying what you've built and connecting the results to revenue reporting.
- Run an internal linking sprint. Go through your top 20 priority pages and ensure each one has at least five relevant internal links pointing to it from other pages on your site. Internal linking is one of the highest-leverage, lowest-cost SEO activities, and most teams do it inconsistently.
- Launch targeted outreach for links and mentions. Identify industry publications, partner blogs, and communities where your expand content would add genuine value. Earned links from relevant, authoritative sources accelerate ranking velocity in ways that on-page optimisation alone can't match.
- Activate a paid retargeting layer. Set up retargeting campaigns for visitors to your highest-converting organic pages. This bridges the gap between anonymous organic visits and pipeline, especially for accounts that need multiple touchpoints before converting.
- Build your first revenue report. Pull together a clear view of pipeline influenced by organic pages, demo requests from SEO traffic, and any opportunities that touched organic content during the buyer journey. This report is what earns your campaign continued investment.
The expected outcomes after 90 days aren't dramatic overnight transformations. They're the building blocks of sustainable organic growth. Faster crawl efficiency from the technical work in month one. Ranking momentum from the content build in month two. More qualified organic traffic and initial pipeline signals from the scaling efforts in month three. The real compounding happens in months four through six, but only if the 90-day foundation is solid.
Common SEO campaign mistakes
After walking through what a well-built campaign looks like, it's worth naming the mistakes that sabotage results most often. I've seen every single one of these play out in real campaigns, some of them in my own.
- Chasing volume over intent
The instinct to target high-volume keywords is strong, but a keyword that gets 10,000 searches per month from people who will never buy your product is worth less than a keyword that gets 200 searches from qualified buyers. Revenue-per-visit matters more than visits alone.
- Measuring only traffic
If your campaign review meeting starts and ends with a sessions graph, you're measuring effort, not impact. Traffic is an input metric. Pipeline and revenue are output metrics. Report on both.
- Ignoring BoFu pages
It's more fun to write big educational guides than it is to optimize a pricing page or build a competitor comparison. But BoFu pages are where organic traffic converts into pipeline, and neglecting them means your campaign has a leaky bottom.
- Publishing too much weak content
Fifteen mediocre blog posts published in a month will do less for your campaign than three genuinely excellent ones. Search engines have gotten very good at identifying thin, derivative content, and in 2026, quality signals matter more than they ever have.
- No refresh cycle
Content doesn't stay fresh forever. A page that ranked well twelve months ago may need updated data, new examples, and improved structure to maintain its position. Build content refreshes into your campaign rhythm from the start, not as an afterthought when rankings slip.
- No CRM connection
If your SEO data and your CRM data live in completely separate systems with no bridge between them, you can't answer the question that matters most: did this campaign create revenue? The connection doesn't have to be technically complex, but it does have to exist.
- Treating SEO as a content intern project
SEO campaign management requires strategic thinking, technical understanding, and cross-functional coordination. Assigning it to the most junior person on the team without proper support or authority is a recipe for underperformance. It's not a content project. It's a growth programme.
- Expecting 30-day miracles
SEO compounds over time. If your leadership expects page-one rankings and significant pipeline within the first month, you need to reset those expectations before the campaign starts. A realistic timeline for measurable momentum is three to six months, depending on your domain authority, competition, and execution speed.
How does Factors.ai help measure SEO impact?
Everything we've discussed in this guide points toward one central challenge: connecting SEO activity to business outcomes in a way that's credible and actionable. That's where Factors.ai fits into the picture.
Factors.ai helps B2B teams see which companies arrive on their site via organic search. Instead of staring at anonymous session counts, you can see that a specific target account visited your comparison page, your pricing page, and your case study page over a two-week window. That account-level visibility turns anonymous traffic into actionable pipeline intelligence.
The platform tracks multi-touch journeys from the first organic visit all the way through to demo request and beyond. This means you can see the full path an account took, not just the last page they touched before converting. For teams that need to prove SEO's contribution to pipeline, that journey-level data is transformative.
Factors.ai also lets you compare organic versus paid assisted pipeline side by side. When finance asks whether SEO is more efficient than paid search, you can answer with real numbers instead of estimates. You can route high-intent accounts to sales based on their content consumption patterns. An account that's visited five organic pages in a week is signalling interest that your sales team should know about.
And perhaps most practically, it gives you page-level revenue influence data. You can see exactly which SEO pages contributed to opportunities and closed deals. That turns your SEO reporting from a marketing exercise into a revenue conversation. SEO becomes much easier to justify when finance can see the pipeline trail.
In a nutshell…
An SEO campaign that drives revenue looks fundamentally different from one that drives traffic. It starts with ICP-aligned keyword research organized by funnel stage, not sorted by volume. It runs on a weekly operating rhythm that connects content, technical work, and competitive intelligence back to pipeline metrics every single Friday. It tracks four layers of performance, from visibility through engagement, buyer behavior, and revenue, so you're never in a position where you can prove rankings moved but can't prove the business benefited.
The five-layer model of demand capture, demand creation, trust, conversion, and measurement gives you a framework that goes beyond traditional keyword-and-blog-post SEO. Layering SEO with paid media and ABM creates compounding returns that no single channel achieves alone. And a realistic 90-day plan with distinct foundation, build, and scale phases keeps the campaign focused instead of scattered.
If you take one thing from this guide, make it this: stop measuring SEO campaigns by the metrics that only marketers care about and start measuring them by the metrics that earn continued investment. Rankings matter. Traffic matters. But pipeline influenced, revenue sourced, and customer acquisition cost compared to paid are the numbers that keep an SEO campaign funded and growing.
Build the reporting infrastructure that connects organic search to your CRM. Run the weekly rhythm that forces revenue conversations, not just ranking celebrations. And invest in BoFu content with the same energy you give to ToFu guides. The teams that do this consistently are the ones whose SEO campaigns actually show up in the board deck, not just the marketing dashboard.
Frequently asked questions about SEO campaigns
Q1. What is an SEO campaign vs. ongoing SEO?
Ongoing SEO is the "health maintenance" of your site, fixing broken links, monitoring rankings, and technical hygiene. An SEO campaign is a strategic, time-bound initiative (e.g., a 90-day sprint) with a specific business goal, such as "dominating the attribution software category" or "launching a new product vertical." It is goal-led and outcome-focused rather than just maintenance-oriented.
Q2. Why do most B2B SEO campaigns fail to drive pipeline?
Most campaigns fail because they optimize for traffic volume rather than buyer intent. A blog post that gets 10,000 monthly visits from students is a failure if your goal is to reach 50 Enterprise CTOs. Campaigns often stall because:
- They prioritize high-volume keywords over high-intent ones.
- They lack a Conversion Layer (clear paths to demos or trials).
- They aren't connected to the CRM, leaving the "revenue influence" invisible.
Q3. How do I track an SEO campaign's ROI?
To move beyond vanity metrics, you must track your campaign across four distinct layers:
- Visibility: Are our target keywords moving into the top 5 positions?
- Engagement: Are visitors staying on the page or bouncing back to the SERP?
- Buyer Intent: Are target accounts (ICPs) visiting high-value pages?
- Revenue: How many opportunities in the CRM were influenced by organic touchpoints?
Q4. What is the "Trust Layer" in a B2B SEO strategy?
In complex B2B sales, buyers don't convert after one visit. The Trust Layer consists of content that validates your authority right when a buyer is ready to compare. This includes:
- Comparison Pages: (e.g., YourBrand vs. Competitor)
- Case Studies: SEO-optimized proof of results.
- ROI Calculators: Interactive tools that solve a specific problem for the buyer.
Q5. How does technical SEO protect my campaign ROI?
Technical SEO is your "growth insurance." You can have the best content in the world, but if your Crawl Budget is wasted on duplicate pages or your Core Web Vitals (speed and stability) are poor, search engines won't rank your pages.
Q6. How do SEO, Paid Media, and ABM work together?
The strongest campaigns use these channels as a reinforcing loop:
- SEO to Paid: Retarget organic visitors who hit your pricing page with a specific LinkedIn Ad case study.
- Paid to SEO: Use paid search to "test" which keywords convert before investing 3 months in ranking for them organically.
- SEO to ABM: Alert Sales when a Tier-1 target account visits a high-intent organic page, turning "traffic" into a "warm lead."

The SEO strategy process
Learn the full SEO strategy process for B2B brands—from planning and audits to execution, reporting, maintenance, and AI-era search visibility.
TL;DR
- An SEO strategy is a structured system that connects business goals, keyword intent, content architecture, technical health, authority, and measurement into a repeatable operating model.
- The process of SEO starts with revenue goals, not keyword volumes. Every keyword should trace back to a commercial outcome like pipeline, demos, or category ownership.
- SEO also means showing up in AI-generated answers and brand citations across the web, not only in traditional Google rankings.
- SEO maintenance is what separates compounding growth from slow decay. Monthly content refreshes, internal linking, and CTA optimization aren't optional.
- Teams can measure SEOeffectiveness with these metrics: influenced revenue, opportunity creation, and assisted conversions.
I’ve seen SEO at a lot of B2B companies play out like a movie with a great trailer and a disappointing ending. Strong opening act: traffic is up, blogs are live, rankings are climbing, everyone’s feeling an upbeat-music-type boardroom energy.
Then the final scene arrives… sales asks, “Nice, but did any of this become pipeline?” Cue the silence.
Most of the time, the SEO strategy itself hasn’t worked too well. Unfortunately, teams treat SEO as content production rather than a growth engine. They chased publish dates, keyword volumes, and vanity wins without tying any of it to buyer intent or revenue.
I’ve watched this happen more times than I’d like.
This guide is about the SEO strategy process, the way it should work: smart planning, clear priorities, content that attracts the right people, and measurement that goes beyond applause for traffic charts. If your SEO currently feels more style than substance, this is for you.
What is an SEO strategy, really?
An SEO strategy is a structured plan to grow qualified organic visibility, conversions, and revenue over time. It coordinates four things: content that matches buyer intent, technical improvements that remove friction, authority signals that build trust, and measurement that ties everything back to business outcomes. That’s the SEO strategy definition in its cleanest form. Search engine optimization (SEO) is the process of improving a website’s visibility and ranking in search engine results pages (SERPs) through various techniques, and it plays a crucial role within digital marketing by driving organic traffic and supporting broader marketing objectives.
What it isn’t is a content calendar with some keyword research sprinkled on top. Too many teams treat search engine optimization as “publish blogs and wait,” which is roughly the equivalent of printing business cards and hoping the phone rings. As a core digital marketing discipline, a real optimization strategy operates on three levels simultaneously: demand capture (ranking for what buyers are already searching), demand creation (building category awareness through educational content), and trust building (earning the kind of reputation that makes Google and AI assistants want to cite you).
There’s a useful way to think about the difference between tactics and strategy here. A tactic is updating a title tag to improve click-through rate. A strategy is deciding which product categories your brand should own in search over the next twelve months, and then building the content architecture, technical foundation, and authority plan to make that happen. One is a task. The other is a system.
For SaaS brands specifically, the SEO lens needs to be commercial. Your organic presence should be designed to attract problem-aware buyers who don’t know your category exists yet, solution researchers comparing options, comparison-stage buyers evaluating you against competitors, and high-intent returning visitors who’ve already engaged with your brand. If your SEO only catches the first group, you’re building an audience. If it catches all four, you’re building a pipeline.
How to create an SEO strategy: a step-by-step process
Before we get into the details of each step, here's the full SEO strategyprocess laid out… if you're scanning for a quick answer, this is it:
- Set business goals that SEO will serve
- Audit your existing search footprint to understand where you stand
- Build an intent-led keyword strategy organized by buying stage
- Map keywords to revenue pages, not just blog posts
- Create content that genuinely deserves to rank with original thinking
- Fix technical SEO bottlenecks that silently block performance
- Build authority through distribution, not just outreach
- Measure SEO beyond traffic by tying it to pipeline and revenue
- Maintain and govern your SEO programme continuously
Each of these steps feeds into the next. Skip one and you'll feel the gap downstream, usually around month four when growth stalls and nobody can explain why.
One thing worth I’ll flag upfront… this process has expanded in the past year. In 2026, a successful SEO strategy also includes citation visibility in AI tools like ChatGPT, Perplexity, and Gemini, plus brand mentions across the web that influence how these models surface recommendations. Ranking on page one of Google and achieving high search engine rankings on search engine result pages (SERPs) still matter enormously, as SERPs and search engine results remain crucial metrics for visibility and traffic. But it’s no longer the only scoreboard. Your SEO relevance now extends to whether AI assistants name-drop your brand when someone asks for a recommendation in your category. Optimizing for AI and large language models (LLMs) can significantly improve overall SEO performance, so an effective SEO strategy must adapt to both traditional and AI-driven search engine results.
Step 1: Set business goals before keywords
Most SEO programmes fail for a reason that has nothing to do with content quality or technical debt. They fail because the team started with keywords instead of outcomes. Someone opened Ahrefs, sorted by volume, and built a content plan around whatever had the biggest numbers. Six months later, the blog has traffic and the pipeline has nothing to show for it.
The SEO planning process should start with a single question: what does the business need from organic search in the next twelve months? For B2B brands, the honest answer usually falls into one of these buckets:
- Pipeline growth from inbound organic leads
- Demo bookings from high-intent search traffic
- Category awareness in a market where buyers don't know your solution type exists
- Lower customer acquisition cost by reducing dependence on paid channels
- Geographic expansion into new markets
- Competitor displacement for comparison and alternative searches
The goal you choose changes your entire keyword strategy. If your priority is pipeline, you'll weight your efforts toward BoFu pages: comparison content, alternative pages, pricing-related queries, and integration searches. If your goal is category awareness, you'll invest heavily in educational hubs that define the problem space. If you're targeting enterprise buyers, you'll need industry-specific pages that speak to vertical use cases.
Here's an example that makes this concrete. A B2B attribution platform like Factors.ai could pursue any of these goals. If the priority is pipeline, the SEO roadmap focuses on pages like "Factors.ai vs Demandbase" and "best B2B attribution software." If the priority is awareness, the roadmap centers on guides like "what is multi-touch attribution" and "how to measure marketing influence on revenue." Same company, same product, completely different SEO architecture.
The mistake I see most often is treating all goals as equal and trying to pursue them simultaneously. That produces a scattered content programme that ranks for nothing in particular. Pick one primary goal per quarter, build your keyword map around it, and let the secondary goals ride as supporting priorities. You can rotate focus quarterly, but each quarter needs a clear north star. And critically, tie your SEO goals to pipeline outcomes, not vanity traffic numbers. If your dashboard doesn't connect organic sessions to opportunities created, you're measuring the wrong thing.
Step 2: How do you audit your existing search footprint?
Before you build anything new, you need an honest picture of where you stand. An SEO audit isn't a one-time checkbox exercise. It's the diagnostic step that tells you where the real opportunities and hidden problems live.
Here's what a thorough audit covers:
- What ranks today
Pull your current keyword positions from Google Search Console and identify everything in the top 20. Pay special attention to page 2 rankings (positions 11-20), because those are your fastest wins. These pages have already earned enough trust to be visible. They just need optimization to cross the threshold.
- What converts today
Connect your organic landing pages to conversion data in GA4 and your CRM. Some pages drive tonnes of traffic but zero pipeline. Others get modest visits but generate real demo requests. The second group deserves more investment.
- What's decaying
Look at pages that ranked well six or twelve months ago but have been steadily declining. Content decay is one of the most overlooked problems in B2B SEO. Your best SEO opportunities are often hidden in these forgotten old pages that just need a refresh.
- Indexing issues
Use a crawl tool like Screaming Frog or Sitebulb to identify pages that aren't being indexed, have noindex tags applied incorrectly, or are stuck in crawl limbo because of redirect chains.
- Keyword cannibalization
If you have three blog posts and a product page all targeting the same keyword cluster, Google can't decide which one to rank. The result is that none of them rank well. Identify overlapping pages and consolidate or differentiate them.
- Missing comparison pages
For B2B SaaS brands, "[your brand] vs [competitor]" pages are some of the highest-intent content you can create. If you don't have them, your competitors are controlling that narrative.
- Brand vs non-brand split
What percentage of your organic traffic comes from people searching your brand name versus generic category terms? A healthy programme grows non-brand traffic over time. If 80% of your organic sessions are branded, your SEO isn't really doing the acquisition work.
The tools that matter most here are Google Search Console for keyword position data, GA4 for on-site behavior and conversions, your CRM for pipeline attribution, and a technical crawl tool for site health. You don't need a dozen platforms. You need four that you actually use consistently.
One pattern I notice repeatedly in SaaS audits is that companies sitting on a goldmine of page 2 rankings don't even realize it. They're chasing brand new keywords when they already have 30 pages hovering at positions 12-18. Refreshing those pages with updated content, better internal linking, and improved on-page SEO can deliver measurable ranking improvements within weeks, not months.
Step 3: How do you build an intent-led keyword strategy?
This is where most SEO guides lose the plot. They'll tell you to find high-volume keywords, check the difficulty score, and start writing. That approach works for media sites chasing ad revenue. For B2B brands, it's a recipe for expensive irrelevance.
The shift you need to make is from keyword volume to keyword intent. When you're doing SEO targeting for a B2B audience, every keyword should be tagged by where the searcher sits in the buying journey. Here's how that looks in practice:
Search volume alone is deeply misleading in B2B. A keyword with 90 searches per month that attracts buyers comparing attribution platforms will outperform a 9,000-volume keyword about a generic marketing concept every single time. That high-volume keyword might generate blog traffic from students, freelancers, and people with zero buying authority. The low-volume keyword generates visits from the exact people your sales team wants to talk to.
When you cluster your keywords by intent, patterns emerge quickly. You'll see gaps where you have no BoFu content at all, which means you're losing comparison-stage buyers to competitors who do. You'll spot ToFu clusters where a single pillar page could capture an entire topic. And you'll find MoFu opportunities where a well-structured solution page could rank for a dozen related queries.
The process works like this. Start by listing every question your buyers ask throughout their journey, from first problem recognition to final vendor selection. Then find the keywords that match those questions. Group them into clusters by topic and intent. Prioritise the clusters that align with your quarterly business goal. And then assign each cluster to a specific page type, which brings us to the next step.
Step 4: How do you map keywords to revenue pages?
Most teams stop at keyword research and jump straight to writing blog posts. The result is a content library where every keyword maps to a blog, and none of them connect to the pages that actually drive revenue. If every keyword maps to a blog, your strategy is incomplete.
A complete keyword-to-page architecture uses four distinct page types, each with a different commercial role.
- Product pages are your primary conversion engines
These target keywords where the searcher is looking for a specific capability. Think "LinkedIn ads attribution software" or "ABM measurement platform." These pages should rank for feature-specific queries and lead directly to demos or trials.
- Solution pages sit between product pages and educational content
They address a use case or pain point and position your product as the answer. "How to measure LinkedIn ROI" is a solution page query. The content educates, but the page architecture guides the reader toward a product-aware conclusion.
- Comparison pages are your BoFu workhorses
"Factors.ai vs 6sense" or "Demandbase alternatives" are searches made by buyers who are actively shortlisting vendors. If you don't own these pages, someone else is framing the comparison for you. That's a competitive risk you can't afford.
- Educational content covers the broader topic space
These are your ToFu and MoFu pieces: guides, frameworks, benchmarks, and explanatory content. They build authority and organic visibility across your category. But they should always link internally to your product and solution pages, creating pathways from awareness to conversion.
- The mapping exercise itself is straightforward once you've done the intent clustering
For each keyword cluster, ask: what page type gives this searcher the best experience? If someone searches "what is multi-touch attribution," they want an educational guide. If they search "best attribution software for B2B," they want a solution or comparison page. If they search "Factors.ai pricing," they want a product page.
- The magic is in the internal linking between these page types
Your educational content attracts broad organic traffic. Solution pages capture mid-funnel interest. Comparison pages convert late-stage buyers. And product pages close the loop. When the internal architecture connects all four layers, every visitor has a natural path toward conversion, regardless of where they entered.
Step 5: How do you create content that actually deserves to rank?
Here's an uncomfortable truth about B2B content in 2026: most of it is indistinguishable from AI sludge. Same structure, same generic examples, same surface-level explanations, same everything. Google's systems have gotten remarkably good at identifying content that adds nothing new to a conversation, and they're rewarding the opposite.
Content that deserves to rank has a few non-negotiable qualities. It needs a strong point of view, not just a summary of what everyone else has already said. It needs first-hand expertise, the kind that comes from actually doing the work you're writing about. And it needs specificity: real screenshots, original frameworks, actual benchmarks, named examples, and concrete data points.
The bar for SEO relevance in content has risen dramatically. Here's what modern ranking content looks like versus what most teams are still producing:
There's another dimension here that matters increasingly. Content now needs to be structured for LLM consumption, not just human readers. AI assistants pull answers from content that has clean headings, TL;DR boxes, comparison tables, FAQ sections, and clear definitions early in the piece. If your content is a wall of prose with no structural hooks, it might rank on Google but it won't get cited by ChatGPT or Perplexity.
That doesn't mean writing for robots instead of humans. It means writing well-structured content that serves both audiences. A comparison table that helps a human reader scan quickly also gives an AI model a clean data structure to pull from. A clear definition in the first paragraph satisfies both the featured snippet algorithm and the LLM looking for a concise answer.
One more thing I want to add here is this… the easiest way to lose in SEO today is to publish content that has no byline expertise, no original thinking, and no reason to exist beyond keyword targeting. You can use AI tools in your workflow. But the final output needs to carry the fingerprint of someone who's actually done the work. Readers can tell the difference, and, increasingly, so can search engines.
Step 6: What technical SEO bottlenecks and technical SEO issues you should fix?
Technical SEO is the part of the process that gets the least attention and causes the most invisible damage. You can produce excellent content and build strong backlinks, but if your site has fundamental technical issues, Google can't properly crawl, index, or rank your pages. It's like building a brilliant storefront and forgetting to unlock the front door.
The SEO requirements that matter most on the technical side are:
- Crawlability
Can Google's bots actually reach all your important pages? Broken internal links, orphaned pages, and overly deep site architecture can all prevent crawlers from finding your content.
- Indexability
Just because a page is crawled doesn't mean it's indexed. Accidental noindex tags, canonical misconfigurations, and thin content can all keep pages out of the index entirely.
- Core Web Vitals
Page speed, visual stability, and interactivity metrics directly influence rankings. A page that loads slowly on mobile will underperform a faster competitor, even if the content is better.
- Duplicate content
Parameter URLs, www vs non-www variations, and HTTP vs HTTPS versions can create duplicate page issues that dilute your ranking signals across multiple URLs.
- Redirect chains
When one redirect points to another redirect, which points to another, you lose link equity at each hop. Clean up chains so every redirect points directly to the final destination.
- Sitemap hygiene
Your XML sitemap should include only the pages you want indexed. If it contains redirected URLs, noindexed pages, or 404 errors, you're sending confusing signals to crawlers.
- Structured data
Schema markup helps search engines understand what your content is about. FAQ schema, how-to schema, and article schema can improve how your pages appear in search results and increase click-through rates.
SaaS companies have a particular set of technical SEO challenges that other industries don't face. Product documentation often lives on subdomains that either leak SEO equity or create cannibalization issues with the main blog. Blog migrations between CMS platforms (the classic HubSpot to WordPress switch, or vice versa) can destroy years of built-up link equity if redirects aren't handled perfectly. And parameter URLs generated by product features, filters, or UTM tracking can create thousands of duplicate pages that waste crawl budget.
The fix for most of these isn't glamorous. It's a crawl audit, a prioritized spreadsheet, and a few weeks of engineering time. But the impact can be immediate. I've seen SaaS sites recover 20-30% organic traffic simply by cleaning up redirect chains and fixing cannibalization issues that had been quietly bleeding performance for months.
Step 7: How do you build authority through distribution?
For years, "build links" was the standard advice in every SEO guide. And while backlinks still matter as a ranking signal, the old-school approach of mass outreach and guest post exchanges feels increasingly disconnected from how authority actually works in 2026. The brands with the strongest link profiles aren't running aggressive outreach campaigns. They're earning links as a byproduct of doing interesting, visible, citable work.
Authority today comes from a wider set of SEO activity than just backlinks:
- PR and media mentions
When a journalist or industry publication references your research, quotes your founder, or covers your product launch, you earn both a link and brand visibility. PR and SEO have converged more in the past two years than in the previous ten.
- Founder and executive thought leadership
LinkedIn posts, podcast appearances, conference talks, and bylined articles all create the kind of brand surface area that generates organic mentions and links. When your CEO is regularly sharing sharp insights about your category, journalists and bloggers start citing those ideas.
- Original research
Publish a benchmark report, run a survey, or analyse your own product data in aggregate. Original data is the most linkable asset type in B2B. Other writers need data points to support their arguments, and if yours are good, they'll cite you repeatedly.
- Product-led assets
Free tools, calculators, templates, and interactive resources earn links because they're genuinely useful. A free ROI calculator for LinkedIn ads attribution, for instance, would attract links from marketing blogs, LinkedIn posts, and resource roundups.
- Partnerships and co-marketing
Joint webinars, co-authored research, and integration announcements with complementary products all create natural link opportunities while strengthening commercial relationships.
Backlinks are outcomes of reputation, not just outreach. When your brand is visible, your leaders are active, and your content is genuinely original, links happen. You still need a distribution plan. You still need to promote your best content. But the foundation is built on being worth linking to, not on sending cold emails asking for links.
One practical way to manage SEO authority building is to dedicate a portion of your content calendar specifically to "link magnet" pieces. These are assets designed primarily for external distribution: original research, provocative frameworks, or comprehensive benchmark reports. They don't need to target high-volume keywords. Their job is to earn links and mentions that strengthen the domain authority behind all your other content.
Step 8: How do you measure SEO beyond traffic?
This is where most SEO programmes reveal whether they're genuinely strategic or just performing SEO activity that looks productive. Traffic is the easiest metric to measure and the least useful for B2B companies. It tells you people showed up. It doesn't tell you whether they were the right people, whether they moved toward a purchase, or whether organic search actually influenced revenue.
The metrics that matter for B2B SEO success sit further down the funnel:
The challenge, of course, is that B2B buying journeys are messy. A buyer might read your blog post, leave, see a LinkedIn ad two weeks later, come back directly, attend a webinar, and then request a demo. If you only look at last-touch attribution, organic gets zero credit for starting that journey. If you only look at first-touch, organic gets all the credit but the LinkedIn ad team rightfully objects.
This is exactly why multi-touch attribution tools exist for B2B, and where a platform like Factors.ai fits naturally into the SEO measurement picture. It stitches together the full account journey across paid, organic, and direct channels. You can see which organic landing pages appear in the paths of accounts that eventually convert. You can measure pipeline influenced by organic content even when the final conversion happened through a sales outreach. And you can compare how organic and paid work together across the funnel, rather than treating them as competing channels.
Traffic without commercial movement is audience theatre. If your SEO report leads with sessions and pageviews but can't answer the question "how much pipeline did organic influence this quarter," you're measuring the easy thing instead of the important thing. The reporting cadence should include both leading indicators (rankings, impressions, click-through rates) and lagging indicators (pipeline, opportunities, revenue). Leading indicators tell you the programme is on track. Lagging indicators tell you it's actually working.
Step 9: SEO maintenance and governance
Here's a sentence that should be framed on every content team's wall: the page you published twelve months ago is either ageing into authority or decaying into irrelevance. There's no steady state in SEO. The algorithm changes, competitors publish better content, data goes stale, and user expectations evolve. Without active SEO maintenance, even your best-performing pages will gradually lose ground.
The teams that manage SEO well treat it as an ongoing operating system, not a project with a start and end date. Here's what a monthly maintenance cadence looks like in practice:
- Refresh declining pages
Identify pages that have lost rankings or traffic over the past 90 days. Update the content with fresh data, better examples, new sections that address emerging subtopics, and improved formatting.
- Update statistics and data points
If a blog post cites a 2024 benchmark, it needs a 2025 or 2026 figure now. Outdated stats signal to both readers and search engines that your content isn't being maintained.
- Add internal links
Every new page you publish creates an opportunity to add internal links from existing content. This strengthens the new page's authority and helps crawlers find it faster. Most teams forget this step entirely.
- Consolidate duplicate or overlapping content
Over time, content libraries accumulate posts that cover similar topics. Identify overlaps, merge the best elements into a single authoritative page, and redirect the weaker pages.
- Re-optimize titles for click-through rate
Your title tag is the first thing searchers see. Testing new titles that improve CTR can boost rankings without changing a single word of the content itself.
- Improve calls to action
Are your CTAs still relevant? Does the demo booking link still work? Is the lead magnet you're promoting still your best asset? Small CTA improvements compound across thousands of monthly visits.
- Monitor competitor movements
When a competitor publishes a comprehensive guide on a topic you own, you need to respond. Set up alerts or run monthly checks on your priority keyword clusters.
- Add new schema markup
As Google introduces new structured data types, updating your schema can improve rich snippet visibility. FAQ schema, how-to schema, and article schema should be reviewed quarterly.
How to manage SEO governance across a team is a separate challenge. The most effective approach is to assign clear ownership by function. Someone owns content refreshes. Someone owns technical health. Someone owns reporting. And someone owns the quarterly roadmap that ties it all together. Without ownership, maintenance tasks drift into "we'll get to it eventually" territory, which in practice means never.
The B2B SEO process for Factors.ai (an example framework)
Abstract frameworks are useful. But seeing how the SEO process steps map to a real B2B brand makes the strategy tangible. Here's how a quarterly SEO roadmap might look for a platform like Factors.ai that sits in the B2B attribution and account intelligence space.
Quarter 1: Fix the foundation and optimise money pages
The first quarter is about removing technical blockers and making sure your highest-intent pages are performing. Run a full technical audit: fix redirect chains, resolve cannibalisation, clean up the sitemap, and address any Core Web Vitals issues. Simultaneously, optimise your existing product and comparison pages. If you have a "Factors.ai vs 6sense" page that ranks on page 2, that's your fastest pipeline win.
Metrics to track: Indexed page count, technical health score, money page rankings, demo requests from organic landing pages.
Quarter 2: Own the category topics and comparison searches
With the technical foundation clean, quarter two focuses on content that captures mid-funnel and BoFu demand. Build comparison pages for every major competitor. Create solution pages for your core use cases: LinkedIn ads attribution, ABM measurement, pipeline attribution. And publish the pillar guides that establish your authority on the topics your buyers care about most.
Metrics to track: Non-brand keyword rankings, organic traffic to comparison and solution pages, pipeline influenced by organic content.
Quarter 3: Launch research-led link magnets
Quarter three shifts toward authority building. Publish original research using aggregated product data: benchmark reports on B2B attribution trends, average time-to-conversion data, channel mix analyses. These assets earn links and media mentions while positioning Factors.ai as a category thought leader. Pair them with a distribution plan across PR, LinkedIn, and partner channels.
Metrics to track: Referring domains, backlinks earned, media mentions, branded search volume growth.
Quarter 4: Expand internationally and build AI citation visibility
With a strong domestic SEO foundation, quarter four tackles two expansion plays. First, create localised content for new geographic markets where Factors.ai is growing. Second, optimise for AI citation visibility by ensuring your brand appears in LLM training data through structured content, original research citations, and consistent brand mentions across authoritative sources.
Metrics to track: International organic traffic, AI citation audits (checking if brand appears in ChatGPT/Perplexity responses), CAC reduction from organic, opportunity velocity improvement.
This framework isn't a rigid playbook. It's a thinking model that any B2B brand can adapt to their stage, market, and goals. The key principle is sequencing: fix first, then build, then amplify, then expand.
Common SEO strategy mistakes
After watching dozens of B2B companies run SEO programmes, certain failure patterns show up with depressing regularity. Most of them aren't about doing the wrong things. They're about doing the right things in the wrong order, or stopping too early.
- Publishing content without mapping keyword intent
Writing a blog post because a topic "seems relevant" without understanding whether the searcher wants a definition, a comparison, or a product recommendation. The content might be well-written and still rank nowhere because it doesn't match what Google thinks the query wants.
- Chasing volume over commercial value
Targeting a 10,000-search keyword about a general marketing concept when a 200-search keyword about your specific product category would generate actual pipeline. Volume is a vanity metric in B2B keyword research.
- Ignoring BoFu pages entirely
Most B2B content programmes are weighted heavily toward ToFu educational content. That's important for awareness, but it leaves the highest-intent searches unaddressed. If you don't have comparison pages, alternative pages, and use-case pages, you're leaking pipeline.
- Measuring traffic as the primary success metric
Traffic graphs look impressive in executive presentations. But if those sessions don't connect to pipeline, opportunities, or revenue, you're measuring effort, not impact.
- No internal linking system
Every new page should be linked from relevant existing pages. Every pillar page should link to its supporting content. Without deliberate internal linking, your site architecture becomes a collection of disconnected islands.
- Treating SEO as a side project
SEO compounds over time, but only when it receives consistent investment. Assigning it to a junior marketer who also handles social media and event logistics is a recipe for stagnation.
- Overusing AI-generated content with no expertise layer
AI tools can accelerate content production. But publishing AI drafts without adding original insights, real examples, and genuine expertise produces content that neither readers nor search engines value. The output needs a human fingerprint.
- Stopping after three months
SEO typically takes three to six months to show meaningful traction, and longer for competitive B2B categories. Companies that pull the plug at month three are often abandoning a programme right before it was about to produce results. It's like planting a tree, watering it for eleven weeks, and then cutting it down because it hasn't produced fruit yet.
In a nutshell…
The full SEO process for B2B isn't complicated in theory. It's just that each piece needs to work together as a system rather than as isolated activities. You start with business goals that are specific enough to guide keyword selection. You audit what you already have to find the fastest wins. You build a keyword strategy organized by buyer intent, not just search volume. You map those keywords to the right page types, including product pages and comparisons, not just blog posts. You create content that has genuine expertise and a real point of view. You fix technical issues that silently block performance. You build authority by being visible and worth citing. You measure what matters, which is pipeline and revenue, not just sessions. And you maintain the whole system monthly because content decays the moment you stop maintaining it.
If you take one thing from this guide, it's this: the brands that win in organic search rarely have one secret trick. They have a repeatable system where planning, content, technical health, authority, and analytics run together as an operating model. Build that system, staff it properly, measure it against revenue, and keep it running. That's the entire SEO strategy.
Frequently asked questions about the SEO strategy process
Q1. What is an SEO strategy?
An SEO strategy is a structured plan to grow qualified organic visibility, leads, and revenue through coordinated content, technical SEO improvements, authority building, and ongoing optimization. It goes beyond publishing blog posts by connecting every piece of SEO activity to a measurable business outcome. The strongest strategies are built around buyer intent and commercial goals, not just keyword volume.
Q2. What are the steps in the SEO strategy process?
The core SEO process steps are: setting business goals, auditing your current search performance, conducting keyword and intent research, planning content architecture, executing on-page optimization, fixing technical issues, building authority through distribution, reporting on meaningful metrics, and running continuous maintenance. Each step feeds into the next, and skipping any of them creates gaps that show up later as stalled performance.
Q3. How long does SEO take to show results?
Most B2B SEO programmes take three to six months to show meaningful traction in rankings and traffic. Pipeline impact usually takes longer because B2B buying cycles themselves are long. Competitive categories with well-established incumbents may require nine to twelve months of sustained effort before organic becomes a reliable pipeline source. The key variable is how quickly technical issues get resolved and how consistently content gets published.
Q4. How do you manage SEO strategy effectively?
The most effective way to manage SEO is through quarterly roadmaps with monthly execution cycles. Each quarter should have a clear priority goal. Monthly reporting should include both leading indicators like rankings and impressions, and lagging indicators, like pipeline influenced and demo requests. Assign clear ownership by function: someone.

PPC vs Organic: Which should you prioritize for B2B growth?
PPC vs organic for B2B growth: learn when to prioritize paid search, SEO, or both based on pipeline stage, CAC, speed, and search engine results as part of your digital marketing strategy.
TL;DR
- PPC buys you speed, message testing, and immediate pipeline. Organic builds compounding traffic, lowers CAC over time, and category authority, and B2B teams shouldn’t pick one but sequence both.
- Use PPC as a research lab, learn which headlines, pain points, and ICP segments convert, then feed those signals into your organic strategy so content compounds what paid discovered.
- Your growth stage determines the right mix. Early-stage companies lean PPC-heavy for fast validation, while mature category leaders invest in organic moats and use paid primarily for defense and ABM.
- Stop measuring PPC and organic in isolation. Shared pipeline metrics, multi-touch attribution, and account-level journey mapping reveal the true ROI of each channel.
- Now, teams are orchestrating both around a single goal: pipeline (not clicks).
A few years ago, I thought the I had a clear answer to this question. Paid search if you care about pipeline now… organic if you care about the future. Sounds clean, neat, consultant-approved, right?
Then I watched enough companies operate, and realized almost nobody lives in neat frameworks. Most teams are messy, under pressure, behind target, overcommitted, and trying to grow with less time than strategy decks assume. That’s where the paid vs organic debate actually happens, not in theory… but in panic.
It happens when pipeline is soft and suddenly everyone wants Google Ads to “do something.” It happens when CAC rises and the same room starts asking why SEO was ignored for a year. It happens when leadership wants immediate revenue and long-term brand authority at the exact same time, with the exact same budget. A classic corporate magic trick.
I’ve felt sympathy for every person in that room… the performance marketer being asked for cheaper leads in an expensive market. The content lead being asked why blog posts written three months ago haven’t changed revenue yet. The CMO trying to explain that some channels harvest demand while others create it. Now… nobody is fully wrong, which is why these conversations drag on forever.
The truth is, paid search vs organic search is usually the wrong fight. It treats two very different growth levers like substitutes, when they’re often complements. One helps you capture intent quickly. One helps you build durable demand and trust over time. Strong B2B teams know when to lean on each, when to blend them, and when to stop asking one channel to do the other’s job.
That’s what this guide is about: a more honest way to think about paid vs organic in 2026, built for companies operating in the real world, not on marketing LinkedIn.
PPC vs organic
If you need demand this quarter, want to test messaging fast, or have a sales team waiting for active opportunities, prioritize PPC. It gets you in front of buyers quickly, gives you data within days, and lets you control exactly where your budget goes.
If you want compounding traffic, lower customer acquisition cost over time, and genuine category authority, prioritize organic. It's slower to start, but the returns stack in a way paid never will.
Now here's the answer for most B2B companies with reallllllyyyyy long sales cycles: the right choice is not one or the other (I’m sorry, but it's true) So… what works well is sequencing… PPC buys attention… organic earns attention, and great growth teams know when to rent and when to own.
Here's a quick snapshot of how the two compare across the dimensions that matter most:
The rest of this piece will help you move beyond the table and into the strategic decisions that actually matter for B2B growth.
What do PPC and organic actually mean?
Most comparisons of PPC vs organic search start with definitions that belong in 2016. In reality, PPC refers to 'paid search results', the paid advertisements that appear on search engine results pages (SERPs), while organic refers to 'organic listings', the non-paid search results that users often trust for credibility. “PPC means you pay for each click. Organic means you rank without paying.” That’s technically true, but it misses how dramatically both channels have expanded across Google search results and other search engine results pages.
Organic doesn’t just mean blue links on Google… it now includes a much wider set of earned visibility channels. Organic search results, those non-paid listings on SERPs, are perceived as more credible and trustworthy by users. Traditional SEO rankings still matter, but AI search citations are pulling answers from your content without a click. Branded discovery happens when buyers encounter your name in peer conversations, review sites, or community threads. YouTube organic surfaces your product walkthroughs when someone searches for a category term. LinkedIn thought leadership visibility puts your executives’ POVs in front of buying committees. Even forum and community presence, think Reddit, Slack groups, and industry Discord channels, counts as organic reach now.
PPC has also expanded just as much… it’s no longer just Google search ads. Paid advertisements and paid ads now appear in various formats across Google search results and other search engine results pages. Retargeting campaigns keep your brand in front of accounts that visited your site. LinkedIn paid campaigns let you target by job title, company size, and even specific account lists. High-intent paid media captures buyers at the moment they’re researching solutions. And account-based paid programmes coordinate ad spend across channels to warm up specific target accounts before sales outreach.
The main change is that search behavior itself is fragmented now. Buyers research across Google, AI assistants, LinkedIn feeds, YouTube, peer communities, and review platforms before they ever fill out a demo form. The old framing of natural search vs paid search as “Google Ads versus SEO” doesn’t capture the full picture anymore. Both channels now span multiple platforms, formats, and buyer touchpoints, and your strategy needs to reflect that.
Breaking: the real decision isn't channel vs channel
Here's what I've noticed in most paid search vs SEO conversations: teams argue about the channels when they should be arguing about the growth problem.
The decision is a set of deeper trade-offs that change depending on your company's stage, goals, and constraints:
- Speed vs durability
PPC gets you results in days. Organic builds assets that compound over quarters. Which timeline matches your current pressure?
- Control vs trust
Paid gives you precise targeting and message control. Organic earns trust because buyers know you didn't pay for the placement. Which matters more for your buying committee right now?
- Immediate pipeline vs future pipeline
PPC fills the top of the funnel this month. Organic builds the library that feeds pipeline twelve months from now. Where's the gap in your forecast?
- Message testing vs brand authority
Paid campaigns are the fastest way to learn what messaging resonates. Organic content is how you establish yourself as the category expert. Which capability are you missing?
- Known demand capture vs new demand creation
PPC excels at capturing buyers already searching for your category. Organic excels at educating buyers who don't yet know they have the problem. Which growth lever has more upside for you?
Many CMOs ask "paid search vs SEO." But they should be asking this: "what growth problem are we solving right now?" The channel follows the answer, not the other way around. Once you frame it as a growth problem, the paid vs organic question almost answers itself.
When should PPC be your priority?
There are specific B2B scenarios where paid search earns the lion's share of your attention and budget. These aren't hypothetical; they're the situations I see demand gen teams face repeatedly.
- You've just launched a new product or feature. Organic content takes months to index, rank, and drive meaningful traffic. If you're launching something new and need visibility this week, PPC is the fastest path. You can bid on high-intent keywords immediately while your content engine ramps up in the background.
- You need pipeline in the next 30 to 90 days. Board meetings don't wait for domain authority. When the sales team needs active opportunities and the quarter is already underway, paid search gives you the speed to generate qualified leads while longer-term organic investments mature.
- You're entering a new geography or market segment. You don't have brand recognition yet. You probably don't have localized content that ranks. PPC lets you test demand in a new region before you commit to a full organic buildout.
- You need to validate ICP messaging quickly. This is one of the most underrated uses of paid campaigns. Running three or four ad variations with different headlines and value propositions gives you real conversion data within weeks. That's data you'd wait months to gather organically.
- High-intent keywords are already converting. If your paid campaigns show that certain search terms consistently drive demo requests and pipeline, it makes sense to keep investing there. Organic can eventually absorb some of that traffic, but while the conversion rates are strong, there's no reason to pull back.
- Your sales team needs warmed-up accounts right now. Retargeting warm accounts through paid keeps your brand visible during the consideration phase. When a target account has visited your pricing page twice but hasn't converted, a well-timed LinkedIn ad or display retarget can nudge them forward.
Here's an example:
If Factors.ai launches a new LinkedIn Ads analytics feature, PPC can immediately capture searches like "LinkedIn ad attribution tool" or "LinkedIn campaign ROI tracking." Organic content around those terms might take three to six months to gain traction. Running paid search in the interim means pipeline doesn't have to wait for Google to catch up.
When should organic be your priority?
Organic earns priority when the economics, buyer behavior, or competitive landscape make paid search unsustainable or insufficient on its own. These situations are common in B2B, especially in categories with complex buying journeys.
- Your CAC from paid channels is climbing. This is the most common trigger. When cost per lead rises quarter over quarter without a proportional increase in pipeline quality, it's a signal that you're hitting diminishing returns on paid. Organic offers a path to lower CAC over time, because the content you create today keeps driving traffic without incremental spend.
- Your buyers research extensively before they ever talk to sales. In most B2B categories, the buying committee reads multiple pieces of content, compares vendors on review sites, and discusses options internally before anyone fills out a form. If your buyers are research-heavy, you need a library of organic content that meets them at every stage of that journey.
- Competitive CPCs are too expensive to sustain. In crowded categories, bidding on core terms can cost £30, £50, even £80 per click. When the math doesn't work at those prices, organic becomes the only viable way to capture that search demand at a reasonable cost.
- You need a sustainable inbound engine. Paid search is a faucet. Turn it off, and the leads stop. Organic is a flywheel. Every article, comparison page, and resource you publish adds to a growing library that generates traffic and pipeline independently of your ad budget.
- You want to own category terms and shape the conversation. Authority in a category isn't built through ads. It's built through the depth and quality of your organic presence. When buyers search a problem and find your content repeatedly, you become the default reference point.
- Multiple stakeholders research independently before a demo. A typical B2B buying committee includes three to seven people. The VP of Marketing might search "account-based attribution tools." A revenue ops lead might search "attribution models for B2B." A CFO might search "marketing ROI measurement." Organic content lets you show up for all of those searches, across all of those stakeholders, without paying separately for each one.
Again, let’s take one more example:
A buyer may search for attribution models, then account intent signals, then LinkedIn campaign benchmarks, then pipeline reporting best practices. All of that happens before they ever click "book a demo." Organic wins these journeys because it can cover the full breadth of research queries across the entire buying process.
The best B2B strategy: use PPC to learn, organic to compound
This is the core thesis, and it's where most B2B teams get the sequencing wrong.
Most marketing organizations treat paid and organic as separate workstreams with separate teams, separate goals, and separate reporting. The demand gen team runs paid campaigns and optimizes for cost per lead. The content team publishes blog posts and tracks organic traffic. They rarely share data, and they almost never coordinate strategy. It's a bit like having two chefs in the same kitchen cooking entirely different meals and wondering why dinner feels disjointed.
The better approach is to treat PPC as a research lab for organic.
Paid campaigns generate signal faster than any other channel. Within weeks, you can learn which headlines get the highest click-through rates. You can see which pain points drive the most conversions. You can identify which ICP segments engage most deeply with your messaging. And you can figure out which search terms create actual pipeline, not just vanity leads that never progress past the MQL stage.
That data is gold for your organic strategy. Once you know which headlines work in ads, you can write blog titles and H1s that mirror that language. Once you know which pain points convert, you can build SEO pages and comparison content around those themes. Once you know which ICP segments engage, you can tailor your content calendar to their specific questions. And once you know which terms generate pipeline, you can prioritize those keywords in your organic roadmap.
Here's what that feedback loop looks like:
PPC gives you signals quickly. Organic turns those signals into assets that compound. When the two channels share data and strategy, the whole system becomes more efficient. Your organic content converts better because it's built on proven messaging. Your paid campaigns cost less because organic brand presence warms up buyers before they click an ad.
How does PPC vs organic change depending on growth stage?
The right mix of paid and organic search changes as your company matures. What works for a seed-stage startup would be wasteful for an enterprise category leader, and vice versa. Here's how the balance typically shifts.
- Early-stage startup
At this stage, you don't have domain authority, brand recognition, or a content library. Organic will take six to twelve months to gain real traction. That doesn't mean you ignore it, but it can't be your primary pipeline source yet.
PPC should lead. Use paid campaigns for fast demand testing and message validation. Run small-budget experiments on Google and LinkedIn to learn which ICP segments respond, which search terms drive demos, and which value propositions stick. At the same time, invest in founder-led category content on LinkedIn and your blog. This isn't about ranking on Google yet. It's about establishing a point of view and building an early organic footprint that compounds later.
A reasonable budget split at this stage might be 70/30 in favor of paid, with the organic 30 percent focused on foundational content rather than traffic.
- Mid-market scale-up
Now you've got some traction. You have customers, case studies, and a product that's maturing. This is the stage where the blend matters most, and where the "PPC as research lab" thesis pays the biggest dividends.
Use PPC for BoFu terms where buyer intent is highest: product comparisons, pricing queries, and category searches. Use organic for MoFu education: how-to guides, strategy content, and thought leadership that positions you as a credible authority. The two channels should be sharing data weekly. What paid learns about messaging should flow into the editorial calendar within the same sprint cycle.
Budget might shift to 50/50 or even 40/60 in favor of organic, depending on how quickly your content engine gains traction.
- Enterprise
Enterprise companies typically have strong brand recognition and substantial content libraries. Organic becomes the moat. It's the primary driver of inbound traffic, brand searches, and category authority.
PPC at this stage serves a different purpose. It's used for account-based marketing programmes targeting specific named accounts. It defends branded terms against competitors bidding on your name. It captures demand on competitor comparison terms. And it supports expansion plays into new segments or geographies. The budget split often looks like 30/70 or even 20/80 in favor of organic, with paid spend concentrated on highly targeted, high-value campaigns rather than broad demand generation.
- Mature category-leader
When you're the established name in your space, organic does the heavy lifting on pipeline. Your content ranks for hundreds of category terms. Buyers search your brand name directly. You've built the kind of domain authority that takes years to replicate.
Paid at this stage is about defending market share and shaping the narrative. Use it to stay visible on competitor terms, to ensure your ads show above aggressive challengers, and to support new product launches. Your organic investment should focus on thought leadership that sets the direction for the category itself, not just capturing existing demand.
How does paid search vs SEO map to funnel stages?
One of the most practical ways to allocate between paid and organic is by funnel stage. Each stage has different buyer intent, different content needs, and a different answer to the PPC vs organic search question.
The important nuance here is that most B2B journeys don't follow a neat linear funnel. A buyer might enter at the middle, loop back to the top, and then jump to the bottom after a peer recommendation. That's why having both paid and organic search coverage across stages matters. It isn't about choosing one channel per stage; it's about knowing which one leads and which one supports at each point in the journey.
Factors.ai's attribution perspective is relevant here: when you can see how accounts move across stages and touchpoints, you can make informed decisions about where PPC and organic each contribute most to pipeline creation.
Common mistakes B2B teams make with paid and organic
After watching dozens of B2B marketing teams navigate the paid vs organic search question, I’ve noticed the same mistakes come up repeatedly. Most of them aren’t about choosing the wrong channel. They’re about how teams operate and measure once the choice is made. For ongoing education and to learn from other sites' experiences, resources like Search Engine Journal are invaluable for staying updated on best practices in SEO and PPC.
- Judging SEO after 60 days. Organic search is a compounding investment. Expecting meaningful rankings and traffic within two months is like planting a tree and complaining it hasn’t produced fruit by the weekend. The realistic timeline for organic to show meaningful pipeline impact in B2B is six to twelve months, sometimes longer in competitive categories. Teams that pull the plug at 60 days never see the return, especially when competing with other sites that have built authority over time.
- Running PPC with weak landing pages. You can have the most precisely targeted ad campaign in the world, and it won’t matter if the landing page is slow, confusing, or generic. I’ve seen teams spend five figures monthly on Google Ads while sending traffic to a homepage with no clear CTA. Paid search amplifies what’s already there. If the destination is weak, you’re just paying for more bounce.
- Optimizing for CPL instead of revenue. Cost per lead is the metric that misleads more B2B teams than any other. A £15 CPL looks great in a dashboard until you realize those leads convert to pipeline at 2 percent. Meanwhile, a £90 CPL from a different campaign might convert at 25 percent and generate three times the revenue. Optimize for pipeline and revenue, not for the cheapest lead.
- Treating paid and content teams as separate silos. When demand gen and content teams don't share data, both channels underperform. The paid team misses organic insights about what topics drive engagement. The content team misses paid data about which messages convert. Weekly syncs between the two teams aren't optional; they're how you build the PPC-to-organic feedback loop that compounds results.
- Ignoring branded search lift from paid. Running paid campaigns often increases branded search volume organically. Buyers see your ad, don't click it, and later search your brand name directly. If you're not measuring this lift, you're undercounting the impact of your paid investment. The interplay between direct vs organic traffic in your analytics is worth examining closely.
- Confusing direct and organic traffic in analytics. This is a subtle but common problem. Google Analytics sometimes classifies traffic as "direct" when it can't determine the source. That means some of your organic search traffic may be hiding in the direct channel, and vice versa. Understanding the difference between organic vs direct traffic in your reporting is critical for accurate channel attribution.
- Not measuring assisted conversions. Last-click attribution gives all the credit to the final touchpoint before conversion. In B2B, that's often a branded search click or a direct visit. The organic blog post that started the buyer's journey three months earlier gets zero credit. Assisted conversion data reveals which channels initiate and nurture deals, even if they don't close them.
How should you measure PPC and organic together?
This is where most B2B measurement frameworks fall apart. Teams report on paid and organic in separate dashboards, with separate metrics, and wonder why they can't answer the question "is our marketing working?"
The solution is shared metrics that both channels are measured against. These are the ones that matter for B2B:
- Pipeline sourced
How much qualified pipeline did each channel create? Not leads. Not MQLs. Actual pipeline that sales is working.
- Pipeline influenced
Which channels touched accounts that eventually became pipeline, even if they weren't the first or last touch? This is where organic often shines and gets undercounted.
- CAC by channel
What does it cost to acquire a customer through paid versus organic, including content production costs on the organic side? This comparison only becomes meaningful after organic has had time to compound, typically six months or more.
- Opportunity rate
What percentage of leads from each channel convert to sales opportunities? A channel with a lower volume but higher opportunity rate might be more valuable than a high-volume, low-quality source.
- Revenue per visit
This metric normalizes for traffic volume and tells you which channel sends the most commercially valuable visitors. It's particularly useful when comparing paid search (high intent, low volume) versus organic (broader intent, higher volume).
- Time to pipeline
How long does it take from first touch to pipeline creation for each channel? PPC typically has a shorter time to pipeline. Organic often has a longer lead time but generates larger deal sizes.
- Assisted conversions
Which channels appear in the journey even when they're not the converting touchpoint? Organic content frequently assists conversions that paid search ultimately closes. Without assisted conversion data, you'll consistently over-credit paid and under-credit organic.
- Multi-touch attribution
Allocating credit across all touchpoints in the buyer journey, rather than just the first or last, gives you the clearest picture of how paid and organic work together.
B2B teams often under-credit organic because last-click attribution models reward the final branded paid click. A buyer might discover you through an organic blog post, return through a retargeting ad, attend a webinar, and then convert through a branded search ad. Last-click gives PPC all the credit. Multi-touch reveals that organic started the journey and paid closed it.
Sometimes paid closes the tab. But organic opened the journey months earlier. Measuring both channels together, against shared pipeline metrics, is the only way to see the full picture and make smart budget decisions.
Factors.ai POV: Optimize for pipeline
Most marketing dashboards tell you what happened at the channel level. They show you clicks, impressions, CTR, and cost per click. What they rarely show is how those channels worked together to create pipeline. That gap is where budget gets wasted and the paid search vs SEO debate stays unresolved.
Factors.ai approaches this differently. The platform connects paid and organic journeys at the account level, so you can see which accounts engaged with your organic content before converting through a paid ad. You can identify which blog posts and SEO pages influenced pipeline, not just drove traffic. You can understand whether your paid search campaigns are generating new demand or simply harvesting demand that organic already created.
The account-level visibility matters because B2B buying happens across multiple people and multiple sessions. A single-user, single-session attribution model will always misattribute in this environment. Factors.ai stitches together the full account journey, which means your paid and organic teams can finally share the same view of what's working.
Here's what that enables:
Your content team sees which organic pages appear most frequently in pipeline-generating journeys. Your demand gen team sees whether paid campaigns are incremental or cannibalising organic traffic. Your CMO sees full-funnel ROI by channel, not just top-of-funnel metrics that don't predict revenue. And your finance team gets data to support budget allocation decisions based on pipeline, not clicks.
When paid and organic are measured through a shared, account-level lens, the "which channel should we invest in" conversation becomes far more productive. You stop debating opinions and start making decisions based on pipeline data.
In a nutshell…
The PPC vs organic question doesn’t have a universal answer. Unfortunate, I know. :(
And any blog that gives you one is oversimplifying. What it does have is a clear decision framework, and that’s what this piece set out to build: a practical guide to the organic vs paid search decision for B2B digital marketing.
If budget is tight and you need pipeline this quarter, start with PPC. It gives you speed, targeting control, and fast feedback on what resonates with your buyers. If you need sustainable growth and lower CAC over time, invest in organic. The compounding returns of a strong content library will outperform any paid channel on a long enough timeline.
If you want elite B2B performance, combine both with a shared measurement framework. Use PPC as a research lab to learn which messages, pain points, and ICP segments convert. Then feed those learnings into your organic strategy so content compounds what paid discovered. Measure both channels against pipeline and revenue, not clicks and impressions. And revisit your allocation quarterly, because the right mix changes as your company grows.
Now, teams shouldn’t (have to) choose between PPC and organic. In fact, there’s merit in orchestrating both, with shared data, shared goals, and a relentless focus on pipeline over vanity metrics.
Frequently asked questions about PPC vs organic
Q1. Is PPC better than organic search?
PPC is better for speed and immediate lead generation. When you need pipeline within weeks or want to test new messaging quickly, paid search delivers faster than any organic channel. Organic is better for long-term compounding ROI and trust. Over time, a strong organic presence typically delivers a lower CAC and higher credibility with research-heavy B2B buyers. The best approach depends on your timeline, budget, and growth stage.
Q2. Should startups invest in PPC or SEO first?
Usually PPC first for fast validation. Early-stage startups need to learn quickly which ICP segments, messages, and search terms convert. Paid campaigns give you that data in weeks. At the same time, build foundational organic content in parallel: a few high-quality pillar pages, comparison content, and founder-led thought leadership. This way, your organic engine has a head start when you're ready to shift budget toward it.
Q3. What is the difference between paid vs organic marketing?
Paid marketing uses budget to buy visibility. You pay for each impression, click, or engagement, and the traffic stops when the spend stops. Organic marketing earns visibility through content, SEO, brand presence, and community engagement. It requires upfront investment in creation and optimization, but the returns compound over time without ongoing ad spend. In B2B, most high-performing teams use both in combination, with the mix depending on stage and goals.
Q4. Is SEO cheaper than PPC?
Over time, often yes. Once organic content ranks and drives consistent traffic, the cost per visit and cost per lead tend to decrease steadily. You're not paying for each click. However, SEO requires significant upfront investment in content creation, technical optimization, and patience. It can take six to twelve months before organic delivers meaningful pipeline. PPC costs more per lead on an ongoing basis, but it delivers results immediately. The total cost comparison only makes sense over a twelve-to-twenty-four-month window.
Q5. Can PPC help SEO?
Yes, and this is one of the most underused synergies in B2B marketing. PPC data reveals which keywords drive actual conversions, not just traffic. It shows you which headlines get clicks and which pain points resonate with your target audience. Feeding those insights into your organic content strategy means your blog posts, landing pages, and comparison content are built on proven messaging rather than guesswork. PPC can also boost brand awareness, which increases branded organic searches over time.
Q6. How should B2B companies split their budget between PPC and organic?
It depends on your stage and goals. Many growth-stage firms start with a 60/40 split in favor of paid, because they need fast pipeline and market validation. As the organic engine matures and starts compounding, the split gradually shifts toward 50/50 or even 40/60 in favor of organic. Enterprise companies often run 20/80 or 30/70 organic-heavy, with paid focused on ABM, branded defense, and competitor terms. Revisit the split quarterly based on pipeline data, not gut feel.

Organic search vs direct: what B2B marketers need to know
Learn organic search vs direct traffic, what each channel means in GA4, and how B2B marketers should use both to drive pipeline and revenue.
TL;DR
- Organic search traffic comes from unpaid search engine results and usually captures discovery intent, while direct traffic arrives without a known referring source and often reflects brand demand or attribution gaps.
- In GA4, direct traffic is a catch-all bucket that absorbs sessions from untagged campaigns, dark social, mobile apps, and broken referrers, so a spike in direct doesn't always mean your brand is growing.
- For B2B teams, organic tends to create net-new pipeline, while direct tends to convert pipeline that's already warming up. Both matter, and they compound over time.
- Last-click reporting consistently misleads B2B marketers by crediting the final direct visit while ignoring the organic, paid, and social touches that built the buying intent.
- The smartest measurement approach connects GA4, CRM, and ad platform data through multi-touch attribution so you can see revenue paths, not just session counts.
It’s Monday morning… the air is crisp and the sun is shining… and everyone’s pretending to be awake, and the pipeline review has the emotional energy of a season finale nobody asked for. Someone shares the dashboard and proudly says direct traffic is up 30% this quarter. Heads nod around the Zoom grid like background actors in Succession. Brand is working; we are winning. cue optimism… wohoo! 🎉
Then another tab opens… (did we celebrate too soon?) Organic search is down a little… now the room shifts into full The Bear kitchen mode. Should we invest more in SEO? Is brand carrying us? Did Google betray us? Is someone about to say “we need more thought leadership” with a straight face?
I’ve seen this scene so many times that it deserves to go in the book of world records for ‘A scene every marketer has been part of at least 25 times’. And almost every time, the debate starts in the wrong place… organic search vs direct traffic, and this is not some Marvel-style battle where one emerges victorious. It’s usually a messy buddy-cop story where both channels are involved, neither gets full credit, and the reporting definitely lies at least once.
Here’s what actually happens in B2B buying journeys… someone hears about you on a podcast, sees your founder on LinkedIn, gets sent your site by a colleague, Googles you three days later, clicks a retargeting ad next week, then visits your homepage by typing the URL directly like it’s 2009. Analytics platforms take one look at that chaos and confidently label it “Direct.” Hmm… bold choice.
Most articles on this topic stop at definitions: organic is unpaid search traffic, direct is people typing your URL or using bookmarks… fine… technically true, but also wildly incomplete. If you’re a B2B marketer trying to connect traffic sources to pipeline, the value is in middle parts: attribution gaps, hidden influence, dark traffic, branded search spillover, and how these channels quietly boost each other behind the scenes.
That’s where the interesting conversation starts.
Organic search vs direct: the quick answer
Let's start with the cleanest possible definitions before we unpack everything else.
Organic search traffic refers to visitors who arrive at your site after clicking an unpaid result on a search engine like Google, Bing, or DuckDuckGo. Direct traffic refers to visitors who arrive without a known referring source, which includes typed URLs, bookmarks, untagged links shared through apps, dark social, documents, and a surprisingly long list of tracking gaps.
For B2B marketers, the practical difference comes down to intent signals. Organic search typically captures discovery intent, meaning someone is actively researching a problem or evaluating solutions. Direct traffic often reflects existing brand demand, or it signals that your attribution setup has gaps you haven't noticed yet.
Here's the insight worth remembering: if organic introduces you, direct often returns to buy. Those two channels aren't competing. They're sequential chapters in the same buying story, and treating them as isolated metrics misses how B2B purchasing actually works.
After this section, I hope you’re not saying this ⬇️ when anyone asks the difference between organic search vs direct:

What is organic search traffic?
Organic search traffic is every visit that originates from an unpaid search engine result. When someone types a query into Google, scrolls past the ads, and clicks on your blog post or product page, that session gets classified as organic search in your analytics platform. The same applies to clicks from Bing, DuckDuckGo, Yahoo, and other search engines, though Google dominates the volume for most B2B sites.
What makes organic traffic strategically interesting is the intent behind it. These visitors are actively searching for something, a problem they're trying to solve, a category they're exploring, a comparison they're trying to make, or a specific solution they've heard about. That search behavior tells you something meaningful about where they sit in the buying journey.
Think about the kinds of queries that drive organic visits to a typical B2B SaaS site. Someone searching "best ABM software" is comparing vendors. Someone searching "how to improve LinkedIn ads ROI" is troubleshooting a specific channel. Someone searching "product qualified lead meaning" is still learning the vocabulary of a new strategy. Each of those queries represents a different stage of awareness, and each one lands on your site because your content matched their intent at that moment.
This is why organic search traffic tends to be the primary discovery channel for B2B brands. It's where many buyers first encounter demand gen tools, attribution platforms, or the playbooks that shape how they think about their own marketing. You're not interrupting them with an ad. They came looking for what you have, which creates a fundamentally different relationship from the very first click.
The connection between organic traffic and SEO is straightforward but worth stating clearly. Your organic search performance is a direct reflection of your content strategy, your domain authority, your technical SEO health, and how well your pages match what real buyers are actually searching for. It's the long game, but when it compounds, it compounds hard.
What is direct traffic?
Direct traffic sounds simple on the surface: someone typed your URL into their browser and hit enter. That's the textbook explanation, and it covers a real chunk of direct visits. People who know your brand, have visited before, or bookmarked your pricing page will show up as direct traffic because there's no referrer for analytics to attribute.
But the full picture is significantly… messier. Direct traffic in practice is a catch-all category that absorbs every session where the analytics platform can't identify a referring source. The list of scenarios that end up in the direct bucket is longer than most marketers realize.
Here's what actually gets classified as direct traffic:
- Typed URL visits from people who genuinely know your address and navigate there intentionally.
- Bookmarked pages that someone saved during an earlier visit and returned to later.
- Returning users who come back through browser auto-complete or history.
- Links shared through Slack, Teams, WhatsApp, or other messaging platforms where the referrer header gets stripped.
- Untagged email links from campaigns that weren't properly UTM-tagged, which is more common than anyone wants to admit.
- PDF and document links that someone clicks inside a downloaded asset, a proposal, or an internal brief.
- Mobile app traffic where the app strips referrer data before opening the browser.
- Some privacy-browser traffic from users who actively block tracking or use browsers that limit referral information.
The important nuance here, and the part most blogs skip entirely, is that direct traffic doesn't always mean brand loyalists manually typing your URL with conviction. Sometimes it means your tracking broke. An untagged email campaign, a redirect chain that drops referrer data, a partner link without UTM parameters: all of these look exactly like a loyal customer typing your URL from memory. The analytics platform can't tell the difference, and neither can you unless you dig deeper.
This is where the "say something new" part of the direct traffic conversation actually matters. Every marketer should treat rising direct traffic with healthy curiosity rather than automatic celebration. It could mean your brand is getting stronger. It could also mean your attribution hygiene needs serious attention.
Organic search vs direct: core differences
The differences between organic traffic and direct traffic go beyond the source of the click. They signal different things about buyer behavior, measurement reliability, and strategic value. A comparison table makes these distinctions easier to digest at a glance.
The strategic difference is worth framing clearly. For SaaS companies, organic search creates pipeline tomorrow by pulling in buyers who are actively looking for solutions right now. Direct traffic often captures pipeline that's already warming up, people who've encountered your brand somewhere else and are coming back to take the next step. Both are essential, but they play different roles in how revenue actually gets built.
When you compare direct traffic vs organic traffic purely on volume, you miss the relationship between them. Many of the sessions that show up as direct started their journey through an earlier organic visit, a paid ad, a LinkedIn post, or a webinar. The final visit gets the direct label, but the intent was built somewhere else entirely.
Why is direct traffic often misunderstood in GA4?
This is the section where most content about organic search vs direct stays frustratingly shallow, so let's go deeper than the standard explanations.
GA4 categorizes a session as direct when it has no source or medium data attached to it. That's the rule. And the practical consequence is that GA4 direct traffic becomes a dumping ground for every session where referral information went missing for any reason. It's not a clean channel. It's the "we don't know" channel wearing a confident label.
The list of situations that cause this is worth walking through carefully, because each one represents a different kind of measurement gap.
- Missing UTM tags are the most common culprit. Every email, every partner link, every social share, and every campaign URL that doesn't include UTM parameters gets absorbed into direct. Marketing teams that are disciplined about tagging see smaller direct buckets. Teams that aren't see inflated direct numbers that mask the true source of their traffic.
- HTTPS to HTTP transitions can strip referral headers. If a user clicks a link on an HTTPS site that leads to an HTTP page on your site, the browser may not pass the referrer. This is less common now that most sites run on HTTPS, but it still happens with older integrations and third-party tools.
- Mobile apps frequently strip referrer data before opening links in the in-app browser. A prospect clicking your link inside the LinkedIn mobile app, the Gmail app, or a Slack notification can easily land in your direct traffic bucket even though they came from a very identifiable source.
- Dark social is the term for content shared through private channels like messaging apps, DMs, and closed communities. When someone pastes your blog link into a WhatsApp group or a Slack channel, there's no referrer attached. That visit looks like direct traffic even though it was driven by word-of-mouth sharing.
- Email campaigns without tagging are surprisingly widespread. If your marketing emails use clean URLs without UTM parameters, every click from those campaigns shows up as direct. I've seen teams celebrate growing direct traffic only to discover it was actually their email newsletter driving the increase all along.
- PDF and downloadable assets that contain links to your site create the same problem. A prospect opens your whitepaper, clicks the embedded link to your product page, and that session has no referrer attached.
- Redirect errors and chains can drop referral data along the way, especially when multiple redirects are involved or when the redirect passes through an intermediate domain.
- Cookie and privacy restrictions are an increasingly important factor. Browsers like Safari and Firefox limit tracking by default, and users who actively manage their privacy settings can generate sessions that lose their source data in transit.
The real insight here isn't about any single cause. It's about what happens when you add them all together. Rising direct traffic can absolutely mean your brand is getting stronger and more people genuinely remember your URL. But it can also mean your attribution is eroding, your tagging discipline has slipped, or your traffic is shifting to channels and platforms that strip referral data by default.
Pleaseee, never celebrate direct traffic blindly. The right response to growing direct numbers is curiosity: dig into what's actually driving the increase before you tell your leadership team that brand awareness is on fire. That kind of critical thinking separates good reporting from misleading dashboards.
Which traffic source converts better in B2B?
This is one of those questions where the honest answer starts with "it depends," but I can make that answer genuinely useful instead of just frustratingly vague.
Organic search traffic tends to convert better when the buying journey involves active research. High-intent category searches, like "revenue attribution software for B2B" or "best alternatives to [competitor]," carry strong buying signals. Buyers clicking on these results are already in evaluation mode, comparing options and looking for the right fit. When your BoFu pages, comparison guides, and solution pages rank well for these terms, organic becomes a direct pipeline driver.
The conversion advantage shifts to direct traffic later in the journey. So, when a prospect already has awareness, has attended a demo or webinar, has been exposed to your campaigns, or has been educated by a colleague who shared your content internally, they tend to return directly. They know your URL, they've bookmarked your pricing page, or they simply type your brand name into the address bar. That direct visit often has the highest conversion rate in the entire funnel because all the persuasion happened earlier.
Here's the B2B truth that makes this comparison tricky: the final visit before a demo booking or signup is frequently direct, but the journey that built the intent often started through organic search, paid ads, social posts, or events. A prospect might discover you through a Google search, read three blog posts over a few weeks, see a LinkedIn ad, have a colleague share your link internally, and then return directly to book a demo. In that scenario, last-click reporting credits direct traffic with 100% of the conversion while organic search, which started the entire relationship, gets zero credit.
This is precisely why last-click attribution lies to B2B marketers. It consistently overstates the value of direct traffic and understates the value of top-of-funnel channels like organic search. If you're making budget decisions based on last-click data, you're almost certainly underinvesting in the channels that create demand and overinvesting in the ones that happen to be last in line.
The more useful framing isn't "which converts better" but "which creates and which captures." Organic search creates net-new pipeline by reaching buyers who didn't know about you yet. Direct traffic captures pipeline that's already been warmed up by your broader marketing efforts. Cutting either one damages the system, even if the damage doesn't show up immediately in the numbers.
How organic and direct work together in real buying journeys
The cleanest way to understand the relationship between organic search and direct traffic is to trace a realistic B2B buying journey from start to finish. Not a simplified textbook example, but the kind of messy, multi-touch, multi-week path that actual B2B buyers follow.
Let's say a marketing operations manager at a mid-market SaaS company is frustrated that their team can't connect marketing spend to pipeline. They open Google and search "best revenue attribution tools for B2B." Your blog post ranks on page one, and they click through. That first visit is organic search traffic.
They read the article, find it genuinely helpful, and move on with their day. Two days later, they come back to your site from a LinkedIn ad that caught their eye while scrolling during lunch. That's paid social. They browse your product page for a few minutes, then leave again.
A week later, they mention your tool during a team meeting. A colleague pulls up your site directly to look at the pricing page during the call. That visit shows up as direct traffic, because the colleague typed the URL into their browser. Later that afternoon, the original buyer receives your comparison guide in an email from a colleague who forwarded it through Slack. They click the link, and because it wasn't UTM-tagged, that visit also shows up as direct.
The following week, the marketing ops manager decides to book a demo. They open a new tab, type your brand name into the address bar, navigate to the demo page, and submit the form. Direct traffic, again.
Now look at what the analytics tell you versus what actually happened.
The first touch was organic. The last touch was direct. The real influence was both, plus several other interactions that your analytics may not have captured at all. And this is a relatively simple example. Enterprise deals with six-month sales cycles and buying committees of eight people generate exponentially more complex journeys.
This is exactly why B2B marketers need to stop thinking about organic search vs direct as a competition. These channels are sequential stages in the same buying process. Organic builds the initial awareness and trust. Direct reflects the accumulated intent that was created by everything that came before it. When you cut organic investment because direct traffic "converts better," you're sawing off the branch you're sitting on.
Attribution debates sometimes resemble group projects where everyone claims credit for the final result. The presentation looks great, but the research, the late-night revisions, and the original idea all happened long before the final slide was built. Direct traffic is the person who presents. Organic search is the person who actually wrote the deck.
How to improve organic search traffic
Improving organic search traffic in a B2B context requires a different mindset than what works for e-commerce or media sites. You're not chasing volume for its own sake. You're trying to attract the specific people who will eventually enter your pipeline, which means every decision about content and SEO needs to start with the buyer, not the keyword tool.
Here's what actually moves the needle:
- Build content around buyer problems
The highest-value organic traffic comes from queries that signal real purchase intent or active problem-solving. A blog post about "how to measure marketing ROI for B2B" attracts people who will eventually need an attribution tool. A blog post about "what is marketing" attracts students writing essays. Start with the problems your buyers have and work backwards to the keywords.
- Own category, competitor, and comparison terms
These are the highest-intent searches in B2B, and too many teams ignore them because they feel uncomfortable writing about competitors or creating "best X software" roundups. Buyers are searching for these terms whether you create content for them or not. You'd rather they find your perspective than someone else's.
- Improve technical SEO continuously
Page speed, crawlability, internal linking, mobile experience, and Core Web Vitals all affect how well your content can rank. Technical SEO isn't glamorous, but neglecting it puts a ceiling on everything else you're doing.
- Refresh old posts quarterly
Blog content decays faster than most teams realize. A post that ranked well eighteen months ago might be losing position because the information is outdated, a competitor published something better, or the search intent shifted. Refreshing existing content is often more efficient than creating something new from scratch.
- Build topic clusters around core themes
Search engines reward topical depth. A single blog post about attribution won't establish authority, but a cluster of fifteen interlinked posts covering every angle of the topic signals genuine expertise. Plan your content architecture around the themes that matter most to your buyers.
- Add FAQs for AI and LLM citation visibility
As more buyers start their research through AI tools and featured snippets, FAQ sections give your content a structural advantage. Clear, direct answers to common questions increase your chances of being cited by AI-generated summaries and Google's own answer boxes.
- Use schema markup where it applies
FAQ schema, how-to schema, and article schema help search engines understand the structure of your content. It's a small technical investment with outsized visibility benefits
- Optimize conversion paths on every page
Organic traffic that reads your content and leaves without any next step is a wasted opportunity. Every high-traffic page should have a clear, relevant call to action that matches the reader's intent at that stage. A comparison guide should lead to a demo request. A top-of-funnel explainer should offer a deeper resource.
One note that's easy to forget in the rush to grow traffic numbers: organic traffic alone means very little if it never reaches pipeline. A blog post that attracts ten thousand visits from people who will never buy your product is vanity. A blog post that attracts three hundred visits from your ideal customer profile and converts five of them into demo requests is strategy. Keep the revenue lens on everything you build.
How to improve direct traffic
This is where most guides run out of useful things to say, because "get people to type your URL" isn't exactly actionable advice. But there are real strategies that influence direct traffic growth, and they're worth thinking about carefully because direct visits often carry the strongest conversion signals in B2B.
- Invest in strong brand positioning
People can't type your URL if they don't remember your name. Brand positioning work, the kind that makes your company memorable and distinct in your category, is the upstream driver of genuine direct traffic. When someone thinks "I need a revenue attribution tool," you want your brand to be the first name that surfaces in their mind.
- Run memorable campaigns that stick
Campaigns that create a strong impression, whether through a distinctive visual identity, a bold point of view, or an unusually useful resource, generate the kind of recall that turns into direct visits later. The forgettable ad that blends into the LinkedIn feed doesn't drive anyone to type your URL next week.
- Maintain a consistent LinkedIn presence
For B2B companies, LinkedIn is often where brand impressions accumulate. Regular posts from your team, thoughtful commentary on industry topics, and content that demonstrates expertise all contribute to the mental availability that eventually becomes direct traffic. People see your name enough times and they start to remember it.
- Tag every email link with UTM parameters
This sounds like a "how to reduce direct traffic" tip, and it partly is, but it also helps you understand your real direct traffic more accurately. When every email click is properly tagged, the direct traffic that remains is more likely to represent genuine brand-driven visits. Better tagging gives you a cleaner signal.
- Create valuable touchpoints outside your website
Podcasts, webinars, community participation, event sponsorships, and speaking engagements all create awareness that eventually converts into direct visits. Someone who heard your founder on a podcast might not click a link in the show notes. They might just type your URL three days later when they're ready to explore.
- Focus on customer retention and experience
Happy customers come back directly, and they tell their colleagues about you. Direct traffic from existing customers and their referral networks is some of the most valuable traffic a B2B company can have. It represents genuine brand loyalty, not attribution confusion.
- Build branded searches that later become direct visits
Paid campaigns, PR coverage, and social content that prominently feature your brand name generate branded search queries first. Over time, those branded searches evolve into direct visits as people skip the search step entirely and go straight to your site. It's a natural progression that reflects growing brand familiarity.
- Use vanity URLs for offline campaigns
If you're running event sponsorships, conference booths, or printed materials, a memorable vanity URL gives people something easy to type later. "yourcompany.com/summit" is significantly easier to remember than a generic landing page URL buried in small print.
The most important thing to understand about direct traffic growth is that some of it is actually the lagging indicator of successful marketing elsewhere. A great organic search strategy today creates direct traffic next quarter, as people who discovered you through search come back without needing Google's help the second time. A successful LinkedIn campaign creates direct traffic next month, as people who saw your posts navigate to your site directly when they're ready to learn more. The channels don't exist in isolation, and direct growth often tells you that your other investments are compounding.
How Factors.ai helps measure both channels better
The gap between what GA4 reports and what actually happened in a B2B buying journey is wide enough to drive a strategy through. Understanding organic search vs direct at the session level is useful, but it doesn't tell you what you actually need to know: which channels contribute to pipeline and revenue, and where you should invest next?
This is where a tool like Factors.ai becomes genuinely valuable for B2B teams. Instead of another layer of surface-level reporting, it connects the data sources that typically live in separate silos and surfaces the account-level journey that GA4 can't show you on its own.
Here's what that looks like in practice:
- Connect GA4, CRM data, and ad platforms into a unified view. Instead of checking three dashboards and trying to reconcile conflicting numbers, you get a single picture of how accounts move from first visit to closed deal.
- See which accounts were influenced by organic search before returning as direct traffic. This is the connection that matters most for understanding how these two channels interact. When you can see that an account visited three organic blog posts before the direct demo-booking visit, you stop undervaluing your content investment.
- Measure pipeline contribution, not just sessions. Sessions are an activity metric. Pipeline is a revenue metric. Factors.ai ties web traffic data to CRM opportunities so you can report on what actually matters in pipeline reviews.
- Track anonymous company-level visits. Most B2B website visitors don't fill out a form, but that doesn't mean the visit was worthless. Account identification reveals which companies are engaging with your content, even when individual visitors remain anonymous.
- Compare first-touch, last-touch, and multi-touch attribution models. Different models tell different stories. Being able to toggle between them helps you understand which channels create demand versus which ones capture it.
- Distinguish when direct traffic represents real brand demand versus hidden sources. By connecting more data points and enriching session-level data with account context, you can start to separate the genuine brand visits from the attribution-gap visits that inflate your direct numbers.
So, basically, traffic channels matter less than revenue paths. Knowing that organic search sent you five thousand visits last month is interesting. Knowing that organic search influenced twelve accounts that generated $340K in pipeline is useful. That's the shift that better measurement enables, and it changes how you think about both organic and direct investment.
Common mistakes marketers make with organic search and direct traffic
After years of watching B2B teams navigate traffic reporting, I've noticed the same mistakes come up repeatedly. Most of them stem from trusting the channel labels in analytics too literally, without questioning what's actually behind the numbers.
- Treating all direct traffic as pure brand traffic
This is the most widespread mistake, and it leads to overconfidence about brand strength. When your direct traffic includes untagged email clicks, dark social shares, and mobile app traffic with stripped referrers, you're conflating attribution gaps with brand loyalty. The two require completely different responses.
- Ignoring untagged campaigns
Every campaign URL that goes out without UTM parameters is a measurement leak. Those clicks don't disappear. They get absorbed into direct traffic and distort your understanding of what's actually driving visits. A strict tagging protocol is boring, unglamorous work, but it has an outsized impact on reporting accuracy.
- Measuring only last-click conversions
Last-click attribution is the default in most analytics setups, and it consistently lies about B2B buying journeys. It gives full credit to the final touchpoint, usually direct, and ignores everything that built the intent before that moment. Decisions based on last-click data alone will systematically defund your top-of-funnel channels.
- Chasing traffic volume over buying intent
A blog post that ranks for a high-volume keyword and attracts thousands of visitors who will never become customers is a vanity win. It looks great in the traffic report and does nothing for pipeline. Volume without intent qualification is the content marketing equivalent of filling a stadium with people who don't watch your sport.
- Not separating branded from non-branded organic search
When you lump all organic traffic together, you lose the distinction between people who searched for your brand name (which is closer to direct intent) and people who searched for a category or problem term (which is genuine discovery). Brand traffic vs search traffic behaves very differently, and collapsing them into one number hides the real story.
- Reporting sessions instead of pipeline
This might be the most consequential mistake on the list. When your traffic reporting stops at sessions and page views, you can never connect marketing activity to revenue outcomes. B2B marketing leaders who report on pipeline influenced by channel, not just sessions by channel, earn a fundamentally different level of trust and budget from their leadership teams.
Final verdict: Which one matters more?
If you've read this far, you already know the answer isn't going to be a clean, single-channel winner. The organic search vs direct question is the wrong framing for B2B marketers who care about pipeline and revenue.
If you need new demand, organic search matters more. It's where buyers who don't know you yet discover your content, learn your perspective, and start to consider your solution. Cutting organic investment to chase short-term efficiency is a reliable way to hollow out your pipeline six months from now
If you need to convert existing demand, direct traffic matters more. It represents the accumulated intent that your broader marketing efforts have built, and it often carries the strongest conversion signals in your analytics. People who navigate directly to your pricing page or demo form are usually close to making a decision.
If you want the truth about revenue, you need both channels measured together, in context, with multi-touch attribution that accounts for the full journey rather than the last click. The team that can see how organic search creates the initial relationship and direct traffic closes it has a structural advantage over the team that's still arguing about which channel "gets credit."
For modern B2B teams, the smartest question isn't "organic search vs direct?" It's "how do these channels compound over time, and where are we underinvesting in the system?" That question leads to better budget decisions, better content strategy, and ultimately better pipeline outcomes.
Because at the end of the day, your CFO doesn't care which traffic source label appears in GA4. They care whether your marketing spend converts into revenue. Connecting organic and direct into a unified picture of the buying journey is how you answer that question honestly, with data instead of dashboard screenshots.
In a nutshell…
Here's what this article covered and what you should take away from it.
Organic search traffic and direct traffic measure different things, serve different purposes, and play different roles in B2B buying journeys. Organic search captures active research intent and is your primary channel for reaching net-new buyers. Direct traffic reflects returning interest and existing brand awareness, but it also absorbs a significant volume of unattributed sessions from broken tracking, untagged campaigns, and dark social.
GA4's direct traffic category is a catch-all bucket, not a clean signal. Before you celebrate a spike in direct, audit your UTM tagging, check your redirect chains, and consider how much of that traffic actually came from identifiable sources that lost their referral data in transit. Clean attribution hygiene makes your direct numbers more trustworthy and your organic numbers more complete.
Last-click attribution consistently overvalues direct traffic and undervalues organic search in B2B contexts. Multi-touch attribution tied to CRM pipeline and opportunity stages is the only way to understand how these channels actually contribute to revenue. Tools like Factors.ai help bridge the gap between session-level analytics and account-level buying journeys.
Your action items are straightforward: invest in organic content that targets real buyer problems, maintain disciplined UTM tagging across every campaign, stop reporting sessions without pipeline context, and build a measurement stack that shows you how organic discovery compounds into direct conversions over time. That's how you turn a binary "organic vs direct" debate into a revenue strategy.
Frequently asked questions about organic search vs direct
Q1. Is organic search better than direct traffic?
Neither channel is universally better. Organic search is stronger for discovery, reaching buyers who are actively researching problems and evaluating solutions for the first time. Direct traffic is stronger for capturing returning demand and branded intent from people who already know your company. In B2B, the two channels typically work together across long buying cycles rather than competing against each other.
Q2. Why is my direct traffic so high in GA4?
High GA4 direct traffic is frequently caused by factors beyond genuine brand recall. Missing UTM tags on email and campaign links, dark social sharing through Slack or WhatsApp, mobile apps that strip referrer data, privacy-browser restrictions, and redirect errors all funnel sessions into the direct bucket. Auditing your tagging practices and redirect chains is the best first step toward understanding what's actually in your direct traffic.
Q3. Does direct traffic mean people typed my URL?
Sometimes, yes. Typed URLs, bookmarks, and browser auto-complete are all legitimate sources of direct traffic. But "direct" in GA4 also includes any session where the referring source couldn't be identified, which covers a wide range of tracking gaps. You can't assume that all direct traffic represents intentional brand-driven visits without investigating further.
Q4. Which channel converts better for SaaS companies?
Direct traffic often shows higher conversion rates at the late stage because it represents buyers who've already been educated and are returning with intent. Organic search often creates more net-new pipeline by reaching buyers earlier in their journey. The most accurate picture comes from multi-touch attribution that shows how organic visits contribute to the same conversions that direct traffic ultimately closes.
Q5. Can organic traffic lead to direct traffic later?
Absolutely. This is one of the most common patterns in B2B buying journeys. A buyer discovers your brand through an organic search result, reads your content over several visits, and eventually returns directly when they're ready to evaluate your product more seriously. The organic visit builds awareness and trust. The direct visit reflects the accumulated intent. Measuring both together reveals the true value of your organic investment.
Q6. How should B2B teams measure organic search and direct traffic properly?
The most effective approach is multi-touch attribution tied to CRM opportunities and pipeline stages. Connect your GA4 data with your CRM and ad platforms so you can see the complete account-level journey from first organic visit through direct conversion. Report on pipeline influenced by channel, not just sessions by channel. That's how you connect traffic data to the revenue outcomes that actually matter for budget decisions.

What are organic keywords? A smarter B2B growth guide
Learn what organic keywords are, how they drive B2B growth, and how startups to enterprises should use them for pipeline, not just traffic.
TL;DR
- Organic keywords are the search terms that bring visitors to your website without paying for ads, and they influence visibility across Google, AI overviews, and answer engines alike.
- The most valuable organic keywords for B2B aren't the highest-volume ones. They're the ones that match buyer intent, ICP fit, and revenue potential.
- Different business stages (startup, growth, enterprise) need fundamentally different keyword strategies, from pain-point searches to category-defining content moats.
- Finding organic keywords requires more than SEO tools. Sales calls, paid search reports, and AI prompt mining reveal what your buyers actually ask.
- Tracking which organic keywords produce pipeline and revenue, not just traffic, is what separates content marketing from content publishing.
Two B2B companies can publish the same number of blogs, target the same search volume, and use the same SEO tools, yet end the quarter in completely different places. One gets vanity traffic, a few random demo requests, and a dashboard full of optimism. The other gets buying committees landing on comparison pages, high-intent prospects reading use-case content, and sales asking where these leads came from.
The difference between the two is usually keyword judgment.
That’s why conversations about organic keywords deserve a better starting point than textbook definitions. In B2B, keywords are not just phrases typed into Google. They are tiny signals of timing, urgency, budget, confusion, curiosity, and purchase intent. Someone searching “what is account based marketing” is in a very different moment from someone searching “best ABM platform for SaaS” or “Factors.ai vs Demandbase.”
If you treat all search traffic the same, organic growth can look impressive while revenue stays suspiciously unchanged.
So yes, we’ll cover what organic keywords are. But more importantly, we’ll cover how smart teams evaluate them through a commercial lens: which terms build awareness, which terms create pipeline, which terms support sales cycles, and which ones simply make your monthly report look prettier than reality. Whether you’re leading SEO at a startup or steering demand gen at an enterprise brand, that distinction matters more than ever.
My goal is for you to think this… (after reading this blog):

What are organic keywords? (The straight answer)
Organic keywords are the search terms people type into search engines that bring traffic to your website naturally, without you paying for a click. If your page ranks for "ABM software pricing" or "best LinkedIn attribution tool," those are organic keywords. So, an organic keyword’s meaning is that simple at its core.
It helps to break the concept into three parts.
- The keyword is the actual search query a person types.
- Organic means you're not paying for that specific placement, unlike a Google Ads result.
- And the ranking page is the content on your site that earned visibility through relevance, quality, and authority.
When all three come together, you've got organic traffic keywords flowing into your site from people actively looking for what you offer.
What's changed, though, is the landscape where these keywords operate. Now, organic keywords aren't just Google inputs anymore, they influence how your brand appears in Google AI Overviews, Bing's generative answers, ChatGPT-powered research, Perplexity, and a growing list of AI copilots that buyers use during their research. If your content answers a question well enough to rank on Google, there's a reasonable chance it becomes training data or a citation candidate for these AI answer engines too.
Think of organic keywords as demand signals written by buyers in their own words. Every time someone searches "how to prove marketing ROI to my CFO," they're telling you exactly what problem they're trying to solve, in language they chose. That's a gift, if you know how to use it.
Why do organic keywords matter a little more now?
The traditional view of organic keywords was transactional in a very literal sense. You found keywords with high search volume, you wrote pages targeting them, and you measured success by how much traffic showed up. That model still works in pieces, but it misses the real value underneath.
The modern view treats organic search keywords as intent data. Every query reveals something about the person behind it: what stage of the buying process they're in, what problem feels urgent, what objections they're carrying, and even what language their organization uses internally. A search for "best CRM for 50-person SaaS company" tells you the buyer's company size, their category interest, and the fact that they're actively evaluating. A search for "6sense alternatives pricing" tells you someone is mid-evaluation, probably frustrated with their current tool's cost structure. That level of insight, delivered for free, is hard to replicate through any other channel.
Several forces have made this even more important heading into the new ‘AI era’ (as we call it):
- Search is fragmenting across Google, Bing, AI tools, Reddit, and niche communities, which means your organic content needs to work harder across more surfaces.
- Paid media CPCs keep climbing, particularly in competitive B2B categories like intent data, attribution, and ABM.
- Buyers are self-educating for longer before they ever fill out a demo form, which means your organic content is often their first meaningful interaction with your brand.
- And here's the part that gets overlooked: SEO content now serves double duty as potential source material for LLMs and AI summaries.
The strongest keyword strategy now is about owning the most commercially meaningful questions your buyers ask. A page that ranks for "LinkedIn ads attribution model" and brings in 40 visits a month from marketing directors is worth more than a glossary page pulling 4,000 visits from students. Most B2B SEO keywords only matter if the people searching them could eventually become customers.
Organic keywords vs paid keywords
One of the most common questions that surfaces early in any SEO conversation is how organic keywords differ from paid keywords. The distinction sounds straightforward, but the strategic implications run deeper than most people realize when they're comparing SEO keywords vs paid keywords.
| Dimension | Organic keywords | Paid keywords |
|---|---|---|
| Cost model | No per-click cost. Investment goes into content, SEO, and authority building. | You pay for every click. Costs scale linearly with traffic. |
| Time to results | Slower. Typically weeks to months before a page ranks well. | Faster. Ads can appear within hours of launch. |
| Longevity | Compounds over time. A well-ranking page can generate traffic for years. | Stops the moment you stop paying. |
| Trust signal | Organic results are generally perceived as more credible by searchers. | Sponsored labels can reduce trust, particularly for savvy B2B buyers. |
| Control | Less direct control over rankings. Algorithm changes can shift visibility. | High control over placement, targeting, and messaging. |
| Data feedback | Search Console impressions and clicks reveal buyer language over time. | Search terms reports give fast, granular intent data. |
| Scalability | Scales with content investment, not budget increases. | Scales with budget, but subject to rising CPCs. |
Google draws a clear line between sponsored results and organic results on the search page. Buyers notice that line too, even if they don't always articulate it. There's a reason why many B2B decision-makers scroll past the ads to the organic listings. They trust that an organic result earned its spot through relevance rather than budget.
The most useful way to think about it: paid search rents attention, and organic search builds ownership of it. Both have a role, and the smartest B2B teams use paid data to inform organic strategy and vice versa. But if you're building long-term pipeline at a sustainable cost, organic keywords are where compounding returns live.
Types of organic keywords that actually drive revenue
Teams pour their sweat and tears into ranking for broad informational terms, celebrate the traffic, and then wonder why none of it converts. The issue isn't the effort. It's the keyword mix.
Here are the types of organic keywords that actually move the revenue needle, with organic keywords examples for each.
- Informational keywords
These are the "what is" and "how does" searches. Think "what is intent data" or "how does account-based marketing work." They're excellent for top-of-funnel awareness and building topical authority, but they rarely convert directly. Their job is to introduce your brand to someone early in their research, so you're already familiar when they move deeper into evaluation.
- Commercial investigation keywords
This is where intent starts to heat up. Searches like "best ABM platforms," "Factors.ai alternatives," or "LinkedIn ads tools comparison" signal that someone is actively evaluating options. They know they have a problem, they've identified the solution category, and now they're comparing. These keywords are the workhorses of mid-funnel organic strategy, and they tend to drive the most pipeline-relevant traffic for B2B brands.
- Transactional keywords
Bottom-of-funnel queries where someone is ready to act. "Request demo ABM software" or "pricing analytics platform" are classic examples. Search volume is usually low, but conversion rates are disproportionately high. If you aren't ranking for transactional keywords related to your product, you're leaving pipeline on the table for competitors who are.
- Problem-aware keywords
These are some of the most underrated and high-converting organic keywords in B2B. The searcher knows something is wrong but hasn't necessarily identified a solution category yet. "Why LinkedIn CPC is high" or "missing attribution in GA4" are perfect examples. Someone searching these phrases is experiencing a real, current pain point. Content that meets them at that moment of frustration, and then gently introduces a solution, converts remarkably well.
- JTBD (jobs-to-be-done) keywords
This is the angle most B2B content teams miss entirely. JTBD keywords are searches framed around the job a person is trying to accomplish, not the software category they're browsing. "How to prove marketing ROI to CFO" or "reduce wasted LinkedIn ad spend" are searches rooted in a specific task within someone's actual role.
These queries often outperform generic software keywords because the intent is concrete and urgent. Nobody searches "how to prove marketing ROI to CFO" out of idle curiosity. That's someone preparing for a real conversation with a real stakeholder, and they need help right now. If your content shows up with a clear, useful answer, you've earned trust before they even know your product exists.
The strongest organic keyword strategies blend all five types. Informational keywords build your audience, commercial and transactional keywords capture demand, and problem-aware and JTBD keywords catch buyers that your competitors' keyword research completely misses.
Organic keywords by business stage (startup to enterprise)
Here's where most generic SEO advice falls apart: it treats every company as if they're at the same stage, with the same resources, competing for the same keywords. The reality is that the right organic keyword strategy changes dramatically depending on where your company sits.
- Early-stage startup
The goal at this stage is finding traction, not dominating a category. You don't have the domain authority to rank for head terms, and you don't have the content library to own a topic cluster. That's fine.
Early-stage startups should focus on pain-point keywords that incumbents ignore, comparison keywords where you can position against well-known competitors, and founder-led thought leadership searches. Examples include "HubSpot alternatives for startups" or "affordable attribution software." These terms won't have massive search volume, but they create a faster path to relevant buyers. At this stage, 50 visits from people who match your ICP are worth more than 5,000 visits from people who'll never buy.
The comparison keyword angle is particularly valuable here. When someone searches "[Competitor] alternatives," they've already decided they need something in that category. They're just not happy with the obvious option. That's a buyer with intent, budget awareness, and an active problem, all in one search.
- Growth-stage SaaS
Once you've found product-market fit and you're scaling pipeline, the keyword strategy broadens. Growth-stage companies should invest in category keywords, use-case clusters, integration keywords, and dedicated competitor comparison pages.
Think searches like "B2B intent data platform" or "Salesforce attribution software." The first is a category search, the second is an integration-specific query. Both signal a buyer who knows what they need and is evaluating options within a defined scope.
This is also the stage where building content clusters pays off. Instead of writing one article about attribution, you build a cluster: what attribution is, how different models compare, which tools handle it, how to implement it with your CRM. Each piece strengthens the others, and Google starts to view your domain as a genuine authority on the topic.
- Enterprise brand
Large companies face a different challenge: protecting market share and dominating category mindshare. At the enterprise level, organic keyword strategy includes branded terms, analyst and category keywords, regional keywords, executive-level problem statements, and content moat clusters.
Examples include "enterprise ABM platform" or "GDPR-compliant attribution software." These searches reflect the specific concerns of enterprise buyers: compliance, scale, security, and the language of procurement teams rather than individual practitioners.
The branded vs non-branded keywords balance also shifts at this stage. Enterprise brands need to actively protect their branded search results, because competitors will bid on your brand name in paid search and write comparison pages designed to intercept your branded organic traffic. If you don't own the narrative around your own brand name, someone else will.
5. Mature category leaders
At this level, the goal is to become the default answer. Category leaders should own every adjacent question, glossary term, benchmark, comparison, and pricing conversation in their space. If someone asks any question even tangentially related to your category, your content should be the one that appears.
Small companies chase keywords. Leaders shape vocabulary. When a category leader publishes a framework or coins a term that the market starts using, they've done something far more powerful than ranking for an existing keyword. They've created the keyword.
How to find organic keywords your buyers use
Knowing the types of keywords and the strategy for your stage is useful, but it doesn't help much if you can't find the specific terms your buyers actually search for. Here's a practical process for how to find organic keywords, organized by source.
- Google Search Console
This is your first stop, and it's free. Search Console shows you which queries your site is already earning impressions for, even if you're not ranking on page one yet. Sort by impressions, and you'll find a goldmine of terms where you're visible but not yet capturing clicks. These represent low-hanging opportunities where a content refresh or a new dedicated page could shift you from position 12 to position 5.
For example, if you're Factors.ai and you notice impressions for "LinkedIn campaign attribution" but no clicks, that's a clear signal to build or optimize a page targeting that specific query.
- Sales call transcripts
I genuinely believe this is the most underused keyword research source in B2B. Your sales team hears how buyers describe their problems every single day, and that language almost never makes it back to the content team. When a prospect says "we can't figure out which campaigns actually influence pipeline," that phrasing is almost certainly a search query waiting to be discovered. Record your calls, tag recurring questions, and feed that language into your keyword research.
- Paid search terms report
If you're running Google Ads, your search terms report is a direct window into what real people type before clicking. This data is invaluable because it shows you actual queries, not the broad match keywords you targeted. Look for high-converting search terms that you're paying for but could rank for organically instead. That's a direct cost-saving opportunity and an organic keyword roadmap rolled into one.
- Competitor gap analysis tools
Tools like Ahrefs and Semrush let you plug in a competitor's domain and see which keywords they rank for that you don't. This is particularly useful at the growth stage when you're trying to close content gaps against established players. Don't just look at their top pages. Filter for keywords where they rank in positions 4 through 15, because those are the competitive terms where a better piece of content could realistically overtake them.
- AI prompt mining
This is the newer frontier, and most B2B teams haven't caught up yet. What questions are your buyers asking ChatGPT, Gemini, or Perplexity? Those queries are different from traditional Google searches. They tend to be longer, more conversational, and more specific. "What's the best way to attribute LinkedIn ad spend to closed-won revenue in Salesforce" is the kind of prompt that shows up in AI tools but might never appear as a traditional keyword in Ahrefs.
Pay attention to these prompts, because they often become future search demand. As AI tools become more mainstream in B2B research workflows, the queries people ask them will eventually migrate into search engines too. Mining this space early gives you a head start on content that your competitors aren't thinking about yet.
How to prioritize keywords for pipeline?
Here's where the discipline comes in. Most B2B teams generate a keyword list and then prioritize by search volume. That approach fills a spreadsheet quickly, but it doesn't fill a pipeline. The fix is shifting from a volume-first model to a pipeline-first scoring framework.
I'd recommend a simple custom scoring model built around four factors:
Priority = Intent × ICP Fit × Revenue Potential × Rankability
Each factor gets a score from 1 to 5, and the composite score tells you where to invest your content effort.
| Factor | What it measures | High score example | Low score example |
|---|---|---|---|
| Intent | How close is this searcher to a buying decision? | "ABM software pricing comparison" (5) | "What is account-based marketing" (2) |
| ICP fit | Does this keyword attract your ideal customer profile? | "B2B attribution for mid-market SaaS" (5) | "Free website analytics tool" (1) |
| Revenue potential | Could ranking here realistically influence pipeline? | "Factors.ai alternatives" (5) | "Marketing glossary terms" (1) |
| Rankability | Can you realistically rank on page one within 6 months? | Low-competition long-tail with your domain authority (5) | Head term dominated by HubSpot, Gartner, G2 (1) |
A keyword scoring 4 × 5 × 4 × 3 = 240 gets prioritized over one scoring 2 × 2 × 1 × 5 = 20, even if the second keyword has ten times the search volume. This isn't complicated math. It's just a structured way to make sure your content calendar reflects commercial reality rather than vanity metrics.
The sharp version of this idea: 10 visits from the right buying committee beat 10,000 visits from curious interns. That's not an exaggeration. I've seen B2B content pages with under 100 monthly visits that generated six-figure pipeline because every visitor was a mid-market VP actively evaluating solutions. Meanwhile, the glossary page with 8,000 visits produced exactly zero opportunities.
High-intent keywords deserve disproportionate investment. If you can only write four articles this month, and one of those articles targets a keyword that signals active evaluation by your ICP, that's the one you write first. Everything else can wait.
How to use organic keywords across your funnel
Organic keywords aren't a single-stage play. The best B2B content strategies map keywords to every stage of the buyer journey, from first awareness through to post-sale retention. Here's how that breaks down in practice.
ToFu (top of funnel)
At the top, you're educating. The buyer might not even know they have a solvable problem yet. Organic keywords here are informational and exploratory: "what is ABM," "how does marketing attribution work," "B2B buyer journey stages."
The content that ranks for these terms tends to be comprehensive educational pieces, guides, and explainers. Your goal isn't to sell. It's to become a trusted source early enough that the buyer remembers you when they move into evaluation. Think of ToFu content as a long-term deposit. It doesn't pay out immediately, but it compounds.
MoFu (middle of funnel)
This is where the buyer knows their problem, knows the solution category, and is actively comparing. Organic search keywords at this stage include comparisons, frameworks, and templates: "best ABM tools for mid-market," "attribution model comparison," "Factors.ai vs 6sense."
MoFu content is where most B2B pipeline actually originates from organic search. The reader has intent, they have context, and they're looking for help making a decision. Comparison pages, framework articles, and use-case specific guides are your strongest content formats here.
BoFu (bottom of funnel)
At the bottom, the buyer is ready to act. They're searching for pricing, requesting demos, or looking for the final piece of validation. Keywords include "Factors.ai pricing," "request demo attribution platform," and "[product] alternatives."
BoFu organic content should make it effortless to take the next step. Pricing pages, product-specific landing pages, and tightly focused alternative comparisons serve this stage. Many B2B brands invest heavily in ToFu and MoFu but completely neglect BoFu organic content, which means they're educating buyers and then losing them right at the decision point.
Expansion and retention
Here's the part most SEO strategies forget entirely: organic keywords don't stop mattering after someone becomes a customer. Documentation, help content, integration guides, and ROI calculators all serve existing customers through organic search. When a current customer searches "how to set up LinkedIn attribution in Factors.ai," your help center should be the first result.
Strong post-sale organic content reduces support tickets, increases product adoption, and creates expansion opportunities. Modern SEO serves the full customer lifecycle, not just the acquisition funnel. If your organic keyword strategy ends at "demo booked," you're leaving retention and expansion value on the table.
Common organic keyword mistakes B2B brands make
After working through strategy, prioritization, and funnel mapping, it's worth pausing to name the mistakes that quietly undermine all of that careful planning. I've seen every one of these across B2B teams of all sizes, and most of them are easy to fix once you notice them.
- Chasing only high-volume keywords
This is the most common trap. High volume feels validating, but in B2B, the highest-volume keywords are often the least commercially relevant. "What is CRM" gets massive searches, but the vast majority of those searchers are students, early-career professionals, or people who'll never buy enterprise software. Volume without intent is just noise.
- Ignoring branded search growth
Many B2B brands treat branded keywords as a given. They assume that if someone searches their company name, they'll find the right page. That's not always true, particularly when competitors write comparison and alternative pages designed to intercept your branded traffic. Monitoring and actively growing branded search volume is a sign of healthy demand generation, and protecting those results matters more than most teams realize.
- One page targeting everything
I've seen companies try to rank a single page for 15 different keywords spanning three different intent types. It doesn't work. Google rewards specificity. A page trying to serve informational, commercial, and transactional intent simultaneously usually serves none of them well. Each distinct intent deserves its own dedicated page.
- Writing generic AI content with no expertise
The temptation to use AI tools to produce high volumes of content has never been stronger. And the resulting content has never been more mediocre. Google's emphasis on experience, expertise, authority, and trust means that generic AI-generated articles without genuine human insight are increasingly unlikely to rank well. Even if they rank initially, they don't convert because readers can feel the absence of real thinking.
- Ignoring funnel-stage intent
Writing a great article on the wrong keyword for the wrong stage is a surprisingly common waste of effort. If your team needs BoFu content to capture bottom-of-funnel demand, but you keep publishing ToFu educational guides because they're easier to write, you're optimizing for effort rather than impact.
- Measuring traffic instead of pipeline
This brings us back to the opening scenario. If your organic keyword reporting stops at sessions and pageviews, you have no idea whether your content strategy is working. The metric that matters is which organic keywords drive pipeline, opportunities, and revenue. Everything else is a leading indicator at best.
- Not refreshing aging pages
Organic content decays. A page that ranked well 18 months ago might have outdated statistics, broken links, or competitor content that's since surpassed it. Regular content audits and refreshes aren't optional. They're maintenance on your most valuable organic assets.
- Forgetting LLM citation formatting
This is the newest mistake on the list, and most B2B teams aren't aware of it yet. AI answer engines pull from content that provides clear, structured answers. If your content buries the answer in paragraph seven of a 3,000-word article, it's less likely to be cited in AI Overviews or generative search results. Clear definitions, structured tables, and concise answer blocks at the top of relevant sections make your content more citable across both traditional and AI-powered search.
How Factors.ai turns keyword traffic into revenue insight
Everything we've discussed so far leads to one central challenge: connecting organic keyword traffic to actual business outcomes. Most analytics tools can tell you that someone visited a blog post. Very few can tell you which account that visitor belongs to, whether they later requested a demo, or whether the content they consumed played a role in a closed-won deal.
This is where Factors.ai fits into the picture. It's designed to bridge the gap between organic traffic and revenue, specifically for B2B teams that need to understand which content actually drives pipeline.
Here's what that looks like:
- Account-level organic visibility. Factors.ai identifies which companies are visiting your organic content, even when individual visitors don't fill out a form. You can see that three people from a target account read your comparison page last week, which is a much more useful signal than "you got 47 anonymous visits."
- Keyword-to-pipeline attribution. Instead of guessing which organic keywords produce pipeline, you can trace the path from a specific search query to account engagement to opportunity creation. That makes it possible to prove which content investments are generating revenue, not just traffic.
- Cross-channel influence comparison. Organic search doesn't operate in isolation. Factors.ai lets you compare SEO influence alongside paid search, LinkedIn campaigns, and direct traffic, so you can see how channels interact across the buyer journey rather than measuring each in its own silo.
- High-intent visitor retargeting. When you can identify accounts visiting high-intent organic pages like pricing or comparison content, you can trigger targeted follow-up through ads, sales outreach, or personalized content. That turns passive organic traffic into active pipeline acceleration.
- Content theme analysis. Over time, you start to see patterns in which content themes and keyword clusters correlate with revenue. Maybe your "alternatives" pages generate three times more pipeline per visit than your educational guides. That insight reshapes your entire content strategy based on data rather than guesswork.
My point is… organic keyword traffic is an investment, and you deserve to know the return on it. Connecting keywords to accounts, opportunities, and revenue is what turns content marketing from a faith-based activity into a measurable growth channel.
In a nutshell…
Organic keywords are the search terms that bring buyers to your site without a per-click cost, and they're more valuable than ever because they reveal intent, urgency, and buying stage across both traditional search and AI-powered research tools. The real skill is identifying the ones that match your ICP, carry commercial intent, and lead to pipeline.
Your keyword strategy should change based on your company's stage. Startups win with pain-point and comparison keywords that larger competitors overlook. Growth-stage companies scale through category clusters and integration terms. Enterprises protect their position by owning branded search, analyst keywords, and content moats that cover every adjacent question in their space.
The process for finding the right organic keywords combines Google Search Console, sales call transcripts, paid search data, competitor gap analysis, and the emerging practice of AI prompt mining. Once you have a list, prioritize ruthlessly using intent, ICP fit, revenue potential, and rankability rather than defaulting to search volume.
Map your keywords across the full funnel, from ToFu education through MoFu evaluation to BoFu conversion and post-sale retention. Avoid the most common mistakes: chasing vanity volume, ignoring branded search, publishing generic AI content, and measuring traffic without connecting it to pipeline. And if you want to actually prove which organic keywords drive revenue, a tool like Factors.ai closes the loop between anonymous traffic and real business outcomes.
The single most important takeaway: treat organic keywords as buyer intent signals, not just SEO inputs. Prioritize the ones where your best customers are searching, build content that genuinely helps them, and measure the results in pipeline and revenue. Everything else is a distraction.
Frequently asked questions about organic keywords
Q1. What are organic keywords in SEO?
Organic keywords are search terms that drive unpaid traffic to your website through search engine rankings. When someone types a query into Google and clicks on a non-sponsored result that leads to your site, the query they used is an organic keyword. You don't pay for the click itself, though earning those rankings requires investment in content, technical SEO, and domain authority over time.
Q2. Are organic keywords free?
You don't pay per click the way you do with Google Ads, so there's no direct cost for each visitor. But ranking for organic keywords requires real investment: content creation, SEO expertise, technical optimization, and link building all take time and resources. The advantage is that the returns compound. A page that ranks well can generate traffic for years, unlike a paid ad that stops delivering the moment your budget runs out.
Q3. What is an example of an organic keyword?
For a B2B company selling account-based marketing software, an organic keyword might be "best account-based marketing software." If your page ranks in Google's organic results for that term and someone clicks through, that's organic keyword traffic. Other examples include "ABM platform comparison," "intent data tools for SaaS," or "how to measure marketing attribution." The specific keywords depend on your product, your audience, and the problems you solve.
Q4. How do I find my organic keywords?
Start with Google Search Console, which shows you the exact queries your site already earns impressions and clicks for. Layer in data from your paid search terms reports, which reveal what real buyers type before clicking your ads. Use competitor gap analysis tools like Ahrefs or Semrush to find keywords your competitors rank for that you don't. And don't overlook qualitative sources: sales call transcripts, customer support tickets, and community forums often surface buyer language that no keyword tool would surface.
Q5. Are organic keywords better than paid keywords?
Neither is universally better. They serve different purposes and work on different timelines. Organic keywords compound over time and tend to earn higher trust from B2B buyers, but they take months to build momentum. Paid keywords deliver immediate visibility and precise targeting, but stop working the moment you pause your budget. The smartest B2B strategies use both, with paid data informing organic priorities and organic rankings reducing long-term dependence on paid spend.
Q6. Do keywords still matter with AI search?
Yes, they absolutely do. The language of buyer intent hasn't changed just because the search interface has. What has changed is how that intent gets served. AI-powered search tools like Google AI Overviews, Perplexity, and ChatGPT pull from content that provides clear, structured, authoritative answers. Keywords still matter because they represent the questions buyers ask, but content quality, expertise, and structured formatting now matter even more than they did when traditional blue-link rankings were the only game in town.
Organic Search in SEO: terms, examples, and visibility in the AI era
Read all about organic search in SEO, rankings, keywords, visibility metrics, and how AI search is changing organic traffic for B2B brands.
TL;DR
- Organic search in SEO refers to unpaid visibility you earn through relevance, authority, and usefulness across search engines and AI answer surfaces. It isn't free; it takes sustained investment in content, technical health, and credibility.
- Organic rankings in 2026 depend on intent match, topical authority, helpful content signals, and trust, not keyword density or mechanical optimization tricks.
- Organic search visibility matters more than raw traffic, because users increasingly get answers without clicking. Track share of voice, citation frequency, and branded demand growth alongside sessions.
- AI search tools like Google AI Overviews, Perplexity, and ChatGPT are reshaping click patterns, but high-intent, bottom-funnel organic search still drives B2B pipeline and revenue.
- The future of organic search marketing SEO blends traditional SEO, generative engine optimization (GEO), digital PR, and multi-touch attribution to prove impact.
There's a specific kind of panic that settles over a B2B marketing team when organic traffic dips for two consecutive months. Suddenly, everyone has opinions… the CEO wants to know if SEO is ‘dead’... demand gen lead suggests shifting budget to paid… someone drops a link to a LinkedIn post claiming AI search has made organic irrelevant. I've seen this happen at least a dozen times, and it almost always starts from the same misunderstanding: people conflate organic traffic with organic search, and they treat a short-term dip as a structural collapse.
Organic search in SEO hasn't stopped working. But it has changed shape, and most B2B teams are still measuring the old shape… that's the real problem.
This piece breaks down what organic search actually means in 2026, how rankings work now, why visibility matters more than sessions, and what you need to do differently when AI answer engines sit between your content and the click.
What is organic search in SEO?
Let me answer this directly: organic search in SEO is the unpaid visibility your website earns in search engine results based on relevance, authority, and usefulness. When someone types a query into Google, Bing, DuckDuckGo, or any other organic search engine, the non-sponsored listings they see are organic results. If they click one of those listings and land on your site, that's organic traffic.
The organic search definition sounds simple enough, but there's a common misconception worth clearing up early. People call organic traffic "free traffic," and that framing causes real damage in boardroom conversations. There's nothing free about it. Earning organic visibility requires sustained investment in content strategy, technical SEO, distribution, link building, and brand credibility. The cost structure is different from paid ads, not absent.
What's also shifted is where organic discovery actually happens. A few years ago, organic search meant Google's ten blue links and maybe a featured snippet. Today, it includes AI-generated summaries that cite your content, answer panels that pull from your pages, and conversational search tools that recommend your brand by name. Organic search now means being discoverable wherever intent starts, whether that's a classic SERP, an AI Overview, or a Perplexity citation. If your definition of organic stops at traditional search results pages, you're already thinking too narrowly.
What are organic search results?
Understanding what are organic search results requires looking at the actual page a user sees after they type a query. The organic search results definition covers every unpaid element that appears because a search engine's algorithm judged it relevant. That includes quite a few formats now, and each one works differently.
Here's what users typically encounter on a modern search results page:
Anything marked "Sponsored" is paid, and everything else falls within the organic listing ecosystem, though the rules for appearing in each format differ. A featured snippet requires concise, well-structured content. Video results obviously need video. AI summaries tend to cite pages with clear definitions, structured data, and strong authority signals.
For B2B brands, the practical takeaway is that organic results aren't just one format anymore. Your content might appear as a blue link for one query, a featured snippet for another, and a cited source inside an AI overview for a third. Optimizing for organic search results now means thinking about all these surfaces, not just traditional rank positions.
Organic search vs paid search vs direct traffic
This is where analytics dashboards start misleading people, and where the organic search vs direct distinction really matters. Let me define all three cleanly and then explain why B2B teams consistently misread them.
- Organic search means a user found you through an unpaid result on a search engine. They typed a query, saw your listing, and clicked it. Your analytics tool attributes this visit to the organic channel because it can identify the referring search engine.
- Paid search means a user clicked on an ad you purchased. They might have typed the same query, but they clicked a sponsored result. You paid for that click directly through an auction-based ad platform.
Direct traffic is where things get a little messy. In theory, direct means someone typed your URL into their browser or used a bookmark. But in real, direct traffic is a catch-all bucket for visits where the analytics tool can't identify the source. That includes dark social shares, links from messaging apps, some email clicks, mobile app referrals, and browser privacy features that strip referral data.
Here's a comparison that shows how these channels differ in practice:
The real issue for B2B teams is that single-touch reporting hides the interplay between these channels. A buyer might first discover your brand through an organic search result for "account-based marketing measurement." Two weeks later, they come back by typing your URL directly, which gets logged as direct. A month after that, they click a retargeting ad and request a demo, so paid gets the conversion credit. In single-touch attribution, organic search gets zero credit for starting that journey.
This is exactly the scenario where platforms such as Factors.ai become valuable. Multi-touch attribution connects these visits into a coherent account journey so you can see that organic content initiated the relationship even though paid closed it. Without that visibility, marketing teams under-credit organic search and over-invest in channels that merely capture existing demand rather than creating it.
How do organic rankings actually work in 2026?
If you've been doing SEO for any length of time, you've probably noticed that the advice keeps evolving while the fundamentals stay surprisingly stable. Organic ranking in 2026 still depends on a set of core signals, but the weighting and interpretation of those signals have shifted meaningfully.
Here's what actually drives organic rank today:
- Search intent match remains the single most important factor
If your page doesn't answer what the user is actually looking for, nothing else saves it. Google has gotten substantially better at understanding intent nuance. A page targeting "best CRM for startups" that reads like a product pitch for one CRM will lose to a genuine comparison guide, even if the product-pitch page has stronger backlinks.
- Content depth and quality matter more than content length
There was a phase where 3,000-word articles outranked everything simply because they were comprehensive… that era is over. What works now is covering a topic thoroughly enough that a reader doesn't need to click back and search again. Depth means answering follow-up questions before the reader asks them.
- Topical authority
Search engines evaluate whether your entire site demonstrates expertise in a subject area, not just whether one page is well-optimized. A B2B analytics company that consistently publishes about attribution, ad measurement, and revenue operations will rank more easily for new content in that space than a generalist site publishing its first attribution article.
- Helpful UX signals
These include page speed, mobile usability, clear layout, and absence of intrusive interstitials. These aren't dramatic ranking factors on their own, but they create a floor. Poor UX can prevent good content from ranking where it deserves.
- Internal linking
Serves two purposed: it helps search engines understand your site's topic architecture, and it distributes authority from stronger pages to newer ones. Most B2B sites dramatically underuse internal links, which is one of the easiest organic rankings improvements available.
- Backlinks and mentions still carry weight, though the emphasis has shifted toward quality and relevance
One link from a respected industry publication does more than fifty links from generic directories. Brand mentions without links also contribute to entity recognition and trust signals, which matters as search engines increasingly evaluate brands as entities.
- Crawlability and technical health are table stakes
If search engines can't efficiently crawl and index your pages, none of the above matters. Clean information architecture, proper canonical tags, fast rendering, and well-structured XML sitemaps keep the foundation solid.
- Freshness
If you've published a "best tools for 2024" article and haven't updated it, search engines will reasonably prefer a 2026 version from a competitor.
Engagement proxies are a debated category, but there's enough evidence that search engines pay attention to whether users stay on a page or immediately bounce back to results. Writing content that genuinely satisfies the reader's intent naturally improves these signals.
The underlying philosophy has shifted from "optimize for the algorithm" to "be the best next click." Ranking is less about keyword density or mechanical on-page tweaks and more about whether your page is genuinely the most useful result for a given query. Google's helpful content guidance reinforces this: content should be written for people first, with search visibility as a natural outcome of quality and relevance.
Organic search keywords explained
Every organic search strategy runs on keywords, but the way B2B marketers should think about organic search keywords has matured well beyond "pick high-volume terms and write pages for them." Let me break down what organic keywords actually are and why the nuances matter for pipeline generation.
An organic keyword is any search query for which your website ranks in unpaid results. If someone searches "LinkedIn ads attribution" and your page appears on the first page of organic results, that's an organic keyword you own. You didn't pay for that placement. Your content earned it through relevance and authority. That's the core of what is organic keyword targeting.
The differences come in when you categorize these keywords by type:
- Branded vs non-branded keywords. Branded organic keywords include your company name (like "Factors.ai pricing" or "Factors.ai reviews"). Non-branded keywords are topic-based queries where you compete on merit ("multi-touch attribution tools" or "B2B ad reporting dashboard"). Non-branded organic keywords are where you capture new demand from people who don't know your brand yet. Branded keywords convert at higher rates but represent demand you've already created through other channels.
- Informational vs commercial keywords. Informational queries seek understanding: "what is account-based marketing" or "how to lower linkedin cpc." Commercial queries signal buying intent: "best LinkedIn ads reporting tools" or "Factors.ai vs Dreamdata." Both matter in B2B, because buyers spend weeks or months in research mode before they ever compare vendors.
- High-volume vs high-intent keywords. This is where B2B organic research gets interesting. A keyword like "what is SEO" might get 100,000 searches a month, but the people searching it include students, beginners, and curiosity browsers. A keyword like "b2b ad reporting dashboard" might get 200 searches a month, but every one of those searchers is likely evaluating tools and has budget authority or influence. In B2B, a keyword with 200 searches can outperform one with 20,000 if it attracts buyers who are actually in-market.
- Long-tail vs head terms. Head terms are short and competitive ("attribution," "SEO tools"). Long-tail keywords are longer, more specific phrases ("how to track offline conversions in B2B"). Long-tail keywords individually drive less traffic but collectively make up the majority of searches. They also tend to carry clearer intent, making them valuable for B2B content strategies.
For a company like Factors.ai, practical organic keyword targets might include:
- LinkedIn ads attribution (commercial, non-branded, high-intent)
- Account-based marketing measurement" (informational, non-branded)
- How to lower linkedin cpc (informational, non-branded, specific pain point)
- B2B ad reporting dashboard (commercial, non-branded, high-intent)
- Factors.ai vs Dreamdata (commercial, branded, decision-stage)
The keyword strategy that drives revenue isn't the one chasing the biggest numbers. It's the one that maps keywords to stages in the buyer's journey and prioritizes intent over vanity volume. Most B2B organic keyword lists should be weighted toward MoFu and BoFu terms, with enough ToFu content to build topical authority and capture early awareness.
Organic search visibility: metrics you should care about
Here's something that catches a lot of marketing teams off guard. Your organic traffic can decline while your organic search visibility actually improves. Those two things aren't contradictory, and understanding why is essential for measuring organic performance accurately in 2026.
Organic search visibility measures how often and how prominently your brand appears across relevant unpaid searches. It's a broader concept than traffic because it accounts for your presence even when users don't click through to your site. Visibility is about share of presence, not just share of clicks.
Several components make up a complete visibility picture:
- Average ranking position tells you where your pages typically appear for target keywords. Moving from position eight to position three is a meaningful visibility gain, even before you look at click-through rates.
- Share of voice measures what percentage of total organic visibility in your topic space belongs to you versus competitors. If there are 50 key queries in your market and you rank in the top three for 20 of them, your share of voice is roughly 40%. This metric matters because it contextualizes your performance relative to the competitive landscape rather than in isolation.
- Click-through rate by position reveals how effectively your listings convert impressions into visits. A compelling title tag and meta description can meaningfully improve CTR at the same ranking position. This is one of the most under-optimized levers in B2B SEO.
- SERP feature ownership tracks whether you hold featured snippets, People Also Ask placements, or video results for your target queries. These features occupy visual real estate above standard organic listings and disproportionately capture attention.
- AI citation frequency is the newest and most important addition to the visibility framework. As Google AI Overviews, Perplexity, ChatGPT search, and Microsoft Copilot generate answers to queries, they cite sources. If your content gets cited in those AI-generated answers, you have visibility even when the user never visits a traditional search results page. Tracking how often your brand or content appears in AI citations is becoming a core KPI.
- Branded demand growth is an indirect but powerful visibility indicator. When your organic content educates buyers, some of them will later search for your brand name directly. An increase in branded search volume is evidence that your organic content strategy is building awareness, even if the original content visits happened weeks or months earlier.
The takeaway is that traffic can fall while visibility rises if users get answers directly on the search results page or inside an AI summary. Smart marketing teams track influence, not only clicks. If your brand is consistently cited, consistently appearing in top positions, and consistently mentioned in AI answers, you're building organic authority even when sessions look flat. The teams that panic and abandon organic because of a traffic dip often don't realize their visibility is actually growing.
Why does organic search still drive B2B revenue?
There's a temptation in B2B marketing to get distracted by whichever channel is newest or flashiest. But organic search continues to be one of the most reliable revenue drivers for B2B companies, and the reasons are structural, not sentimental.
B2B buying cycles are long and research-intensive… you know it. A typical purchase decision for a SaaS product involves three to ten stakeholders, spans weeks to months, and requires the buyer to educate themselves before they ever engage a sales rep. That education overwhelmingly happens through search. The buyer is actively looking for answers, comparing options, and building a business case. Organic search captures this intent at the exact moment it's expressed.
Consider the types of queries that drive B2B pipeline:
- Problem-aware searches happen early. "How to track LinkedIn ad ROI" or "why is my CAC increasing" are queries from someone who has a problem but hasn't identified a solution yet. Organic content that answers these questions puts your brand in the consideration set months before a demo request.
- Comparison and alternatives searches happen in the middle of the buying journey. "Factors.ai vs Dreamdata" or "best multi-touch attribution tools" are queries from someone actively evaluating options. Ranking for these terms means you're present at the decision point.
- Pricing and implementation searches happen close to purchase. "Factors.ai pricing" or "how to implement multi-touch attribution" signal serious buying intent. These searchers aren't browsing for entertainment; they're preparing to make a decision.
- Self-serve education queries run throughout the entire cycle. "What is account-based marketing?" or "how does B2B ad attribution work" are questions that multiple stakeholders within the buying committee will search independently. Your organic content might reach the marketing manager, the VP of demand gen, and the CFO through different queries at different times.
The compounding nature of organic search makes it super valuable for B2B companies operating with constrained budgets. A paid ad stops generating leads the moment you pause spending. An organic article that ranks well continues attracting relevant visitors for months or years, with the cost per visit declining over time. That mathematical reality is hard to argue with, even in a world of AI-generated answers and zero-click results.
Where platforms such as Factors.ai become especially relevant is in connecting organic content performance to downstream revenue. Organic content can identify anonymous visitor intent at the account level, then sync those accounts into paid nurture campaigns and sales outreach sequences. A visitor who reads your "multi-touch attribution guide" and doesn't convert isn't a lost cause. They're an identified account that your sales team can now engage with context. That bridge between organic content and revenue attribution is what separates modern organic search marketing SEO from old-school "publish and hope" blogging.
How is AI search changing organic traffic?
This is the section where the conversation gets genuinely interesting, because AI search represents the first structural shift in organic discovery since Google introduced featured snippets nearly a decade ago.
The players reshaping the landscape are Google AI Overviews, OpenAI's ChatGPT with web browsing, Perplexity AI, and Microsoft Copilot. Each works slightly differently, but the pattern is consistent: the AI reads multiple sources, synthesizes an answer, presents it to the user, and sometimes cites the sources it drew from. The user gets their answer without necessarily clicking through to any individual page.
This has several practical consequences for organic search.
- Zero-click answers are rising, especially for simple queries. If someone asks "what is organic search in SEO," an AI Overview can provide a clean definition without the user ever visiting a webpage. For straightforward informational queries, the click-through rate to organic results is dropping measurably. This doesn't mean organic content is worthless for those queries, but it does mean the value shifts from traffic to visibility and brand recognition.
- Fewer clicks for simple queries means more value concentrated in complex and bottom-funnel searches. When someone searches "best B2B attribution tools for companies using LinkedIn Ads," the AI might summarize options, but the buyer still wants to visit comparison pages, read reviews, and explore product sites. Complex, high-intent queries still drive clicks because the user needs more than a paragraph to make a decision. For B2B marketers, this is actually encouraging. The queries that matter most for revenue are the ones that still generate clicks.
- Brand mentions are becoming indirect ranking signals. AI models learn from the web. If your brand is mentioned frequently across authoritative sources in connection with your topic area, AI tools are more likely to reference you in their answers. This creates a feedback loop where digital PR, thought leadership, and original research contribute to AI visibility, which in turn strengthens organic authority. Being well-known and well-cited matters more than ever.
- Citation share is emerging as a new KPI. Just as share of voice measures your presence in traditional organic results, citation share measures how often AI answer tools reference your brand or content. Some teams are already tracking this manually by running key queries through ChatGPT, Perplexity, and Google AI Overviews and recording whether their brand appears. It's an imperfect metric so far, but it's directionally useful and will likely get formalized tooling soon.
The mental model for organic search has shifted, and it's worth articulating the change clearly:
The old model was linear: rank, click, visit. The new model is more circular: mention, trust, visit, convert. AI search doesn't eliminate the need for organic content. It changes how that content generates value. Your article might get cited in a Perplexity answer without the user clicking through, but that citation builds familiarity and trust. When the same buyer later searches for your brand by name and requests a demo, organic content initiated that journey even though no one clicked the original article.
For B2B marketing teams, the strategic response isn't to abandon organic. It's to expand what you measure and optimize for AI discoverability alongside traditional rankings.
How can you improve organic search rankings?
Improving organic rankings in 2026 requires work across four areas: content, technical foundation, authority, and AI-era optimization. I'll break each one down with specific actions rather than vague advice.
- Content improvements
- Build topic clusters. Instead of publishing isolated articles, create interconnected content hubs. A central pillar page on "B2B attribution" links to supporting articles on specific models, implementation guides, tool comparisons, and use cases. This structure signals topical authority to search engines and keeps readers on your site longer.
- Write definitive guides on your core topics. Every B2B brand has five to ten topics it should own completely. Identify yours and create the most thorough, useful resource available for each one. These become your ranking anchors, the pages that earn backlinks and establish your site's authority.
- Update decaying content regularly. Pages that ranked well six months ago but are losing position need refreshing. Update statistics, add new sections addressing recent developments, improve formatting, and republish with a current date. A content refresh cycle every quarter prevents slow organic decay.
- Add FAQs and schema markup. Structured FAQ sections give your content a chance to appear in People Also Ask results and AI answer extractions. FAQ schema markup helps search engines understand the question-and-answer format explicitly.
- Include expert quotes and original data. Content that features real practitioner perspectives and unique data points stands out from AI-generated articles that all say the same thing. Quote your internal experts, cite your own product data (anonymized), or reference original research you've conducted.
- Technical improvements
- Fix crawl waste. Audit your site for pages that shouldn't be indexed: old tag pages, duplicate parameter URLs, thin archive pages. Every page search engines crawl that doesn't deserve indexing wastes crawl budget that could go toward your valuable content.
- Improve page speed. Core Web Vitals aren't a dramatic ranking factor, but slow pages create poor user experiences that hurt engagement signals. Compress images, lazy-load below-the-fold elements, minimize render-blocking JavaScript, and use a CDN.
- Clean up information architecture. Your site's navigation should make it obvious what topics you cover and how content relates to each other. Flat architectures where every page is three clicks or fewer from the homepage tend to perform best for crawlability and user experience.
- Strengthen internal linking. Every new article should link to three to five relevant existing pages, and those existing pages should be updated to link back. Internal links are one of the few ranking factors entirely within your control, and most sites underuse them significantly.
- Authority building
- Earn PR mentions in industry publications. Guest articles, expert commentary in journalist pieces, and original research that gets cited all build the kind of external authority that improves organic rankings. One mention in a respected trade publication carries more weight than dozens of generic directory links.
- Develop partnerships and co-marketing content. Joint webinars, co-authored research reports, and partner integrations naturally generate backlinks and brand mentions from relevant, authoritative domains.
- Publish original research and useful tools. A benchmarking report, a free calculator, or a diagnostic template earns links passively because people reference useful resources. This is the most sustainable approach to link building for B2B brands.
- AI-era optimization
- Write answer-first introductions. Start every article by directly answering the primary question. AI extraction tools tend to pull from the opening paragraphs, so a clear, concise answer at the top increases your chances of being cited.
- Include clear definitions early in your content. When your article targets a "what is" query, provide a clean one-to-two sentence definition within the first 150 words. AI models look for these definitional statements when generating answers.
- Use tables and structured formats. Comparison tables, feature lists, and structured data are easier for both humans and AI models to parse. They increase the likelihood that your content is selected as a citation source.
- Build entity-rich context. Mention related concepts, tools, people, and companies naturally within your content. This helps AI models understand the topical context of your page and associate your brand with your subject area.
- Include quotable statistics and strong source citations. When your content contains specific data points with clear sourcing, AI tools are more likely to cite it as a credible reference. Vague claims without evidence rarely get extracted.
Organic search examples for B2B SaaS brands
Here are four organic search scenarios that map to different stages of the B2B buyer journey, each showing how organic content creates business value.
Example 1: Awareness stage
Query: "What is multi-touch attribution?"
A marketing manager at a mid-market SaaS company is trying to understand why their single-touch reporting doesn't match reality. They search this question, find your definitive guide, and spend eight minutes reading it. They don't convert. They don't even remember your brand name next week. But they've entered your analytics as an identified account, and your content planted the first seed of a relationship.
Three weeks later, they see your brand mentioned in a LinkedIn post from a colleague. Recognition kicks in: "Oh, I read their attribution guide." That organic article didn't generate a lead, but it created the awareness that makes every subsequent touchpoint more effective.
Example 2: Consideration stage
Query: "Best LinkedIn Ads reporting tools"
A demand gen leader is actively evaluating tools to improve their LinkedIn campaign reporting. They search this comparison query and find your article that reviews five options, including yours. The content is honest about trade-offs and clearly written. They bookmark it, share it with a colleague, and add two of the mentioned tools to their evaluation shortlist.
This organic result influenced a buying committee without any sales involvement. The content did the selling by being genuinely useful at the right moment in the research process.
Example 3: Decision stage
Query: "Factors.ai vs Dreamdata"
A VP of marketing has narrowed their shortlist to two tools and wants an objective comparison. If you've published a fair, detailed comparison page, you control the narrative for this critical query. If you haven't, a third-party review site or a competitor's content will shape the buyer's perception instead.
Decision-stage organic content is remarkably high-leverage because the intent is so clear. Every visitor to a "vs" page is actively choosing between options, and conversion rates from these pages tend to be dramatically higher than from awareness content.
Example 4: Expansion stage
Query: "How to track offline conversions in B2B"
An existing customer is trying to solve a new problem within their marketing stack. They search, find your guide on offline conversion tracking, and realize your product already supports this use case. Instead of churning because they thought they needed a different tool, they expand their usage.
This is organic content driving retention and expansion revenue, which is the category most B2B brands ignore when they calculate organic ROI. Customer education content that ranks organically reduces churn and increases lifetime value in ways that rarely show up in standard organic traffic reports.
The thread connecting all four examples is time. One article can influence pipeline months after publication. The visitor who reads your awareness content today might become a qualified opportunity next quarter and a closed deal the quarter after that. Organic search creates value on a timeline that matches B2B buying cycles, which is precisely why it's so effective for companies with long sales processes.
Common organic search mistakes most B2B teams are making
After working with enough B2B marketing teams, certain patterns of organic search mistakes appear with almost predictable regularity. These aren't obscure technical issues. They're strategic errors that undermine otherwise solid programs.
- Chasing volume instead of intent. This is the most common mistake by a wide margin. Teams target keywords with impressive search volume numbers and then wonder why the traffic doesn't convert. In B2B, a page ranking for "what is CRM" brings a completely different audience than a page ranking for "best CRM for B2B SaaS companies under 200 employees." The second query has a fraction of the volume and ten times the commercial value.
- Ignoring buyer intent in content creation. Closely related to the volume trap, this happens when content is written to match a keyword rather than to solve the problem behind the keyword. If someone searches "how to reduce CAC in B2B," they want practical strategies, not a 500-word definition of CAC followed by generic advice. Understanding what the searcher actually needs, and then delivering it better than anyone else, is the core skill of effective organic search marketing SEO.
- Measuring only sessions. When organic performance reviews focus exclusively on "how many visits did we get," you lose sight of what those visits accomplished. Sessions don't distinguish between a bounce from an irrelevant visitor and an eight-minute read from an ideal buyer. Track engagement depth, conversion events, and account-level behaviour alongside raw session counts.
- Publishing thin, AI-generated pages at scale. There's a temptation to use generative AI to produce hundreds of pages targeting long-tail keywords. Search engines have gotten aggressive about identifying and demoting low-quality content that doesn't add genuine value. Ten excellent pages will outperform a hundred mediocre ones every time, because authority concentrates on quality.
- No differentiation in content. If your article says the same things as the top ten results with no unique angle, original data, or distinctive voice, there's no reason for it to rank. Search engines are increasingly rewarding content that adds something new to the conversation. "Different" beats "more comprehensive" when the comprehensive version is just a longer way of saying the same things.
- Neglecting internal links. I've audited B2B sites where newer blog posts have zero internal links pointing to them. That's like putting a product on a shelf in a room with no door. Internal linking is the simplest, most controllable way to distribute authority and help search engines understand your content relationships.
- No content refresh cycle. Publishing new content while letting existing content decay is a losing strategy. Your best-performing pages will gradually lose rankings if you don't update them with current information, improved formatting, and fresh examples. Build a quarterly refresh calendar and treat it as seriously as new content production.
- Ignoring branded search growth. If your non-branded organic traffic is growing but branded searches are flat, something is off. Effective organic content should build brand awareness over time. Track branded search volume as a lagging indicator of whether your content strategy is actually building familiarity and trust.
- Not optimizing for AI citations. This is the newest mistake and the one most teams haven't started addressing yet. If your content isn't structured for easy extraction by AI models, you're invisible in an increasingly important discovery channel. Clear definitions, structured data, answer-first formatting, and entity-rich context all improve your chances of appearing in AI-generated answers.
The new future: SEO, GEO, and brand authority working together
Organic search hasn't become irrelevant. It's become one component of a larger system, and the teams that thrive are the ones connecting the pieces rather than treating each channel as a separate silo.
SEO remains the foundation. You still need technically sound pages, well-structured content, and earned authority to appear in search results. None of that has changed. What's changed is that SEO alone isn't sufficient to capture the full spectrum of organic discovery.
Generative engine optimization, or GEO, is the emerging discipline of ensuring your content and brand appear in AI-generated answers. It shares many principles with traditional SEO (clear writing, structured information, authoritative sourcing) but adds new considerations: entity association, citation worthiness, and answer-first content design. GEO isn't a replacement for SEO. It's the next layer on top of it. If classic SEO helps you rank on a results page, GEO helps you become the source an AI system trusts enough to mention.
Then comes brand authority, which may be the most underrated lever of all. Search engines and AI tools increasingly evaluate entities, not just webpages. They look for consistent signals that your company is credible, cited, discussed, and associated with a category. A brand that appears in industry reports, earns media mentions, publishes original research, gets talked about on LinkedIn, and is searched by name has a structural advantage over a technically perfect but invisible company.
The smartest B2B teams won’t ask whether SEO is dead. They’ll ask how SEO, GEO, brand, and measurement can work together.
For a company like Factors.ai, that might mean publishing a category-defining guide on attribution, promoting original benchmark data through PR and LinkedIn, ensuring pages are structured for AI extraction, and then measuring which influenced accounts later entered pipeline. That is a much more mature model than obsessing over weekly traffic graphs.
In a nutshell…
Organic search in SEO still matters enormously. It just no longer lives in one place.
It lives in Google rankings, yes. But it also lives in AI summaries, citations, comparison answers, brand mentions, dark social recall, and the moment a buyer types your company name into search after seeing you three times elsewhere.
That’s why judging organic performance only by sessions is now outdated. Visibility, trust, branded demand, influenced pipeline, and revenue tell a fuller story.
If I were leading a B2B content team in 2026, I’d treat organic search as a reputation engine with demand capture attached. Build genuinely useful content. Structure it clearly. Say something original. Become citable. Then measure what happens downstream.
Because the brands winning organic today are not the ones gaming algorithms.
They’re the ones becoming the obvious answer.
FAQs for organic search in SEO
Q1. What is organic search in SEO?
Organic search is the process of earning non-paid visibility on Search Engine Results Pages (SERPs) by aligning your website’s content with a searcher’s intent. Unlike Paid Search (PPC), where visibility is bought via bidding, organic search performance is a "meritocracy" built on relevance, technical integrity, and topical authority. In a modern context, organic search has evolved from simply "ranking for keywords" into a broader strategy of Brand Discovery, ensuring your company appears wherever a user asks a question—whether that’s a traditional search bar or a generative AI interface.
Q2. What are organic search results?
Organic search results are the "natural" listings that search engines determine to be the most helpful for a specific query. While these were once just "10 blue links," today’s organic ecosystem is far more diverse. It includes:
- Standard Listings: Traditional web page links.
- Rich Snippets: Results enhanced with star ratings, prices, or FAQ dropdowns.
- SERP Features: Featured snippets, image carousels, video packs, and "People Also Ask" boxes.
- Local Packs: Map-based listings for localized intent.
- AI Overviews: Citations and links embedded within generative AI summaries at the top of the page.
Q3. Is organic traffic free?
Technically, you do not pay "per click" to search engines, but organic traffic is far from free. It is an earned asset that requires an upfront and ongoing investment in "Sweat Equity." High-quality organic growth demands a budget for:
- Content Strategy: Creating high-intent, expert-led material.
- Technical SEO: Maintaining site speed, mobile-first design, and crawlability.
- Authority Building: Earning mentions and backlinks from reputable industry sources.
- Intelligence: Investing in tools and talent to measure pipeline impact rather than just traffic volume.
Q4. Does AI search reduce organic traffic?
AI search (like Perplexity, ChatGPT Search, and Google’s AI Overviews) has shifted the type of traffic websites receive. For "zero-click" queries—simple, informational questions like "What is the weather?"—traffic has decreased because the AI provides the answer directly. However, for complex, high-intent B2B searches, organic traffic remains robust. Buyers still need to click through to read deep-dive whitepapers, compare technical specs, or request demos. The goal has shifted from capturing "informational volume" to capturing "commercial intent."
Q5. What matters more now: rankings or visibility?
In 2026, Visibility (and Share of Search) has overtaken rankings as the primary KPI. A "#1 ranking" for a keyword is less valuable if it’s buried beneath four ads and a giant AI summary. Modern success is measured by Omnichannel Visibility: your brand’s presence across standard links, AI citations, featured snippets, and social search. If your brand is the "suggested source" in an AI answer, you have high influence even if you aren't the first "blue link" below it.
Q6. How can B2B brands improve organic search performance?
To win today, B2B brands must move beyond basic keyword targeting and focus on Topical Authority. This involves:
- Information Gain: Adding original data, unique case studies, and "Experience" (the extra 'E' in E-E-A-T) that AI cannot replicate.
- Intent Mapping: Creating specific content for every stage of the buyer’s journey (ToFu, MoFu, BoFu).
- Technical Excellence: Using structured data (Schema) to help AI engines "read" and cite your content.
- Attribution: Using tools like Factors.ai to prove that organic traffic is actually converting into MQLs and closed-won revenue, not just vanity clicks.
Q7. What is the difference between SEO and GEO?
While both aim for unpaid visibility, they target different algorithms:
- SEO (Search Engine Optimization): Primarily targets search bots (like Googlebot) to rank in traditional, link-based search results. It prioritizes keywords, site structure, and backlink profiles.
- GEO (Generative Engine Optimization): Targets Large Language Models (LLMs) to ensure your brand is cited as a trusted source in AI-generated answers. GEO prioritizes factual precision, structured formatting (like tables and lists), original insights, and having your brand mentioned in "seed" datasets that AI models use for training.

LLM marketing: A comprehensive guide for B2B marketers
Learn how marketers use LLMs for smarter campaigns, content, targeting, and reporting. Real B2B examples plus strategy tips from Factors.ai.
TL;DR
- LLM marketing means applying large language models like GPT, Claude, or Gemini to real marketing workflows, from content production and campaign optimisation to ABM targeting and pipeline reporting.
- LLMs are most powerful when connected to clean first-party data (CRM, ad platforms, website analytics), not when used for generic prompt-and-paste tasks.
- Practical use cases span every funnel stage: ToFu ideation, MoFu nurture personalization, and BoFu sales enablement, with measurable time savings and performance gains.
- Human oversight remains non-negotiable. The best LLM marketing workflows pair AI speed with human judgment for brand safety, accuracy, and strategic thinking.
- Building an LLM marketing workflow starts small: pick one painful process, connect real data, layer in review, measure outcomes, and expand carefully.
You know those crime shows where detectives have a wall full of clues, red strings, blurry photos, and somehow still no idea who did it?
That’s how a lot of modern marketing teams operate.
Data is all over the place… ad platforms have one story… CRM has another… Website analytics is doing its thing in the corner… someone has a spreadsheet called “Final_Final_Updated2.xlsx” that may or may not contain the truth. Everyone has information, but nobody has clarity.
That mess is exactly why LLM marketing is getting real attention: because businesses are drowning in tools, dashboards, tabs, and partial answers.
The real value of large language models in marketing is simple: they help make sense of chaos by processing vast amounts of customer data to extract actionable, data-driven insights.
Imagine asking one connected system which campaigns actually influenced pipeline last week, why demo requests dropped, or which accounts are suddenly showing buying intent. Instead of playing detective across six platforms, you get a useful answer in seconds.
That changes how teams work. Less time gathering numbers. More time making decisions. Less reporting theatre. More actual progress.
Yes, LLMs can help with content too. But the smarter use case is bigger than copywriting. It’s reporting, segmentation, forecasting, campaign planning, lead intelligence, and helping humans move faster with better context.
This guide is for people who are curious about LLM marketing but allergic to AI hype. We’ll cover what it actually means, where it creates value, and how to use it without turning your workflow into a sci-fi side quest.
What is LLM marketing?
As usual, I’ll share the textbook-y definition first… LLM marketing is the practice of using large language models (think GPT, Claude, Gemini, Llama, and their growing family of cousins) to improve how marketing teams plan, create, analyze, and execute their work. It's a straightforward concept dressed up in a lot of unnecessary mystique.
At its core, a large language model is a type of AI model trained on massive datasets using neural networks. LLMs rely on these massive datasets to process and generate human-like text, enabling advanced natural language processing and context understanding. LLMs learn from vast datasets, which can sometimes contain biases or stereotypes, so monitoring and refining how LLMs learn is crucial to ensure fair and unbiased outputs. It can understand context, generate language, summarize information, and respond to instructions in natural conversation. When you apply that capability to marketing tasks, you get LLM marketing. The “marketing” part is the important bit, because the model is only as useful as the workflow you embed it in.
It's worth separating this from the automation wave that came before it. Traditional marketing automation, the kind that's powered drip sequences and lead scoring rules for a decade, operates on rigid if-then logic. If a lead downloads a whitepaper, send email three. If they visit the pricing page, increase their score by ten points. It's rule-based, predictable, and entirely dependent on someone building those rules in advance.
LLM-powered systems work differently… they can interpret unstructured data, generate nuanced responses, and adapt to context without someone manually coding every scenario. An LLM doesn't just follow a script; in fact, it can draft the script, evaluate the script, and suggest a better one based on patterns it's learned from millions of examples.
That distinction matters because marketing problems aren't always neat enough to fit into if-then logic. When a prospect visits your website four times, engages with two LinkedIn ads, opens a nurture email, and then goes quiet for three weeks, a traditional automation tool sees a lead score. An LLM can summarize the entire behavioral pattern, suggest what the silence might mean, and draft a re-engagement message tailored to that specific journey.
The catch, and this is where most "AI marketing" conversations go sideways, is that LLMs are strongest when paired with real first-party data. A model generating generic ad copy from a vague prompt is a parlour trick. A model that summarizes your actual pipeline data and identifies which campaigns influenced closed-won revenue last quarter is a competitive advantage. The difference between the two is the quality of the data you feed it and the specificity of the task you give it.
Marketers should care about this now because the tooling has crossed a practical threshold. Two years ago, using LLMs in marketing meant copying text into ChatGPT and hoping for the best. Today, models are being integrated directly into CRM platforms, analytics tools, ad managers, and revenue intelligence systems. The interface is becoming invisible. You don't need to be a prompt engineer. You need to be a marketer who knows what questions to ask.
Why do LLMs matter for modern B2B teams?
B2B marketing has always been complicated, but the complexity has compounded in ways that make the old playbook feel like it was designed for a simpler era. It kind of was.
Consider the typical B2B buying journey… multiple stakeholders, each with different priorities, researching independently across a handful of channels. Your champion might discover you through a LinkedIn ad. Their CFO might read a G2 review. The technical evaluator might visit your docs page three times before anyone fills out a form. The sales cycle stretches across weeks or months, and the data trail is scattered across platforms that weren't built to talk to each other.
Most B2B teams are juggling ad platforms, CRM systems, website analytics, email tools, and event platforms as separate stacks with limited integration. That fragmentation is the root of nearly every operational headache in modern marketing. You can't personalize what you can't see. You can't report on what you can't connect. And you definitely can't move fast when every insight requires manual data stitching across three dashboards.
This is the environment where LLMs start to make a material difference. Not because they're magic, but because they're exceptionally good at the kinds of tasks that eat up marketing hours without producing strategic value.
- Take insights, for example. An LLM connected to your campaign data can summarize performance trends in seconds, surfacing patterns that would take an analyst an hour to compile into a slide. It can spot that your mid-funnel email sequence is underperforming for enterprise accounts while outperforming for mid-market and flag that without anyone asking.
- Personalization is another area where the impact compounds. B2B buyers expect relevant messaging, but personalizing content across accounts, personas, and funnel stages is labor-intensive. LLMs can generate messaging variations tailored to specific ICPs, adjust tone for different buying stages, and draft personalized outreach at a speed that human writers simply can't match on their own. The human still needs to review and refine, but the first draft arrives in minutes instead of days.
- Content velocity is what gets content teams excited, and rightfully so. The gap between "we need more content" and "we have the bandwidth to produce it" is a permanent feature of B2B marketing life. LLMs compress the production cycle for blogs, emails, social posts, ad copy, and sales collateral without requiring you to double headcount.
- Reporting and decision support might be the most underrated benefit. When an LLM can ingest your attribution data, CRM pipeline, and campaign spend, then answer a question like "which channels are contributing to pipeline but not getting enough budget?" you've moved from dashboards you stare at to intelligence you act on.
Here, I want to add that LLMs don't (and cannot) replace humans and strategy. They remove the admin work that blocks strategy from happening. That's a meaningful distinction, because the value isn't in the AI itself. It's in the hours it gives back to people who know how to use those hours well.
How are marketers using LLMs across the funnel?
The most useful way to think about LLM marketing isn't by tool or by team. It's by funnel stage because the problems LLMs solve change depending on where the buyer sits in their journey. A ToFu content challenge looks nothing like a BoFu sales enablement problem, and the LLM applications reflect that.
- Top of funnel: getting seen by the right people
ToFu marketing is fundamentally about reach and relevance. You need the right topics, the right channels, and enough volume to stay visible in a noisy market. LLMs accelerate almost every part of that equation.
- Topic ideation is a natural starting point. Instead of brainstorming in a Google Doc for 45 minutes, you can feed an LLM your ICP descriptions, recent content performance data, and competitor themes, then get back a prioritised list of topic clusters worth exploring. It won’t replace editorial judgement, but it compresses the ideation phase from a half-day exercise to a 20-minute conversation. By analyzing audience behavior and user behavior, LLMs can help inform your content strategy, ensuring topics resonate with your target audience.
- SEO clustering benefits from the same capability. LLMs can group semantically related keywords into clusters, suggest content hierarchies, and identify gaps in your existing coverage. They’re particularly good at spotting the long-tail variations that humans tend to overlook because they don’t show up in the first page of a keyword tool.
- Social posts and ad copy variants are where the speed advantage really shows up. Generating 15 LinkedIn post variations from a single blog post, or 20 headline options for an ad campaign, is the kind of task that used to take a copywriter half a day. An LLM can produce those drafts in minutes, giving you more material to test and iterate on.
- Thought leadership drafting is trickier, because genuine thought leadership requires original thinking, not just fluent writing. But LLMs can serve as a useful first-draft partner. You provide the perspective and the argument. The model structures it, fills in supporting context, and handles the connective tissue that takes time to write from scratch.
- Middle of funnel: nurturing without annoying
MoFu is where most B2B teams struggle with personalization at scale. The leads are in your system, but the content they receive often feels generic. LLMs help close that gap.
- Email nurture personalization is a strong use case. Instead of writing one nurture sequence and sending it to every segment, you can use LLMs to generate variations tailored to different personas, industries, or engagement patterns. LLMs enable personalized messaging and tailor content for specific audience segments by analyzing user behavior and preferences, ensuring each message is relevant and engaging. A VP of Marketing and a Director of Demand Gen might both be in your nurture flow, but they care about different things. The LLM can adjust messaging for each without requiring a separate campaign build.
- Webinar follow-up sequences benefit from the same logic. Rather than sending the same “thanks for attending” email to every registrant, an LLM can draft follow-ups that reference specific webinar topics, tie in related resources, and vary the call to action based on attendee behavior (did they stay for the full session or drop off at minute twelve?).
- Landing page messaging by persona is another area where LLMs compress the work. If you’re running campaigns targeting three distinct ICPs, you ideally want three versions of your landing page copy. That’s a lot of writing. LLMs can generate those variations quickly, letting your team focus on testing and optimization rather than drafting. This streamlines the content creation process and allows for refining messaging for different personas, making your campaigns more effective.
- Lead scoring summaries are a quieter but genuinely useful application. Instead of looking at a numerical score and guessing what it means, an LLM can generate a plain-language summary: “This account has visited the pricing page twice, engaged with three LinkedIn ads, and downloaded the ROI calculator. They appear to be in active evaluation.” That context helps sales prioritize without needing to dig through activity logs.
3. Bottom of funnel: helping deals close
BoFu is where marketing and sales overlap most, and where LLM marketing connects directly to revenue. The applications here are less about content production and more about intelligence and enablement.
- Sales enablement copy is a natural fit. LLMs can draft one-pagers, competitive comparisons, and case study summaries tailored to specific deal contexts. If a prospect is evaluating you against two competitors, an LLM with access to your battlecard library can generate a custom comparison document in minutes. LLM-powered virtual assistants can also handle customer queries and facilitate real-time customer interactions, ensuring prospects receive instant, personalized responses that improve satisfaction and conversion rates.
- Account summaries are one of the highest-value BoFu use cases. Before a sales call, an LLM connected to your CRM and engagement data can compile a brief covering the account’s recent website visits, ad interactions, email engagement, and pipeline stage. That brief turns a generic sales call into an informed conversation and enhances the overall customer experience by enabling more relevant and timely engagement.
- Competitor battlecards benefit from LLM-powered maintenance. Markets shift quickly, and keeping battlecards current is a perpetual headache. LLMs can scan competitor websites, press releases, and review sites, then flag updates that need human revpersonalizationiew.
- Proposal personalisation is where deals get won or lost on detail. An LLM can adjust proposal language based on the prospect’s industry, stated priorities, and previous conversations logged in the CRM. It’s the difference between a template that feels like a template and a proposal that feels like it was written just for them.
- Pipeline risk alerts round out the BoFu picture. An LLM monitoring deal activity can flag when engagement drops, when a key stakeholder goes quiet, or when a deal has been sitting in the same stage too long. These aren’t insights that require genius. They require attention, and LLMs are very good at paying attention to everything simultaneously.
LLM marketing use cases for content creation teams
Content teams live in a permanent tension between quality and volume. You know the feeling. The editorial calendar is full, the request queue is overflowing, and the team is already stretched across blogs, emails, social posts, webinars, and that one sales deck someone needed yesterday. AI content creation for B2B doesn't eliminate that tension, but it changes the economics of it dramatically.
- Blog production at a different speed
Blog production is where most content teams first experiment with LLMs, and for good reason. The workflow has obvious bottlenecks that AI can compress.
- Keyword research
LLMs can take a seed topic, suggest semantically related terms, estimate search intent, and group keywords into content clusters. They won't replace a dedicated SEO tool for volume and difficulty data, but they're excellent for the qualitative layer: understanding what searchers actually want to know and how to structure content around those questions.
- Outline generation
A strong outline is the difference between a blog that flows and one that wanders. LLMs can generate detailed outlines with suggested H2s, H3s, key points per section, and internal linking opportunities. The content strategist still needs to review and refine, but the starting point is dramatically better than a blank page.
- First drafts
An LLM-generated first draft isn't a finished blog. It's raw material that needs human shaping, fact-checking, voice adjustment, and strategic editing. But it cuts the drafting phase from hours to minutes, which means your writers spend their time on the high-value work: making the piece original, credible, and genuinely useful.
- Refreshing stale content
Most B2B blogs have dozens of posts that are 18 months old and slowly losing rankings. An LLM can identify outdated stats, suggest updated angles, and draft revised sections, turning a content refresh from a multi-hour project into a focused editing session.
- Repurposing blogs into newsletters, social posts, video scripts, and email snippets
You've already done the hard thinking for the original blog. The model just restructures that thinking for different formats and channels. One blog can become five LinkedIn posts, a newsletter section, and an email teaser, all in minutes.
- SEO support beyond keywords
- Featured snippet optimization
LLMs can analyze the format and structure of existing featured snippets for a target query, then draft content specifically shaped to win that position. It's a small tactical advantage, but those add up.
- FAQ generation
For any given topic, an LLM can produce a comprehensive list of related questions that real searchers ask. These become FAQ sections, People Also Ask targets, or standalone blog topics.
- Semantic keyword coverage
They're trained on enormous text corpora, which means they naturally understand the semantic relationships between terms. When you use an LLM to expand or refine your content, it tends to include related terms organically, improving topical depth without anyone manually checking a keyword density tool.
- Internal linking
These suggestions can be generated by feeding an LLM a list of your existing blog URLs and their target keywords
It can then suggest relevant internal links for any new piece, improving site structure and SEO without requiring someone to manually search through your blog archive every time.
- Editorial operations get smoother
- Style guide enforcement
This is a persistent challenge for content teams, especially those working with freelancers or multiple writers. An LLM trained on your style guide can review drafts for tone, terminology, formatting, and brand voice inconsistencies. It won't catch everything, but it catches the obvious stuff before a human editor needs to.
- Tone consistency across a content library
LLMs can flag sections that drift from your established voice, suggest adjustments, and help maintain a consistent reading experience across dozens or hundreds of pieces.
- Brief generation for writers
Instead of a content strategist spending 30 minutes writing a detailed brief for each blog post, an LLM can generate a first-draft brief based on the target keyword, competitive analysis, and your content strategy. The strategist reviews and adjusts, but the grunt work is handled.
Through all of this, human editing remains critical for originality, credibility, and differentiation. An LLM can produce fluent, well-structured content. What it can't do is develop a genuinely original point of view, validate claims against primary sources, or make the strategic editorial choices that separate useful content from forgettable content. The teams getting the best results use LLMs to handle the production mechanics while reserving human attention for the parts that actually create competitive advantage.
LLM marketing use cases for paid media teams
Paid media in B2B, particularly on LinkedIn, operates in an environment where CPCs are high, budgets are finite, and the margin between a good campaign and a wasted one is thinner than most teams admit. AI campaign optimisation doesn't make bad strategy good, but it makes good strategy significantly faster to execute and easier to refine.
- Campaign planning that moves faster
Audience ideas are a natural starting point. LLMs can take your ICP definitions and generate specific targeting suggestions: job titles to include, seniority levels to test, industry verticals worth expanding into, and company size ranges that might be underexplored. It's the kind of brainstorming that usually happens in a whiteboard session, compressed into a five-minute prompt.
Message testing also benefits from volume. The challenge with B2B ad copy isn't usually writing one decent version. It's writing enough variations to actually test what resonates. LLMs can produce 20 or 30 headline and body copy combinations from a single creative brief, giving your team a much larger testing pool without requiring proportional writing time.
Creative angles by ICP are where this gets genuinely useful. If you're targeting both VP-level buyers and practitioner-level users, the messaging needs to be different. The VP cares about business outcomes and strategic fit. The practitioner cares about workflow, integrations, and whether the tool will actually make their Tuesday easier. An LLM can generate distinct ad sets for each persona, ensuring your creative speaks to the right concerns.
- Optimisation with an analytical edgeOptimisation with an analytical edge
Summarizing underperforming campaigns is a task that usually involves someone pulling data into a spreadsheet, staring at it, and writing a summary for the team's Slack channel. An LLM connected to your ad platform data can automatically generate that summary, highlighting which campaigns are below benchmark, what's dragging them down, and where the budget might be better allocated.
I’d say detecting wastes spend is also related but more specific. LLMs can identify patterns that humans miss because they involve cross-referencing multiple dimensions at once. Maybe a campaign targeting the EMEA region is spending heavily on a specific industry vertical, which is generating clicks but not pipeline. An analyst might catch that eventually, but an LLM flags it on a fresh Monday morning.
Based on performance patterns, an LLM can suggest specific experiments and tests: "Try increasing bid on the mid-market segment, which is showing higher CTR but limited spend," or "Test a pain-point-focused headline variant for the enterprise audience, where the current benefit-focused copy is underperforming." These suggestions aren't guaranteed to work, but they give the team a running start on experiment design.
Weekly reporting summaries are perhaps the most time-saving application. Instead of a demand gen manager spending two hours compiling a weekly performance report, an LLM can generate a draft summary from the raw data. The manager reviews, adds context, and sends it out. That's 90 minutes reclaimed every week, which adds up to nearly 80 hours over a year.
- The LinkedIn and B2B angle
Most marketers would agree that while LinkedIn works magically well for B2B, advertising on the platform can feel more… premium. Now, to operate efficiently in that environment, smarter targeting and messaging aren't really nice-to-haves; they're the difference between a campaign that generates pipeline and one that burns budget on vanity metrics.
LLMs help here by enabling faster testing cycles. When you can generate 30 ad variants in minutes instead of days, you can test more aggressively, learn faster, and allocate spend toward what's actually performing. The feedback loop tightens from weekly to almost daily.
Here's a concrete example: an LLM can review 50 ad variants and identify recurring hooks tied to higher CTR. Maybe you discover that ads mentioning "pipeline visibility" consistently outperform ads mentioning "marketing analytics." That insight would take a human analyst hours of tagging and cross-referencing. The model surfaces it in seconds, giving your creative team a data-backed direction for the next round of copy.
LLM marketing use cases for sales and ABM teams
Account-based marketing is based on a simple idea: if you know exactly who you’re selling to, you can reach them more precisely. The problem is that “knowing” an account requires synthesizing data from multiple sources, and most teams don’t have the bandwidth to do that well for more than a handful of priority accounts. LLMs help businesses connect with their audiences more effectively by enabling deeper personalization and more meaningful engagement.
This is where LLM use cases for marketers start to overlap with sales enablement in a genuinely useful way. By analyzing customer feedback from reviews and social media, LLMs can uncover audience preferences and inform product suggestions—personalized recommendations generated by recommendation engines and collaborative filtering algorithms. These insights enhance ABM strategies, allowing teams to tailor outreach and content to each account’s specific needs and interests.
When ABM meets LLM marketing
Summarizing target accounts from CRM data, website visits, and ad engagement is one of the highest-leverage applications of LLMs in B2B. Instead of an SDR spending 15 minutes researching an account before an outreach attempt, an LLM connected to your data stack can generate a comprehensive account brief in seconds. That brief might include recent website pages visited, which ads the account engaged with, what content they downloaded, their current CRM stage, and any relevant firmographic details. Importantly, LLMs can also segment and tailor these summaries to specific audience segments, ensuring that outreach aligns with distinct group characteristics and audience preferences identified through behavioral data.
Drafting personalized outreach based on account behavior follows naturally. Once you have that account summary, the LLM can generate outreach messages that reference specific actions the account has taken. Not in a creepy “we saw you on our pricing page” way, but in a way that demonstrates genuine relevance: “I noticed your team has been exploring our integration capabilities. Here’s a quick overview of how we connect with [their CRM].”
Detecting buying committee activity is a subtler but powerful application. B2B purchases involve multiple stakeholders, and LLMs can spot when several people from the same account are engaging with your content simultaneously. If the VP of Marketing visited your blog, the Director of Ops downloaded a case study, and someone from IT checked your security page, that pattern suggests a buying committee is forming. An LLM can flag that pattern and alert the right people on your team.
Prioritizing warm accounts is a direct extension of this capability. Instead of relying solely on lead scores or gut feel, an LLM can rank accounts based on a holistic view of their engagement signals, recency, and buying stage indicators. It provides a plain-language explanation for why each account is ranked where it is, which makes the prioritization transparent rather than opaque.
Turning intent signals into actions is the critical last step. Intent data is only valuable if someone acts on it, and that action needs to be fast. An LLM can take an intent signal (multiple pricing page visits, ad clicks, content downloads) and immediately generate a recommended next step: a personalized email draft, a suggested call script, or an alert to the account owner with a summary of what’s happening.
Here’s a scenario that makes the value concrete. An account visits your pricing page twice in a week, clicks on two LinkedIn ads, and opens a nurture email. Traditionally, that pattern might increase a lead score, and someone would eventually notice. With an LLM connected to that data, the system can instantly summarize the likely buying stage, draft a tailored outreach message, and push it to the account owner’s queue. The time between signal and action shrinks from days to minutes.
The impact of B2B AI marketing tools in the ABM context isn’t about replacing the human relationships that close deals. It’s about making sure the humans in the loop have the right information at the right time, without needing to dig through four different platforms to find it.
Real artificial intelligence in marketing examples
Theory is useful, but let’s talk about what this looks like in real life. These are real artificial intelligence in marketing examples already happening inside modern B2B teams, not speculative futures.
Example 1: the content team that turns one webinar into five assets
A B2B SaaS company runs a 45-minute webinar on account-based marketing trends. Traditionally, the content team watches the recording, takes notes, and spends the next two weeks turning those notes into a blog post, some social clips, and maybe a follow-up email. With an LLM workflow, the team feeds the webinar transcript into their model and gets back a structured blog draft, three variations of LinkedIn posts, a five-email nurture sequence, and a set of ad copy snippets, all within an hour.
The human editors still spend a day refining, fact-checking, and aligning everything to the brand voice. But the total production cycle drops from two weeks to three days, and the content is more cohesive because it all originates from the same source material. The team isn’t working harder. They’re just starting further ahead.
Example 2: the demand gen team that finds the real pipeline drivers
Imagine this: a demand generation team at a mid-market SaaS company reports on campaign performance the traditional way: impressions, clicks, CTR, and cost-per-lead. The dashboards look fine, but pipeline doesn’t grow in proportion to ad spend. Something feels off, and the standard metrics aren’t explaining it.
Then the team connects an LLM to attribution data and asks a simple question: Which campaigns are driving demo requests, not just clicks? The model’s analysis reveals that two campaigns with relatively modest click volumes are generating a disproportionate share of demo requests and qualified pipeline. Meanwhile, the highest-spend campaign is driving lots of traffic that isn’t converting past the initial form fill.
That insight leads to a budget reallocation that improves pipeline contribution by shifting spend toward the campaigns influencing real buying behavior. The LLM doesn’t do anything an analyst couldn’t do. It just does it faster and asks the right question in a way a dashboard can’t.
Example 3: the sales team with better pre-call prep
An enterprise sales team spends 15 to 20 minutes per account researching before calls. Multiply that by ten calls a day, and you’ve got a serious productivity drain. They implement an LLM-powered account brief generator that integrates with their CRM, website analytics, and ad engagement data.
Before each call, the AE receives a one-page brief: recent website activity, content downloads, ad interactions, relevant firmographic details, and a suggested talking point based on the account’s apparent interests. Prep time drops from 15 minutes to two minutes of reviewing the brief. More importantly, the conversations improve because reps walk in with relevant context instead of generic discovery questions.
Example 4: the website team that stops losing hot leads
A B2B website generates decent traffic but hemorrhages qualified visitors who never fill out a form. The team deploys an AI chatbot powered by an LLM that can engage visitors in natural conversation, answer product questions using the company’s knowledge base, and qualify visitors based on their responses.
The chatbot identifies visitors who are in active evaluation, asking about pricing, integrations, or specific use cases, and routes them directly to sales with a summary of the conversation. Within two months, the team sees a measurable increase in qualified conversations from website visitors who would have otherwise bounced without a trace.
The LLM isn’t replacing the sales team. It’s making sure the sales team sees the right visitors at the right moment.
These AI in marketing examples share a common thread: the LLM isn’t doing the strategic thinking. It’s handling the operational overhead that prevents humans from doing the strategic thinking fast enough.
How Factors.ai uses LLM thinking for revenue teams
One of the persistent challenges with applying LLMs to marketing is that most models operate in isolation from your actual business data. You can ask ChatGPT to draft an ad copy, but you can't ask it which of your LinkedIn campaigns influenced pipeline last quarter, because it doesn't have access to that data.
This is the gap that platforms like Factors.ai are designed to address. Not by being an LLM themselves, but by creating the data infrastructure that makes LLM-powered workflows genuinely useful for revenue teams.
Factors.ai centralizes the data streams that B2B marketing and sales teams need to make intelligent decisions. That includes ad signals from platforms like LinkedIn, Google, and Facebook. It includes website behavior, capturing which accounts are visiting which pages and how often. It connects to CRM stages, so you can see where accounts sit in the pipeline. It tracks account journeys across touchpoints. And it provides attribution models that connect marketing activity to revenue outcomes.
When you layer LLM capabilities on top of that kind of unified data, the questions you can ask become dramatically more useful. Optimizing for AI-driven search is increasingly important as search engines evolve from traditional keyword-based approaches to AI-powered semantic analysis, prioritizing credibility and high-quality sources. Instead of “Write me a blog post about ABM,” you’re asking “which accounts showed buying intent this week based on their cross-channel behavior?” Instead of generating generic copy, you’re generating insights rooted in your actual pipeline data. Ensuring your brand appears in authoritative sources and AI-generated search results is now critical for both human and AI-driven visibility. To maintain a competitive edge, it’s essential to monitor emerging trends in LLM technology and search, adapting your strategy as the landscape shifts.
Here are a few examples of what that looks like in practice:
- Ask which campaigns influenced pipeline last quarter. Instead of building a custom report across three platforms, you ask a natural-language question and get a summary with specific campaigns, pipeline values, and conversion paths.
- Find accounts showing buying intent. The platform identifies accounts exhibiting high-intent behavior (multiple site visits, ad engagement, content downloads) and surfaces them with context about what they've been doing.
- Summarize journey gaps. An LLM connected to Factors.ai's data can identify where accounts are dropping out of the funnel and suggest where additional touchpoints might re-engage them.
- Recommend audience expansion. Based on the firmographic and behavioural profiles of accounts that have converted, the system can suggest lookalike characteristics for campaign targeting.
The core insight here is about a principle that applies to any LLM marketing workflow: models become exponentially more valuable when they're connected to clean, unified revenue data. A model with access to your attribution data, CRM stages, and cross-channel engagement can do things that a standalone chatbot never will.
For revenue teams operating in complex B2B environments with long sales cycles and multiple stakeholders, that connection between LLM capability and real data is where the meaningful competitive advantage lives.
Risks, limits, and governance while using LLMs to create campaigns and content
If the previous sections made LLM marketing sound like an unqualified good, this one is the necessary counterweight. Every marketing leader evaluating these tools should understand the failure modes, because they’re real and they’re not always obvious.
The risks you need to plan for
- Hallucinations are the most well-known issue, and they remain a serious concern. LLMs can generate confident, well-structured text that is factually wrong. They don't "know" things in the way humans do. They predict likely word sequences based on their training data, and sometimes those predictions produce plausible-sounding nonsense. In a marketing context, that could mean publishing a blog with an incorrect statistic, sending a prospect email that references a feature your product doesn't have, or generating a competitive comparison with inaccurate claims about a competitor.
- Generic copy is a subtler risk. Because LLMs are trained on vast amounts of existing content, they naturally gravitate toward the average. The phrasing is smooth, the structure is competent, and the result is indistinguishable from every other piece of AI-generated content on the internet. If your content strategy depends on differentiation (and it should), unedited LLM output will actively work against that goal.
- Brand inconsistency shows up when different team members use LLMs independently without shared guidelines. Your demand gen team's AI-drafted ad copy might use a different tone than your content team's AI-drafted blog, which might conflict with the messaging your sales team's AI-drafted outreach is using. Without coordination, LLMs can fragment your brand voice faster than they unify it.
- Compliance issues are particularly relevant for companies in regulated industries or those operating across multiple jurisdictions. LLMs don't inherently understand data privacy regulations, advertising standards, or industry-specific disclosure requirements. They'll generate content that sounds great and could expose your company to legal risk if no one catches it.
- Privacy concerns arise when teams feed proprietary data, customer information, or competitive intelligence into third-party LLM tools without understanding where that data goes. Some models use input data for further training, which means your confidential information could theoretically surface in other users' outputs.
- Over-automation is the risk that doesn't look like a risk until it's already caused damage. When teams automate too many workflows without adequate human oversight, output quality gradually degrades. Nobody notices because each individual piece looks "fine." But over time, the content becomes homogeneous, the insights become shallow, and the brand starts to feel like it's run by a committee of algorithms.
The best-practice stack that mitigates these risks
Addressing these risks doesn't require avoiding LLMs. It requires building a governance layer around them. The most effective teams treat this like an editorial and operational framework, not a technology problem.
- Human review of every external output. Nothing goes to a customer, prospect, or public channel without a human reviewing it. This is the most basic and most important safeguard. The review should check facts, tone, brand alignment, and compliance.
- Brand prompts and style guidelines. Create standardized prompts that include your brand voice, terminology rules, and messaging frameworks. When everyone uses the same foundation, the outputs are more consistent. Update these prompts quarterly as your positioning evolves.
- Approved data sources. Define which data sources are approved for LLM inputs. CRM data, anonymized analytics, and public marketing materials are typically fine. Customer emails, internal strategy documents, and competitive intelligence gathered under confidential terms are usually not shared. Make these boundaries explicit so teams aren’t improvising with sensitive data.
- Role-based access controls. Not everyone needs access to every workflow. A content marketer may need blog drafting tools, while RevOps may need pipeline summarisation. Limit access based on function and data sensitivity.
- Prompt libraries and version control. If certain prompts consistently generate strong results, document them. If a prompt causes poor or risky output, retire it. Treat prompts like operating assets, not random experiments buried in someone’s notes app.
- Measurement beyond productivity. Saving time matters, but it cannot be the only KPI. Track quality signals too: conversion rates, reply rates, pipeline influence, content engagement, error rates, and brand consistency. Fast bad work is still bad work.
- Regular audits. Every quarter, review how LLMs are being used across the organization. Which workflows are genuinely helping? Which are producing average output? Which need tighter controls? AI sprawl is real, and governance keeps it useful.
ALL of that said, the human layer still matters most.
I know… there’s a temptation to think governance slows innovation. But if you think of it… it actually enables it. Teams move faster when they know what’s safe, what’s useful, and what standards they’re held to.
The companies that win with LLM marketing won’t be the ones that automate the most. They’ll be the ones that combine speed with taste, judgment, and discipline.
How to start using LLM marketing (without creating chaos)
You don’t need an “AI transformation roadmap” and a 74-slide deck to begin. You need one painful process that wastes time and one clear outcome you’d like to improve. Before leveraging LLMs in your marketing workflows, it’s crucial to define your marketing goals and identify pain points, those specific challenges or inefficiencies that hinder your progress. This ensures your efforts are aligned with measurable objectives and that LLM integration addresses real needs.
Pick a workflow like:
- Weekly campaign reporting that takes too long
- Blog production bottlenecks
- SDR research before outbound outreach
- Lead follow-up that feels generic
- Account prioritization based on scattered signals
Then apply a simple framework:
- Define the current pain
How many hours does it take? Where are delays happening? What quality issues exist today? - Add the LLM to one narrow step
Maybe it drafts the weekly report summary. Maybe it creates first-pass outlines. Maybe it summarizes account activity before calls. - Keep a human owner
Someone remains accountable for quality, approvals, and outcomes. Always. - Measure the result
Did time reduce? Did output improve? Did response rates increase? Did better decisions happen faster? - Expand carefully
Once one workflow works, move to the next adjacent one.
This is slightly important because many teams do the exact opposite. They buy tools first, announce an AI initiative second, and search for use cases third. That route usually leads to unused software, with everyone pretending it was a strategic decision.
The better route is boring, practical, and effective.
Here’s what smart B2B teams will look like next
The future marketing team probably won’t be smaller… but sharper for sure.
Using AI tools and LLMs is essential for marketing teams to stay relevant and stay competitive in a rapidly evolving marketing landscape. These technologies help teams adapt quickly, automate routine tasks, and maintain an edge over competitors.
LLMs will increasingly become the operating layer between raw data and human action.
But humans still decide:
- What the brand stands for
- Which bets are worth making
- What great creative feels like
- Which customers deserve focus
- What trade-offs make sense
That part isn’t going anywhere.
In a nutshell…
LLM marketing is not about replacing marketers with chatbots who use words like “synergy” unironically.
It’s about removing repetitive work, speeding up analysis, improving execution, and helping good teams operate like stronger versions of themselves.
Used badly, it creates generic content, risky decisions, and a brand voice that sounds like beige wallpaper.
Used well, it gives your team leverage.
And in B2B, where buying journeys are messy, data is fragmented, and time is always short, leverage is a very valuable thing.
FAQs for LLM marketing
Q1. What is LLM marketing?
LLM marketing is the use of large language models like GPT, Claude, or Gemini to improve marketing workflows such as content creation, reporting, targeting, campaign optimisation, and sales enablement.
Q2. How are LLMs different from traditional marketing automation?
Traditional automation follows fixed rules. LLMs can interpret context, summarise unstructured information, generate language, and respond more flexibly to complex scenarios.
Q3. Can LLMs replace marketers?
No. They can automate repetitive tasks and speed up workflows, but strategy, judgment, creativity, positioning, and relationship-building still require humans.
Q4. What are the best LLM use cases for B2B teams?
Strong use cases include campaign summaries, attribution insights, content drafting, nurture personalisation, account research, proposal customisation, and identifying buying intent.
Q5. Are there risks in using LLMs for marketing?
Yes. Common risks include hallucinated facts, generic copy, privacy issues, compliance mistakes, and over-automation without human review.
Q6. How should a team start with LLM marketing?
Start with one narrow workflow that wastes time today, assign a human owner, measure outcomes, and expand only after proving value.

Is AI Content Good for SEO?
Is AI content good for SEO? Learn what Google says, what ranks, risks to avoid, and how B2B marketers can use AI content strategically.
TL;DR
- AI content can absolutely rank on Google, but only when it's useful, accurate, intent-matched, and edited by a human who actually knows the subject.
- Google doesn't penalise content for being AI-generated. It penalises content for being unhelpful, thin, or spammy, regardless of who or what wrote it.
- The biggest risks of AI content aren't penalties. They're factual errors, sameness, zero expertise signals, and brand damage that erodes buyer trust over time.
- B2B marketers should use AI for speed (briefs, drafts, outlines, refreshes) and humans for trust (POV, customer stories, original insights, conversion copy).
- The competitive moat is not writing faster, it's combining AI velocity with proprietary insight that competitors can't replicate.
Everyone's got an opinion on AI content right now. Half the marketing LinkedIn is screaming "AI will destroy SEO." The other half is publishing 40 blogs a month with ChatGPT and calling it a content strategy.
The truth, as usual, lives somewhere in the middle and it's a lot more boring than either camp wants you to believe.
So let's answer the actual question: is AI content good for SEO? And more specifically, can B2B marketers use it without torching their search rankings or their brand credibility?
Is AI content good for SEO?
Yes, when it's genuinely useful, accurate, and written for the reader first. No, when it's generic, hollow, and published at scale to game rankings.
Google doesn't care if a human or an AI wrote your blog… but it cares whether the blog is helpful. That's been the line since the helpful content updates started rolling out, and it hasn't changed.
AI helps you publish faster. Humans help you rank longer.
That's the honest framing. If your AI content is thin, repetitive, and indistinguishable from every other blog on the SERP, it's going to underperform, no matter how optimized the metadata is. If it's well-researched, expert-edited, and actually answers what someone searched for, it has a real shot.
What does Google actually say about AI content?
Google doesn't automatically penalize AI-written content. It penalizes what it calls "spammy scaled content," which is content produced primarily to manipulate rankings rather than serve readers.
The Google AI content policy has been pretty consistent on this. What gets flagged is low-quality, mass-produced content without original value, not content that happened to use AI in the drafting process. There's a meaningful difference between those two things.
What Google does prioritize is E-E-A-T: experience, expertise, authoritativeness, and trustworthiness. This matters a lot for B2B SaaS categories, and especially for anything touching finance, healthcare, or technical decision-making. If you're selling attribution software, ABM tools, or RevOps solutions, your buyers are sophisticated. They'll recognize a surface-level blog the moment they land on it, and so will Google.
The way to think about it: Google's systems are trying to surface what a knowledgeable expert would actually say, not just what fits the keyword. AI-generated content seo that lacks any real insight or original perspective doesn't pass that bar, regardless of its word count.
Why does some AI content rank and others crash?
Here's where it gets interesting, because both things are genuinely true. Some AI content ranks well. Some AI content tanks after an initial crawl bump. The difference isn't the tool, it's the editorial layer.
Why does AI content rank?
When AI content performs well, it usually has a few things going for it: strong search intent match, clean formatting, solid internal linking, and a human editor who added actual depth. It also helps when the content is refreshing a stale page that already had some authority, since AI makes that kind of update fast and efficient.
Publishing velocity matters in competitive content markets. Teams that can produce three well-edited pieces a week will outpace teams producing one meticulously handcrafted piece, assuming quality stays above a reasonable threshold.
Why does AI content drop later, then?
The failure mode is more common than the success story, honestly. What typically happens is early visibility followed by a quiet ranking collapse, usually a few months in.
The culprit is almost always thin information gain, which basically means the content doesn't add anything new to what's already ranking. Every AI tool is pulling from the same training data, so every AI blog on a popular topic ends up covering the same five points in the same order. Buyers and search algorithms can both sense when they're reading something that exists only to check a keyword box.
No firsthand experience, original data, product-specific insights, and no real POV… just a well-structured recycling of what's already out there. That content doesn't build brand trust, and over time, it doesn't build rankings either.
The biggest risks of using AI for SEO
These aren't hypothetical risks. They show up regularly for teams that use AI content without guardrails.
- Factual errors
AI models hallucinate. That's not a flaw that's going away soon; it's structural. They'll invent stats, attribute quotes to the wrong person, cite studies that don't exist, and state outdated numbers with complete confidence. For a B2B brand where your content is part of your credibility, one wrong benchmark or misattributed claim can do real damage.
Every stat in an AI-drafted blog needs a human to verify the source. Every time, not most of the time.
- The sameness problem
Every team using the same AI tools on the same topics ends up producing near-identical content. If you search "what is account-based marketing" right now, you'll find roughly forty blogs that cover the same five points, use the same examples, and arrive at the same conclusions. That's not a content strategy. That's content wallpaper.
- Zero expertise signals
AI can summarize what's already known. It can't tell your reader what your customers are actually struggling with, what you've learned from running campaigns, or what a pattern in your own data shows. That firsthand experience is the whole point of E-E-A-T, and AI can't fake it convincingly.
- Brand damage
If your content reads like it was produced by a tool on autopilot, buyers notice. They make inferences about your company from your content quality. Robotic blogs suggest a robotic product team, and that's a hard perception to recover from in a considered B2B buying cycle.
- AI Overviews squeeze clicks
Even when your page ranks, Google's AI Overviews are answering more and more queries directly in the SERP. That means ranking on page one no longer guarantees the same traffic it did two years ago. Content that exists only to answer a basic question is most at risk of being absorbed into an Overview and never clicked on.
How B2B marketers should use AI content strategically
The best use of AI in a B2B content workflow isn't "write the whole blog." It's everything that wraps around the writing.
AI genuinely accelerates: SEO brief creation, content gap analysis, SERP summarization, updating stale pages, drafting comparison or FAQ pages, pulling schema suggestions, and repurposing webinar transcripts into structured posts. These are time-intensive tasks where AI saves hours without sacrificing quality, because a human is still driving the strategy and reviewing the output.
Where AI shouldn't be left alone: customer pain-point content, founder POV articles, original research, case studies, and any conversion-focused page. These need human voice, human judgment, and ideally real stories from inside the company.
The smart motion for a b2b seo content strategy is using AI to scale top-of-funnel educational content, then layering in product data, customer insights, and expert commentary for middle and bottom funnel. That's where your competitors can't clone you, because the inputs aren't publicly available.
A better workflow: AI plus human expertise
The teams getting real mileage from AI content aren't the ones publishing the most. They're the ones who figured out where AI fits in their process without replacing the things that actually drive results.
A workflow that holds up looks something like this: AI builds the keyword brief and first structure, a subject matter expert adds their POV and real examples, an editor sharpens the voice and cuts what's weak, the SEO lead checks intent match and internal links, and then you publish, track, and refresh quarterly.
That's not faster than just prompting ChatGPT and publishing. It's slower. But it produces content that ranks six months from now, not just for a week after indexing.
The winning stack is not really AI versus humans… it's AI for speed, humans for trust, and a clear-eyed process that keeps both honest.
How Factors.ai teams can use AI for pipeline SEO
For a brand like Factors.ai, the content surface that drives pipeline is pretty specific. LinkedIn Ads benchmarks, ABM measurement guides, attribution model explainers, intent data use cases, RevOps playbooks, and competitor comparisons are the kinds of pieces that attract the right readers and build the right authority.
AI can generate solid first drafts of all of these faster than any human writer. The differentiation comes from what gets added: customer win data, campaign benchmarks from actual accounts, first-party insights from the product, screenshots, analyst commentary. That's the layer competitors can't replicate, because it doesn't exist anywhere in an AI's training set.
The content becomes a moat not because it was written faster, but because it contains things only Factors.ai could know. That's what turns a decent blog into a bookmark.
AI content checklist before you publish
Run through this before hitting publish on anything that’s AI-assisted.
- Does this add something new to the conversation, or does it just repeat what's already ranking?
- Is every stat sourced and verified by a human?
- Is search intent fully answered, not just touched on?
- Would a real expert put their name on this without editing it first?
- Does it sound like our brand, or like a generic content template?
- Do all internal links point somewhere relevant?
- Is the CTA relevant to where the reader is in their journey?
- Is it genuinely better than the five pages currently ranking for this keyword?
If you hit a "no" on any of these, the post is not ready.
Final verdict: Is AI content good for SEO?
AI content is good for SEO the way a treadmill is good for fitness. The tool itself isn't the question. The question is whether someone's actually using it properly.
Flood the internet with average content produced on autopilot and rankings will fade, usually after a few months of false confidence. Use AI to accelerate expert-led publishing, with real inputs and real editorial standards, and it becomes a genuine growth advantage.
For B2B SaaS brands, the moat was never about writing faster. It was always about combining speed with proprietary insight. AI gives you the speed. Your team, your customers, and your data give you the insight. Those two things together are what actually compound.
FAQs for is AI content good for SEO
Q1. Does Google penalize AI content?
No, Google doesn't penalize content because AI helped create it. What it penalizes is low-quality or spammy content made primarily to manipulate rankings. If your AI content is genuinely useful and well-edited, it's treated the same as anything else.
Q2. Can AI content rank on Google?
Yes, and it does, regularly. The content that ranks tends to be well-edited, intent-matched, and enriched with something beyond what the AI could produce on its own. Pure unedited AI output can rank short term, but it rarely holds.
Q3. Is AI content bad for SEO long term?
Only if it's generic and adds no original value. Thin content that covers the same ground as every other page on the topic tends to drop over time. Content that combines AI drafting with genuine expertise and first-party insight tends to hold and compound.
Q4. Should B2B SaaS companies use AI writers?
Yes, but as assistants, not authors. AI is excellent for research acceleration, first drafts, content refreshes, and workflow scaling. Strategy, nuance, POV, and trust still need humans in the loop.
Q5. Can AI replace SEO writers?
Not fully. A strong SEO content workflow needs human judgment at multiple points: strategy, voice, insight sourcing, editorial quality control, and intent matching. AI can reduce the time each of those takes, but it can't replace them without the quality showing.
Q6. What's the biggest risk of AI content for B2B brands?
Sameness. When every team uses the same tools on the same topics, the output converges. Your differentiation in B2B content comes from proprietary perspective, customer stories, and category-specific expertise. That's what AI can't generate on its own.
Q7. What is the biggest risk of using AI for B2B content?
Brand Erosion. B2B buyers in 2026 are highly sensitive to "robotic" content. If your blog sounds like every other site, buyers infer that your product and customer support are equally generic. Additionally, factual hallucinations remain a structural risk; publishing a single unverified benchmark or false legal/technical claim can permanently damage your brand’s authority with sophisticated decision-makers.
Q8. What is GEO, and why does it matter for my AI content?
GEO (Generative Engine Optimization) is the 2026 evolution of SEO. It’s the practice of optimizing content so that AI answer engines (like Google AI Overviews and ChatGPT) cite your brand as the primary source in their responses.
- Traditional SEO optimizes for clicks.
- GEO optimizes for citations. To win at GEO, your AI content must be structured with clear facts, bullet points, and tables that are easy for machines to "scrape" and credit.

Generative AI SEO: How marketers are using AI to supercharge rankings
Learn how B2B marketers use generative AI SEO for rankings, content scale, and pipeline growth with practical strategies from Factors.ai.
TL;DR
- Generative AI SEO isn't about replacing your team. It's about giving strategists machine-speed execution across research, drafting, optimisation, and content refreshes.
- Google doesn't penalize AI content, but it does penalize unhelpful content. Human editing, original expertise, and real data still determine what ranks.
- B2B marketers who treat SEO as brand discovery infrastructure, not just a traffic channel, build category mindshare long before a buyer books a demo.
- The smartest teams use AI for speed and humans for insight, then measure success by pipeline influence rather than page views.
- Generative Engine Optimization (GEO) is the next frontier: structuring content so AI answer engines cite your brand, not just so Google ranks your page.
There's a version of SEO most B2B marketers remember from 2018. You'd pick a keyword, stuff it into a blog post a few times, build some backlinks, and call it a quarter. It worked. Slowly. Expensively. And with a lot of spreadsheet chaos.
That version of SEO is gone.
What's replaced it is faster, smarter, and honestly a bit more fun if you like strategy. Generative AI SEO doesn't mean you hand everything to ChatGPT and go on a long lunch. It means you've got a strategist and a machine working in tandem, where the machine handles the grunt work and you handle the judgment calls.
This post breaks down how B2B marketing teams are actually using generative AI SEO in 2026 and what separates the teams getting results from the ones just publishing more content into the void.
What is generative AI SEO?
Generative AI SEO is the use of AI tools to support the research, planning, writing, and optimization work that makes up an SEO workflow. Think keyword clustering, content briefing, first drafts, meta descriptions, schema markup, internal link suggestions, and quarterly content refreshes.
What it doesn't do is replace the part where someone has to think. AI can surface patterns in search data faster than any human. It can't tell you why your ICP is searching for something, what their buying anxiety sounds like, or how to position your product against a competitor in a way that actually converts.
Traditional SEO was manual and slow. Every cluster, every brief, every rewrite took hours. Generative AI SEO compresses that timeline without compromising quality, if you're using it right. The analogy I keep coming back to: it's the difference between navigating by landmarks and navigating by GPS. GPS doesn't decide where you're going. It just gets you there faster.
PS: This blog is written so that you are not this person.
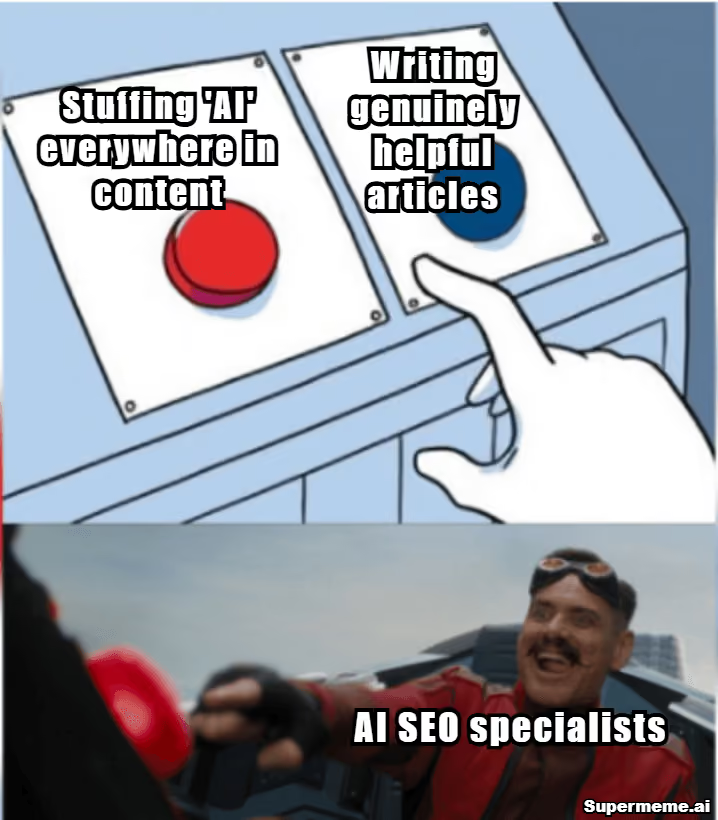
Why is AI reshaping SEO for B2B marketers?
B2B buyers don't convert from one blog post. They read your LinkedIn Ads guide in January, find your ABM attribution breakdown in March, and request a demo in May after seeing your tool show up three times in comparison searches. That's a real pattern, and it's why content volume and coverage actually matter.
The old SEO race was speed, but the new race is relevance at scale.
AI makes it possible to cover every stage of the funnel with genuinely useful content, without needing a 10-person content team. You can use it to uncover intent-rich long-tail searches you'd never manually find. You can cut time-to-publish on a 2,000-word guide from two weeks to four days. You can refresh underperforming pages in an afternoon instead of adding them to a never-ending backlog.
For B2B specifically, this changes what's possible. Teams running demand gen campaigns need comparison content, use-case pages, and attribution explainers. AI helps you build those assets faster. It doesn't make the strategic calls about which ones matter most, but it removes the bottleneck between having a strategy and executing it.
Where marketers use AI across the SEO workflow
- Keyword research
AI tools are genuinely excellent at topic clustering, search intent grouping, and question mining. Feed it a seed keyword and a competitor list and you'll surface SERP gaps you'd miss doing this manually. The part still worth doing yourself: deciding which clusters actually align with your pipeline.
- Content briefing
AI can synthesize what the top-ranking pages cover, suggest H2 structures, and pull FAQs from search data. A brief that used to take three hours now takes 45 minutes. The nuance it can't add is your brand's POV, your data, your customer stories.
- Drafting and refreshing
First drafts, refresh passes on old posts, meta descriptions, schema markup, all of this is legitimately faster with AI. The catch is that unedited AI drafts read like unedited AI drafts. Every draft needs a human pass for tone, accuracy, and anything that requires firsthand experience.
- On-page optimization
Title tag testing, semantic entity coverage, internal link gaps, readability cleanup, AI tools handle this well. Optimization platforms like Surfer and Clearscope layer AI-driven suggestions on top of your existing content, which makes the "how to optimize blog post for SEO" question a lot less painful than it used to be.
- Reporting and detection
AI can summarize GSC and GA4 insights at scale, flag declining pages before they fully drop, and identify clusters that are gaining traction but need more depth. That's the kind of signal that used to require a dedicated analyst to catch early.
How to optimize blog posts for SEO with AI
This is the workflow we've landed on, and it actually works.
- Start by identifying search intent. Before you write a word, understand whether someone searching your target keyword wants a definition, a comparison, a step-by-step process, or a tool recommendation. AI can help you read the SERP and categorize intent super quickly.
- Analyze the top-ranking pages honestly. What are they covering? Where are the gaps? What questions aren't they answering? You're not trying to copy structure. You're looking for what the reader still needs after reading the top results.
- Build a better outline with a genuine POV. The outline should reflect your brand's perspective, not just a synthesis of what already ranks. If you can't articulate what's different about your take, neither can the reader.
- Write with firsthand experience in the mix. Product examples, customer stories, data from your own tools, a specific conversation you had on a sales call. These are the signals that make content useful and that Google increasingly weights in its quality assessment.
- Add FAQs that reflect real search queries. Not "What is [topic]?" but the specific, sometimes awkward things people actually type into search bars at 11pm.
- Build internal links thoughtfully. Every new post should connect to at least two existing posts and accept links from two more. AI can suggest these. You still need to verify the context makes sense.
- Refresh quarterly. Content that ranked well six months ago might be losing ground to fresher posts. A quarterly refresh pass, aided by AI, keeps your best assets competitive.
- Track conversions. Traffic that doesn't contribute to pipeline isn't the goal. Optimize for buyers, not bots… buddy.
Is AI content good for SEO? What does Google actually reward?
Short answer: yes, if it's genuinely helpful. No, if it's generic output with no editing, no expertise, and no original perspective.
Google's helpful content guidance is pretty direct about this. What it rewards is helpfulness, expertise, originality, and user satisfaction. What it demotes is fluff: content that covers a topic but doesn't actually help anyone do anything, content that sounds authoritative but cites nothing, content that reads like it was written by someone who hasn't actually used the product they're writing about.
AI content fails when it's a first draft passed off as a final product. It fails when every paragraph restates the previous one. It fails when the only "expert insight" is a bullet list of things that already appear on the Wikipedia page.
AI content wins when a human with real expertise has edited it, shaped the POV, added specific examples, and verified the facts. At that point, whether AI drafted the structure is kind of beside the point.
The clearest way to think about it: AI can write words. Rankings still come from usefulness.
AI and SEO branding strategy: owning category mindshare
SEO used to be purely a traffic acquisition channel. It's become something closer to brand discovery infrastructure.
When a B2B buyer repeatedly encounters your brand across LinkedIn Ads guides, ABM comparison pages, attribution explainers, review site mentions, and AI-generated answers, you start to feel familiar before they ever book a demo. That familiarity matters enormously in a category where buyers are evaluating four or five tools simultaneously.
This is where SEO branding strategy gets interesting. Ranking for intent-rich, category-specific terms builds the mental shortlist. At Factors.ai, this looks like ranking for terms like "LinkedIn Ads attribution", "account-based marketing analytics", and "LinkedIn ROI measurement." Nobody searches those terms casually. When they do, they're in research mode, and showing up consistently across those searches creates the brand familiarity that makes the eventual demo feel like a natural next step, not a cold introduction.
AI makes it faster to build this kind of content coverage across a whole category. The strategic question, which only humans can answer, is which categories are actually worth owning.
How Factors.ai uses AI for revenue-focused SEO
We think about the content portfolio in three pillars, and AI plays a different role in each.
- The first pillar is high-intent SEO: competitor pages, use-case pages, tool alternative comparisons. These are the pages where purchase intent is highest. AI helps us draft and refresh these faster, but the positioning and conversion copy always gets the most human attention.
- The second pillar is educational authority: guides, benchmarks, playbooks. These are the pieces that build trust over a longer sales cycle. AI helps with research synthesis, briefing, and structural outlines. The data, the POV, the genuine insight still comes from us.
- The third pillar is buyer enablement: attribution explainers, ROI frameworks, sales FAQs. These live at the intersection of SEO and sales enablement. AI helps identify the questions buyers are asking. The answers still need to reflect actual product knowledge.
In every pillar, the human role is POV, examples, data, and positioning. The AI role is speed: faster briefs, faster refreshes, faster gap identification, and smarter clustering of long-tail demand.
Best AI tools for SEO teams in 2026
There's no single perfect stack… I know you know this. The best one is the one that fits how your team actually works.
For keyword research and competitive analysis, Ahrefs and Semrush remain the most comprehensive. For writing and first drafts, ChatGPT and Claude are both useful depending on the task. For content optimization and semantic coverage, Clearscope and Surfer are the tools most content teams rely on for hitting SEO targets and improving content marketing optimisation scores.
For internal linking at scale, tools like Link Whisper help identify gaps programmatically. For analytics, layering Google Search Console with a BI tool gives you the full picture. And for connecting content influence to pipeline outcomes, which is the part most teams are still missing, Factors.ai sits in the revenue attribution layer.
The one thing worth saying clearly: buying more tools doesn't fix a strategy problem. Start with a clear content brief process and a human review standard, then add tooling where it removes actual friction.
Mistakes to avoid with generative AI SEO
- Publishing unedited AI drafts is the most common one. It's also the most obvious to readers and to Google's quality signals. Every draft needs a human pass.
- Ignoring search intent is almost as damaging. Writing about a keyword without understanding what kind of content the searcher actually wants means your perfectly optimized post serves the wrong purpose.
- Measuring only traffic is how teams get good at the wrong thing. A blog post that drives 5,000 monthly visits but contributes to zero pipeline opportunities is a vanity metric dressed up as success.
- Publishing comparison pages with no real differentiation is another one. If your "X vs. Competitor" page just lists features from both websites without any genuine analysis, it won't rank well and it won't convert.
- Over-automating the editorial process removes the quality signal that makes content worth publishing. And skipping the refresh cycle means your best content slowly becomes your worst-ranking content.
- The most memorable way I've heard this framed: if everyone uses the same prompts, everyone sounds equally forgettable.
The future of SEO: AI search, GEO and answer engines
Google AI Overviews, ChatGPT Search, Perplexity, and similar tools are changing where and how people get answers. A growing share of searchers never click through to a result. They get the answer in the interface and move on.
This creates a new layer of optimization that's separate from traditional search rankings. It's called GEO: Generative Engine Optimization. The idea is that you're not just trying to rank on Google anymore. You're trying to be the source that AI answer engines cite when they summarize a topic.
What GEO favors: structured content, factual precision, clear entity relationships, original data, and genuine subject matter expertise. In a lot of ways, it's a more demanding version of what Google's helpful content guidance was already pointing toward. The brands that have been building genuine authority through SEO content marketing services and real expertise are well positioned for this shift. The ones relying on volume and keyword density are going to find the new environment more difficult.
Brand mentions and citation visibility matter more now, not less. If your brand name appears in trusted sources across the web, AI systems are more likely to surface and cite your content. That's a meaningful argument for thinking about SEO, PR, and analyst relations as a connected content strategy rather than separate departments.
In a nutshell…
If I have to tell you a few things to remember, it would be this: Use AI for speed and humans for insight, cover every funnel stage with content that reflects genuine expertise, optimize for buyers doing research, not for bots crawling pages, build internal link structures that help readers go deeper, measure pipeline impact alongside traffic, not instead of it, refresh your best-performing content quarterly before it starts declining, and build brand authority across web channels, not just your own domain.
And if your SEO reports are full of traffic numbers but light on pipeline influence, that's a measurement problem as much as a content problem. Factors.ai connects content influence to pipeline outcomes, so you can see which pieces are actually moving buyers through the funnel. Worth knowing before you publish your next hundred posts.
FAQs for generative AI SEO
Q1. Is generative AI SEO worth it?
Yes, if you're using it with human review and genuine strategic inputs. The teams getting results from it aren't the ones generating the most content. They're the ones who've figured out where AI removes bottlenecks without removing quality. Speed and scale matter, but only if the content is actually useful.
Q2. Is AI content good for SEO?
Yes, when it's helpful, accurate, and differentiated. The "is ai content good for seo" question is really a question about quality, not origin. A well-edited, expert-reviewed post that started as an AI draft ranks better than a poorly-written human draft. What Google penalizes is low-effort content, not AI-generated content.
Q3. Can AI replace SEO teams?
No. While AI can automate the research of 1,000+ keywords in seconds, it cannot understand why a specific ICP (Ideal Customer Profile) is feeling "buying anxiety." AI handles execution velocity, but humans are required for:
- Contextual Positioning: How to win against a specific competitor.
- Relationship Building: Earning high-quality backlinks and brand mentions.
- Conversion Optimization: Turning a reader into a demo request.
Q4. How do I optimize a blog post for SEO using AI?
To supercharge your rankings, follow this hybrid workflow:
- Intent Identification: Use AI to categorize keywords into Informational, Commercial, or Transactional intent.
- SERP Analysis: Use AI to synthesize the common headers (H2s/H3s) of the top 10 ranking pages.
- Human POV Insertion: Manually add your unique brand perspective and original data.
- Semantic Optimization: Use tools like Surfer or Clearscope to ensure you include the NLP (Natural Language Processing) terms AI engines expect to see.
- FAQ Generation: Use AI to generate questions based on "People Also Ask" data.
Q5. What is GEO (Generative Engine Optimization)?
GEO is the next frontier of SEO. It is the process of optimizing content to be cited as a source by AI answer engines (like ChatGPT Search, Perplexity, and Google AI Overviews).
- Traditional SEO focuses on Blue Links and clicks.
- GEO focuses on Citations and brand mentions.
- Key Stat: For a brand to be cited by an AI engine, it needs to appear in at least 3 to 5 independent, high-authority sources (like review sites, news outlets, or expert blogs) related to that topic.

LLM Use Cases and Visualization: How Large Language Models Power Marketing AI
Explore practical LLM use cases for B2B marketers. Learn how large language models improve targeting, reporting, content, and pipeline growth.
TL;DR
- Large language models (LLMs) solve real marketing problems like slow reporting, weak lead qualification, fragmented data, and content bottlenecks, not just "AI for the sake of AI."
- The twelve highest-impact llm use cases for marketing teams span campaign summaries, ad copy generation, audience segmentation, attribution narratives, intent detection, and forecasting.
- LLMs become far more powerful when connected to your own revenue data (CRM, ad platforms, web analytics) instead of running as standalone prompt tools.
- The smartest place to start is reporting summaries, content repurposing, or lead scoring, because ROI shows up quickly and implementation is lightweight.
- Hallucinations, privacy risks, and generic outputs are real concerns that require human review and proprietary data grounding.
It’s Monday morning (firstly, noooo😭)... your browser has 27 tabs open, three dashboards loading painfully slowly, and one Slack message that simply says: “Need insights for the board deck by 11.” *cue to loud internal and external screaming*.
You click into campaign data… there are numbers everywhere, CTR is up, pipeline is flat, and website traffic is rising from accounts sales has never heard of. LinkedIn engagement looks strong, but nobody can tell if it came from actual buyers or people who just enjoy liking thought leadership while avoiding work.
Then someone says the sentence every marketing team has now heard at least once:
“Can’t AI just figure this out?”
Fair question. Slightly off-tone, but fair.
Because this is where large language models stopped being a fun toy that writes birthday poems and became something much more interesting for marketers. They can read messy datasets, summarize patterns, turn dashboards into narratives, surface hidden intent signals, generate campaigns faster, and make complex information understandable to humans who do not want to inspect twelve CSV files before coffee.
That second part. Let’s talk about that in the next two sentences. The magic of LLMs is not only generation; it is interpretation and visualization. Taking scattered campaign metrics, CRM notes, ad performance, website journeys, and pipeline movement, then translating all of it into something a marketer can actually act on.
We’ve all watched teams move from drowning in data to finally seeing the story inside it. A weekly report becomes a clear summary with the next steps. A pile of account activity becomes a ranked list of buying signals. A confusing funnel becomes a visual map of where leads disappear and why.
This article is about where LLMs genuinely help marketing teams today (there are no sci-fi promises, nothing about “replace your whole team by Thursday”). I’ve tried to add some real use cases, workflows, and examples of how large language models are powering modern marketing AI, especially when paired with smart visualization and good human judgment.
If your team has more data than clarity, you're in the right place.
What are LLMs and why should marketers care?
Let's start with a simple definition that doesn't require a computer science degree. A large language model is an AI system trained on enormous volumes of text data, designed to understand, generate, and reason about language. When you type a question into ChatGPT, Claude, or Google's Gemini, you're interacting with an LLM. Meta's Llama is another well-known example in the open-source world.
The ‘large’ part is important because… it refers to the scale of parameters (think of these as the model's internal decision points). GPT-4 has hundreds of billions. That scale is what allows these systems to do more than simple pattern matching. They can summarize a fifty-page report, draft an email that sounds like a human wrote it, interpret ambiguous questions, and synthesize information from multiple sources into a coherent answer.
Now, here's why this is different from the marketing automation tools you've used for the past decade. Your old tools could trigger an email when someone downloads a whitepaper. They could segment a list by job title or company size. What they couldn't do is understand context. They couldn't read between the lines of engagement data and tell you why a campaign underperformed, or generate a genuinely tailored message for a specific buying persona at a specific stage of the funnel.
LLMs can do those things because they process intent (not just inputs). They don't just see that a visitor hit your pricing page three times. They can connect that behavior with CRM notes, ad engagement, and content consumption patterns, then produce a plain-English summary of what's happening with that account.
For B2B marketers specifically, this is a meaningful leap. Your world runs on fragmented data spread across a dozen platforms, long sales cycles where context gets lost between handoffs, and a constant pressure to produce more content and better insights with the same headcount. LLMs are purpose-built to handle exactly that kind of complexity, which is why large language model use cases have moved from experimental to essential in most forward-thinking marketing organizations.
Why do LLM use cases matter in B2B marketing?
Most B2B teams don't wake up thinking, "We need artificial intelligence." They wake up thinking, "We need to stop spending four hours building a campaign report that nobody reads past slide three." The appeal of LLMs isn't the technology itself. It's the problems they quietly eliminate.
Let me list the ones I hear most often, because they tend to show up in nearly every marketing org I've worked with or spoken to:
- Too much campaign data, not enough insight
You've got dashboards everywhere, but translating that data into "here's what we should do next" still requires a human sitting down for hours.
- Weak lead qualification
MQLs flood in, but sales complains that half of them aren't real buyers. The scoring model hasn't been updated since 2022, and nobody trusts it.
- Slow content production
You need blog posts, LinkedIn ads, nurture sequences, webinar copy, and sales one-pagers. Your content team is two people, and one of them is also running events.
- Poor marketing-to-sales handoff
By the time a lead reaches sales, the context of how they got there is either missing or buried in Salesforce notes nobody reads.
- Attribution confusion
Everyone argues about which channel "gets credit." Nobody can clearly explain the buyer journey from first touch to closed deal.
- Low personalization at scale
- You know personalization works, but doing it properly for fifty target accounts with different buying committees feels impossible without tripling your team.
These aren’t really one-off use cases… in fact, most of us working in B2B marketing would agree that these are exactly the problems where LLM business use cases deliver the fastest results.
The enterprise adoption numbers reflect this. Generative AI marketing tools have moved from pilot programmes to production deployments across mid-market and enterprise companies at a pace that's genuinely unusual for B2B tech adoption. The reason is straightforward: the ROI shows up in weeks, not quarters. When a marketer can ask a natural-language question and get a reporting summary instead of building a spreadsheet, the time savings are immediate and visible. When a content team can repurpose a single long-form piece into eight distribution-ready assets in an afternoon, the productivity gain is obvious. LLMs aren't solving a theoretical problem. They're solving the specific, frustrating bottlenecks that make marketing teams feel perpetually underwater.
12 high-impact LLM use cases for marketing teams
This is the section you probably scrolled down looking for, and it's the longest one for good reason. These twelve llm marketing use cases represent the most practical, highest-ROI applications I've seen across B2B teams of different sizes and maturity levels. Some are simple to implement today. Others require deeper integration with your data stack. All of them are real, not theoretical.
- Campaign performance summaries
Every marketing team has dashboards. Very few have dashboards that actually tell a story. The gap between "here's a chart showing CTR over time" and "here's what happened and why" is enormous, and it's a gap that LLMs close remarkably well.
Imagine pointing an LLM at your campaign data and getting back something like: "CTR on the enterprise LinkedIn campaign dropped 18% week-over-week, likely due to audience fatigue. The same creative has been running for six weeks without rotation. Meanwhile, the mid-market campaign saw a 12% lift after the new case study ad was introduced." That's not a generic summary. It's the kind of insight that used to require a senior analyst sitting down for an hour with the data. LLMs can produce it in seconds, and they can do it in plain English that your VP can actually act on during a meeting.
The key here is connecting the LLM to your actual campaign data, not just asking ChatGPT to interpret a screenshot. When ai marketing automation platforms integrate LLMs with live data feeds from Google Ads, LinkedIn, and your CRM, the summaries become genuinely actionable.
- Ad copy generation and testing
If you've ever sat in a room trying to brainstorm twelve different LinkedIn ad variants for the same product, you know it starts strong and gets painful by variant number five. LLMs excel at this because they can take a single brief and produce dozens of variations, each tailored to a different persona, funnel stage, or pain point.
The real power isn't just volume, though. It's the ability to systematically vary one element at a time. You can ask for five versions that change only the hook, five that change the CTA, and five that shift the value proposition. That structure makes A/B testing far more rigorous than the "let's try two headlines and see what happens" approach most teams default to. A content strategist still needs to review, edit, and approve the output. But they're starting from twelve solid drafts instead of a blank page, and that changes the velocity of your creative pipeline entirely.
- Audience segmentation
Traditional segmentation relies on firmographic filters: industry, company size, and job title. Those are useful starting points, but they miss the behavioral signals that actually predict buying intent. An LLM connected to your engagement data can group leads by much richer criteria.
For example, instead of "all VPs of Marketing at companies with 500+ employees," an LLM-powered segmentation might surface "accounts where three or more contacts have engaged with pricing content in the past two weeks and also attended a webinar." That's a fundamentally different, and more useful, way to think about your audience. It moves segmentation from static lists to dynamic clusters that reflect what accounts are actually doing, not just what they look like on paper.
- Lead qualification
Lead scoring has been around for years, but let's be honest about how well it works at most companies. The model was built two years ago based on assumptions that may no longer hold, the weights haven't been recalibrated, and sales still ignores half the MQLs because they don't feel like real buyers.
LLMs offer a different approach to qualification. Instead of rigid point-based scores, they can assess intent by reading across multiple signals: web visit patterns, ad engagement, content consumption, CRM activity, even the language used in form fills. A high-intent account isn't just one that hit a point threshold. It's one where the behavior pattern suggests active evaluation, and LLMs are remarkably good at detecting those patterns when given access to the right data. This is one of the LLM examples that tends to surprise teams the most, because the improvement over legacy scoring is so visible.
- Conversational reporting
This is the use case that makes analytics feel like it's finally caught up with how humans actually think. Instead of navigating seven dashboard tabs and three filters to answer a question, you simply ask: "Which campaigns influenced enterprise pipeline last quarter?"
The LLM pulls from your connected data sources, synthesizes the answer, and delivers it in natural language. No pivot tables, no export-to-Excel ritual, no waiting for the analytics team to have bandwidth. The question-and-answer format also surfaces insights you might not have thought to look for. When a team starts asking ad hoc questions, they often discover patterns that pre-built dashboards never would have surfaced, because dashboards only answer questions someone thought to build in advance.
- Content repurposing
A single well-researched blog post contains enough material for a newsletter, three LinkedIn posts, a webinar summary, an email nurture sequence, and a sales one-pager. The problem is that repurposing takes time, and most content teams are too busy creating the next piece to properly distribute the last one.
LLMs make this process nearly instant. You feed in the original blog, specify the output formats, and get back drafts tailored to each channel. The LinkedIn version is shorter and punchier. The email version leads with a pain point. The sales one-pager focuses on competitive differentiation. Each output still needs a human pass for tone, accuracy, and brand consistency, but the heavy lifting of reformatting and rewriting is handled. For teams where content production is a bottleneck (which is nearly all of them), this is one of the fastest paths to visible ROI.
- SEO content planning
If you've ever spent a day doing keyword research, clustering topics, mapping search intent, and drafting content outlines, you know it's valuable work that feels like it takes forever. LLMs compress the entire workflow. They can take a seed keyword, generate semantically related clusters, identify gaps in your current content, assess whether each keyword signals informational or commercial intent, and draft a preliminary outline, all in a single session.
The output isn't perfect. You'll still need a strategist to validate the clusters and an editor to refine the outlines. But the starting point is dramatically better than a blank spreadsheet and a Semrush export. Generative ai marketing tools that combine LLMs with real-time search data are making this even more powerful, because they can ground their recommendations in actual ranking data rather than just language patterns.
- Chatbots and buyer assistants
Chatbots have existed for years, but the old ones were frustrating because they could only follow pre-programmed decision trees. If a visitor asked something outside the script, the bot would shrug (metaphorically) and suggest emailing support. LLM-powered chatbots are a different experience. They can understand nuanced questions, draw from your knowledge base, and respond conversationally.
For B2B websites, this means faster qualification. A visitor lands on your pricing page, asks a specific question about integrations, and gets a genuine answer instead of "please book a demo." The chatbot can assess whether the visitor matches your ICP, route high-intent conversations to sales in real time, and log the entire interaction in your CRM. It's not replacing your SDR team. It's handling the first ninety seconds of every conversation so your team can focus on the ones that matter.
- Sales enablement
Sales reps spend a surprising amount of time doing research before meetings. They're clicking through LinkedIn profiles, scanning CRM notes, reviewing recent engagement history, and trying to piece together a picture of the account. It's necessary work, but it's tedious and inconsistent.
An LLM can generate an account brief in minutes by pulling from CRM data, website activity, ad engagement, and publicly available information. The brief might include key contacts and their roles, recent content interactions, relevant case studies to reference, and potential objections based on the account's industry. The rep walks into the meeting prepared, and the preparation didn't eat two hours of their afternoon. Marketing ai tools that offer this kind of sales enablement bridge the gap between marketing's data and sales' conversations, which is where most revenue teams lose context.
- Attribution narratives
Attribution has always been a numbers problem. Marketing attribution ai dashboards show you percentages and channel breakdowns, but they rarely tell a story. An LLM can take the same underlying attribution data and generate a narrative: "This deal was first influenced by an organic search visit in January. The buying committee expanded after three contacts attended our webinar in March. LinkedIn retargeting kept the account engaged through April, and the closed-won came after a direct outreach by the AE following a pricing page visit."
That narrative is infinitely more useful in a pipeline review than a bar chart showing "40% organic, 30% paid, 30% direct." It helps everyone in the room understand the journey, not just the allocation. And it makes attribution conversations less adversarial, because the focus shifts from "who gets credit" to "what actually happened." Attribution debates sometimes resemble group projects where everyone claims credit for the final result. Narratives bring the receipts.
- Intent detection
Anonymous website visitors are one of the most underutilized data sources in B2B marketing. You know someone from a target account visited your comparison page, your pricing page, and your integrations docs, all in one session. That's a high-intent signal, but most teams can't act on it quickly enough.
LLMs can summarize anonymous visitor behavior in real time. Instead of a raw event log showing page URLs and timestamps, you get a concise summary: "An unknown visitor from Acme Corp visited four product pages and the pricing calculator in a single session, suggesting active evaluation." That summary can trigger an alert to your SDR team, add the account to a priority ABM list, or kick off a personalized ad sequence. The raw data was always there. The LLM just makes it legible and actionable at the speed your revenue team needs.
- Forecasting inputs
Pipeline forecasting in most B2B companies is a blend of CRM data, gut feeling, and whatever the sales manager heard on the last call. LLMs can improve the inputs to that process by surfacing patterns humans tend to miss. They can read across CRM notes, campaign engagement trends, and pipeline velocity data to flag accounts that are accelerating, stalling, or at risk.
They won't replace your forecasting model, but they'll make it smarter. For instance, an LLM might notice that accounts in a specific industry segment tend to close faster after attending a particular webinar, or that deals with more than three engaged contacts move through the pipeline at twice the rate. Those insights get buried in spreadsheets. An LLM surfaces them in plain language, which means they actually get used.
Visualizing how LLMs fit into the marketing funnel
One thing that makes LLM use cases hard to evaluate is that they don't sit neatly in one place. They're not a "top-of-funnel tool" or a "bottom-of-funnel tool." They stretch across the entire journey, and visualizing that spread helps you decide where to deploy them first.
Here's how LLM capabilities map to each stage of a typical B2B marketing funnel:
- ToFu (top of funnel)
At the awareness stage, the goal is reach and relevance. LLMs contribute here through:
- Topic research and ideation. Generating content ideas based on keyword clusters, competitor gaps, and audience questions.
- SEO clustering. Grouping related keywords by intent and suggesting content hierarchies.
- Ad copy ideation. Producing multiple creative variants for awareness campaigns across LinkedIn, Google, and programmatic channels.
- Awareness content generation. Drafting blog posts, social content, and thought leadership pieces that attract the right audience.
- MoFu (middle of funnel)
Once someone's aware of you, the challenge becomes qualification and personalization. This is where LLMs start pulling from your first-party data:
- Lead scoring. Assessing buying intent from engagement patterns rather than static firmographic rules.
- Personalization. Generating tailored messaging for different personas and account segments.
- Nurture email sequencing. Drafting email sequences that adapt to where a contact is in their journey.
- Buyer intent analysis. Interpreting behavioral signals to identify accounts that are moving from casual interest to active evaluation.
- BoFu (bottom of funnel)
At the decision stage, speed and precision matter most. LLMs help revenue teams prioritise and act:
- Opportunity prioritisation. Flagging which deals are most likely to close based on engagement and pipeline data.
- Pipeline summaries. Generating plain-English overviews of pipeline health for leadership reviews.
- Attribution insights. Building narrative-style attribution stories that explain how deals came together.
- Expansion recommendations. Identifying cross-sell and upsell opportunities within existing accounts based on product usage and engagement data.
Traditional funnel vs LLM-powered funnel
The takeaway is… LLMs don't replace any single tool in your stack. They sit on top of your existing systems and make each stage faster, smarter, and more connected. The biggest gains come when the same LLM layer has access to data across all three stages, because that's when it can connect a ToFu blog visit to a MoFu webinar registration to a BoFu pipeline opportunity and tell you the full story.
LLM use cases for ABM and revenue teams
Account-based marketing is where LLMs go from "nice to have" to "how did we do this before?" The reason is simple: ABM requires deep account-level intelligence, and generating that intelligence manually is brutally time-consuming. Account-based marketing AI that leverages LLMs changes the economics of ABM entirely.
Here's what that looks like across the core ABM workflows:
- Identifying engaged accounts
Instead of manually reviewing dashboards to spot which target accounts are showing engagement, an LLM can continuously monitor your data and surface accounts where multiple buying signals are converging. Think of it as a filter that's always running, always watching for the combination of ad clicks, website visits, content downloads, and email opens that indicate a real evaluation is underway.
- Summarising account journeys
Every ABM strategist wants to understand the story of an account: when did they first engage, who's involved, what content have they consumed, where are they in the buying process? LLMs can pull that story together from disparate data sources and present it as a clear, readable narrative. No more stitching together Salesforce records, Google Analytics sessions, and LinkedIn campaign data by hand.
- Building personalized outreach prompts
Once you understand an account's journey, you need to act on it. LLMs can generate personalized outreach drafts for each account, referencing the specific content they've engaged with, the pain points their industry faces, and the stage of the buying cycle they appear to be in. The SDR still customizes and sends, but they're starting from a tailored draft instead of a blank email.
- Detecting buying committee signals
In enterprise B2B, you're rarely selling to one person. You're selling to a committee of five, eight, or twelve people. LLMs can flag when multiple contacts from the same account are engaging simultaneously, which is one of the strongest buying signals in ABM. If the VP of Marketing downloaded your ROI guide, the Director of Ops attended a webinar, and someone from IT visited your integrations page, that's a committee-level signal that deserves immediate attention.
- Surfacing hidden opportunities
Some of the best pipeline sits in accounts you're not actively targeting. LLMs can scan your engagement data and identify accounts that match your ICP and are exhibiting buying behavior, even if they're not on your named account list. The query might look something like: "Show me Fortune 500 accounts with ad engagement, repeat visits, and open opportunities." That's the kind of cross-data synthesis that would take a human analyst half a day. An LLM delivers it in seconds.
What makes these LLMs for b2b marketing use cases particularly powerful for revenue teams (not just marketing) is that the insights flow downstream. The account summary that marketing generates feeds directly into the SDR's outreach. The buying committee signal triggers a coordinated play between marketing and sales. The pipeline data that the LLM surfaces gets discussed in the weekly revenue review. When LLMs sit at the intersection of marketing and sales data, they become a connective layer that most organizations desperately need.
How Factors.ai uses LLM intelligence
Everything we've discussed so far has an important catch: LLMs are only as useful as the data they can access. A standalone LLM like ChatGPT is brilliant at general language tasks, but it doesn't know anything about your pipeline, your campaigns, or your accounts. The moment you need it to answer a question like "which campaigns drove enterprise pipeline last quarter," it's completely blind.
This is where Factors.ai takes a different approach. Instead of starting with a general-purpose prompt interface, Factors connects LLM intelligence directly to your first-party revenue data. Your CRM, your ad platforms, your web analytics, your account engagement signals are all part of the foundation the LLM reasons from.
Here's what that enables in practical terms:
- Ask questions across your entire GTM stack. You can query campaigns, CRM records, and website activity in natural language, and get a synthesized answer that draws from all of them.
- Summarise account journeys automatically. Instead of clicking through five tools to understand what happened with a specific account, Factors generates a timeline-style summary of every meaningful interaction.
- Detect high-intent accounts in real time. The system watches for converging signals (repeat visits, ad engagement, content consumption, CRM activity) and flags accounts that warrant immediate attention.
- Recommend audience expansion. Based on the characteristics of accounts already in your pipeline, Factors can suggest similar accounts you should be targeting.
- Explain ad performance in context. Rather than just showing you LinkedIn or Google Ads metrics, it connects performance data to downstream pipeline outcomes. You see which campaigns drove meetings, not just clicks.
- Turn noisy data into action. The core value is compression. Hundreds of data points about an account get distilled into a clear, actionable summary that your team can use immediately.
Most AI in the market starts with prompts. Factors starts with your actual revenue data, which means the LLM's outputs are grounded in your specific business context, not generic training data. That distinction is what separates interesting from useful. For marketing teams evaluating marketing AI tools, the question shouldn't be "does it use AI?" but rather "does it connect to my data and workflows?"
Risks, limits, and governance you can't ignore
I'd be doing you a disservice if I painted LLMs as an uncomplicated win. They're powerful, but they come with real risks that every marketing team needs to understand before scaling adoption. Ignoring these doesn't make you innovative. It makes you reckless.
- Hallucinations are the biggest trust risk
LLMs can generate confident, well-structured text that is completely wrong. They don't "know" facts the way a database does. They predict likely language sequences, and sometimes that prediction leads to fabricated statistics, invented sources, or subtly inaccurate claims. In a marketing context, this could mean an account brief that references a case study you never published, or a campaign summary that misattributes performance data. Every LLM output that touches your buyers, your leadership team, or your published content needs human review. No exceptions.
- Privacy concerns are real and evolving
When you feed customer data, CRM records, or engagement data into an LLM, you need to understand where that data goes and how it's processed. Public LLM APIs may use your inputs for model training unless you've explicitly opted out. For B2B companies handling enterprise client data, this isn't a hypothetical risk. It's a compliance issue that your legal and security teams need to weigh in on before you start piping account data into any AI tool.
- Over-automation creates a different kind of problem
The temptation to automate everything is strong, especially when the technology is impressive. But marketing that feels fully automated also feels generic, and your buyers can tell. If every nurture email, every ad variant, and every sales outreach is AI-generated without meaningful human input, your brand starts to sound like everyone else's brand. The goal is to automate the tedious parts and preserve human judgment for the strategic ones.
- Generic outputs are the default without grounding
A standalone public LLM draws from general training data. It doesn't know your product positioning, your competitive landscape, or your ideal customer profile. Without grounding in your proprietary data, its outputs will be plausible but generic. This is why connected systems (LLMs integrated with your CRM, ad platforms, and analytics tools) dramatically outperform standalone chat interfaces for business applications. The model needs your context to produce your answers.
- Human review is NOT optional, and needs to be part of the structure
The most effective LLM workflows I've seen treat AI-generated content as a first draft, never as a final product. A human reviews every summary, every outreach draft, every attribution narrative. That review layer is where quality, accuracy, and brand voice get enforced. Teams that skip it eventually publish something embarrassing, and the cleanup costs more than the time they saved.
No attribution model answers every question perfectly, and anyone who tells you otherwise is probably selling one. The same principle applies to LLMs. They're a tool, not an oracle. The teams that deploy them well are the ones that understand where the model's confidence is justified and where it needs a human gut check.
How do you choose the right LLM use case to start with?
With twelve use cases on the table, it's tempting to try all of them at once. Resist that temptation. The fastest path to real impact is picking one or two use cases, proving value, and then expanding. The question is how to choose which ones come first.
Here's a simple scorecard framework I'd recommend:
Based on this framework, I'd recommend most B2B teams start with one of these four use cases:
- Reporting summaries
The data already exists in your dashboards. The implementation is lightweight. The time savings are immediately obvious to leadership. And if the summary is slightly off, a human catches it before it reaches anyone external.
- Lead scoring and qualification
If you have decent engagement data and a CRM with pipeline records, an LLM can dramatically improve how you identify high-intent accounts. The ROI shows up in conversion rates and sales feedback within a quarter.
- Content repurposing
You've already written the source material. The LLM just reformats it. The risk is low because every output gets an editorial review anyway, and the productivity gain is massive for small content teams.
- Sales briefs
This one tends to win over skeptics quickly because the sales team sees immediate value. Reps who previously spent thirty minutes preparing for a call now get a briefing document generated in minutes. It's the kind of cross-functional win that builds internal support for broader LLM adoption.
The use cases that should come later, not because they're less valuable, but because they require more integration and governance, include ad copy generation at scale (needs brand guidelines baked in), chatbots (need knowledge base integration and QA testing), and forecasting inputs (need clean, well-structured pipeline data). Start where the data is ready and the stakes are manageable. Scale from there.
Where to, next? Where are LLMs in marketing AI heading next?
The current generation of LLM use cases is largely reactive. You ask a question… you get an answer. You feed in data, you get a summary. You provide a brief… you get a draft. The next wave is about moving from reactive to autonomous, and it's closer than most marketers realize.
Agentic workflows are the most significant shift on the horizon. Instead of a human prompting an LLM for each task, an AI agent will execute multi-step workflows on its own. Imagine telling a system: "Monitor our LinkedIn campaigns, flag any that drop below target CTR, generate three replacement ad variants, and queue them for review." The agent handles the monitoring, the analysis, the creative generation, and the routing. The human reviews and approves. That's not science fiction; early versions are already in production at some companies.
- Autonomous campaign operations take this further
Think of budget reallocation that happens in real time based on pipeline impact, not just click metrics. Or nurture sequences that dynamically adjust their messaging based on an account's evolving engagement pattern. The human sets the strategy and the guardrails. The system handles the execution within those bounds.
- Multimodal analysis is another frontier
Current marketing LLMs mostly work with text. The next generation will process text, images, video, and call transcripts together. Your AI will be able to watch a recorded sales call, summarize the key objections, cross-reference them with the account's marketing engagement, and suggest a follow-up strategy. That's a level of synthesis that's impossible to do manually at scale.
- Predictive GTM copilots represent the endgame for many of these trends
Instead of separate tools for analytics, content, ABM, and forecasting, you'll have a unified intelligence layer that connects all of them. It won't just answer questions. It'll proactively surface recommendations: "Three enterprise accounts are showing accelerated engagement this week. Here's a recommended play for each one." AI that acts, not just answers, is the trajectory that every major platform is building towards.
The marketing teams that will benefit most from this next wave aren't the ones waiting for it to arrive. They're the ones building the data infrastructure, governance practices, and internal fluency with LLMs now, so that when agentic tools become production-ready, they can adopt them without starting from scratch.
In a nutshell…
We've covered a lot of ground, so here's a short summary of what I’d love for you to remember from this blog.
LLMs solve specific, expensive problems that B2B marketing teams face every day: slow reporting, weak lead qualification, content bottlenecks, fragmented data, and the chronic gap between what marketing knows and what sales can act on. The twelve use cases we walked through, from campaign summaries and ad copy generation to attribution narratives and forecasting inputs, aren't theoretical. They're in production at real companies, delivering measurable time savings and better decisions.
The funnel mapping exercise shows that LLMs aren't a single-stage tool. They add value at every point in the buyer's journey, but they get dramatically more powerful when they can connect data across stages. An LLM that can see a ToFu blog visit, a MoFu webinar registration, and a BoFu pricing page session, all for the same account, tells a story that no single dashboard ever could.
That’s where the real shift happens. Marketing teams have never lacked data. They’ve lacked context, speed, and the ability to turn scattered signals into clear next moves. LLMs help close that gap by acting less like a chatbot and more like an always-on analyst, strategist, and translator sitting inside your stack.
They can explain performance, spot patterns, surface opportunities, and make complex data easier to understand through summaries, visualisations, and recommendations. Suddenly, reporting becomes useful. Lead handoffs become sharper. Content becomes faster to produce. Decision-making becomes less political and more evidence-based.
But the companies that win with LLMs won’t be the ones using them for novelty. They’ll be the ones using them with clean data, smart workflows, clear guardrails, and human judgment still firmly in the driver’s seat.
So if you're wondering where to start, start small, start practical, and start where the pain is most expensive. Because the future of marketing AI probably won’t arrive as one dramatic revolution. It’ll arrive as dozens of frustrating tasks quietly disappearing from your week.
FAQs for LLM use-cases and visualizations
Q1. How do LLMs differ from traditional marketing automation?
Traditional automation is rule-based (e.g., "If lead downloads X, send email Y"). It follows strict "if/then" logic. LLMs are intent-based; they can understand context, summarize unstructured data from CRM notes, and generate creative variations based on a single prompt. LLMs don't just move data, they interpret it.
Q2. Do I need a data scientist to use LLMs in my marketing team?
Not necessarily. Most modern Marketing AI tools and platforms like Factors.ai have LLM capabilities built-in via "Conversational Reporting" or "Account Summaries." You interact with the data using natural language, making the "data science" part invisible to the end user.
Q3. What is the highest ROI use case to start with?
The quickest win is typically Reporting Summaries and Content Repurposing. Summarizing campaign performance in plain English saves hours of analyst time, and repurposing one webinar into ten social posts scales your content output instantly without increasing headcount.
Q4. Can LLMs replace my SEO or Content team?
No. LLMs are "first-draft" machines. While they excel at brainstorming keyword clusters and drafting outlines, they lack the strategic empathy and proprietary insight required for high-performing B2B content. A human must always review for brand voice, factual accuracy (avoiding hallucinations), and competitive positioning.
Q5. How do LLMs map across the marketing funnel?
- ToFu (Top of Funnel): Ideation, SEO clustering, and multi-variant ad copy generation.
- MoFu (Middle of Funnel): Intent-based lead scoring and personalized nurture sequencing.
- BoFu (Bottom of Funnel): Opportunity prioritization, account-based briefs for sales, and attribution narratives.
Q6. What are "hallucinations," and how do I avoid them?
Hallucinations occur when an LLM confidently states a fact that is incorrect. To avoid this in marketing, you must use "Grounding." This means connecting the LLM to your specific first-party data (CRM, Web Analytics) so it only reasons based on your actual numbers rather than general internet training data.
Q7. Is my company’s data safe when using LLMs?
This depends on the tool. Public versions of tools like ChatGPT may use your data for training. However, enterprise-grade tools (and those using private API instances) ensure your data is siloed and not used to train the public model. Always check for SOC2 compliance and data privacy agreements.
Q8. How do LLMs help with Account-Based Marketing (ABM)?
LLMs excel at Account Journey Summarization. Instead of a rep clicking through 20 Salesforce records to understand an account’s history, an LLM can synthesize that data into a 3-paragraph "brief" that highlights which stakeholders are active and what they care about.

What is a product-qualified lead? A practical PQL guide for B2B SaaS
Learn what a product qualified lead (PQL) is, how to define one, track signals, and convert more high-intent users into pipeline with Factors.ai.
TL;DR
- A product-qualified lead (PQL) is a user or account that has demonstrated real buying intent through meaningful product usage, not just a form fill or sign-up.
- PQLs outperform traditional lead types because they're rooted in behavior, which means lower acquisition costs, faster sales cycles, and better retention.
- Identifying a PQL requires layering three signal types: fit (do they match your ICP?), usage (have they activated core features?), and buying intent (are they showing commercial readiness?).
- A strong PQL scoring model starts with reverse-engineering your best customers, assigning weighted scores to key actions, and iterating quarterly with closed-won data.
- The most common mistake teams make is treating every signup as a PQL, when in reality, most signups never reach the activation threshold that actually predicts conversion.
Every SaaS company has a moment that feels a bit like choosing the wrong contestant on a dating reality show. The flashy one arrives first, says all the right things, gets everyone excited, and by episode three has completely disappeared.
That’s how teams treat leads.
Someone signs up for a free trial. They came through a paid campaign, filled every field in the form, and maybe even selected “Interested in enterprise pricing.” Slack starts buzzing. Sales claims them, marketing celebrates its success, and internal energy rises dramatically for no reason.
Then... nothing.
They log in once, click two tabs, ghost the product, and leave your pipeline like a man leaving Love Island after Casa Amor.
Meanwhile, another account steps in with no drama, zero demo requests, and no chest-thumping intent signals. They invite teammates, connect integrations, build workflows, and start hitting usage limits like they pay rent there, but nobody notices because they're as soft as a hummingbird.
And that is exactly why the product-qualified lead exists.
A PQL is not the lead who shouted the most… but the lead whose behavior inside your product says, “I get the value, I need more, and I’m probably worth talking to now.”
For B2B SaaS teams running free trials, freemium models, or product-led growth motions, this is the difference between chasing theater and spotting real buying intent.
In this blog, we’ll go over what a PQL actually means, how to identify one properly, how to score product behavior without nonsense metrics, and how to stop ignoring the buyers already halfway convinced inside your product.
What is a product-qualified lead?
A product-qualified lead is a user or account that has experienced meaningful value inside your product and shown buying intent through their usage behavior. That's the core of it. This is not someone who downloaded a whitepaper, attended a webinar, or simply created an account and never returned. A PQL has actually used your product in a way that suggests they're getting closer to a purchase decision.
You'll typically see PQLs emerge in freemium models, free trials, sandbox environments, or any product-led growth motion where users can experience the product before talking to a sales rep. The key distinction is that the qualification is based on what they've done inside the product, not what they've told you on a form.
Here's a different (read: non-B2B) way to think about it… A signup is a handshake. A PQL is someone who's already moved in, rearranged the furniture, and is asking about the lease terms. The behavioral evidence is what separates the two.
So, what does that evidence look like?
It varies by product, but some common examples include a user inviting three or more teammates to their workspace. Or someone connecting a CRM integration within their first week. A user who's returned to a specific feature five times in seven days is showing something very different from someone who logged in once and bounced. Hitting a usage cap is another strong signal, because it means the free tier is no longer sufficient for what they're trying to accomplish.
The important thing to remember is that a signup alone doesn't make someone a product-qualified lead. Product activity matters far more than form fills. A user who's deeply engaged with your product but has never spoken to sales is often closer to buying than someone who requested a demo but hasn't touched the trial. That inversion is what makes PQLs so powerful and so often overlooked.
If you need one clean definition to carry with you: a product-qualified lead is a user or account whose in-product behavior signals genuine readiness to buy, based on activation, engagement, and usage patterns that correlate with conversion.
PQL meaning in B2B SaaS
So what does PQL actually mean in the context of B2B SaaS? In practical terms, it means someone is already experiencing value from your product before they've ever had a conversation with your sales team. They've moved past curiosity and into utility. They're not evaluating you in theory. They're evaluating you in practice.
This is a meaningful shift from the traditional B2B motion, where marketing generates awareness, nurtures with content, and eventually passes a lead to sales for a demo. In that model, the first real product experience happens after the sales conversation. The PQL model flips that sequence entirely. The user tries the product first, experiences value, and then engages with sales when they're ready to expand or commit.
Think of it as the difference between convincing someone they need a product and confirming that someone already knows they need it. The first is persuasion… second is timing.
PQLs are especially relevant for certain categories of B2B software. SaaS tools with self-serve onboarding are a natural fit, because users can reach value without human intervention. Martech platforms, collaboration tools, developer tools, and workflow automation products all tend to generate PQLs at scale, because their core value is visible during a trial or free-tier experience. If your product can demonstrate its usefulness before a contract is signed, the PQL model applies.
For B2B teams focused on pipeline quality (which, honestly, should be all of them), this matters because PQLs filter out noise in a way that traditional lead models can't. An MQL who downloaded a guide might be a student researching a paper. A PQL who's built three campaigns and invited their team isn't researching anything. They're working. That's the distinction that separates vanity leads from genuine pipeline.
PQL vs MQL vs SQL: how do they actually compare?
One of the most common questions that comes up around PQLs is how they relate to MQLs and SQLs. It's a fair question, because all three are qualification models, but they measure fundamentally different things. The simplest way to break it down is by looking at what qualifies the lead.
- An MQL (marketing qualified lead) is someone who's engaged with your marketing, such as downloading content, attending a webinar, clicking through email campaigns, or filling out a form. The qualification is based on their interaction with your brand and content, not your product.
- A PQL is someone who's engaged with your product. They've signed up, activated key features, and demonstrated through their behavior that they're getting real value. The qualification is based on what they've done inside your product.
- An SQL (sales qualified lead) is someone that a sales rep has reviewed and confirmed as ready for a deal conversation. It usually involves human judgment layered on top of either MQL or PQL signals.
Here's a table that makes the differences a little clearer:
Here’s an example: someone who downloads your ‘Ultimate Guide to Campaign Analytics’ is an MQL. Someone who signs up for a free trial, activates their workspace, and invites three teammates is a PQL. Someone who then requests a pricing walkthrough and confirms they have budget approval is an SQL.
The nuance that most articles miss is that modern B2B funnels often don’t rely on just one of these models. The strongest teams combine all three. They use MQL signals to capture early awareness, PQL signals to identify product engagement, and SQL criteria to confirm deal readiness. It's not a matter of choosing one over the others. It's about layering them into a coherent qualification framework.
Why do product-qualified leads matter?
PQLs matter because they solve a problem that's plagued B2B sales teams for years: wasted effort on leads that were never going to convert. When your pipeline is full of contacts who showed interest but never experienced your product, you're asking sales reps to do the heavy lifting of both education and persuasion. PQLs remove a large chunk of that burden, because the user has already educated themselves.
The commercial impact is substantial across several dimensions.
- First, PQLs tend to convert at higher rates because the user already knows the product. They've seen the interface, tried the features, and decided it's worth their time. That's a very different starting point than a cold lead who's only seen a landing page and a few emails.
- Second, the sales cycle for PQLs is typically shorter. When someone's already activated their workspace and built real workflows, the sales conversation shifts from "let me show you what we do" to "let me help you get more out of what you're already doing." That's a faster path to close, and it frees up your sales team to focus on expansion rather than discovery.
- Third, retention tends to be better for customers who started as PQLs. Someone who converted because they experienced real value is less likely to churn than someone who converted based on a demo they half-watched. The foundation of the relationship is stronger because it's rooted in actual usage, not a pitch.
There's a buyer psychology angle here that I want to talk about (and no, it’s not only because this was my favorite subject in post-grad). People trust what they've already experienced far more than what they've been told. If you've ever bought software after a free trial, you know the feeling. The decision doesn't feel risky because you've already validated the product yourself. That's the same dynamic PQLs create at scale.
From a finance perspective, PQLs also change the economics of customer acquisition. When your best leads are self-qualifying through product usage, you're spending less on outbound prospecting, fewer sales hours per deal, and more efficiently allocating your marketing budget. The CFO cares about lower customer acquisition cost waste, better sales efficiency, and higher win probability. PQLs deliver on all three.
How do you identify a product-qualified lead?
Identifying a PQL isn't about picking a single metric and declaring victory. It requires a layered approach that accounts for who the user is, what they've done, and whether they're showing signs of commercial readiness. I think of this as a three-layer framework, and the best PQLs sit at the intersection of all three layers.
Layer 1: Fit signals
Before you even look at product usage, you need to know whether the user matches your ideal customer profile. A college student exploring your free tier isn't a PQL, no matter how many features they activate. Fit signals include company size, industry, geography, role or title, and revenue band. If the account doesn't match the profile of companies that actually buy your product, high engagement alone won't make them a qualified lead. It might make them a power user of your free plan, but that's a different conversation.
Layer 2: Usage signals
This is the core of PQL identification. Has the user engaged with the features that correlate with conversion? Not all feature usage is equal, and this is where a lot of teams go wrong. Logging in isn't activation. Clicking around a dashboard isn't engagement. You need to identify the specific actions that your best-converting customers took early in their journey, and then look for those same patterns in new users.
Common usage signals include activating a workspace or project, uploading data or connecting a data source, creating a first campaign or workflow, and connecting integrations with other tools the user already relies on. These actions represent genuine value realisation, not just exploration. They suggest the user has moved from "checking it out" to "building something with it."
Layer 3: Buying signals
The third layer separates active users from active buyers. Buying signals indicate that the user or account is approaching a purchase decision. They might have hit the limits of the free tier and need to upgrade to continue. They might have visited the pricing page multiple times in a short window. Adding teammates often signals that the account is expanding beyond a single evaluator. Requesting security documentation or compliance information is another strong buying signal because it usually indicates procurement involvement.
The best PQLs combine all three layers. They match your ICP, they've activated core features, and they're showing commercial intent. Any two out of three is still valuable, but the trifecta is where your highest-conversion opportunities live. When you can confidently say "this is the right type of company, they're getting real value, and they're signaling readiness to buy," you've got a lead that sales should be prioritizing above almost everything else.
Common PQL signals to track
Once you've got the three-layer framework in place, the next question is: what specific signals should you actually be watching? The answer depends on your product, but there are patterns that show up consistently across B2B SaaS companies. Breaking these into user-level, account-level, and commercial signals makes them easier to operationalize.
- User-level signals
These are the behavioral indicators tied to individual users inside your product. Daily active usage is the most obvious one, but it's more useful when you look at depth rather than just frequency. A user who logs in every day but only views the dashboard is different from a user who logs in three times a week but builds campaigns each time.
Feature depth matters more than session count. Is the user engaging with your core differentiating features, or just poking around settings? Session frequency and repeat logins are helpful contexts, but they should be interpreted alongside what the user actually does during those sessions.
- Account-level signals
This is where things get interesting for B2B, because buying decisions in B2B aren't made by individuals. They're made by teams. When multiple users from the same account are active inside your product, that's a much stronger signal than a single enthusiast. Cross-team invites suggest the product is spreading across departments, which often precedes an enterprise buying conversation.
Admin setup completion is another underrated signal. When someone takes the time to configure SSO, set up teams, or define permissions, they're investing in the long-term use of the product. Enterprise domain detection (recognizing when signups come from large-company email domains) can also help you prioritize accounts with higher contract potential.
- Commercial signals
These are the signals closest to a purchase decision. Pricing page visits are the classic example, especially when there are repeated visits within a short time frame. Demo CTA clicks indicate the user wants human guidance, which usually means they're past the self-serve evaluation stage. Trial expiry proximity is a natural trigger point because it forces a decision, and usage cap warnings mean the user has outgrown the free tier and needs to upgrade to keep working.
The key with all of these signals is that none of them works in isolation. A pricing page visit from someone who signed up yesterday and hasn't activated anything is very different from one from someone who's been building workflows for three weeks. Context is everything, and that context comes from layering signals together rather than reacting to any single data point.
How do you build a PQL scoring model?
Building a PQL scoring model sounds intimidating, but it follows a fairly intuitive logic. You're essentially trying to assign a numerical value to a user's likelihood of becoming a customer, based on the signals they've shown. The trick is grounding that model in real data rather than guessing.
Step 1: Start with historical wins
Pull up your last 50 to 100 converted customers and reverse-engineer their product behavior before they bought. What features did they use? How quickly did they activate? How many teammates did they invite? How many sessions did they log in the first two weeks? You're looking for patterns that reliably separate buyers from window shoppers. This step is the foundation, because it anchors your scoring model in evidence rather than assumption.
Most teams skip this step or do it superficially, and that's usually where scoring models start to break down. If you can't explain why a particular action gets points, you probably shouldn't be assigning them yet.
Step 2: Assign weighted scores
Once you've identified the actions that correlate with conversion, assign each one a point value that reflects its relative importance. The exact numbers will be specific to your product, but here's an example to illustrate the structure:
The weighting should reflect how strongly each action predicted conversion in your historical data. ICP match gets a high score because fit is foundational. Integration connections score high because they represent deep product investment. Pricing page visits are useful but can happen casually, so they get a moderate score on their own.
Step 3: Set thresholds
With scores assigned, you need to decide what total score triggers a particular action. Here's a simple example:
These thresholds should feel like natural inflection points. A user in the 50–69 range is showing interest but hasn't crossed into commercial territory yet. A user above 70 has demonstrated both fit and engagement. And a user above 90 is essentially waving a flag that says, "I'm ready to talk."
Step 4: Keep iterating quarterly
This might be the most important step… and the one that teams are most likely to ignore. Your PQL model isn't a set-and-forget system. Buyer behavior evolves, your product changes, and the signals that predicted conversion six months ago might not be as reliable today. Every quarter, pull your closed-won data and compare it against your scoring model. Ask yourself which scores predicted conversion accurately, which ones were noise, and whether new signals have emerged that you should be tracking.
This is also where a platform like Factors.ai adds a genuine intelligence layer. Instead of manually crunching spreadsheets every quarter, you can use automated scoring that updates as new behavioral patterns surface. But regardless of the tooling, the discipline of revisiting your model regularly is what separates a scoring system that works from one that quietly decays.
How should sales and marketing teams work PQLs?
This section is where most PQL content falls short. Defining what a PQL is and building a scoring model is only half the job. The other half is making sure your go-to-market teams actually handle PQLs differently from traditional leads. If your sales reps treat a PQL the same way they'd treat a cold inbound, you've wasted all the insight your product data is giving you.
What should marketing be doing?
Marketing's role in a PQL motion isn't about generating leads in the traditional sense. It's about creating the conditions for users to reach PQL status faster and more reliably. That means designing onboarding flows that guide users toward activation milestones, not just welcome emails that say "thanks for signing up."
Nurture sequences should be built around product behavior, not just time-based drips. If a user connected an integration but hasn't built their first workflow, the next email should help them do exactly that. Promoting case studies to users who are mid-trial is another effective tactic, because social proof lands differently when someone's already using the product and can see themselves in the story.
Marketing should also be watching for dormant users and running retargeting campaigns to bring them back. A user who was active for a week and then went quiet isn't necessarily lost. Sometimes, a well-timed ad or email showing what they're missing is enough to restart the engagement loop.
What should sales be doing?
Sales reps working PQLs need a fundamentally different playbook than what they'd use for cold outreach. The first rule is to wait until the value is clear before reaching out. Calling someone who signed up yesterday and hasn't done anything yet is the fastest way to burn a potentially great lead. You're interrupting before they've had a chance to see what the product can do.
When the timing is right, the outreach should be personalized based on usage data. This is where PQLs give sales a genuine advantage. Instead of a generic "checking in" email, a rep can reference specific actions the user has taken. Something like, "I noticed your team launched three campaigns this week, and you've been exploring our analytics features. Would it be helpful to walk through how some of our larger customers set up cross-regional reporting?"
That kind of outreach feels like help, not a pitch. It demonstrates that you've been paying attention without being creepy, and it positions the sales conversation around the potential for expansion rather than basic feature education.
Sales should also consider removing blockers rather than just pushing for a close. If a PQL is stuck because they can't figure out an integration, fixing that problem is more valuable than sending a pricing PDF. The sale follows naturally when the product experience is working.
The handoff between teams
The trickiest part of the PQL motion is the handoff. Marketing needs to flag when a user crosses the PQL threshold, and sales needs to act on it quickly without clumsily interrupting the user's workflow. This requires shared definitions, shared visibility into product data, and a clear routing mechanism that ensures the right PQLs reach the right reps at the right time.
Teams that nail this handoff treat PQLs as a shared responsibility rather than a marketing-to-sales relay race. Both teams are watching the same signals, and the conversation about when to engage is ongoing, not a one-time SLA document that nobody reads after the first month.
How can Factors.ai help teams operationalize PQLs?
Everything we've discussed so far requires one thing that's surprisingly hard to achieve: a unified view of your buyer's journey across product usage, website behavior, CRM data, and advertising engagement. Most B2B teams have these data sources living in separate systems that don't talk to each other, which makes it nearly impossible to build a coherent PQL motion without a lot of manual stitching.
This is where Factors.ai fits into the picture. The platform brings together product analytics, website visitor data, CRM records, and ad engagement into a single account-level view. Instead of trying to correlate a user's product activity with their website behavior in separate tabs, you can see the full picture in one place.
- Account-level scoring is a particularly important capability here. In B2B, the buying decision rarely comes from a single user. Factors.ai scores accounts rather than just individuals, so you can spot when an entire team is engaging with your product, not just a lone evaluator. That distinction often separates a promising trial from a genuine pipeline opportunity.
- The platform also helps identify buying committees early. When multiple stakeholders from the same account are visiting your website, engaging with ads, and using the product, Factors.ai surfaces those patterns automatically. Sales teams can then prioritize accounts where momentum is building across multiple contacts.
- Routing high-intent accounts to the right sales reps happens within the same workflow. When an account crosses a PQL threshold, it can be automatically assigned to the rep who owns that territory or segment. No manual CSV exports, or random Slack messages asking "who's handling this one?"
For marketing teams, Factors.ai enables LinkedIn retargeting specifically for warm product users. If someone's been active in your trial but hasn't converted, you can serve them targeted ads that reinforce the value they've already experienced. It's a much more efficient use of ad spend than broad awareness campaigns aimed at cold audiences.
Perhaps most importantly, the platform connects PQL activity to actual pipeline outcomes. You can see which PQL signals actually predicted revenue, which scoring thresholds need adjustment, and where the gaps are in your funnel. That feedback loop between product engagement and closed-won deals is what turns a PQL framework from a theoretical exercise into a revenue engine.
Common PQL mistakes to avoid
Getting the PQL model right takes iteration, and there are a few recurring mistakes that trip up even experienced teams. Knowing what to watch for can save you months of building on a shaky foundation.
Mistake 1: Counting every signup as a PQL
This is the most common one, and it defeats the entire purpose of the PQL concept. If everyone who creates an account is automatically considered a product qualified lead, you haven't qualified anything. You've just renamed your signup list. PQLs require evidence of meaningful product engagement, not just a completed registration form. The noise-to-signal ratio in your pipeline will stay just as bad as it was before you adopted the PQL model.
Mistake 2: Ignoring account-level intent
In B2B, one curious individual exploring your product doesn't mean their company is ready to buy. A single user from a large enterprise signing up for a trial is interesting, but it's not the same as three people from that company actively using the product and discussing it in their internal Slack channels. Focusing only on individual user signals while ignoring what's happening at the account level means you'll miss some of your biggest opportunities and over-prioritize others.
Mistake 3: Sending sales in too early
This one's tempting, especially when you can see a user from a dream account has just signed up. The instinct is to pounce. But reaching out before the user has had a chance to experience value almost always backfires. You're interrupting someone who's still in discovery mode, and the outreach feels pushy rather than helpful. Give users enough time to reach activation milestones before triggering a sales motion. The patience pays for itself in higher response rates and better conversations.
Mistake 4: No feedback loop from revenue data
A PQL scoring model that never gets validated against actual revenue outcomes is just guesswork with a spreadsheet. If you're not regularly checking which PQLs actually converted to paying customers and which ones didn't, your model will drift away from reality over time. The feedback loop between product engagement data and closed-won deals is essential. Without it, you're scoring leads based on assumptions that might have been valid six months ago but aren't anymore.
Mistake 5: Keeping your scoring model static forever
Buyer behavior changes. Your product evolves. New features get shipped, old ones get deprecated, and the competitive landscape shifts. A scoring model that was perfectly calibrated last year might be penalizing users for not engaging with a feature that's been redesigned, or it might be ignoring a new workflow that's become your strongest conversion predictor. Treat your PQL model as a living system that needs regular maintenance, not a document you created during a planning offsite and never touched again.
In a nutshell…
A product-qualified lead is one of the clearest buying signals available in modern B2B SaaS, because it's rooted in observable behavior rather than stated intent. Someone who's activated your product, built real workflows, invited teammates, and hit usage limits is telling you something far more reliable than a form fill or a webinar registration ever could.
The framework for getting PQLs right has a few essential components. You need to layer fit signals, usage signals, and buying signals together, because any one of those on its own tells an incomplete story. You need a scoring model that's grounded in historical win data, not assumptions about what should matter. And you need to iterate on that model quarterly using actual revenue outcomes, because buyer behavior doesn't stay still.
The organizational piece matters just as much as the technical one. Marketing should be designing onboarding experiences that accelerate users toward activation milestones, and sales should be reaching out with personalized, usage-aware outreach when the timing is right. The handoff between the two teams needs shared definitions and shared visibility into product data.
If you're running a product-led motion and still qualifying leads primarily based on marketing engagement, you're probably sitting on a layer of high-intent signal that nobody's using. The product data is there. The conversion patterns are there. The question is whether your team is wired to see them and act on them. That's where product-led growth stops being a buzzword and starts becoming pipeline-led growth.
Frequently asked questions about product-qualified leads
Q1. What is PQL?
PQL stands for product-qualified lead. It's a user or account that's showing buying intent through meaningful product usage, not just content engagement or form submissions. The qualification comes from what the user has actually done inside your product, which makes it a behavior-based signal rather than a demographic or engagement-based one.
Q2. What is a product-qualified lead in SaaS?
In a SaaS context, a product-qualified lead is typically a trial or freemium user who has experienced genuine value and is showing readiness to upgrade to a paid plan. They've gone beyond signing up and exploring. They've activated core features, built workflows, or reached the limits of the free tier. Their product behavior suggests they're closer to a buying decision than someone who's only interacted with your marketing.
Q3. Is a PQL better than an MQL?
Not always, but PQLs often carry stronger intent because they reflect real product behavior rather than content engagement. An MQL who downloaded a whitepaper might be doing casual research. A PQL who's built campaigns and invited teammates is demonstrating active use. That said, the strongest B2B funnels use both signals in combination. MQLs help you capture early-stage awareness, while PQLs help you identify who's actually getting value and moving toward purchase.
Q4. How do you measure PQLs?
You measure PQLs by tracking a combination of activation milestones, feature usage depth, account-level growth, and commercial intent signals. Specific metrics include how quickly a user reaches key activation steps, how many features they engage with, whether they've invited teammates, and whether they've visited pricing pages or hit usage caps. These signals are then combined into a scoring model with thresholds that define when a user crosses into PQL territory.
Q5. Can enterprise companies use PQLs?
Yes, and in many ways, PQLs are even more powerful for enterprise sales when measured at the account level. A single user from a large company exploring a trial is useful information, but the real signal comes when multiple users from that account are active, when admin setup is complete, and when cross-team adoption is visible. Enterprise PQL models need to account for buying committee dynamics rather than focusing exclusively on individual behavior.
Q6. What is the difference between a PQL and an SQL?
A PQL is qualified by product behavior: the user's actions inside the product indicate readiness to buy. An SQL is qualified by human review, usually a sales rep who has confirmed that the lead has budget, authority, timeline, and a genuine need. In practice, a PQL often becomes an SQL once sales engages and validates the opportunity. The PQL is the behavioral signal, and the SQL is the human confirmation that the deal is worth pursuing.

We don’t just write about demand gen. We deliver it.
Our AI Agents help you uncover high-intent accounts, run campaigns that actually convert, and keep your GTM motion in sync.
1000+ GTM teams have already scaled their pipeline with Factors.
*Includes built-in peace of mind. And fewer late-night funnel audits.

.svg)



.avif)

