
Good Reads
Fix pipeline pains. Solve GTM puzzles. Read strategic brain dump.
Written for marketers who want real solutions to a leaking pipeline (and their dark circles).
Want to read more from us?


I’m looking for…

LinkedIn Pixel Tracking: How to Set Up and Optimize Conversions for B2B Campaigns
Learn LinkedIn pixel tracking setup, conversion optimization, Insight Tag best practices, and B2B attribution strategies with Factors.ai.
.avif)
TL;DR
- LinkedIn pixel tracking relies on the LinkedIn Insight Tag, a free sitewide JavaScript snippet that connects ad clicks to real conversion events on your website.
- B2B campaigns need longer attribution windows and deeper conversion events than most teams initially configure, because buying cycles stretch across weeks and multiple stakeholders.
- Install the Insight Tag once sitewide, then create conversion actions tied to actual revenue moments like demo requests and sales-qualified meetings, not just page views.
- Pixel tracking alone can't tell you which accounts converted, how multi-touch journeys unfolded, or how pipeline actually progressed, so it needs to be paired with account-level attribution.
- Factors.ai fills those gaps by connecting LinkedIn data to company-level intelligence, CRM pipeline stages, and cross-channel journey maps.
Have you heard of optimism? No, not the normal kind.
I’m talking about the kind of optimism that shines bright like a diamond right after launching LinkedIn ads. The campaign is live, impressions are rolling in, clicks are happening, and everyone feels like momentum has officially arrived. Screenshots of early numbers get dropped into Slack. Someone says, Oooh! That looks promising.” Spirits are high, budgets feel justified, beer is cold, life is good.
Then a few weeks later, reality enters the chat.
Someone asks how many qualified leads came through. Or how many demo requests can be tied to the campaign? Or whether the spend is actually producing pipeline. And suddenly the room is full of sad vibes, guesses, warm beers, and one person nervously refreshing the dashboard.
Because visibility is not the same thing as measurement.
This is where a lot of B2B teams get humbled. They launch campaigns before setting up proper LinkedIn pixel tracking, which means they can see surface-level activity but not the actions that matter after the click. Website visits show up. Maybe engagement looks healthy. But without accurate tracking, you’re basically paying to generate suspense.
And suspense is a terrible reporting metric.
This blog will help you set up LinkedIn pixel tracking the right way, from installing the Insight Tag to configuring meaningful conversion events, fixing common tracking issues, and understanding where pixel data helps versus where it falls short. If you’re investing serious money into LinkedIn ads, this is the difference between “we think it’s working” and “we know it is.”
What is LinkedIn pixel tracking?
When marketers talk about "LinkedIn pixel tracking," they're almost always referring to the LinkedIn Insight Tag. It's a lightweight JavaScript snippet you install on your website, and it works as LinkedIn's primary conversion tracking tool. Once it's live, the tag monitors what visitors do after they click or view your LinkedIn ads, then reports that activity back to Campaign Manager.
The concept is straightforward. Someone sees your ad, clicks through to your site, and takes an action you care about. The Insight Tag captures that action and ties it back to the campaign, audience, and creative that drove the visit. Without it, LinkedIn only knows that a click happened. With it, LinkedIn knows what that click led to.
For B2B teams, the actions worth tracking tend to follow a pattern. Demo requests sit at the top of the list, followed by contact form submissions, pricing page visits, whitepaper downloads, and webinar signups. These aren't impulse purchases. They're signals that someone is actively evaluating your product, and they often happen hours or days after the initial ad interaction. The Insight Tag connects those delayed actions back to the original campaign so you can measure what's actually driving business outcomes, not just traffic.
It's worth noting that LinkedIn officially calls this the Insight Tag, not a tracking pixel. The term "pixel" is borrowed from the Facebook and Meta advertising world, where a small invisible image (literally a pixel) was used to fire tracking events. LinkedIn's approach is technically a JavaScript tag, not an image pixel, but the marketing world has collectively decided to call every platform's website tracker a "pixel." You'll hear both terms used interchangeably, and for practical purposes, they refer to the same thing. If you've been searching for "linkedin tracking pixel," you've been looking for the Insight Tag all along.
The tag does wayyy more than just count conversions, though. It also powers LinkedIn's website retargeting audiences, allowing you to show follow-up ads to people who visited specific pages. It feeds the website demographics report, which shows you the professional profiles of your site visitors by job title, industry, company size, and seniority. And it gives LinkedIn's algorithm the conversion signals it needs to optimize campaign delivery toward people who are more likely to take the actions you care about.
All of that functionality comes from one tag installed once across your entire site. You don't need separate tags for each page or each campaign, which is one of the genuinely elegant things about LinkedIn's approach.
How does LinkedIn pixel tracking work for B2B campaigns?
The basic mechanics of LinkedIn pixel tracking are simple enough. A prospect sees your ad in their LinkedIn feed, clicks through to your website, and eventually takes some kind of action. The Insight Tag fires, LinkedIn registers the conversion, and Campaign Manager attributes it back to the right campaign based on your selected attribution window. On paper, it sounds like any other ad platform's tracking flow.
But B2B is where the story gets more interesting, and more complicated. The gap between a click and a meaningful business outcome is enormous compared to ecommerce or consumer advertising. When someone clicks a DTC ad and buys a pair of trainers twenty minutes later, the attribution is clean and immediate. When someone clicks a B2B ad and eventually becomes a $50,000 deal, the journey between those two moments is long, messy, and involves a lot of people your ad never touched directly.
Consider this scenario: A VP of Marketing sees your sponsored content on a Tuesday morning, clicks through to a blog post, reads for two minutes, and leaves. The following week, she comes back directly and browses the pricing page. Three days after that, she fills out a demo request form. The sales team qualifies the opportunity, and it enters the pipeline forty-five days later. Six months down the line, the deal closes.
Without LinkedIn pixel tracking, that entire chain is invisible. Campaign Manager shows one click and zero conversions. The campaign looks average at best, and someone on the team starts questioning whether LinkedIn ads are worth the budget. With proper tracking and a sensible attribution window, LinkedIn can connect that demo request back to the original ad click. Suddenly the campaign doesn't just look average. It looks like the thing that started a real pipeline opportunity.
This is why B2B teams need pixel tracking more urgently than most. The buying cycles are long, often stretching across weeks or months. Multiple stakeholders get involved, and the person who clicked the ad might not even be the person who fills out the form. Decision-making is distributed across teams, which means the path from first touch to closed deal is rarely a straight line. LinkedIn pixel tracking won't capture every twist in that journey, but it captures the critical first connection between ad exposure and on-site action.
The attribution windows you select matter enormously here. LinkedIn lets you choose how far back a conversion can be credited to an ad interaction. For B2B, the default settings are often too short. If your average sales cycle is sixty days and your attribution window is seven days, you're systematically undercounting the impact of campaigns that plant seeds early in the buying process. Matching your attribution window to the reality of your sales cycle is one of the most important configuration decisions you'll make, and it's one that most teams don't revisit after initial setup.
LinkedIn Insight Tag vs LinkedIn tracking pixel
This comparison trips up a lot of marketers, so let's clear it up quickly. When someone says "LinkedIn tracking pixel," they're referring to the same thing as the LinkedIn Insight Tag. There isn't a separate product called the LinkedIn pixel. The Insight Tag is LinkedIn's one and only website tracking mechanism for advertisers.
The confusion comes from how other platforms work. Meta has the Meta Pixel. Twitter had its tracking pixel. Google has its own tag ecosystem. So when marketers move to LinkedIn, they naturally search for "LinkedIn pixel" because that's the mental model they've built from other channels. LinkedIn chose a different name, calling it the Insight Tag, but the function is essentially the same: it tracks what happens on your site after someone interacts with your ad.
That said, there are a few things the Insight Tag does that go beyond basic pixel-style conversion tracking. Here's a quick comparison to make the distinction clear:
The website demographics feature is particularly useful for B2B. Even before you start tracking conversions, the Insight Tag gives you a professional breakdown of who's visiting your site. You can see whether your LinkedIn campaigns are driving the right seniority levels, whether the industries match your ICP, and whether company sizes align with your target segments. It's like a lightweight firmographic report layered on top of your website analytics.
The retargeting capability deserves a mention too. Once the Insight Tag has been active long enough to build audience pools, you can create retargeting segments based on specific page visits. Someone who visited your pricing page but didn't convert? That's a retargeting audience. Someone who read three blog posts in a week? Another audience. These segments become the building blocks for more sophisticated LinkedIn campaigns down the line.
So when you hear "LinkedIn tracking pixel" and "LinkedIn Insight Tag," just know they're pointing at the same thing. The Insight Tag is the official name, the pixel is the colloquial one, and there's no functional difference to worry about.
How do you set up LinkedIn pixel tracking step by step?
The LinkedIn pixel setup process is more straightforward than most teams expect, but the details matter. A tag that's installed but misconfigured is arguably worse than no tag at all, because it gives you false confidence in data that isn't accurate. Here's the full walkthrough.
Step 1: Install the Insight Tag
Start in LinkedIn Campaign Manager. Navigate to the "Analyse" section, then open "Insight Tag" (in some account layouts, you'll find this under the "Signals Manager" or "Data" section, as LinkedIn occasionally updates the Campaign Manager interface). You'll see a JavaScript code snippet ready to copy.
You have three main options for installation:
- Google Tag Manager (GTM): This is the most common method for marketing teams. Create a new tag in GTM, select the LinkedIn Insight Tag template from the community gallery, paste your partner ID, and set it to fire on all pages. GTM makes it easy to manage without developer involvement, and it keeps all your tracking tags in one place.
- Direct CMS installation: If you're running WordPress, HubSpot, Webflow, or another CMS with header script injection, you can paste the Insight Tag code directly into the site-wide header. Most CMS platforms have a dedicated section for tracking scripts, usually under settings or integrations.
- Developer deployment: For custom-built websites or more complex setups, hand the code snippet to your development team and ask them to place it in the global header template. The tag needs to load on every page across the entire domain.
One important point: LinkedIn states that a single sitewide installation of the Insight Tag is sufficient. You don't need separate tags for different pages, subdomains, or campaigns. One tag does everything, and installing it multiple times on the same page actually causes problems (more on that in the troubleshooting section).
Step 2: Verify tag status
After installation, go back to Campaign Manager and check the Insight Tag status. It takes a few minutes to a few hours for LinkedIn to recognise the tag and mark it as "Active." If it still shows "Unverified" after twenty-four hours, something went wrong in the installation. Common culprits include consent management platforms blocking the tag, caching layers serving the old version of your site, or the tag being installed in the body instead of the header.
You can also use browser developer tools or extensions like the LinkedIn Insight Tag Helper (a Chrome extension) to verify that the tag is firing correctly on page load. This is worth doing even after you see the "Active" status, because it confirms the tag is actually loading in the browser environment your visitors experience.
Step 3: Create conversion actions
This is where the real value begins. Go to the "Conversions" section in Campaign Manager and create new conversion actions. Each conversion action represents a specific event you want to track. You'll typically define these based on URL rules, meaning you're telling LinkedIn to register a conversion when someone lands on a specific thank-you or confirmation page.
Here are the conversion actions most B2B teams should create:
- Demo request confirmation page: The page a visitor sees after submitting a demo form. This is your highest-value conversion for most SaaS businesses.
- Contact form thank-you page: For general "contact sales" or "talk to an expert" submissions.
- Resource download confirmation: The page shown after someone downloads a whitepaper, ebook, or guide.
- Trial signup confirmation: If you offer a free trial or freemium product, track the signup completion.
- Webinar registration confirmation: For event-based campaigns, track the registration rather than just the landing page visit.
For each conversion, you'll set the URL match rule (exact URL, starts with, or contains), choose the conversion type (lead, purchase, signup, etc.), and set the attribution window. For B2B, consider setting longer attribution windows than the defaults. A 30-day post-click window captures more of the delayed actions that are typical in longer buying cycles.
Step 4: Associate conversions to campaigns
Creating conversion actions doesn't automatically connect them to your campaigns. You need to explicitly attach each conversion goal to the relevant campaigns in Campaign Manager. When you create or edit a campaign, there's a conversion tracking section where you select which conversion actions apply. This step is easy to forget, and it's one of the most common reasons teams see zero conversions despite having a working tag.
Make sure you match the right conversions to the right campaigns. A brand awareness campaign probably shouldn't be optimized toward demo requests. A demand generation campaign focused on bottom-of-funnel audiences should. Aligning campaign objectives with appropriate conversion events gives LinkedIn's algorithm the right signals to optimize delivery.
Step 5: Test everything
Don't trust the setup until you've tested it end to end. Open your website in a browser, navigate to one of your conversion pages (or submit a test form to reach the confirmation page), and check whether the conversion registers in Campaign Manager. Keep in mind that conversions can take a few hours to appear in reporting, so don't panic if it's not instant.
Use the LinkedIn Insight Tag browser extension to confirm the tag fires on the conversion page. Check your GTM debug mode if you're using Tag Manager. Submit a real test lead through each form to make sure the full flow works, from form submission to thank-you page to LinkedIn conversion registration.
It's a bit tedious, but testing each conversion path individually catches configuration errors that would otherwise go unnoticed for weeks. Nothing's worse than running a campaign for a month and then discovering that your "demo booked" conversion was pointing at the wrong URL.
What are the best conversion events to track for B2B?
Not all conversions are created equal, and one of the biggest mistakes B2B teams make is tracking too few events. Most teams set up a single "lead" conversion and call it done, which means they're blind to everything that happens between a first visit and a form submission. The best approach is to think in tiers, with events mapped to different stages of the buying journey.
- Primary revenue events
These are the conversions closest to actual revenue. They represent moments where someone has signalled genuine purchase intent and your sales team should be getting involved. Track these first, and give them the highest priority in your reporting.
- Demo requests: The single most important conversion for most B2B SaaS companies. Someone asking to see the product in action is as close to a hand-raise as you'll get from a website visit.
- Contact sales submissions: Similar to demo requests but framed as a direct conversation. These tend to come from buyers who are further along in their evaluation.
- Qualified trial signups: If your product has a free trial, the signup itself is a conversion event. But if you can, track the "qualified" version, the signup that passes your lead scoring threshold, rather than every random signup.
- Booked meetings: If your site uses a scheduling tool like Calendly or Chili Piper, the confirmation page after a meeting is booked is a strong conversion event to capture.
- Mid-funnel events
These events don't represent an immediate sales opportunity, but they indicate that someone is actively evaluating options and comparing solutions. Tracking them gives you visibility into the research phase of the buying journey, which is where B2B prospects spend most of their time.
- Pricing page visits: Someone checking your pricing is doing mental math about whether your product fits their budget. It's one of the strongest intent signals available on most B2B websites.
- ROI calculator completions: If you have a value calculator or ROI estimator, completion events show that a prospect is trying to build a business case internally.
- Webinar registrations: Registering for a product-focused webinar indicates a willingness to invest time in learning about your solution, which is a much stronger signal than just viewing a landing page.
- Product comparison page views: If you have "us vs competitor" pages, visits there suggest active evaluation and competitive consideration.
- Top-of-funnel events
These are the lightest-touch events, useful for understanding campaign reach and early engagement. They won't drive pipeline attribution directly, but they give LinkedIn's algorithm broader data to work with and they help you build retargeting audiences.
- Ebook or guide downloads. Content downloads show interest in the topic area, even if the person isn't ready to buy anything yet.
- Newsletter signups. Subscribing to ongoing content is a low-commitment action, but it shows someone wants to stay in your orbit.
- Video completions or engaged sessions. If you can configure events based on time-on-page thresholds or video watch percentage, these capture meaningful engagement beyond a simple page view.
The trap most B2B teams fall into is tracking only the primary events and ignoring everything else. When you only measure demo requests, you miss the dozens of pricing page visits and content downloads that signal growing interest within target accounts. Those mid-funnel and top-funnel events are your early warning system. They tell you which campaigns are warming up future pipeline even when the demo numbers haven't moved yet.
Think of it like weather forecasting. Demo requests are the rain. Mid-funnel events are the clouds forming. If you only look at whether it rained today, you'll never see the storm building for next week.
How do you optimize LinkedIn conversions after setup?
Getting the Insight Tag installed and conversion events configured is just the starting line. The real work is what you do with the data once it starts flowing. Most teams treat conversion tracking as a set-and-forget task, which means they end up optimizing campaigns based on surface-level metrics that don't tell the full story.
- Use higher-quality events as your optimisation targets
LinkedIn's campaign algorithms optimize delivery toward the conversion events you select. If you tell LinkedIn to optimize toward "page views," it'll find people who visit pages. That's technically a conversion, but it doesn't mean anything for your pipeline. The better approach is to optimize toward the highest-quality event you have enough volume for.
Demo requests are the ideal optimisation target for most B2B demand generation campaigns. If you don't have enough demo volume to give LinkedIn's algorithm a clear signal (you generally need at least fifteen to twenty conversions per week), step down to the next tier. Pricing page visits or webinar registrations can work as proxy events until your volume is high enough for direct optimisation toward revenue events.
The key principle is simple: optimize toward the closest possible signal to actual revenue. Every step you move away from revenue, the more noise enters the system. LinkedIn will dutifully find people who download ebooks all day long, but that won't help if none of those people ever talk to your sales team.
- Separate campaign goals clearly
One of the most common optimisation mistakes is running every LinkedIn campaign toward the same conversion goal. Brand awareness campaigns, demand generation campaigns, and account-based marketing campaigns all serve different purposes, and they should be measured against different events.
Awareness campaigns should be judged on engagement signals: video views, social engagement, and reach among your target audience. Expecting demo requests from a brand awareness campaign is like expecting someone to propose on the first date. It happens occasionally, but it's not a reasonable baseline.
Demand generation campaigns should track leads and demo requests. These campaigns are designed to drive action from people who already have some familiarity with the problem you solve and the category you operate in.
ABM campaigns, targeting specific accounts, should track pipeline-level actions. Booked meetings, opportunity creation, and progression through sales stages matter more here than raw lead count. You're fishing with a spear, not a net, so the metrics need to be proportionally precise.
- Use attribution windows that match your sales cycle
LinkedIn's default attribution windows work fine for short-cycle purchases, but B2B sales rarely close quickly. If your average time from first touch to demo request is three weeks, a seven-day attribution window will systematically miss conversions that your campaigns actually influenced. Most B2B teams should test longer post-click windows, ideally 30 days, and compare what the data looks like across different window lengths.
Longer windows introduce more ambiguity, that's the trade-off. A conversion attributed 28 days after a click isn't as cleanly connected as one that happened within an hour. But in B2B, where research and evaluation happen over extended periods, short windows create a false picture. They make it look like campaigns aren't working when they are, and that leads to premature budget cuts on channels that are actually building pipeline.
- Feed data back into your campaigns
Conversion data shouldn't just sit in a report. It should actively shape what you do next. Use your conversion data to build retargeting audiences: people who visited the pricing page but didn't convert, people who downloaded content but haven't booked a demo, people who started a form but abandoned it midway.
Equally important, use audience exclusions. If someone already became a customer, stop showing them demand gen ads. If a lead already booked a demo, exclude them from the top-of-funnel campaign that brought them in. These seem like small optimisations, but they compound over time, reducing wasted spend and improving conversion rates across the board.
- Watch cost per opportunity, not just cost per lead
This is where most LinkedIn ads conversations go sideways. Cost per lead (CPL) is the metric everyone looks at first, and it's the metric that causes the most bad decisions. A campaign generating leads at £40 each sounds better than one generating leads at £120 each. But if the £40 leads never convert to pipeline and the £120 leads have a 30% opportunity rate, the "expensive" campaign is actually five times more efficient.
The metric that matters for B2B is cost per opportunity, or even better, cost per qualified pipeline dollar. Getting there requires connecting your LinkedIn conversion data to your CRM, which is where simple pixel tracking starts to show its limitations. But even without a perfect CRM sync, you can start by manually comparing campaign-level conversion data against sales outcomes on a monthly cadence. It's not automated, but it's clarifying. You'll quickly learn which campaigns produce leads that actually go somewhere and which ones just inflate the dashboard.
Common LinkedIn pixel tracking problems (and how to fix them)
Even when the setup process goes smoothly, LinkedIn pixel tracking has a knack for breaking in subtle ways. The tag might be installed correctly but still produce misleading data, or it might silently stop working after a site update. Here are the issues B2B teams run into most often, along with the fixes.
Problem 1: No conversions showing in Campaign Manager
This is the most common complaint, and it usually comes from one of three causes.
- The tag is inactive or unverified
Go to Campaign Manager and check the Insight Tag status. If it doesn't say "Active," the tag isn't firing on your site. Common reasons include consent management platforms blocking the script, caching layers serving an old version of the page, or the tag being placed in the wrong section of the HTML.
- URL rules are misconfigured
Your conversion action is set to trigger when someone hits a specific URL, but the actual URL doesn't match your rule. This often happens with dynamic query parameters, trailing slashes, or HTTPS/HTTP mismatches. Double-check the exact URL of your thank-you page in a browser and compare it character by character against your conversion rule.
- Conversions aren't mapped to the right campaigns
You created the conversion action but forgot to attach it to the campaigns that should be tracking it. This is embarrassingly easy to overlook, especially when you're launching multiple campaigns at once.
Problem 2: Duplicate conversions
Seeing inflated conversion numbers? The usual culprits are straightforward.
- Multiple Insight Tags on the same page
This happens when someone installs the tag via GTM and also has it hardcoded in the site header. Both fire on every page load, so every conversion gets counted twice. Audit your page source and GTM container to make sure only one instance exists.
- Duplicate GTM triggers
Even with a single tag, your GTM configuration might have multiple triggers that cause the same conversion event to fire more than once. Check your trigger setup and make sure there's no overlap between page-view triggers, form-submission triggers, and custom event triggers.
Problem 3: Low match rates
LinkedIn might report that your tag is active and conversions are being tracked, but the match rate between site visitors and LinkedIn members seems suspiciously low. A few things could be happening.
- Consent banners are blocking the tag
If you've implemented a cookie consent platform (as GDPR and other regulations require), the Insight Tag might only load for visitors who actively accept tracking cookies. Depending on your audience's consent behaviour, this could dramatically reduce your trackable population. There's no easy fix here without compromising compliance, but it's important to understand the data gap.
- Cross-domain issues
If your website spans multiple domains or subdomains and the Insight Tag is only installed on some of them, you'll lose tracking continuity when visitors navigate between domains. Make sure the tag is present on every domain where conversions can happen.
- Single-page application (SPA) routing problems
SPAs built with React, Angular, or Vue often handle page navigation without full page reloads. Since the Insight Tag typically fires on page load, SPA route changes might not trigger it. You'll need to configure virtual pageviews in GTM or use LinkedIn's event-specific tracking to capture conversions in SPA environments.
Problem 4: Leads tracked but no pipeline visibility
This isn't strictly a pixel tracking problem, but it's the one that frustrates B2B teams the most. You can see conversions in Campaign Manager, but you have no idea which of those leads turned into real opportunities. The pixel tells you someone filled out a form, but it can't tell you whether the sales team qualified that lead, whether an opportunity was created, or whether the deal progressed through pipeline stages.
The fix here isn't a pixel configuration. It's a process and tooling change. You need to connect your LinkedIn conversion data to your CRM, either through a direct integration, a CDP, or a multi-touch attribution platform. Without that connection, you're measuring the first few seconds of a relationship that might last months, and making budget decisions based on an incomplete picture. This limitation is fundamental enough that it deserves its own section, which is exactly where we're headed next.
Why pixel tracking alone isn't enough for B2B
LinkedIn pixel tracking is necessary, and every team running LinkedIn ads should have it configured properly. But calling it sufficient for B2B attribution would be a stretch, a generous one at that. The pixel captures a specific type of data, website events triggered by known conversion rules, and it does that job well. What it can't do is fill in the rest of the picture that B2B marketing and sales teams need.
- The first gap is identity. The Insight Tag tracks events at the individual browser level, but B2B buying decisions happen at the account level. Knowing that someone submitted a demo request is useful. Knowing that three people from the same target account visited your pricing page, attended a webinar, and then submitted a demo request is a fundamentally different insight. Pixel tracking doesn't connect those dots.
- The second gap is the multi-touch journey. Most B2B buyers interact with your brand across multiple channels before they convert. They might discover you through a Google search, read an organic blog post, see a LinkedIn ad a week later, attend a webinar the following month, and finally book a demo after a direct visit. The LinkedIn pixel only sees the LinkedIn portion of that journey. It can't tell you about the Google search, the organic post, or the webinar that all contributed to the conversion. Without a cross-channel view, you'll overvalue some channels and undervalue others.
- The third gap is what happens after the form submission. Pixel tracking stops at the website event. It doesn't know whether the lead was qualified, whether an opportunity was created, whether the deal moved to proposal stage, or whether it eventually closed. For B2B teams, the website conversion is the beginning of the sales process, not the end of it. Measuring only up to that point is like judging a film by the opening scene.
There's also the offline world to consider. B2B deals are influenced by events, dinners, conferences, direct sales outreach, and channel partner introductions. None of those touchpoints appear in pixel data, but they all shape whether a deal happens and how fast it moves through the pipeline. Attribution debates in B2B sometimes resemble group projects where everyone claims credit for the final presentation. The pixel only represents one team member's contribution.
None of this means pixel tracking is useless… it's the foundation that everything else builds on. But treating it as the complete attribution solution for B2B leads to incomplete data, misallocated budgets, and an ongoing argument between marketing and sales about what's actually driving revenue. The teams that get the most from LinkedIn ads are the ones that combine pixel-level tracking with account intelligence, CRM data, and multi-touch attribution.
How does Factors.ai improve LinkedIn conversion tracking?
This is where the conversation shifts from what happened on the website to why it mattered for the business. LinkedIn pixel tracking captures the event. Factors.ai helps you understand the context, the account, the journey, and the revenue impact around that event. The two work together, not as replacements for each other but as layers that build a complete picture.
- Company-level attribution
The Insight Tag tells you that someone converted. Factors.ai tells you which company that someone belongs to. Instead of seeing anonymous conversion counts in Campaign Manager, you see which target accounts are engaging with your campaigns. That transforms your reporting from "we got 14 demo requests this month" to "Acme Corp, three people from our top-50 account list, hit the pricing page and booked a demo after seeing Campaign X." Sales teams care about the second version. The first one doesn't give them anything to act on.
- Multi-touch journey mapping
Factors.ai connects LinkedIn activity to what happened across your other channels. You can see that an account's journey started with a Google search, continued with three LinkedIn ad impressions, included a webinar attendance, and ended with a direct demo request. That full-journey view lets you evaluate LinkedIn's role in the bigger picture rather than judging it in isolation. Sometimes LinkedIn is the closer. Sometimes it's the opener. Knowing which role it played changes how you optimize your spend.
- Revenue reporting
Most LinkedIn dashboards stop at cost per lead. Factors.ai connects your ad data to CRM pipeline stages, which means you can report on cost per opportunity, cost per qualified pipeline dollar, and even influenced revenue by campaign. Moving from CPL to pipeline and revenue metrics changes the conversation with leadership. You stop defending clicks and start demonstrating business impact.
- Audience sync
Factors.ai identifies high-intent accounts based on website behaviour, engagement patterns, and firmographic signals. It can then push those account audiences back into LinkedIn for targeted campaigns. Instead of running broad targeting and hoping the right accounts see your ads, you're actively directing budget toward the companies showing real buying signals. It closes the loop between intent data and ad delivery.
- Smarter optimisation
When you know which accounts and which journeys are producing pipeline, you can allocate spend with precision. Double down on the campaigns driving real opportunities. Pull back on the ones generating leads that never progress. optimize toward the signals that correlate with revenue, not just the signals that inflate the dashboard. Factors.ai gives you the data to make those calls confidently rather than guessing based on incomplete pixel data.
LinkedIn pixel tracking tells you what happened. Factors.ai helps you understand why it mattered and where to go next. For B2B teams that are serious about connecting ad spend to revenue, the combination is where the real leverage lives.
In a nutshell
LinkedIn pixel tracking, built on the Insight Tag, is the non-negotiable starting point for any B2B team spending budget on LinkedIn ads. Without it, you're paying for clicks and hoping for the best. With it, you can connect campaigns to real website actions like demo requests, pricing page visits, and content downloads.
The setup itself is manageable: one sitewide tag installation, a set of well-defined conversion actions, proper campaign mapping, and thorough testing. Where most teams fall short isn't the installation, it's what comes after. Choosing the right conversion events across primary, mid-funnel, and top-funnel tiers gives you a much richer picture of campaign performance than tracking only demo requests. Matching attribution windows to your actual B2B sales cycle prevents you from undercounting conversions that happen on a delayed timeline. optimizing toward pipeline-quality metrics rather than cost per lead keeps your budget focused on what moves revenue.
The honest limitation is that pixel tracking alone can't answer every question B2B teams need answered. It doesn't tell you which accounts are behind the conversions. It doesn't show the cross-channel journey that led up to the website event. And it doesn't track what happens in the CRM after the form was submitted. That's where tools like Factors.ai come in, layering account-level identity, multi-touch journey data, and revenue attribution on top of the pixel foundation.
If you're running LinkedIn ads today, make sure the Insight Tag is active, your conversion events are properly configured, and your attribution windows reflect how your buyers actually buy. Then connect that data to your CRM and account intelligence tools so you can move from counting leads to measuring pipeline. That's the sequence that turns LinkedIn from an expensive guessing game into a channel you can optimize with confidence.
Frequently asked questions about LinkedIn pixel tracking
Q1. What is LinkedIn pixel tracking?
LinkedIn pixel tracking typically refers to the LinkedIn Insight Tag, which is a JavaScript snippet you install on your website. It tracks conversions, builds retargeting audiences, provides website demographic data, and measures the impact of your LinkedIn ad campaigns. The term "pixel" is informal, but it points to the same official feature LinkedIn calls the Insight Tag.
Q2. Is LinkedIn pixel tracking free?
Yes. The Insight Tag is completely free to install and use. You can find it inside LinkedIn Campaign Manager under the Analyse or Signals Manager section.
Q3. What is the difference between the LinkedIn Insight Tag and a LinkedIn Pixel?
Technically, they are the same thing. While other platforms like Meta use an "image pixel," LinkedIn uses a JavaScript snippet called the Insight Tag. Marketers often use the terms interchangeably to describe the tracking code that connects website actions back to LinkedIn ad campaigns.
Q4. How do I verify if my LinkedIn Insight Tag is working?
Once installed, check the "Insight Tag" section under Analyse in LinkedIn Campaign Manager. The status should move from "Unverified" to "Active." For real-time verification, use the LinkedIn Insight Tag Helper Chrome extension, which shows you exactly which tags and conversion events are firing on any given page.
Q5. Why aren't my LinkedIn conversions showing up in Campaign Manager?
The most common reasons are:
- Missing Association: You created the conversion but didn't "attach" it to the specific campaign in the campaign settings.
- URL Mismatch: Your "Thank You" page URL doesn't exactly match the rule you set (e.g., HTTPS vs. HTTP or trailing slashes).
- Attribution Window: The conversion happened outside your selected window (e.g., a lead converted 40 days after a click, but your window is set to 30 days).
Q6. What is the best attribution window for B2B LinkedIn ads?
Because B2B buying cycles are long, a 30-day post-click and 7-day view-through window is a recommended starting point. Short windows (like 1-day or 7-day) often fail to capture the research-heavy nature of B2B sales, where a prospect may click an ad today but not request a demo for two weeks.
Q7. Can LinkedIn pixel tracking tell me which companies are visiting my site?
Yes, through the Website Demographics feature. By installing the Insight Tag, LinkedIn can provide a professional breakdown of your website visitors by company name, industry, job seniority, and company size—even if they haven’t filled out a form.
Q8. Do I need to install the Insight Tag on every page?
Yes. For the best data, the tag should be placed in your website’s global header so it loads sitewide. This allows you to track full journeys, build retargeting audiences based on specific page visits (like your pricing page), and see a complete picture of your website demographics.
Q9. Why does LinkedIn pixel tracking report more conversions than my CRM?
This usually happens because LinkedIn uses cross-device tracking and different attribution logic. For example, if a user clicks an ad on mobile but completes the form on a desktop later that day, LinkedIn will claim the conversion. Additionally, LinkedIn may count every form submission, while your CRM may deduplicate leads.
Q10. How do I track conversions in a Single Page Application (SPA)?
Since SPAs (built with React or Vue) don't have traditional page reloads, the Insight Tag may not fire on navigation. You should use Google Tag Manager to trigger the tag on "History Change" events or use LinkedIn's Event-Specific Image Pixel to track button clicks manually.

Best Conversion Tracking Tools for B2B
Explore the best conversion tracking tools for B2B marketers. Compare features, attribution models, and tools like Factors.ai to track pipeline, not just clicks.
TL;DR
- Most conversion tracking tools were built for e-commerce clicks, not B2B buying journeys that involve multiple stakeholders, channels, and months of consideration.
- The best conversion tracking tools for B2B go beyond last-click metrics to offer account-level tracking, multi-touch attribution, and pipeline visibility.
- Factors.ai leads the pack for B2B SaaS teams that need to connect marketing activity directly to revenue, while GA4 and HubSpot serve earlier-stage needs.
- Choosing the right tool depends on your sales cycle complexity, data maturity, and whether you're optimizing for leads or actual pipeline.
It's Monday morning… you're in a pipeline review, coffee in hand, and marketing walks in, proud as ever about last quarter's LinkedIn campaign. Four hundred leads, they say. Sales looks up from their laptops with the kind of energy that says, "What leads?" The CMO asks for attribution data. Someone pulls up a spreadsheet. It was last updated three weeks ago. Everyone leaves the room frustrated, and the only thing that got resolved was the seating arrangement.
This happens every single week in B2B companies, and it almost always traces back to the same root cause: the conversion tracking setup wasn't built for how B2B buying actually works. Most teams are still measuring clicks and form fills, while the question that actually matters, which marketing activities are building pipeline, goes completely unanswered.
Here's the thing about conversion tracking in B2B: most of the tools that exist were built for e-commerce. Quick purchases, one-touch journeys, easy attribution. B2B couldn't be more different. Your buyers involve multiple stakeholders, take months to decide, and touch fifteen different pieces of content before someone fills out a demo form. Last-click attribution in that world isn't just incomplete. It's actively misleading.
Finding the right conversion tracking tools for your B2B team isn't just a martech checkbox. It's the difference between optimizing for numbers that look good in slides and optimizing for revenue that shows up in your pipeline. This guide breaks down what B2B marketers should actually look for in a conversion tracking platform, compares the top options available in 2026, and helps you figure out which one fits where you are right now.
What are conversion tracking tools, and why should you care about them?
At the simplest level, conversion tracking tools measure when a user takes a desired action. That action could be filling out a form, booking a demo, starting a trial, or completing a purchase. The tool records that event, ties it back to a source, and gives you a data point to evaluate your marketing.
That's the textbook definition, and it's accurate as far as it goes... the problem is it doesn't go far enough for B2B.
B2B buying journeys don't follow a neat path from ad click to conversion. A prospect might see your LinkedIn ad in January, visit your website anonymously in February, attend a webinar in March, and finally book a demo in April after a colleague forwards them a case study. The "conversion" happened in April, but the journey started months earlier across multiple channels and multiple people at the same account.
This is where conversion tracking software has had to evolve. The best tools today don't just record isolated events; they stitch together multi-touch journeys, track conversions across channels like LinkedIn, Google, your website, and your CRM, and present a connected picture of how accounts move through your funnel. They've shifted from tracking individual lead actions to understanding account-level buying behavior.
There's also been a meaningful shift in what counts as a ‘conversion’ worth tracking. For a long time, the default metric was a marketing-qualified lead, basically someone who filled out a form or hit a lead score threshold. But B2B teams are increasingly realizing that leads are a means to an end, not the end itself. The conversions that matter are pipeline creation, opportunity progression, and closed revenue.
Most conversion tracking platforms still measure activity well enough. Very few measure actual business impact. That gap is the reason this category has exploded with new tools in the last few years, and it's the lens through which you should evaluate everything on this list.
Why is conversion tracking fundamentally broken for B2B?
If conversion tracking tools already exist in abundance, why do so many B2B marketers still feel like they're flying blind? The answer lies in how B2B buying actually works versus what most tracking tools were designed to handle.
B2B sales cycles are long. Depending on deal size and industry, you're looking at anywhere from 30 to 180 days between first touch and closed deal. That's not a single session journey. It's months of interactions scattered across channels, devices, and people.
Those journeys are also multi-touch in a way that makes attribution genuinely difficult. A single deal might involve a paid ad impression, an organic blog visit, a webinar registration, a direct sales outreach, an event interaction, and a pricing page visit. Each of those touchpoints played a role, but most tracking setups only capture a fraction of them.
And then there's the multi-stakeholder problem. B2B purchases aren't made by individuals. They're made by buying committees, groups of three to ten people who research, evaluate, and decide collectively. Your tracking might capture the person who booked the demo, but it completely misses the VP who read your blog, the director who watched your webinar, and the CFO who reviewed your pricing page. All of those interactions influenced the deal, yet they're invisible in most systems.
Traditional conversion tracking tools struggle with these realities for a few specific reasons:
1. Last-click bias dominates
Most default attribution in ad platforms and analytics tools credits the final touchpoint before conversion. In a 90-day B2B journey with 15 touchpoints, that means 14 of them get zero credit. The LinkedIn ad that introduced the account gets nothing because Google branded search was the last click.
2. Anonymous traffic is a black hole
A significant portion of your website visitors don't identify themselves. They browse, read, compare, and leave without filling out a form. In B2C, that's an acceptable loss. In B2B, those anonymous visitors often represent high-intent accounts doing active research, and you've got no visibility into them.
3. Account-level aggregation doesn't exist
Most tools track individual users, not accounts. When five people from the same company visit your site, that shows up as five separate sessions with no connection between them. You can't see that Acme Corp is in a buying cycle because your tracking doesn't think in accounts.
4. CRM data lives in a different universe
Your ad platforms know about clicks, your website analytics knows about sessions, your CRM knows about deals… but these systems don’t really talk to each other. The result is fragmented data, making it impossible for marketing to prove its impact on the pipeline and for sales to see which marketing activities influenced their deals.
The downstream effect of all this is kinda predictable. Marketers end up optimizing for cost per lead instead of pipeline contribution; high-intent accounts go unnoticed because they haven't filled out a form yet, and quarterly reviews turn into debates about which channel "deserves" credit rather than productive conversations about what's actually working.
The best conversion tracking tools solve this gap, but they solve it differently. Some focus on stitching together the data layer. Others focus on attribution modeling. A few try to do both. Understanding where each tool sits on that spectrum is what separates a good martech decision from an expensive one.
What should you look for in the best conversion tracking tools?
Before jumping into specific products, it's worth establishing what actually makes a conversion tracking tool good for B2B. The criteria are different from what you'd prioritise for an e-commerce store or a consumer app, and using the wrong evaluation framework is how teams end up with shiny tools that don't answer their real questions.
- Multi-touch attribution support
This is table stakes for any serious B2B conversion tracking tool. You need the ability to distribute credit across multiple touchpoints rather than giving everything to a single interaction. The common models include first-touch (crediting the channel that introduced the account), last-touch (crediting the final interaction before conversion), linear (distributing credit equally), time-decay (giving more credit to recent touches), and W-shaped (weighting first touch, lead creation, and opportunity creation most heavily).
Each model tells you a different story about your funnel. The best multi-touch attribution tools let you toggle between models and compare how the picture changes depending on which lens you use. If a tool only offers last-click, it's not built for B2B complexity.
- Cross-channel tracking
B2B buyers see your LinkedIn ads, visit your website, read your emails, attend your webinars, and interact with your sales team. A conversion tracking platform that only sees one or two of those channels gives you a partial picture at best.
You need tools that can track conversions across channels, pulling data from your ad platforms (LinkedIn Ads, Google Ads), your website, your email marketing, your events, and your CRM into a single unified view. Without cross-channel visibility, you're making budget decisions based on whichever channel happens to have the best tracking, not whichever channel is actually driving the most pipeline.
- Anonymous visitor identification
This is where B2B conversion tracking tools diverge most significantly from B2C ones. In B2B, a large percentage of your website traffic is anonymous, meaning the visitors haven't filled out a form or identified themselves in any way. But many of these visitors are from companies that are actively researching solutions like yours.
Company-level identification (using reverse IP lookup, first-party data enrichment, or similar approaches) lets you see which organisations are visiting your site, even before anyone from that company converts. This is enormously valuable for sales prioritisation and for understanding top-of-funnel marketing impact that traditional tracking misses entirely.
- CRM and ad platform integrations
Your conversion tracking tool needs to play nicely with the systems that already hold your data. At a minimum, that means native integrations with your CRM (Salesforce, HubSpot, or whatever you're running) and your major ad platforms (Google Ads, LinkedIn Ads, and potentially Facebook Ads or others depending on your mix).
These integrations aren't just nice-to-haves. They're what allow you to connect marketing activity to actual sales outcomes. Without a CRM integration, your tracking stops at "they filled out a form." With one, you can follow that interaction all the way to pipeline creation, opportunity progression, and closed revenue.
- Real-time insights and dashboards
Conversion analytics tools that only deliver insights through scheduled reports or data exports aren't built for the speed at which modern marketing teams operate. You need dashboards that show you what's happening now, not what happened last week.
Real-time (or near-real-time) dashboards let you catch underperforming campaigns early, double down on what's working, and respond to shifts in buyer behaviour before they become trends. They also make it dramatically easier to share insights with sales teams and leadership in a format that doesn't require a data analyst to interpret.
- Pipeline and revenue attribution
This is the single most important criterion for B2B teams, and the one where most tools fall short. Tracking a conversion event (form fill, demo booked) is useful, but it's only the midpoint of the story. What you really need to know is which marketing activities are contributing to pipeline creation and closed revenue.
Pipeline attribution tools connect the dots from first marketing touch all the way through to revenue. They can tell you things like "accounts that engaged with our LinkedIn campaign generated 3x more pipeline than accounts that didn't" or "webinar attendees close at a 40% higher rate than non-attendees." That's the kind of insight that actually changes budget allocation decisions.
- Ease of setup and scalability
A conversion tracking tool that requires three months of engineering work to implement isn't practical for most marketing teams. You want something that's reasonably straightforward to set up, doesn't require a dedicated data engineer to maintain, and can scale as your tracking needs grow.
That said, there's often a trade-off between ease of setup and depth of capability. Simpler tools get you running faster but may hit limitations as your attribution needs mature. More powerful tools take longer to implement but can handle complex, multi-source data models. Understanding where you sit on that spectrum helps you make the right choice for your current stage.
Best conversion tracking tools
Here are the best conversion tracking tools for B2B marketers who want to move beyond surface-level metrics. Each tool has a different sweet spot, and the right choice depends on your team's size, sales cycle, and data maturity.
- Factors.ai (best for B2B account-level attribution)
If you're a B2B SaaS company with a complex sales cycle, Factors.ai is purpose-built for the attribution challenges we've been discussing. It tracks the full buyer journey across channels and stitches together a unified picture of how accounts, not just individual leads, engage with your marketing.
The platform offers account-level tracking that identifies which companies are visiting your site and engaging with your content, even before they fill out a form. It supports multiple multi-touch attribution models, so you can compare first-touch, last-touch, linear, and time-decay views side by side. The native integrations with LinkedIn Ads, Google Ads, and major CRMs mean you can connect ad spend directly to pipeline outcomes without manual data stitching.
What really sets Factors.ai apart as a pipeline attribution tool is its ability to unify website activity, ad engagement, and CRM pipeline data in one place. You can see view-through attribution, meaning you'll know when an account was exposed to an ad impression and later converted, even if they didn't click the ad itself. That's a blind spot most other tools completely miss.
The differentiator here is direct: it connects marketing activity to pipeline and revenue, not just to leads or MQLs. For B2B SaaS companies dealing with longer sales cycles and buying committees, that connection is exactly what makes attribution actionable rather than academic.
Best for: B2B SaaS companies with sales cycles longer than 30 days, marketing teams that need to prove pipeline impact, and organisations where account-level visibility matters more than individual lead tracking.
- Google Analytics 4 (best free tool for web tracking)
GA4 is the default web analytics tool for most organisations, and for good reason. It's free, it's ubiquitous, and it handles event-based website tracking quite well. If you need to understand how users behave on your website, which pages they visit, where they drop off, and which traffic sources drive the most sessions, GA4 covers the basics.
The event-based tracking model is a genuine improvement over Universal Analytics. You can define custom conversion events (form submissions, button clicks, page views) and build reports around them without too much technical overhead. The integration with Google Ads is seamless, which makes it easy to track conversions from paid search campaigns.
The limitations show up quickly for B2B teams, though. GA4 doesn't offer native account-level tracking. It can't tell you that five people from the same company visited your pricing page this week. Its attribution modelling is limited and heavily weighted toward Google's own ecosystem. There's no CRM integration out of the box, which means your tracking stops at the website boundary, it can't follow a visitor through to pipeline creation or closed revenue.
GA4 is also not great at handling the long, multi-session journeys that characterise B2B buying. Cookie expirations and cross-device tracking limitations mean the platform often loses continuity on journeys that span weeks or months.
Best for: Early-stage teams that need free, reliable web analytics. It's a solid foundation, but most B2B teams will outgrow it as their attribution needs mature.
- HubSpot (best all-in-one CRM + tracking tool)
HubSpot occupies a unique position because it combines CRM functionality with marketing analytics in a single platform. If your team already runs on HubSpot for CRM, email marketing, and lead management, the built-in conversion tracking is genuinely convenient.
You get lead tracking across forms and landing pages, lifecycle stage reporting, and contact-level attribution reports that show which marketing activities influenced a lead before they converted. The platform tracks email opens, page visits, ad clicks, and form fills, and ties them all back to the contact record in the CRM. That's a level of integration you don't get when your marketing tools and CRM are separate systems.
HubSpot also offers campaign-level attribution reporting in its higher-tier plans. You can see which campaigns contributed to deal creation and revenue, which starts to address the pipeline attribution question. The interface is intuitive, and the learning curve is significantly lower than most enterprise analytics tools.
The limitations are real, however. HubSpot's attribution models are relatively basic compared to dedicated marketing attribution tools. The platform doesn't offer account-level tracking in the way that B2B-specific tools like Factors.ai do. You get contact-level attribution, which is useful but incomplete when you're dealing with buying committees where multiple people from the same company interact with your marketing.
Best for: Mid-market B2B teams that are already using HubSpot's CRM and want integrated tracking without adding another tool to the stack. It's a solid "good enough" option that covers the basics well.
- Adobe Analytics (best for enterprise analytics)
Adobe Analytics is the heavyweight of the web analytics world. It offers deep data segmentation, advanced custom reporting, and the kind of granular data modelling capabilities that enterprise organisations with dedicated analytics teams need.
The platform excels at handling high volumes of data and complex segmentation scenarios. You can build sophisticated analyses around user behaviour, cohort comparisons, and multi-dimensional breakdowns that go well beyond what GA4 or HubSpot can offer. The integration with the broader Adobe Experience Cloud ecosystem (Target, Campaign, Experience Platform) creates a powerful end-to-end analytics stack for large organizations.
The trade-offs are equally significant. Adobe Analytics is expensive, both in licensing costs and in the human resources required to operate it effectively. It's not a tool you hand to a marketing manager and expect them to start pulling insights from on day one. Implementation is complex, and getting meaningful value from it typically requires dedicated analytics professionals or consultants.
For B2B-specific attribution, Adobe Analytics faces similar limitations to GA4. It's fundamentally a web analytics tool, not a B2B attribution platform. Account-level tracking, CRM integration, and pipeline attribution require additional tools or significant custom development.
Best for: Enterprise organizations with large analytics teams and complex data environments who need deep segmentation and custom reporting capabilities.
- Segment (best for data infrastructure)
Segment takes a fundamentally different approach to the conversion tracking problem. Rather than being an analytics or attribution tool, it's a customer data platform (CDP) that acts as the central nervous system for your data infrastructure. It collects data from all your sources, standardizes it, and routes it to whatever downstream tools need it.
The value proposition is straightforward: instead of each tool collecting its own data independently (and creating discrepancies), Segment becomes the single source of truth for event data. It feeds clean, consistent data to your analytics tools, your CRM, your ad platforms, and your data warehouse. For teams dealing with data fragmentation, which is most B2B teams, that's a meaningful capability.
Segment integrates with hundreds of tools, which gives you enormous flexibility in building your tracking stack. It handles identity resolution across devices and sessions, and it's built to scale with high-volume data environments.
The limitation is that Segment isn't a plug-and-play attribution tool. It doesn't give you dashboards, attribution models, or pipeline reports out of the box. It's the plumbing, not the faucet. You still need an analytics layer on top to actually interpret the data. That means it's most valuable for data-heavy teams that have the technical resources to build on top of the infrastructure Segment provides.
Best for: Teams with dedicated data or engineering resources that need a clean, centralised data layer to power their analytics and attribution stack.
- Dreamdata (best for revenue attribution)
Dreamdata is a B2B-focused attribution platform that's built specifically around revenue attribution. Its core promise is connecting every marketing and sales touchpoint to actual revenue outcomes, which makes it a direct answer to the "which marketing activities are generating pipeline?" question.
The platform automatically collects data from your ad platforms, website, CRM, and other marketing tools, then maps it to the customer journey at the account level. It supports multiple attribution models and provides revenue-focused dashboards that let you see which channels, campaigns, and content are driving real business outcomes.
Dreamdata's reporting is geared toward the B2B use case in a way that general-purpose analytics tools aren't. You can see things like average time from first touch to deal close, content influence on pipeline, and channel-level ROI based on actual revenue data. For B2B teams that have moved past lead counting and want to understand true marketing impact, that's a compelling offering.
The catch is that Dreamdata's value depends heavily on the quality of your CRM data. If your Salesforce or HubSpot data is messy, with incomplete deal records, inconsistent lifecycle stages, or spotty activity logging, the attribution outputs will reflect those gaps. The tool is best suited for teams that already have reasonably mature CRM hygiene and are ready to layer sophisticated attribution on top.
Best for: Advanced B2B teams with clean CRM data that want deep, revenue-focused attribution analytics.
- Triple Whale and Northbeam (e-commerce-focused alternatives)
These two tools deserve a mention because they show up frequently in "best conversion tracking tools" lists, and you might encounter them during your evaluation. Both are strong platforms with solid multi-touch attribution capabilities.
However, they're built primarily for e-commerce and direct-to-consumer businesses. Their data models, attribution logic, and integrations are optimised for shorter purchase cycles, individual buyer journeys, and platforms like Shopify and Meta Ads. If your buying cycle involves weeks of consideration, multiple stakeholders, and a CRM-driven sales process, these tools won't map well to your reality.
They're worth noting for cross-vertical awareness, but they shouldn't be on the shortlist for B2B SaaS teams.
How do the top conversion tracking tools compare?
A side-by-side comparison makes the differences between these tools much easier to evaluate. Here's how they stack up across the criteria that matter most for B2B marketers.
A few things that jump out from this comparison:
- First, only two tools on the list (Factors.ai and Dreamdata) offer native account-level tracking, which is arguably the most important capability for B2B teams.
- Second, the gap between free and paid tools isn't just about features, it's about whether you can connect marketing to revenue at all. GA4 is excellent for web behavior, but it has no mechanism to follow a visitor through to a closed deal.
- Third, Segment sits in a different category entirely. It's infrastructure, not analytics, and it's only useful if you have the technical resources to build on top of it.
The right choice depends less on which tool has the most features and more on which tool aligns with your current GTM motion. A Series A startup with two marketers has very different needs than a Series C company running multi-channel campaigns across five countries.
How should you choose the right conversion tracking tool?
Choosing conversion tracking software is less about finding the "objectively best" tool and more about matching the tool to where your team actually is. The best tool for a 10-person startup isn't the same as the best tool for a 500-person enterprise, and buying more capability than you can actually use is a surprisingly common mistake.
Here's how to think through the decision based on your situation.
- If you're early-stage and budget-constrained GA4 paired with your CRM is a reasonable starting point.
You won't get multi-touch attribution or account-level tracking, but you'll have basic web analytics and the ability to track leads through your pipeline. At this stage, the priority is building foundational tracking discipline rather than sophisticated attribution modelling. Make sure your UTM parameters are consistent, your forms are tracked, and your CRM is capturing source data on every lead.
- If you're scaling your ad spend and running campaigns across multiple channels
You've likely already felt the limitations of GA4, you need cross-channel attribution that can show you how LinkedIn, Google, organic, and direct traffic work together. This is where dedicated conversion tracking platforms become necessary. HubSpot's attribution reporting might be enough if you're already on the platform, but if you're running significant ad spend, a tool with deeper attribution modeling is worth the investment.
- If you're an enterprise organisation with a data warehouse and dedicated analytics resources, your needs shift toward data infrastructure and customisation
A combination of Segment (for data collection and routing), Adobe Analytics (for deep web analytics), and a B2B attribution tool (for pipeline analytics) might be the right architecture. The trade-off is complexity and cost, but at enterprise scale, that complexity is often justified.
- If you're a B2B SaaS company with a sales cycle longer than 30 days, your primary need is account-level attribution and pipeline visibility
You need to know which accounts are engaging with your marketing, how those accounts move through the funnel, and which marketing activities correlate with pipeline creation. Tools like Factors.ai and Dreamdata are specifically designed for this use case, and they'll give you answers that general-purpose analytics tools simply can't.
The thing is… most B2B teams eventually need more than one tool. You might use GA4 for web analytics, a platform like Factors.ai for account-level attribution, and your CRM for pipeline tracking. The question isn't which single tool does everything. It's which combination of tools gives you the clearest picture of what's actually driving revenue.
One more consideration that often gets overlooked: the quality of any conversion tracking tool's output is only as good as the data going into it. Before evaluating platforms, take a hard look at your data foundations. Are your UTMs consistent? Is your CRM data clean? Are your conversion events properly defined? The most sophisticated attribution tool in the world can't compensate for messy inputs.
What are the most common mistakes in conversion tracking?
Even with the right tools in place, conversion tracking can go sideways in predictable ways. These are the mistakes I see B2B teams make most frequently, and they're worth flagging because they're easy to fall into and expensive to ignore.
- Tracking only last-click conversions
This is the default in most ad platforms, and many teams never change it. Last-click attribution tells you which channel happened to be the final touch before someone converted, but it tells you nothing about what introduced that person to your brand, what nurtured their interest, or what drove them to consider you in the first place. In a B2B buying journey with a dozen touchpoints, optimising purely on last click means you'll systematically underfund the channels that create demand and overfund the channels that capture it. That's a recipe for watching your pipeline shrink while your cost per lead looks great.
- Ignoring view-through conversions
View-through attribution tracks when someone was exposed to an ad (saw it, but didn't click) and later converted through a different channel. Many B2B marketers dismiss this as "soft" data, but it's actually critical for understanding the impact of awareness campaigns. Your LinkedIn sponsored content might not generate clicks, but if accounts that see those ads convert at a meaningfully higher rate than accounts that don't, that's valuable signal. Ignoring view-through data means you'll chronically undervalue upper-funnel marketing.
- Keeping ad platform data and CRM data disconnected
This one is remarkably common and remarkably damaging. Your ad platforms know about impressions, clicks, and form fills. Your CRM knows about qualified leads, opportunities, and closed revenue. When these data sets live in separate systems with no connection between them, you can't answer the most important question in B2B marketing: which campaigns are actually generating pipeline? Connecting these systems, either through native integrations or through a tool that bridges them, should be a top priority for any team serious about conversion tracking.
- Measuring leads instead of pipeline
Leads are a proxy metric; they're useful for understanding top-of-funnel volume, but they don't tell you whether your marketing is generating business outcomes. A campaign that produces 500 leads and zero pipeline is worse than a campaign that produces 50 leads and five qualified opportunities. If your conversion tracking stops at lead creation, you're optimizing for a metric that may have no correlation with revenue. The best B2B conversion tracking tools follow the journey past the form fill and into the sales pipeline, which is where the real signal lives.
- Over-relying on a single tool
No single conversion tracking platform captures everything. GA4 misses account-level behavior. Your CRM misses anonymous website traffic. Your ad platforms only see their own channel. Teams that treat any one of these as the complete picture will have blind spots, and those blind spots tend to hide exactly the insights that would change their strategy. The most effective tracking setups combine multiple tools that cover each other's gaps, with a clear understanding of what each tool is (and isn't) responsible for.
Attribution debates sometimes resemble group projects where everyone claims credit for the final result. The difference is that in marketing, the data actually exists to settle the argument. You just need the right tools to surface it.
In a nutshell
Conversion tracking for B2B has moved well beyond counting clicks and form fills, but most teams' tooling hasn't caught up. The core shift is from tracking individual lead events to understanding how accounts move through multi-touch journeys across channels, and connecting that activity to pipeline and revenue.
When evaluating tools, the criteria that matter most for B2B are multi-touch attribution support, account-level tracking, cross-channel visibility, CRM integration, and pipeline attribution. General-purpose tools like GA4 and HubSpot cover the basics well and are the right starting point for earlier-stage teams. For B2B SaaS companies with longer sales cycles and buying committees, purpose-built platforms like Factors.ai and Dreamdata offer the depth of attribution that actually changes budget allocation decisions.
The most common pitfall is treating conversion tracking as a one-tool problem. In practice, most mature B2B teams combine a web analytics tool, a B2B attribution platform, and their CRM to get the complete picture. What matters more than any individual tool is having clean data flowing between them and a clear definition of what "conversion" means for your business.
If your tracking setup still ends at "we got 200 leads this month," you're tracking activity. You aren't tracking conversions, and you aren't tracking impact. The tools to fix that exist. The question is whether your team is ready to use them.
Frequently asked questions about conversion tracking tools
Q1. What is the best conversion tracking tool for B2B?
For B2B specifically, tools like Factors.ai and Dreamdata are purpose-built for the complexities of B2B buying. They offer multi-touch attribution and account-level tracking that general-purpose analytics tools lack. Factors.ai is particularly strong for B2B SaaS companies that need to connect marketing activity directly to pipeline and revenue, while Dreamdata excels when you have clean CRM data and want deep revenue attribution. The right answer depends on your sales cycle length, data maturity, and which integrations you need.
Q2. Are free conversion tracking tools enough for B2B?
Free tools like Google Analytics 4 are excellent for foundational web analytics, including tracking site behavior, traffic sources, and basic conversion events. For early-stage teams with limited ad spend, GA4 paired with a CRM can cover the basics. However, free tools lack pipeline attribution, account-level tracking, and multi-touch modeling, which are critical as your marketing operations mature. Most B2B teams outgrow free tools once they're running multi-channel campaigns and need to prove marketing's impact on revenue.
Q3. How do I track conversions across multiple channels?
To track conversions across channels, you need tools that integrate your ad platforms (LinkedIn Ads, Google Ads), website analytics, email marketing, and CRM data into a unified view. This typically requires either an all-in-one platform like HubSpot, a dedicated B2B attribution tool like Factors.ai, or a data infrastructure layer like Segment that routes data from all sources into a central system. Consistent UTM tagging across campaigns is also essential, since without standardized tracking parameters, even the best tools can't accurately stitch together cross-channel journeys.
Q4. What is multi-touch attribution in conversion tracking?
Multi-touch attribution is an approach that assigns credit to multiple interactions across the buyer journey, rather than giving all the credit to a single touchpoint. For example, if a prospect first discovers your brand through a LinkedIn ad, later attends a webinar, then visits your pricing page from an organic search, and finally books a demo through an email link, multi-touch attribution would recognize all four touchpoints as contributing to that conversion. Different models (linear, time-decay, W-shaped) distribute the credit differently, and the best multi-touch attribution tools let you compare models to understand which channels drive awareness versus which ones drive decisions.
Q5. Why is last-click attribution inaccurate for B2B?
Last-click attribution gives 100% of the credit to the final touchpoint before a conversion. In B2B, where buying journeys typically span weeks or months and involve numerous interactions across channels, that approach systematically ignores everything that happened before the last click. The LinkedIn campaign that introduced the account, the blog post that built credibility, and the webinar that educated the buying committee all get zero credit. The result is that marketers over-invest in bottom-of-funnel channels that capture existing demand and under-invest in the upper-funnel activities that actually create it. It's one of the main reasons B2B marketing teams struggle to justify brand and awareness spending, even when that spending is driving pipeline indirectly.

LinkedIn ads cost in 2026: what B2B marketers need to know
How much do LinkedIn ads cost in 2026? See CPC, CPL benchmarks, pricing factors, and how B2B teams reduce costs with better targeting.
TL;DR
- LinkedIn CPC ranges from $5 to $12, CPM from $30 to $90+, and CPL can hit $80 to $300+ depending on your ICP
- LinkedIn's pricing is auction-based, your relevance score matters as much as your bid
- India-based campaigns typically run ₹150 to ₹800 CPC, lower due to less competition
- The narrower your audience targeting, the higher your CPC, but usually, the better the pipeline quality
- Most cost problems on LinkedIn are a targeting problem, not a bidding problem
- Factors.ai helps you control account-level exposure, run smarter retargeting, and actually track what converts
Let me guess… you ran your first LinkedIn campaign, checked the CPC, and immediately googled "why are LinkedIn ads so expensive." We've all been there. The number looks absurd compared to Meta or Google… and you feel a little cheated.
Here's the thing, though. You weren't overcharged… you were just charged for access to a very specific group of people, which is kind of the whole point of the platform.
This guide breaks down exactly how LinkedIn advertising cost works in 2026, with real benchmarks, what moves the numbers up or down, and how to get more out of every dollar you spend.
How much do LinkedIn ads cost in 2026?
Quick benchmarks:
LinkedIn isn't the most expensive ad platform. It's the most selective one. You're not bidding for generic attention, you're targeting CFOs, VP of Sales, or whoever your ICP is. That precision costs more per click, and it should.
If you're targeting senior enterprise buyers in SaaS or finance, expect CPC toward the $10 to $12 end. But if you're running broader awareness campaigns with less senior targeting, you'll sit closer to the $5 to $7 range.
How LinkedIn's pricing model actually works
LinkedIn runs on an auction system. Every time your ad has a chance to show, it competes in a real-time auction against other advertisers targeting the same audience.
The three things that determine what you pay:
- Your bid: the maximum you're willing to spend per click, impression, or result
- Relevance score: how well LinkedIn thinks your ad matches the audience you're targeting
- Competition: how many other advertisers want the same eyeballs
Bidding options LinkedIn offers:
- CPC (cost per click): you pay when someone clicks
- CPM (cost per 1,000 impressions): you pay for visibility
- CPS (cost per send): specific to Message Ads and Conversation Ads
The part most teams miss is the relevance score. LinkedIn rewards ads that get engagement. If your CTR is strong and your message resonates, you'll pay less per auction win than a higher-bidding competitor with a generic ad. Poor targeting gives you bad leads and makes every lead cost more.
LinkedIn ads cost in India vs global benchmarks
LinkedIn ad pricing in India is noticeably lower than North America or Europe. Here's the honest breakdown.
India CPC: ₹150 to ₹800 (roughly $2 to $10)
US/EU CPC: $6 to $15+
The difference comes down to bid density. Fewer advertisers compete for Indian audiences on LinkedIn, which drives auction prices down. That said, lower CPC doesn't automatically mean lower customer acquisition costs. Conversion behavior is different across markets, deal sizes vary, and sometimes the buying committee is smaller or harder to reach.
Cheap clicks don't equal cheap customers. If you're running campaigns targeting India, treat the lower CPC as headroom for more testing and learning, not a signal that you've cracked efficiency.
What actually drives LinkedIn ads costs higher (or lower)?
This is the most practical section, so pay attention here.
1. Audience targeting
The more specific your targeting, the higher your CPC. Targeting "VP of Marketing at SaaS companies with 500+ employees" will cost more than targeting "marketing professionals" broadly. This isn't a bug. The first group is worth ten times more to you.
2. Industry and competition
SaaS, financial services, consulting, and HR tech are the most competitive verticals on LinkedIn. Everyone's fighting for the same senior buyers in these spaces. If you're in a niche industry with less advertiser competition, your CPCs will be friendlier.
3. Ad relevance and creative quality
Your click-through rate directly affects your auction performance. An ad with a strong CTR gets a relevance boost and wins auctions at a lower effective cost. A visually lazy ad with a generic CTA will cost you more money to show to fewer people.
4. Campaign objective
LinkedIn charges differently based on what you're optimizing for. Awareness campaigns run cheaper CPMs because you're not asking for action. Lead gen campaigns carry higher CPLs because the conversion event matters. The further down the funnel your objective, the more you pay per result.
5. Geography
North America is the priciest market, followed by Western Europe. Southeast Asia, Latin America, and South Asia run significantly cheaper.
6. Frequency and audience size
Tiny audiences with high frequency create ad fatigue quickly, which tanks CTR, which raises your effective cost. This is one of the most common and preventable mistakes B2B teams make.
Cost by campaign objective
A common trap: teams see high CPL on lead gen campaigns and start trying to optimize the CPL directly by adjusting bids. This almost never fixes the real problem. High CPL usually means something upstream is wrong, it could be a weak creative, a mismatch between the ad message and the offer, or too broad an audience. Fix the funnel above the conversion event, not the bid.
What should you actually spend on LinkedIn ads?
There's no universal answer, but here are honest benchmarks.
- Minimum to get useful data: $3,000 to $5,000 per month. Below this, LinkedIn's algorithm doesn't have enough to work with, and you'll be drawing conclusions from too-small samples.
- Where optimization starts to compound: $10,000+ per month. At this spend level, you've got enough impressions across multiple campaigns to run meaningful A/B tests, identify your best-performing segments, and let LinkedIn's delivery optimize toward your goal.
Three phases to think through:
- Testing phase ($3k to $5k/month): You're learning what resonates, which audience segments, which formats, which messages. Expect high CPL here. That's normal.
- Learning phase ($5k to $10k/month): You're doubling down on what works and cutting what doesn't. CPL should start trending down.
- Scaling phase ($10k+/month): You're increasing budget on proven campaigns. This is where efficiency gains actually show up in your pipeline.
Note: If you're spending under $3k a month and wondering why LinkedIn "doesn't work," the answer is usually data starvation, not platform failure.
Why do LinkedIn Ads feel expensive (and when they're actually worth it)?
The comparison that always comes up: why pay $8 CPC on LinkedIn when you can pay $1 on Meta or $2 on display networks?
Because you're not buying the same thing. On Meta, you're targeting behavior and interest signals. On LinkedIn, you're targeting professional identity: job title, seniority level, company size, industry, and recent role changes. You can put an ad in front of the exact person who would sign your contract.
Where LinkedIn takes the cake:
- Long B2B sales cycles where the buyer is a specific professional
- ABM campaigns where you're targeting named accounts
- Products with a clear ICP defined by role and company characteristics
- Pipeline acceleration for warm audiences who've already visited your site
Note: You're not paying for clicks, you're paying for access to specific people. Whether that's worth it depends entirely on what those people are worth to you.
How to reduce LinkedIn ads cost without wrecking quality?
Tactical changes that actually move the needle:
- Fix targeting before touching bids
Upload your own company lists and contact lists to build custom audiences. Exclude segments that have never converted, specific industries, company sizes, or seniority levels that historically go cold. Most teams over-target and then wonder why CPL is high.
- Improve creative relevance
Your headline needs to speak directly to a problem your ICP has right now. Generic value props ("drive more pipeline with our platform") don't earn high CTRs. Specificity does. The more your ad feels like it was written for one person, the better it performs in the auction.
- Control frequency
LinkedIn allows you to set frequency caps. Use them. An audience that's seen your ad eight times in three weeks isn't going to suddenly convert on the ninth impression. they're going to start ignoring it. Ad fatigue is one of the most common causes of CTR decline and rising costs.
- Retarget properly
Retargeting warm audiences (people who've visited your site, watched your videos, or engaged with previous ads), consistently delivers lower CPL than cold targeting. Warm audiences already know who you are. They need less convincing and they click with higher intent.
- Align your ad to the buying stage
A cold audience doesn't need a demo request ad. They need something that creates awareness of the problem. Save your high-intent CTAs for retargeting campaigns where people have already signaled interest. Mismatched stage-to-CTA is one of the biggest cost inefficiencies teams miss.
How does Factors.ai help you get more from your LinkedIn spend?
Most LinkedIn optimization advice focuses on bidding, creative, and audience selection. Those matter. But there's a layer underneath all of it that most B2B teams can't see: which companies are actually engaging with your campaigns, and whether you're spending money on accounts that could never buy from you.
Here's where the gaps usually live:
You can't tell which accounts are engaging with your content at an account level. LinkedIn gives you click data, but not a view into which companies are in-market and responding to your ads. You end up optimizing for individual leads while missing the account-level signal.
Retargeting lists are noisy. You're retargeting anyone who visited your site, including competitors, students, and job seekers who found you through a blog post. Without account-level filtering, your "warm" audience is doing a lot of work that warm audiences shouldn't have to do.
Frequency is uncontrolled across accounts. You might be burning impressions on the same accounts repeatedly without realizing it, driving up costs while delivering diminishing returns.
Factors.ai addresses this with:
- Account-level targeting and audience sync build LinkedIn audiences from your high-fit account lists, so you're spending budget where it can actually convert
- Frequency pacing control how often accounts see your ads so you're not burning budget on fatigue
- View-through attribution understand which LinkedIn impressions are influencing pipeline, even when people don't click
My point is, instead of trying to lower cost-per-click, you start making every impression count toward actual pipeline.
In a nutshell: Cost vs pipeline
CPC is a useful metric for platform benchmarking. It's a terrible metric for measuring whether your LinkedIn investment is working. A $12 CPC that brings in a $200k deal is infinitely cheaper than a $3 CPC that brings in nothing.
The question worth asking isn't "how do I lower my LinkedIn ads cost?" It's "how do I make sure the money I'm spending is reaching accounts that can buy?"
The cheapest lead you'll ever get is rarely the one that converts. And the most expensive click sometimes turns out to be the one that started the deal.
FAQs about how much do LinkedIn Ads cost in 2026
Q1. How much do LinkedIn ads cost per click in 2026?
LinkedIn CPC typically ranges from $5 to $12, though this varies significantly based on audience targeting, industry, and ad relevance. Targeting senior enterprise audiences in competitive verticals like SaaS or finance will push CPC toward the higher end. Broader, less competitive targeting can bring it closer to $5.
Q2. Why are LinkedIn ads more expensive than Meta ads?
You're targeting based on professional identity on LinkedIn, job title, seniority, company size, and industry, rather than behavioral or interest signals. That precision costs more per click. The trade-off is that the people you reach are more likely to be your actual buyers, not just demographically adjacent to them.
Q3. What is a good budget for LinkedIn ads?
$3,000 to $5,000 per month is the minimum to generate enough data to make informed decisions. Most teams running serious B2B campaigns start seeing meaningful optimization at $10,000+ per month. Under $3k, you're often working with too small a sample to draw reliable conclusions.
Q4. How much do LinkedIn ads cost in India?
India CPC typically runs ₹150 to ₹800, which is lower than US or European benchmarks due to lower advertiser competition. This can be a useful advantage for testing and learning, but lower CPC doesn't automatically translate to cheaper pipeline, deal sizes and conversion behavior differ by market.
Q5. What is the average cost per lead on LinkedIn?
Average CPL on LinkedIn ranges from $80 to $300+, with enterprise-focused campaigns sometimes running significantly higher. CPL varies based on your targeting specificity, offer quality, and how aligned your ad is to where the buyer is in their journey.
Q6. Can LinkedIn ads be cost-effective for small businesses?
It can work, but the budget floor matters. LinkedIn's minimum daily budgets and higher CPCs make it harder to run effective tests under $3k/month. Small businesses with a very clearly defined ICP and high-value contracts tend to get the best ROI. If your average deal size is under $5k, the math can get difficult.
Q7. How can I reduce my LinkedIn ads cost?
Start with targeting, not bids. Upload custom company and contact lists, exclude low-fit segments, and build retargeting audiences from warm site visitors and video viewers. Then focus on creative relevance: a specific, problem-aware headline will outperform a generic one every time. Finally, use frequency caps to prevent ad fatigue from inflating your costs.
Q8. Is LinkedIn CPC worth it for B2B marketing?
If your ICP is a defined professional role or seniority level, and your deal size justifies the spend, yes. LinkedIn is the only platform where you can reliably target buyers by professional identity at scale. The CPC feels high until you compare it to the cost of a cold outreach sequence that generates the same result, then it starts looking reasonable.
B2B target audience: how to define, segment, and reach the right buyers
Learn how to define and target your B2B target audience using real data, intent signals, and account-level insights. Examples + strategy inside.
TL;DR
- A B2B target audience is a group of accounts and the buying committees inside them that are most likely to become your best customers.
- Defining your audience with precision improves everything downstream: conversion rates, CAC efficiency, sales velocity, and pipeline quality.
- Static firmographic filters are no longer enough. Layering in technographics, intent data, and real-time engagement signals is what separates good targeting from guesswork.
- Segmentation should be dynamic, built on funnel stage and behavioural signals, not just industry or company size.
- Measuring audience quality means tracking pipeline and revenue per segment, not just cost per lead.
Every B2B company seems to have that one slide… you know that one… the ICP slide.
Really clean fonts, tidy bullets, maybe a tasteful icon or two. It says things like “Mid-market SaaS companies,” “500–2000 employees,” “Decision-makers in marketing and RevOps.” Everyone looks at it seriously, as if the slide itself has done something useful.
Then the quarter starts.
Marketing brings in leads, sales says they’re rubbish (excuse me?!). Revenue wonders why pipeline feels anemic. Someone suggests “more top-of-funnel.” Someone else says “better nurture.” Meanwhile, nobody wants to admit the real issue: you’re targeting an audience that looks nice and tidy in a deck, but behaves terribly in real life.
Because a B2B target audience is not a fictional LinkedIn filter built in a workshop. It’s not “VPs in tech” and a prayer. It’s a group of real companies, with real timing, pain, budgets, and signals that suggest they might actually buy something. Most teams need fewer random ones.
This blog is for fixing that. We’ll cover what a B2B target audience actually is, how to build one using data instead of vibes, where teams waste budget with lazy targeting, and how to keep your audience sharp as markets change. The dream here is simple: spend less time courting accounts that were never interested, and more time talking to the ones already halfway in.
So, what IS a B2B target audience?
By definition. a B2B target audience is the specific group of companies, and the decision-makers within them, that are most likely to buy your product or service. It's not a vague persona document that sits in a shared drive untouched. It's the operational definition of who you're actually going after with your marketing and sales efforts.
The difference between B2B and consumer targeting starts with a fundamental structural reality: you're not selling to a person, you're selling to an organisation. That organisation has layers. There's the person who first discovers your product, the person who evaluates it, the person who signs the contract, and often a handful of people who can kill the deal from the sidelines. This is the buying committee, and it's the reason B2B audience definitions can't be reduced to a single demographic profile.
Think about it this way… a SaaS company selling a revenue attribution platform doesn't just target "marketers." It targets Series B to Series D SaaS companies with 50 to 200 employees, where the VP of Marketing, the RevOps lead, and the CFO all have a say in purchasing decisions. The company is the account. The people inside it are the personas. And the combination of both is the audience.
This distinction matters because it shapes everything else: how you build campaigns, which channels you prioritize, what content you create, and how you measure success. In B2B, every meaningful interaction is part of a multi-touch journey that unfolds across weeks or months, touching multiple stakeholders before a deal closes. Your audience definition needs to account for that complexity, or it'll only ever capture a fraction of the picture.
The simplest way to think about it: your B2B target audience is the intersection of the companies that fit your ideal profile and the people within those companies who influence or make buying decisions. Get that intersection right, and everything downstream gets easier. Get it wrong, and you'll spend months optimizing campaigns that were pointed at the wrong accounts from the start.
Why is defining your B2B target audience SO important?
There's a persistent myth in B2B marketing that more leads equal more pipeline. It sounds logical on the surface, and it makes for satisfying dashboards. But anyone who's sat through a pipeline review where 80% of the "leads" were never going to buy knows the math doesn't work that way. Poor audience targeting is the silent budget killer that most teams don't diagnose until the quarter is already off track.
When your audience definition is too broad, you end up spending money attracting companies that don't have the budget, the problem, or the organizational structure to buy what you sell. Every one of those leads still costs you something, whether it's ad spend, SDR time, or the opportunity cost of nurturing an account that was never going to close. The result is a bloated top of funnel that creates the illusion of demand without actually building a sales pipeline.
Strong audience targeting flips this dynamic entirely. When you know exactly which accounts and personas you're going after, your conversion rates improve because the people entering your funnel are pre-qualified by design. Your customer acquisition cost decreases because you are not wasting money on accounts that are outside your ideal customer profile (ICP). And your sales velocity increases because reps are talking to prospects who actually have the problem your product solves. These aren't marginal improvements. For most B2B teams, sharpening audience targeting is the single highest-leverage thing they can do.
The modern version of this challenge is slightly more important to note… most marketing teams have gotten quite good at generating leads. The tools exist, the playbooks are well-documented, and the channels are accessible. What hasn't kept pace is the quality filter. Teams optimise for cost per lead when they should be optimising for cost per opportunity or cost per closed deal. The difference between those two metrics is almost always an audience problem.
Here's a useful thought experiment. If your sales team could handpick the 100 accounts they'd most want to talk to this quarter, would those accounts overlap with the ones your marketing campaigns are currently reaching? If the answer is "not really," that gap is your audience targeting problem. And it's costing you more than you think.
B2B target audience vs B2C: what's actually different?
It's tempting to treat B2B and B2C audience targeting as variations of the same thing. They both involve identifying a group of potential buyers and reaching them with relevant messaging. But the structural differences between the two are significant enough that applying B2C targeting logic to a B2B context will almost always lead you astray.
The most fundamental difference is who makes the decision. In B2C, one person sees an ad, evaluates the product, and buys it, often in the same session. In B2B, that "decision" is spread across a committee of three to ten people, each with different priorities, different levels of authority, and different criteria for saying yes. The CMO cares about strategic alignment. The RevOps lead cares about integration complexity. The CFO cares about cost justification. Your targeting needs to account for all of them, not just the person most likely to click your ad.
The sales cycle is the second major divergence. A B2C purchase might take minutes. A B2B deal, particularly in SaaS, takes weeks to months. That extended timeline means your audience doesn't just need to see one message. They need to encounter your brand across multiple touchpoints, at the right moments, over a sustained period. Timing and context matter far more than they do in a consumer purchase.
Then there's the question of deal value. B2C transactions tend to be low-ticket and high-volume. B2B deals, especially in enterprise SaaS, are high-ACV and low-volume. When each deal is worth tens or hundreds of thousands of pounds, the cost of targeting the wrong account isn't just a wasted impression. It's a wasted quarter of sales effort.
Here's a side-by-side comparison to make the differences concrete:
The implication for your targeting strategy is straightforward. In B2B, you can't just target the right person. You need to target the right account, at the right time, with messaging that resonates across the entire buying committee. Account-level targeting isn't a nice-to-have. It's the baseline for any serious B2B audience strategy.
How do you define your B2B target audience step by step?
Defining a B2B target audience isn't something you do once in a strategy deck and then forget about. It's a process that starts with your best existing data and evolves as you learn more about who actually buys from you. The teams that do this well treat audience definition as an ongoing discipline, not a one-time exercise.
Here's the step-by-step process that actually works:
Step 1: Define your ideal customer profile
Your ICP is the foundation, it describes the type of company, not individual, that gets the most value from your product and is most likely to buy. The key firmographic dimensions to lock down are:
- Industry: Which verticals do your best customers come from? Be specific. "Technology" is too broad. "B2B SaaS companies in the marketing or sales tech space" is useful.
- Company size: Define this by employee count, revenue, or both. A company with 50 employees and one with 5,000 have completely different buying processes.
- Revenue: This signals budget capacity. A company doing $2M in annual revenue has different purchasing power than one doing $50M.
- Geography: Where are your customers? Are there regional differences in adoption, compliance requirements, or sales motion?
The goal here isn't to describe your dream customer. It's to describe the profile that your data shows converts fastest, retains longest, and generates the most revenue.
Step 2: Identify the key personas within those accounts
Once you know which companies to target, you need to know who inside those companies actually matters. B2B buying committees typically include three types of stakeholders:
- Decision-makers: The people who sign off on the purchase. Think VP of Marketing, CMO, CRO, or Head of RevOps depending on your product.
- Influencers: The people who evaluate, recommend, or block. These are often directors or senior managers who do the hands-on research and shape the shortlist.
- End users: The people who'll use the product daily. They might not sign the contract, but their feedback during evaluation carries real weight.
Map out which roles matter for your specific product. A marketing analytics platform might need to reach the CMO for budget approval, the demand gen director for evaluation, and the marketing ops manager for technical fit. Missing any of these means your targeting has a gap.
Step 3: Analyse your best existing customers
Pull your CRM data and look at the accounts that converted fastest, generated the highest contract values, and retained the longest. What patterns emerge?
You might discover that mid-market fintech companies with a RevOps team close 40% faster than your average deal. Or that companies using a specific CRM convert at twice the rate. These patterns are gold because they're grounded in real buying behaviour, not hypothetical segmentation.
Look specifically at which industries over-index, which company sizes have the shortest sales cycles, and which persona combinations appear in your best deals. The goal is to let your existing customer base tell you who your audience should be.
Step 4: Layer in behavioural signals
A static ICP tells you who could buy, but behavioral signals tell you who's actually showing interest right now. This is where modern B2B audience targeting separates itself from the traditional approach.
The signals that matter include website visits (especially to pricing pages, product pages, or comparison content), content engagement (downloads, webinar attendance, blog consumption patterns), and ad interactions (repeated clicks, video views, high-frequency impressions). When an account that fits your ICP is also actively engaging with your content and ads, that's a much stronger signal than firmographic fit alone.
This is the shift from "who fits our profile" to "who fits our profile and is actively in a buying cycle."
Step 5: Validate everything with your sales team
Data-driven audience definitions are powerful, but they need a reality check from the people who actually close deals. Your sales team has qualitative insight that no dashboard can fully capture. They know which types of companies have real budget, which personas actually drive decisions, and which industries are receptive versus resistant.
Schedule a quarterly sync specifically focused on audience quality. Ask sales which recent deals closed smoothly and why. Ask which leads felt like a waste of time. Use that feedback to sharpen your ICP and persona definitions. The best B2B audience strategies are a collaboration between marketing data and sales intuition, updated regularly.
The endgame of this process is to move from a static ICP document to a dynamic audience definition built on real-time signals. Your ICP sets the parameters. Behavioural data tells you which accounts within those parameters are ready to engage. Sales feedback keeps the whole thing grounded in reality. That combination is what good B2B audience targeting actually looks like.
Firmographics, technographics, and intent: what actually matters?
Most B2B teams start their audience definition with firmographics, and that's a reasonable starting point. Industry, company size, revenue, geography: these are the basic filters that tell you whether an account could theoretically be a good fit. But firmographics alone are like choosing a restaurant based entirely on how close it is to your house. Proximity matters, but it doesn't tell you whether the food is any good.
The problem with a purely firmographic approach is that it's entirely static. A list of 500 companies that match your ICP by industry and size tells you nothing about which of those companies actually have the problem you solve right now, or which ones are actively looking for a solution. You could run campaigns against that whole list and find that 450 of them have zero purchase intent this quarter. That's not targeting. That's expensive guessing.
- Firmographics: who they are
Firmographics answer the most basic question: does this company look like the kind of organisation that buys our product? The core dimensions are industry vertical, employee count, annual revenue, and headquarters location. These filters are useful for building an initial universe of potential accounts. They help you avoid spending time on companies that are clearly outside your market, like targeting a 10-person agency when your product is built for 200+ employee enterprises.
But firmographics describe a company's identity, not its current situation. A mid-market SaaS company in your target vertical might be a perfect fit on paper and simultaneously in a hiring freeze with zero budget for new tools. Firmographic fit is necessary, but it's nowhere close to sufficient.
- Technographics: what they use
Technographic data adds a second layer by telling you what technology stack a company runs. This is particularly valuable if your product integrates with or replaces specific tools. If you sell a marketing attribution platform, knowing that a company uses HubSpot, runs Google Ads, and has Salesforce as their CRM tells you there's a technical fit. Conversely, if they're running a completely different stack that doesn't integrate with your product, firmographic fit becomes irrelevant.
Technographics also serve as a proxy for sophistication. A company that's already invested in a modern marketing stack is more likely to be ready for an analytics or optimisation layer than one that's still running everything through spreadsheets. Knowing what a company uses helps you predict whether your product fits naturally into their existing workflow.
- Intent data: what they're doing right now
Intent data is where targeting gets genuinely precise. While firmographics tell you who a company is and technographics tell you what they use, intent data tells you what they're actively researching and considering right now. This includes signals like topic-level research behaviour, content consumption across third-party sites, and engagement patterns that suggest a company is in an active evaluation cycle.
Here's a concrete way to think about the difference. Imagine your ICP filter returns 500 companies that match your firmographic and technographic criteria. Of those 500, intent data might reveal that only 50 are currently researching topics directly related to what you sell. Those 50 accounts are orders of magnitude more likely to engage with your outreach, take a meeting, and eventually convert. Spreading your budget across all 500 when you could concentrate it on the 50 showing active intent is a choice that directly impacts your pipeline quality and sales efficiency.
- Putting the layers together
The strongest B2B audience strategies treat these three data types as layers, not alternatives. Firmographics define the boundary of your total addressable market. Technographics narrow that boundary to companies where your product is a natural fit. Intent data then highlights the subset of those companies that are actually in-market right now.
When you target accounts that score well across all three layers, your campaigns reach the right companies, with the right tech stack, at the right time. That's the difference between running a campaign that generates impressions and running one that generates pipeline. The teams that still rely on firmographics alone are playing a fundamentally different, and less efficient, game.
How should you segment a B2B target audience?
Defining your audience tells you who you're going after. Segmentation tells you how to treat different subsets of that audience differently. Not all accounts in your target audience are at the same stage, show the same level of interest, or need the same messaging. Segmentation is what turns a single audience list into a set of actionable campaign strategies.
The most common segmentation approaches in B2B fall into a few categories, and the best strategies usually combine more than one.
- Segmentation by industry
This is the most intuitive starting point. Different industries have different pain points, different buying processes, and different language. A marketing analytics pitch that resonates with a fintech company might completely miss the mark with a healthcare SaaS buyer. Industry-based segmentation lets you tailor your messaging, case studies, and proof points to what each vertical actually cares about.
The risk here is stopping at industry alone. Two fintech companies of the same size can be at completely different stages of marketing maturity. One might have a full-stack RevOps team, while the other is running campaigns out of spreadsheets. Industry gets you in the right neighborhood, but it doesn't get you to the right house.
- Segmentation by funnel stage
This is where segmentation starts getting more actionable. Accounts at the top of your funnel need awareness-level content and broad messaging. Accounts in the middle need proof points, comparisons, and use-case specific material. Accounts near the bottom need confidence builders, like customer stories, ROI calculators, and technical documentation.
Treating all these accounts the same is one of the most common mistakes in B2B audience targeting. A cold account that's never interacted with your brand doesn't need a product demo invitation. And a warm account that's visited your pricing page three times this week doesn't need another "What is attribution?" blog post. Funnel-stage segmentation ensures your messaging matches the buyer's actual level of engagement.
- Segmentation by engagement level
This goes a step further than funnel stage by measuring how actively an account is interacting with your brand. You can typically group accounts into three buckets:
- High-intent accounts: These are visiting your site frequently, engaging with your ads, consuming your content, and may have interacted with sales. They deserve the most concentrated attention and the highest-touch treatment.
- Warm accounts: These show some level of interest but haven't crossed the threshold into active evaluation. They need consistent nurturing to stay engaged and move closer to a buying decision.
- Cold accounts: These fit your ICP but haven't shown meaningful engagement. They might need awareness-stage campaigns or simply aren't in-market yet. Spending heavily on cold accounts is rarely efficient.
- Dynamic segmentation: the advanced approach
The most sophisticated B2B teams don't segment once and then run static campaigns. They build dynamic segments that update automatically based on real-time behaviour. An account that was cold last month might start engaging heavily with your product pages this month and should automatically move into a high-intent segment.
Dynamic segmentation pulls from multiple sources: ad engagement data, website activity, CRM stage, email interaction history, and sales conversation signals. When these data points feed into a unified view, your segmentation reflects what's actually happening with each account right now, not what was happening when someone last updated a spreadsheet.
This is the difference between segment-and-forget and segment-and-adapt. The former is fine as a starting point. The latter is what drives consistently efficient spend and higher-quality pipeline. It requires better tooling and more integrated data, but the payoff is that your campaigns are always pointed at the accounts most likely to engage.
Examples of B2B target audiences
Here are four examples that illustrate how different B2B companies might define their target audiences. Each one shows how the same framework (ICP plus personas plus signals) adapts to different contexts.
Example 1: B2B SaaS company (marketing analytics platform)
Imagine a company like Factors.ai that sells a marketing analytics and attribution platform. Their target audience might look like this:
- Account profile: Mid-market B2B SaaS companies with 100 to 500 employees, spending $10K or more per month on paid advertising, headquartered in North America or Europe.
- Key personas: VP of Marketing (budget holder), Director of Demand Generation (primary evaluator), and RevOps Manager (technical fit assessor).
- - Behavioral signals: Accounts researching topics like "marketing attribution," "multi-touch attribution," or "B2B analytics" and actively visiting competitor websites.
The specificity here is what makes it actionable. "Mid-market SaaS companies" alone would produce a list of thousands. Adding the ad spend threshold, the persona map, and the intent signals narrows it to the accounts that are both a fit and likely in an active evaluation cycle.
Example 2: B2B marketing agency
A performance marketing agency focused on paid acquisition might define their target audience quite differently:
- Account profile: Direct-to-consumer brands doing $5M to $50M in annual revenue, running paid social and search campaigns, in the ecommerce or consumer subscription space.
- Key personas: Head of Growth (decision-maker), Marketing Manager (day-to-day contact), Founder or CEO (budget approval for smaller brands).
- Behavioral signals: Brands scaling ad spend rapidly, recently raised funding, or posting job openings for paid media roles (a proxy for growing investment in the channel).
Notice how the signals here aren't just about content consumption. Job postings and funding events serve as intent proxies because they indicate a company is investing in the capability the agency provides. Creative signal selection like this is often what separates strong targeting from generic list-building.
Example 3: HR technology platform
An HR tech company selling workforce planning software might target a very different kind of organisation:
- Account profile: Companies with 500 or more employees, hiring 20 or more new employees per quarter, in industries with high turnover like retail, logistics, or healthcare.
- Key personas: VP of People Operations (strategic buyer), HR Director (evaluator), CHRO (executive sponsor for enterprise deals).
- Behavioural signals: Accounts posting high volumes of open roles on job boards, researching workforce analytics topics, or engaging with HR tech comparison content.
Here, the hiring volume metric is doing the heavy lifting as a qualifying signal. A company that's hiring aggressively has an immediate need for workforce planning tools, which makes them far more receptive to outreach than a similarly sized company with flat headcount.
Example 4: B2B event platform
A platform that helps companies manage large-scale B2B events or conferences might define their audience like this:
- Account profile: Event organisers, industry associations, and B2B media companies producing events with sponsorship revenue goals, running three or more events per year.
- Key personas: Head of Events (operational decision-maker), VP of Marketing (strategic alignment), and Director of Partnerships (sponsorship revenue focus).
- Behavioral signals: Accounts actively promoting upcoming events, researching event management software, or engaging with content about event ROI and sponsorship monetization.
Each of these examples follows the same structure: a clearly defined account profile, mapped personas with distinct roles, and behavioral signals that indicate current intent. The details change based on the product and market, but the framework stays consistent. That consistency is what makes it repeatable and scalable across different business contexts.
Common mistakes in B2B audience targeting
Audience targeting is one of those areas where the mistakes tend to compound. You won't see a single catastrophic failure. Instead, you'll see gradual erosion of campaign efficiency, pipeline quality, and sales productivity. By the time the problem surfaces in a pipeline review, months of spend have already been misallocated. Here are the patterns that cause the most damage.
- Targeting too broadly
This is the most common mistake and the one with the biggest financial impact. "Any SaaS company" isn't a target audience. Neither is "marketing leaders at enterprise companies." When your audience definition is so broad that it includes thousands of accounts with vastly different needs, budgets, and buying timelines, your campaigns can't be specific enough to resonate with any of them. Broad targeting feels safe because it maximises reach, but reach without relevance is just expensive noise.
The fix is straightforward but requires discipline: narrow your ICP until it feels almost uncomfortably specific. If your audience definition doesn't exclude a meaningful number of companies, it's not specific enough. Effective targeting means accepting that some accounts aren't for you, at least not right now.
- Ignoring the buying committee
Plenty of B2B teams build their targeting around a single persona, usually the most senior title they can think of. They target CMOs on LinkedIn, run ads aimed at VPs, and wonder why engagement is high but pipeline is flat. The reality is that targeting only one member of the buying committee means you're invisible to the other three or four people who influence the decision.
A CTO might see your ad, but if the engineering manager doing the technical evaluation has never heard of you, you're starting from scratch in the one conversation that matters most. Your targeting strategy needs to account for every persona in the buying committee, with messaging tailored to what each one cares about.
- Letting the ICP go stale
Markets shift, your product evolves, and the customers who were your best fit two years ago might not be your best fit today. Yet many teams define their ICP once during a planning cycle and then treat it as settled forever. Your audience definition should be a living document that gets revisited at least quarterly, informed by fresh CRM data, win/loss analysis, and sales feedback.
I've seen teams discover during a quarterly review that their fastest-growing segment wasn't even part of their original ICP. If they'd kept running the old targeting for another six months, they would have missed an entire market shift. The audience you defined last year was based on last year's data. Treat it accordingly.
- Over-relying on LinkedIn job titles
LinkedIn's targeting capabilities are genuinely impressive, but job title targeting has real limitations. Titles are inconsistent across companies. A "Director of Marketing" at a 50-person startup has completely different decision-making authority than a "Director of Marketing" at a 5,000-person enterprise. Titles also don't capture the functional reality of who actually owns a buying decision.
Use job titles as one signal among many, not the sole basis for your targeting. Layer in company-level data, engagement signals, and other firmographic filters to avoid building campaigns around title-based assumptions that don't hold up in practice.
- Not using first-party data
Many teams build their target audience definitions entirely from third-party data and hypothetical ICP exercises while ignoring the richest data source they already have: their own website visitors, content engagers, and CRM records. Your first-party data tells you who's already interested, which pages they visit, how often they return, and what content they engage with. Ignoring that data in favour of generic third-party lists is like having a conversation with someone who keeps introducing themselves because they forgot you already met.
Your first-party engagement data is often the strongest signal you have. Make it central to your audience strategy, not an afterthought.
The common thread across all these mistakes is treating audience targeting as a static, set-and-forget exercise. Your audience isn't static. Your targeting shouldn't be either. The teams that revisit, refine, and dynamically update their audience definitions are the ones that consistently run more efficient campaigns and build higher-quality pipeline.
How do you reach your B2B target audience across channels?
Defining and segmenting your audience is the strategic work. Reaching them across channels is the operational work, and it's where good audience strategy either translates into real results or falls apart. The challenge in B2B isn't finding channels. It's orchestrating them so each channel serves a specific role in the buyer's journey without creating the kind of repetitive, tone-deaf experience that makes prospects mute your brand entirely.
- LinkedIn Ads
LinkedIn remains the most precise channel for B2B audience targeting because it lets you target at both the account level and the persona level simultaneously. You can upload a list of target accounts and then layer on job function, seniority, and skills filters to reach specific members of the buying committee. That combination of account targeting and persona targeting is uniquely powerful in B2B.
The nuance is in how you use it. Running the same generic brand awareness ad to your entire target account list is a waste of LinkedIn's targeting precision. Use LinkedIn's layering capabilities to serve different messages to different personas within the same accounts. Show the CMO a strategic message about pipeline impact. Show the RevOps lead a tactical message about integration and data quality. The account is the same, but the message needs to match the persona.
- Google Ads
Google Ads plays a fundamentally different role in the B2B channel mix. LinkedIn reaches people based on who they are. Google reaches them based on what they're actively searching for. That makes Google the ideal channel for capturing demand that already exists, rather than creating new awareness.
In B2B, high-intent keywords tend to be specific and low-volume. Searches like "marketing attribution software for B2B" or "account-based analytics platform" don't generate millions of impressions, but the people searching them are actively in an evaluation cycle. Pair search campaigns with your ICP data to make sure you're bidding aggressively on the terms that your target accounts are most likely to use, and not wasting budget on broad, informational queries that attract researchers instead of buyers.
- Email (nurture and outbound)
Email is the workhorse of B2B distribution, both for nurturing known contacts and for outbound prospecting into target accounts. The key is making sure your email strategy reflects your audience segmentation, not just your content calendar.
High-intent accounts should receive direct, personalised outreach that references their specific engagement signals. Warm accounts should receive nurture sequences that build credibility over time with relevant case studies and educational content. Cold accounts might receive lighter-touch sequences designed to provoke curiosity rather than push for a meeting. One-size-fits-all email cadences ignore the reality that different accounts are at different stages, and that difference should shape every message.
- Content marketing
Content marketing serves the B2B audience strategy in two ways. SEO-driven content captures demand from people actively researching topics related to your product. Thought leadership content builds authority and trust with accounts that aren't yet in an active buying cycle but will be eventually. Both are essential, and they serve different segments of your audience.
The connection between content and targeting is often underutilised. Most teams create content for general topics and hope the right people find it. The more effective approach is to create content specifically designed for the segments and personas in your target audience. If your highest-priority segment is mid-market SaaS companies with growing ad budgets, produce content that speaks directly to the challenges those companies face, using their language and their metrics.
- Cross-channel orchestration
The biggest opportunity, and the biggest gap for most B2B teams, is coordinating these channels so they work together rather than independently. A prospect who visited your pricing page yesterday should see a different LinkedIn ad than one who's never been to your site. An account that's received three outbound emails and engaged with two blog posts should be treated differently from an account that just appeared in an intent data report.
Cross-channel orchestration means syncing your audiences across platforms and controlling frequency at the account level so you're not over-saturating the same accounts across every channel. The goal is that every interaction feels like part of a coherent conversation, not four different teams independently shouting at the same company. The teams that get this right see meaningfully better engagement and pipeline conversion, because the buyer's experience feels deliberate rather than chaotic.
How do you measure and refine your B2B audience strategy?
An audience strategy without measurement is just a hypothesis. You might have the most carefully defined ICP, the sharpest segmentation, and a beautifully orchestrated channel mix, but if you're not measuring how those audience segments actually perform in terms of pipeline and revenue, you're flying blind. And in B2B, flying blind gets expensive quickly.
The metrics that actually matter for B2B audience targeting
The default metric for most marketing teams is cost per lead. It's easy to measure, it shows up in every platform dashboard, and it gives the satisfying feeling that you're generating demand efficiently. The problem is that CPL tells you nothing about audience quality. A $30 CPL is meaningless if those leads never convert to opportunities. The metrics that actually reflect audience quality live further down the funnel.
- Cost per opportunity: What does it cost to generate a qualified opportunity from each audience segment? This is the first metric that connects audience targeting to pipeline reality.
- Pipeline generated per segment: Which audience segments are producing the most pipeline value? This tells you where to concentrate your spend and where to pull back.
- Conversion rate by audience segment: How does each segment convert from lead to opportunity to closed deal? Differences in conversion rates across segments reveal which parts of your audience are genuinely high quality and which are inflating your funnel without contributing to revenue.
- Revenue attribution by audience: Which audience segments ultimately generate the most closed-won revenue? This is the metric that closes the loop entirely. If a segment looks great on CPL but underperforms on revenue, your targeting for that segment needs rework.
Building the feedback loop
Measurement only becomes useful when it feeds back into your targeting decisions. The process looks something like this: you define your audience segments, run campaigns against them, measure performance at the pipeline and revenue level, and then use those results to refine your segments for the next cycle. The teams that run this loop quarterly build compounding advantages over time, because each cycle makes their targeting a little more precise.
A common pattern in this feedback loop is discovering that a segment you expected to perform well actually underperforms, while a segment you treated as secondary turns out to be your highest-converting traffic. I've seen this happen at companies that assumed enterprise accounts were their sweet spot, only to find that their fastest closes consistently came from mid-market. The data told a different story than the ICP deck did. And the teams that caught this early, because they were measuring pipeline by segment rather than just CPL, were able to reallocate budget and double down on what was actually working.
If you're not measuring pipeline by audience, you don't actually know your audience. You know who clicked your ads… and that's a very different thing.
A practical note on cadence: audience performance reviews don't need to be monthly. Quarterly is usually the right rhythm for B2B, given the length of sales cycles. But the review needs to be real, which means pulling actual pipeline and revenue data by segment, not just impressions and click-through rates. If your analytics setup can't tell you which audience segment generated which opportunities, that's a gap worth fixing before you make another campaign decision.
How can Factors.ai help you identify and activate your target audience
Most audience problems don't come from a lack of data. They come from data that lives in too many places at once. Your website analytics are in one tool, your ad engagement is in three platforms, and your CRM is telling a completely different story about which accounts actually closed. By the time you've manually reconciled all of that, the moment has passed.
Factors.ai was built to close exactly this gap. It unifies your website signals, ad engagement data, and CRM records into a single account-level view, so you can see which accounts are actually showing buying behaviour across all your touchpoints, not just the ones that filled out a form.
Here's what that looks like in practice. An account that fits your ICP visits your pricing page three times in two weeks, engages with a LinkedIn ad, and has an open opportunity in Salesforce. Individually, none of those signals trips any alarm. Together, they paint a clear picture of an account that's actively evaluating your product. Factors surfaces that picture automatically, without you having to stitch it together across four different tabs.
The audience sync capability is where this translates into actual campaign efficiency. Once you've identified your high-intent accounts inside Factors, you can push those audiences directly to your ad platforms so your LinkedIn and Google campaigns are reaching the accounts that are already showing interest, rather than the ones that merely fit your ICP on paper. The difference in engagement rates between those two audience types is usually significant.
The attribution layer matters here too. When you're measuring pipeline quality by audience segment, as we covered above, you need accurate attribution to know which touchpoints contributed to which deals. Factors tracks the full account-level journey so you can see not just which segment converted, but which combination of channels and content moved them from cold to opportunity. That's the feedback loop that keeps your audience strategy improving over time, rather than getting stale.
The teams that use Factors well tend to describe the same shift: they stop running campaigns at broad lists and start running them at specific accounts showing specific signals. The total number of accounts they target often goes down. The pipeline quality goes up. That's what precise audience targeting actually looks like when it's working.
FAQs for B2B target audience
Q1. What is a B2B target audience?
A B2B target audience is the specific group of companies, and the decision-makers within them, that are most likely to buy your product or service. Unlike B2C, where you're targeting individuals, B2B targeting is account-level: you're defining which organisations fit your ideal customer profile and then identifying the multiple stakeholders inside those organisations who influence or make the purchasing decision.
Q2. How is B2B audience targeting different from B2C?
The core difference is structural. B2C targeting focuses on individual consumers making solo decisions, often quickly. B2B targeting has to account for buying committees of three to ten people, sales cycles that stretch across weeks or months, and deal values that make the cost of poor targeting much higher. You're also working with a fundamentally different data set: firmographics, technographics, and intent signals rather than consumer demographics and interest categories.
Q3. What are examples of B2B target audiences?
A marketing analytics platform might target mid-market B2B SaaS companies with 100 to 500 employees spending at least $10K per month on paid advertising, focusing on VP of Marketing and RevOps leads. An HR tech company might target organisations with 500-plus employees that are hiring more than 20 people per quarter, focusing on VP of People and HR Directors. The specificity of the account profile and persona map is what makes an example a real target audience rather than a vague aspiration.
Q4. How do you identify your B2B target audience?
Start by analysing your existing customer base to find patterns in the accounts that convert fastest, retain longest, and generate the most revenue. Use those patterns to define your ICP. Then map the personas inside those accounts who influence and make buying decisions. Layer in behavioural signals like website visits, content engagement, and ad interactions to identify which accounts within your ICP are currently showing buying intent. Validate everything with regular sales feedback to keep the definition grounded in reality.
Q5. What data is needed for B2B audience targeting?
Effective B2B audience targeting draws on three layers. Firmographic data covers company size, industry, revenue, and geography. Technographic data tells you what tools and platforms a company already uses, which helps assess product fit and stack compatibility. Intent data reveals what topics and solutions a company is actively researching right now, which is often the strongest signal of near-term buying interest. First-party data from your own website and CRM rounds this out by showing which accounts are already engaging with you.
Q6. How often should you update your target audience?
At minimum, quarterly. Markets shift, your product evolves, and the companies that were your best-fit customers twelve months ago may not represent your best opportunity today. A quarterly review that pulls fresh CRM data, win/loss patterns, and sales team feedback will usually surface meaningful adjustments. Some high-growth teams run a lighter monthly check on engagement signals to catch shifts in which segments are performing, while reserving the deeper ICP review for quarterly cycles.
Q7. What tools help with B2B audience targeting?
The core toolset typically includes a CRM for account and deal data, an intent data provider for third-party research signals, LinkedIn Ads for account and persona-level targeting, and a marketing analytics platform that can unify engagement signals across channels. Tools like Factors.ai add the layer that most teams are missing: a unified account-level view that combines website behavior, ad engagement, and CRM data so you can see which accounts are showing buying signals across all your touchpoints at once.
Q8. Why is intent data important in B2B targeting?
Because firmographic fit tells you who could theoretically buy your product, but intent data tells you who's actually looking to buy something like it right now. Of the 500 companies that match your ICP, only a fraction will be in an active evaluation cycle at any given moment. Intent data lets you concentrate your budget and sales attention on that fraction, rather than spreading effort equally across accounts with completely different levels of readiness. The result is higher engagement rates, shorter sales cycles, and significantly better pipeline quality.
.avif)
Brand persona: what it is & how to build one (B2B guide)
Learn what a brand persona is, why it matters in B2B, and how to build one using real customer and intent data.
TL;DR
- A brand persona is the human-like identity your brand projects across every touchpoint, covering tone, perspective, emotional stance, and communication style, not just voice.
- Most B2B companies invest heavily in buyer personas but completely neglect brand persona, which is why their messaging feels interchangeable with every competitor.
- Building a strong brand persona starts with auditing existing communication, defining clear traits (including what you're *not*), and mapping those traits to each stage of the funnel.
- Your brand persona should evolve based on real performance data, engagement signals, and pipeline outcomes.
- Persona consistency across ads, landing pages, and sales outreach directly improves CTR, conversion quality, and deal velocity.
I want you to think of something… that moment in a brand’s and your life where someone from marketing opens a competitor’s website, reads the homepage, and has a small internal crisis because… this could literally be their own site. Swap the logo, change the accent color, maybe shuffle a stock photo of people pointing at laptops, and nobody would know the difference. It has the same words, same rhythm, and same dramatic (read: AI-y) promises about “transforming growth” and “unlocking outcomes.” I mean… it’s giving copy-paste… with confidence. (here’s how I feel after saying that)
At this point, we’ve all sat through enough brand workshops to know exactly how we get here. Someone says the brand should feel “professional but approachable.” Another person adds “modern.” Somebody brave-r throws in “human.” It all gets written on a whiteboard like sacred wisdom… and here’s what everyone thinks they look like after cracking the brand persona code.

Shortly after, some nods are seens, some high-calorie snacks are eaten, and then the company goes right back to sounding like every other SaaS firm that discovered adjectives five minutes ago. Because “professional but approachable” is not a personality, it’s beige in sentence form.
What’s usually missing is a real brand persona (not a buyer persona, not a Canva mood board, not “our font is now slightly rounder”). A brand persona is the intentional, human identity your company uses to show up consistently wherever people meet you. Website copy, LinkedIn ads, sales decks, webinars, nurture emails, even the 404 page nobody planned for. It decides how you speak, what you care about, what you would never say, and whether people remember you after closing the tab.
Because here’s something I will tell you: buyers don’t remember “end-to-end solutions.” They remember brands that feel like something. Sharp, calm, bold, clever, rebellious, reassuring, opinionated, useful, and YES, human.
This piece breaks down what a brand persona actually is, why most B2B companies need one yesterday, and how to build one that doesn’t end up buried in a forgotten brand guidelines PDF beside outdated logo rules and broken Dropbox links. We’ll also get into how real audience data, not just vibes and the loudest person in the room, can help shape it over time.
What is a brand persona?
Let's start with the definition, because it gets confused with adjacent concepts more often than it should. A brand persona is the human-like identity a brand adopts across its communication, behavior, and presence. Think of it as the personality your brand would have if it were a person walking into a meeting room. How would it introduce itself? Would it crack a joke first, or lead with a sharp observation? Would it speak in frameworks, or tell a story?
That's the core of what a brand persona captures. It goes well beyond tone of voice, though tone is certainly part of it. A complete persona includes the brand's attitude (confident? curious? irreverent?), its perspective on the industry (challenger? educator? insider?), its communication style (concise and punchy, or detailed and methodical?), and its emotional stance (calm authority, or restless energy?).
The reason this distinction matters is that most B2B brands stop at tone. They'll document that they sound "clear, confident, and human," which is fine as far as it goes. The problem is that tone alone doesn't tell your content team how to handle a controversial topic, or how opinionated to be in a LinkedIn post, or what kind of analogies feel right versus forced. Tone is one dimension. Persona is the full picture.
Here's a simple way to think about it. Your brand personality is the set of traits you'd use to describe your brand in the abstract: innovative, reliable, bold. Your brand persona is how those traits actually manifest in real communication. Personality is conceptual. Persona is behavioral. One lives in a strategy deck. The other lives in every email, ad, and landing page your audience actually sees.
In B2B specifically, this distinction becomes critical. Most B2B brands sound functionally identical. They use the same industry jargon, the same safe structures, the same hedging language designed to offend no one and impress no one either. When every competitor sounds like the same well-meaning middle manager, persona becomes your differentiation. It's the thing that makes a prospect remember your content, trust your perspective, and actually want to hear from you again.
A useful mental shortcut: a brand persona is how your brand behaves consistently across touchpoints, not just how it sounds in a single piece of content. Consistency is the operative word. If your blog sounds like a witty strategist and your sales emails sound like a compliance department, you don't have a persona. You have a personality disorder.
Why does brand persona matter in B2B marketing? You’re selling to businesses after all?!
There's a tempting instinct to file brand persona under "nice to have" and move on to the performance marketing budget. I get it. When pipeline targets are staring you down, spending time on how your brand "feels" can seem like a luxury. But that instinct misses something important about how B2B buying actually works.
B2B buyers evaluate your confidence, clarity, and credibility, often before they ever talk to sales. The way you communicate signals whether you understand their world, whether you've thought deeply about the problem, and whether you're worth the time it takes to fill out a demo form. Your brand persona is what carries those signals.
Without a defined brand persona, a few things tend to go wrong:
- Messaging becomes inconsistent across channels
Your LinkedIn ads sound sharp and opinionated, but the landing page they click through to reads like a corporate brochure. Your SDR outreach uses casual language that doesn't match the formal tone of your website. Each touchpoint feels like a different company, and that erodes trust faster than most teams realise.
- Recall value drops
If your brand doesn't have a distinctive voice and perspective, there's nothing for prospects to latch onto. They might read your content and find it helpful, but they won't remember it was yours. In a category with five or six credible competitors, being forgettable is functionally the same as being invisible.
- Positioning becomes generic
Without a persona guiding how you communicate your differentiation, you end up defaulting to feature comparisons and vague value propositions. Every competitor claims to be "the leading platform for X." A strong persona lets you say the same thing in a way that actually sounds like you, which is what makes it believable.
The revenue connection here is super direct. Better brand personas lead to stronger differentiation, which leads to higher-quality conversions. When prospects feel like they already know your brand before the first sales call, the conversation starts from a completely different place. They're not evaluating whether you're credible. They've already decided you are. The persona did that work in advance.
That said, in a world where AI slop is flooding every channel, personality becomes signal. When everyone can produce competent, generic content at scale, the brands that sound distinctly human stand out more than ever. Your persona is what makes your content feel like it was written by someone with a point of view, not assembled by an algorithm.
From a practical standpoint, persona consistency needs to hold across your entire marketing and sales ecosystem. That means your LinkedIn ads, your website journeys, your email sequences, and your sales outreach should all feel like they come from the same entity. When marketing and sales share the same narrative identity, handoffs feel seamless and the buyer's experience stays coherent from first impression to closed deal.
Buyer Persona vs Brand Persona: what's the actual difference?
This is one of the most common points of confusion in B2B marketing, and it causes more damage than people think. Most teams invest significant time and effort into building buyer personas. They research their ideal customers, document their pain points, map their decision-making processes, and create detailed profiles of who they're selling to. That work is genuinely valuable.
The problem is that almost none of those teams do the equivalent work for their brand persona. They know exactly who they're talking to, but they haven't defined how they talk. The result is precise targeting paired with generic messaging, which is a bit like knowing exactly which restaurant your date wants to go to and then showing up in a tracksuit.
Let's make this difference between buyer persona and brand persona more concrete with a comparison:
Here's what's worth noting about this table. Both personas are essential, and they serve entirely different functions. Your buyer persona tells you what to say (which problems to address, which outcomes to highlight). Your brand persona tells you how to say it (the voice, the angle, the emotional texture). You need both. Customer persona vs brand persona isn't an either/or decision. It's a both/and requirement.
The teams that skip brand persona work usually don't realise they've skipped it. They assume that "we know our audience" is sufficient, and that good messaging will naturally follow. Sometimes it does, if you have a gifted writer who intuitively understands the brand. But that's not scalable, and it falls apart the moment that writer leaves or the team grows. A documented brand persona gives everyone the same playbook.
Core elements of a strong brand persona
Defining a brand persona sounds abstract until you break it into components. Once you do, it becomes surprisingly concrete and actionable. There are five core elements that together form a complete brand persona, and most B2B companies only define one or two of them.
- Voice and tone
This is the element most teams start with, and it's a reasonable starting point. Voice is your brand's consistent personality in communication. Tone is how that voice adapts to different contexts. A brand might have a voice that's confident and direct, but the tone shifts slightly between a celebratory product launch post and a sensitive customer communication.
The key decisions here involve where you sit on a few spectrums. Are you formal or conversational? Witty or authoritative? Warm or precise? These aren't binary choices; you're picking a position on a range. The important thing is that you pick one, rather than defaulting to whatever the writer feels like on a given day.
- Perspective
This is where most B2B brands fall short, and it's where sameness creeps in most aggressively. Perspective is how your brand sees the world. It's the lens through which you interpret industry trends, evaluate problems, and frame solutions.
An analytical brand leads with data and evidence. A visionary brand leads with where the industry is heading. A tactical brand focuses on practical steps and implementation. A strategic brand zooms out to the bigger picture. Your perspective determines not just what you say, but what you choose to talk about in the first place.
Two brands can cover the exact same topic and feel completely different based on perspective alone. One might approach marketing attribution as a measurement challenge (analytical). The other might frame it as a strategic decision that reveals what a company actually values (visionary). Same topic. Completely different content. That difference comes from perspective, not tone.
- Emotional layer
Every brand communicates with an emotional register, whether it's intentional or not. The question is whether you've chosen yours deliberately. Some brands project calm confidence, the kind that makes you feel like everything's under control. Others project restless energy, a sense that the status quo isn't good enough and something needs to change.
Neither is better. What matters is consistency and fit. A cybersecurity company might lean into quiet authority, because their customers want to feel safe. A startup disrupting an established category might lean into urgency and ambition, because their customers want to feel like they're making a bold move. The emotional layer should match what your audience needs to feel, not just what sounds good internally.
- Communication patterns
This element covers the structural choices in how your brand communicates. Are you concise and punchy, or do you favour long-form depth? Do you lead with data and evidence, or with stories and analogies? Do you use frameworks and models, or prefer a more narrative approach?
These patterns shape how your content feels to consume. A brand that communicates in short, sharp bursts feels different from one that takes its time building an argument. Neither approach is universally better. What matters is that the choice is intentional and consistent. When a prospect reads your blog, then sees your ad, then gets a sales email, the communication patterns should feel recognisably yours.
- Values and beliefs
This is the element that ties everything together and gives your brand persona depth. Values and beliefs define what your brand stands for, what it won't compromise on, and what positions it's willing to take publicly. In B2B thought leadership, this is increasingly important.
A brand that believes in transparency will communicate differently from one that believes in exclusivity. A brand that values simplicity will make different content choices from one that values thoroughness. These values don't need to be radical or controversial. They just need to be clear, specific, and visible in your communication.
The most effective brand personas integrate all five elements into a coherent whole. Voice and tone sit on the surface. Perspective and values provide the foundation. Emotional layer and communication patterns bridge the two. When all five are aligned, your brand feels like a real entity with a genuine point of view, not a collection of marketing assets produced by different people on different days.
How do you build a brand persona step by step?
Theory is great, but at some point you need a process. Building a brand persona doesn't require a six-month brand consultancy engagement. It does require honest assessment, clear decisions, and the discipline to document and operationalise what you decide. Here's how to approach it.
Step 1: Audit your existing communication
Before you define who your brand should be, you need to understand who it currently is. Pull together a representative sample of your actual communication: website copy, ad creative, sales decks, email sequences, LinkedIn posts, webinar scripts. Lay it all out and read through it as if you're encountering this brand for the first time.
What you're looking for are patterns, both intentional and accidental. Does a consistent personality emerge? Or does each channel feel like it was written by a different person with a different brief? Most teams find the latter, and that's not a failure. It's the starting point.
Step 2: Identify patterns (or the absence of them)
Once you've reviewed the communication landscape, document what you find. Is there a consistent tone, or does it fluctuate? Are certain channels more "on brand" than others? Does the messaging shift dramatically between marketing and sales materials?
Pay special attention to the gaps. The places where consistency breaks down are usually the places where your persona is weakest or least defined. Maybe your blog has a strong, opinionated voice but your email nurture sequences sound like they were written by a committee. That gap tells you something useful about where persona work is most needed.
Step 3: Define persona traits
This is the core creative exercise. Based on your audit and your strategic goals, define the traits your brand persona should embody. A simple framework works best here, because overly complex brand persona models tend to get ignored.
Use a "we are / we are not" structure. Define 3-5 traits that describe your brand, and pair them with 3-5 traits you're explicitly rejecting. The "we are not" list is equally important, because it creates boundaries that prevent the persona from drifting back toward generic territory.
For example:
We are: Insightful, sharp, slightly irreverent, data-grounded, direct.
We are not: Corporate, vague, overly polished, buzzword-heavy, safe.
Notice how specific these are. "Insightful" is a trait you can actually evaluate in a piece of content. "Professional" is not, because it's too broad to be actionable. The more specific your traits, the more useful they become as a daily writing and review tool.
Step 4: Map persona to funnel stages
Your brand persona should remain consistent across the funnel, but the emphasis shifts depending on where the buyer is in their journey. This is a nuance that many brand persona guides miss entirely.
At the awareness stage, your persona can afford to be more opinionated and provocative. You're trying to earn attention, and strong perspectives do that more effectively than neutral observations. This is where your brand voice persona shines brightest, through bold takes and original thinking.
At the consideration stage, the emphasis shifts toward analysis and depth. Prospects are evaluating options, so your persona needs to demonstrate rigour and expertise. The tone stays the same, but the content leans more heavily on data, comparisons, and structured thinking.
At the decision stage, directness and confidence matter most. Prospects need clarity, not more content. Your persona should communicate with precision, address objections head-on, and make it easy to take the next step.
The persona itself doesn't change across these stages. The traits remain the same. What changes is which traits you emphasise. Think of it like a person adapting their communication to the context: you speak differently in a keynote than in a one-on-one conversation, but you're still recognisably you.
Step 5: Document and operationalise
Here's where most brand persona work dies. The team does brilliant strategic thinking, produces a beautiful brand persona document, shares it once in a Slack channel, and then never looks at it again. Six months later, the messaging has drifted back to generic.
Documentation needs to be practical, not precious. Create a living document that includes your persona traits, tone guidelines, examples of on-brand and off-brand communication, and specific guidance for each channel. Keep it short enough that someone can read it in ten minutes and immediately apply it.
Then embed it into workflows. Your ad copywriters should reference it. Your SDR team should have a version tailored to outreach. Your landing page designers should know what "on brand" feels like. The persona document should be as operational as your style guide or brand colours. If it lives in a folder that nobody opens, it's not a persona. It's a memory.
Using data to refine your brand persona (the Factors approach)
Here's where most brand persona advice stops, and where this conversation gets genuinely interesting. Traditional branding is subjective. A creative director decides the brand should feel "bold and modern," the team agrees, and that becomes the persona. There's nothing inherently wrong with this approach, but it leaves a massive question unanswered: is it working?
Modern B2B marketing has access to signals that previous generations of marketers could only dream about. You can see which messaging drives engagement on LinkedIn. You can track which tone converts high-intent accounts. You can identify what content actually influences pipeline, not just what gets likes. That data should be feeding back into your brand persona, refining and evolving it based on evidence rather than instinct alone.
This is where a platform like Factors becomes genuinely useful. By surfacing account-level signals, Factors lets you connect messaging performance to real buying behavior. You're not guessing which version of your brand resonates with high-value accounts. You can actually see it in the data.
For example, if analytical, data-heavy content consistently drives pipeline among your best-fit accounts, that's a signal. Your persona should lean into a data-first communication style, not because a workshop decided so, but because the market is telling you it works. Conversely, if storytelling and narrative-driven content generates more engagement and downstream pipeline, your persona should evolve accordingly.
The principle here is simple: your brand persona shouldn't be static. It should adapt based on revenue signals. Not every quarter, and not in response to every fluctuation. But over time, the data should shape how your persona develops. The brands that treat persona as a living, evolving identity tend to outperform those that treat it as a one-time exercise.
Factors helps make this feedback loop practical. Account-level engagement data shows you what messaging resonates with the accounts that actually matter to your pipeline. Campaign performance data tells you which tone and style convert, not just attract. And pipeline attribution connects brand communication choices to revenue outcomes, which is ultimately the only metric that matters.
The shift here is from "we think our brand should sound like this" to "we know our brand performs best when it sounds like this." That's a meaningful evolution, and it's one that most B2B brands haven't made yet.
B2B and SaaS brand persona examples worth studying
Abstract definitions are useful, but examples make the concept stick. Let's look at three distinct B2B brand persona archetypes and what makes each one effective. These aren't named companies, but you'll likely recognize the patterns from brands you've encountered.
- The analytical strategist
This persona type leads with data, evidence, and structured thinking. The tone is direct and precise. There's no filler, no fluff, and no unnecessary warmth. Every piece of content feels like it was written by someone who respects your time and your intelligence.
The communication style tends toward frameworks, benchmarks, and original research. Blog posts include specific numbers. LinkedIn posts make a single sharp point and support it with evidence. Sales materials focus on measurable outcomes rather than aspirational promises.
This persona works well for brands selling to data-driven buyers: analytics platforms, revenue operations tools, and financial software. The emotional layer is quiet confidence. The perspective is analytical. The unstated message is: "We've done the math, and here's what the numbers say."
- The challenger
This persona is opinionated, bold, and willing to disagree with conventional wisdom. The tone is direct, sometimes provocative, and always assertive. Content from a challenger brand doesn't just explain a topic; it takes a position on it.
The communication style favors strong opening statements, contrarian points of view, and a willingness to name problems that the industry would rather ignore. The emotional register runs on restless energy: the sense that the current way of doing things isn't good enough and someone needs to say so.
This persona suits brands that are genuinely disrupting an established category. It falls flat when adopted by companies that aren't actually doing anything different, because the audience will notice the gap between bold claims and conventional product. Authenticity matters enormously with this archetype.
- The educator
This persona prioritizes clarity, structure, and genuine helpfulness. The tone is warm but not casual, knowledgeable without being condescending. Content from an educator brand feels like sitting down with a patient, well-informed colleague who's walked this road before.
The communication style is framework-heavy, with clear steps, practical examples, and an emphasis on making complex things simple. Blog posts tend to be thorough. Webinars are structured around learning outcomes. Sales conversations focus on understanding the prospect's situation before prescribing a solution.
This persona works beautifully for brands in complex categories where buyers need education before they can evaluate solutions. It builds trust through competence and patience, rather than through boldness or data. The emotional layer is steady reassurance: "This is complicated, but we'll help you figure it out."
Each of these archetypes is effective in the right context. The key isn't choosing the "best" one. It's choosing the one that genuinely reflects your brand's strengths, your team's natural communication style, and your audience's needs. A brand persona that feels forced will always underperform one that feels authentic, regardless of how strategically clever it looks on paper.
How does brand persona actually impact campaign performance?
This is the section where persona stops being a branding conversation and becomes a performance conversation. If you can't connect persona to outcomes, it'll always be the first thing that gets deprioritized when budgets tighten. So let's make the connection explicit.
A strong, consistent brand persona improves campaign performance in three measurable ways.
- Brand personas improve click-through rates
When your ads have a distinctive voice and a clear point of view, they stand out in a feed full of generic messaging. Clarity and differentiation are the two biggest drivers of CTR in B2B advertising, and both are direct outputs of a well-defined persona. Prospects click on content that feels like it was written by someone with something specific to say.
- Brand personas improve engagement quality
A persona doesn't just attract more clicks; it attracts better ones. When your communication style is clear and consistent, the people who engage tend to be better aligned with your brand. They're not clicking because of a misleading hook. They're clicking because your perspective resonated with theirs. That alignment shows up in time on page, content consumption depth, and downstream conversion rates.
- Brand personas improve conversion intent
By the time a prospect with strong brand affinity reaches your demo form or sales conversation, they've already formed a positive impression. They know what your brand stands for. They've experienced your communication style across multiple touchpoints. The conversion isn't a cold transaction. It's a warm continuation of a relationship that your persona has been building all along.
Conversely, a weak or inconsistent persona creates super predictable problems. Ads get scrolled past because they look and sound like everything else. Landing pages feel disconnected from the ads that drove traffic to them. Sales conversations start from scratch because the prospect has no sense of who they're talking to.
Persona consistency also improves attribution clarity. When your messaging is consistent across channels, it's easier to track how different touchpoints contribute to pipeline. When every channel sounds like a different brand, your attribution data gets muddied by the inconsistency itself. You can't tell whether a channel underperformed because of the channel, or because the messaging on that channel was off-brand.
Factors makes this connection visible by tracking messaging performance at the account level. You can see which campaigns, which content, and which communication styles are actually influencing pipeline. That visibility lets you double down on what's working and adjust what isn't, with persona as one of the key variables you're optimizing.
Common mistakes that undermine your brand persona
Building a brand persona is not technically difficult per se, but maintaining one is. And the mistakes that erode a persona's effectiveness are almost always too easy to rationalize in the moment. Here are the ones I see most often.
- Confusing tone with the full persona
This is the most common mistake by a wide margin. A team defines their brand voice as "confident, clear, and conversational," calls it done, and moves on. Tone is one element of persona, but without perspective, emotional stance, values, and communication patterns, it's incomplete. You can have two brands with identical tone that feel completely different because their perspectives diverge. Tone alone doesn't create differentiation.
- Creating persona in isolation from data
When a brand persona is built entirely through internal workshops without any reference to how the market actually responds, it's essentially a guess. An educated guess, sure, but still a guess. The brands that build the strongest personas combine creative instinct with performance data, refining their choices based on what actually resonates with their target accounts.
- Overcomplicating the framework
I've seen brand persona documents that run forty pages, with matrices, spectrums, and sub-categories for every conceivable communication scenario. These documents are impressive to present and impossible to use. The best persona frameworks fit on a single page and can be understood by a new team member in ten minutes. Complexity is the enemy of adoption.
- Failing to align sales and marketing voice
This one's a slow killer. Marketing builds a sharp, distinctive brand persona. Sales continues to use whatever templates and talk tracks they've always used. The prospect experiences two different brands, and the disconnect undermines the trust that marketing worked to build. Persona alignment between marketing and sales isn't optional. It's the minimum viable requirement for the persona to actually work.
- Treating a persona as a finished project
A brand persona defined in 2022 shouldn't look identical in 2026. Markets shift. Products evolve. Audience expectations change. Teams grow and bring new strengths. A persona that never adapts becomes increasingly disconnected from reality, even if it was perfectly calibrated when it was first created. The best B2B brand personas are living documents, reviewed and refined at least annually.
How do you measure the impact of your brand persona?
If you've put time into building a brand persona, you need a way to know whether it's working. The challenge is that persona impact doesn't show up as a single metric. It influences multiple metrics across the funnel, and the most meaningful evidence comes from tracking patterns over time rather than looking at any single data point.
- Engagement metrics
The first layer of measurement is engagement. CTR on ads and content tells you whether your persona is generating interest. Time on page tells you whether the interest translates into genuine attention. Social engagement (meaningful comments and shares, not just likes) tells you whether your perspective is resonating.
These metrics won't tell you whether your persona is driving revenue, but they'll tell you whether it's earning attention. If your engagement metrics improve after implementing a more defined persona, that's a strong early signal that the market is responding.
- Conversion metrics
The second layer is conversion. Conversion rate from visitor to lead, and from lead to opportunity, tells you whether your persona is attracting the right audience and building enough trust to drive action. Cost per opportunity is particularly telling, because a strong persona tends to improve conversion efficiency, which brings cost per opportunity down.
Watch for conversion quality as well, not just volume. If your persona is sharp and distinctive, you should see not only more conversions but better-fit conversions. Prospects who convert from persona-consistent experiences tend to be better aligned with your ICP, because the persona itself acts as a filter.
- Pipeline metrics
The third layer, and the most important one, is pipeline. Influenced pipeline tells you whether your brand communication is actually contributing to revenue. Deal velocity tells you whether prospects who've been exposed to your brand persona move through the sales process faster, which they typically do because the trust-building work has already happened by the time sales gets involved.
The advanced angle is this…
The most sophisticated approach to persona measurement involves tracking specific messaging themes against pipeline outcomes. Which perspectives drive pipeline? Which communication styles correlate with faster deal cycles? Which emotional registers produce the highest-quality opportunities?
This is where Factors adds particular value. By connecting account-level engagement data to pipeline outcomes, you can track how persona-consistent messaging performs relative to off-brand or inconsistent messaging. Over time, that data creates a feedback loop that continuously refines your persona based on what actually drives revenue.
The key insight is that persona measurement isn't a one-time report. It's an ongoing practice of correlating communication choices with business outcomes. The brands that do this well don't just have strong personas. They have personas that get stronger over time, because every campaign cycle generates new data about what works and what doesn't.
In a nutshell…
A brand persona is the human-like identity your brand uses to communicate consistently across every touchpoint, covering tone, perspective, emotional stance, values, and communication patterns. In B2B, where most companies sound interchangeable, a well-defined persona is one of the few reliable sources of differentiation that actually influences how buyers perceive and remember you.
Building one requires honest assessment of your current communication, clear decisions about who your brand is (and isn't), and deliberate mapping of persona traits to each stage of the buyer's journey. The brands that get the most value from this work don't stop at documentation. They operationalize it across marketing and sales, and they use performance data to evolve it over time.
If you're starting from scratch, begin with the audit. Pull your ads, your website copy, your sales decks, and your emails into one place and look at them honestly. Define your "we are / we are not" traits. Map them to the funnel. Document it simply. Then build a feedback loop using engagement, conversion, and pipeline data to keep refining. Your brand persona should feel less like a branding artifact and more like a strategic tool that sharpens everything your team produces.
Frequently asked questions about brand persona
Q1. What is a brand persona in simple terms?
A brand persona is the personality your brand would have if it were a person. It defines how your brand communicates, what attitude it takes, and how it makes people feel across every channel and touchpoint. It's the consistent human-like identity that ties together everything from your LinkedIn ads to your sales emails.
Q2. What's the difference between brand personality and brand persona?
Brand personality is the set of abstract traits you'd use to describe your brand, like innovative, reliable, or bold. Brand persona is how those traits actually show up in practice, through your communication style, perspective, emotional register, and behavior. Personality is the concept. Persona is the execution. You need both, but persona is what your audience actually experiences.
Q3. Why is brand persona important in B2B?
B2B buyers evaluate confidence and clarity before they ever speak to sales. A strong brand persona creates differentiation in crowded categories where most competitors sound identical. It builds trust through consistency, improves recall, and makes the eventual sales conversation significantly easier because the prospect already has a relationship with the brand's identity.
Q4. How do you create a brand persona?
Start by auditing your existing communication across all channels. Identify where your messaging is consistent and where it fractures. Define clear persona traits using a "we are / we are not" framework. Map those traits to different funnel stages so the emphasis adapts without the core identity changing. Document everything in a simple, usable format and embed it into your team's daily workflows.
Q5. Can a brand persona change over time?
It should. A brand persona that never evolves becomes disconnected from market reality and audience expectations. The most effective approach is to treat your persona as a living document that gets reviewed regularly and refined based on performance data, customer feedback, and market shifts. The core traits may remain stable, but how they're expressed should adapt as your brand and audience evolve.

Multi channel attribution: the B2B marketer's complete guide
Learn how multi channel attribution works in B2B marketing, how to choose the right attribution model, and how to track revenue across complex buyer journeys.
TL;DR
- Multi channel attribution assigns conversion credit across every marketing channel a buyer interacts with, giving B2B teams an accurate picture of what's actually driving pipeline and revenue.
- Single-touch models like first-click or last-click ignore the majority of a B2B buyer journey, which typically spans 10-20 touchpoints over months.
- The most common multi channel attribution models (linear, time-decay, position-based, and data-driven) each carry trade-offs, and stronger teams compare insights across several rather than relying on one.
- Implementation requires unified data across your CRM, ad platforms, and analytics tools, plus a clear definition of what "conversion" actually means for your business.
- Attribution is not a to-do for reporting, but a budgeting and strategy lever that tells you where to invest more and where to pull back.
Have you ever played dodgeball? (Just stick with me pls).
You know... when in dodgeball, the person who last touched the ball gets out. That's exactly what happens when your attribution approach boils down to "whoever touched the deal last gets the trophy." In reality, no single channel closed that deal. A prospect saw a LinkedIn ad three months ago, read two blog posts, attended a webinar, clicked a nurture email, and then booked a demo. Multi channel attribution exists precisely because B2B buying journeys are long, messy, and involve more touchpoints than most teams care to track manually.
That said, let’s move back to base… B2B… Imagine this: you're sitting in a quarterly marketing review with a steaming hot black coffee in hand. The paid team claims LinkedIn drove 40% of new pipeline… the content team is convinced their blog series was the real catalyst… sales credits a single cold outreach (of course!).
Everyone has a dashboard... and every dashboard tells a completely different story. The CFO is watching this unfold with the kind of patience usually reserved for delayed flights at O'Hare.
It's... the Rashomon of marketing meetings… same deal, five different narratives, and ZERO consensus.
This blog aims to breaks up how multi channel attribution actually works, which models are worth your time, what makes it uniquely challenging in B2B, and how to implement it without drowning in data. If you've ever struggled to answer "which channels really generate pipeline?", this is the piece to bookmark.
What is multi channel attribution, and why does it matter now?
Let’s go by definition first: Multi channel attribution is a method of assigning credit for a conversion across all the marketing channels that played a role in the buyer's journey. Instead of handing all the credit to the first or last interaction, it distributes that credit across multiple touchpoints so you can see which channels actually contributed.
The simplest way to think about it: single-touch attribution is like thanking only the person who scored the goal while completely ignoring the midfielder who threaded the pass and the defender who won the ball. And as a defender, that’s RUDE. Anyway, multi channel attribution acknowledges the whole team.
In traditional single-touch models, you'd pick either the first interaction (first-touch) or the last one before conversion (last-touch) and hand it all the credit. That works reasonably well when the buyer journey is short and simple. A consumer sees an ad, clicks, and buys. One channel… one decision… and it’s done. But B2B marketing doesn't work that way… and most B2B marketers figured that out the hard way… over many, many months. On that note, here’s a meme for you…
Why do B2B journeys break single-touch models?
Modern B2B buying journeys span multiple channels and multiple weeks (often months). A prospect might first encounter your brand through organic search, then see a retargeting ad on LinkedIn, read a case study, attend a virtual event, receive an email nurture sequence, visit your pricing page twice, and finally book a demo. That's eight touchpoints across six distinct channels.
If your attribution model only credits the demo booking page, you've just made organic search, LinkedIn ads, content, and email look like they contributed nothing. And when budget season comes around, those "non-contributing" channels are the first to get cut.
Here's a concrete example. A marketing director at a mid-market SaaS company sees your LinkedIn ad while scrolling during lunch. She doesn't click, but she remembers the brand name. Two weeks later, she searches for your product category and lands on a blog post through organic search. The following week, a colleague forwards her your webinar invite. She attends, engages with the Q&A, and signs up for a free trial the same day.
Without multi channel attribution, you'd credit either the LinkedIn ad (first-touch) or the webinar (last-touch). The blog post that built her understanding and trust? Invisible. The average deal involves 10-20 touchpoints before a conversion happens. Single-touch attribution doesn't just give an incomplete picture in these scenarios... it gives a misleading one.
Why does multi channel attribution matter so much in B2B marketing?
If you're marketing a $15 product, last-click attribution is probably fine. But if you're marketing a $50,000 annual contract with a six-month sales cycle, attribution accuracy becomes a budgeting problem, a strategy problem, and eventually a credibility problem.
- The buying committee problem nobody talks about enough
B2B buying cycles are loooooong. Three months is typical, and enterprise deals often stretch to twelve. During that time, multiple stakeholders within the buying organization are consuming content, evaluating options, and having internal conversations… some of which your analytics can't see.
- The budget allocation trap
Without multi channel attribution, marketing teams tend to over-invest in last-click channels like branded search or direct traffic because those are the channels that show up in conversion reports. Upper-funnel activities like brand campaigns, thought leadership content, and event sponsorships appear ineffective because they rarely get the final click.
The result is a slow erosion of the very activities that fill the top of the funnel, followed by a mystifying pipeline decline six months later… you've essentially been pulling weeds while removing your own root system. Ummm… not fun.
Multi channel marketing attribution gives teams visibility into the full pipeline. You can identify which channels drive initial awareness, which accelerate consideration, and which convert intent into action. You can measure the influence of content across the buyer journey and optimize campaigns at every funnel stage, not just the bottom.
- From "Wohoo! We got clicks" to "Wohoo! We drove revenue"
Revenue attribution connects marketing activity to actual revenue outcomes, not just leads or MQLs. It lets you say, "LinkedIn ads influenced $1.2M in pipeline this quarter" rather than "LinkedIn ads generated 340 clicks."
The first statement changes budgets, the second generates a fake smile during a slide deck presentation.
When attribution is working properly, marketing teams can have genuine strategic conversations about where to invest. Instead of debating which dashboard is correct, they can analyze which channels generate qualified pipeline and adjust spend accordingly. That shift from reporting to resource allocation is what makes multi channel attribution a strategic function rather than an analytics exercise.
SO, how does multi channel attribution actually work?
The concept behind multi channel attribution is intuitive: track all the marketing interactions that happen before a conversion and distribute credit across them. The execution, predictably, is where things get complicated. Understanding the data flow helps demystify the process and makes it easier to spot where your own implementation might break down.
Step 1: Track marketing touchpoints
Every attribution system starts with data collection. You need to capture the interactions prospects have with your brand across channels. That includes website visits, ad clicks, email opens and clicks, event attendance, content downloads, and CRM activity like sales calls or demo bookings. The more complete your tracking… the more accurate your attribution will be.
Step 2: Connect identities
A single prospect might visit your website anonymously from a mobile phone, click a LinkedIn ad from their desktop at work, and open an email from a different browser entirely. Attribution systems need to stitch these disparate interactions into a single identity. They use cookies, user IDs, CRM records, and account-matching logic to connect the dots.
In B2B, this often happens at the account level rather than the individual level, because multiple people within one company are part of the buying journey… so it only makes sense to track it on a macro, account level… also, GDPR?!
Step 3: Map the customer journey
Once identities are connected, the system creates a timeline of interactions for each account or individual. This timeline shows every touchpoint in chronological order, from the first moment of awareness to the final conversion event. Think of it as a narrative of the buyer's path, built from data rather than assumptions.
Step 4: Apply an attribution model
This is where the credit distribution happens. The model you choose determines how much weight each touchpoint receives. A linear model splits credit equally. A time-decay model gives more credit to recent interactions. A position-based model emphasizes the first and last touches. The choice of model shapes your understanding of which channels matter most, so it isn't a purely technical decision.
Step 5: Attribute revenue
The final step ties everything together. Once credit has been distributed across touchpoints, the system maps that credit to actual pipeline or revenue. If a deal worth $100,000 closes and your attribution model gives 30% credit to LinkedIn ads, that channel gets $30,000 in attributed revenue. This is the number that actually matters in budget conversations.
When this process works well, marketers can finally answer the question that haunts every QBR: which activities actually drive pipeline and revenue? The answer is almost never a single channel. It's a combination of interactions that, together, moved a prospect from "never heard of you" to "ready to sign."
The catch is that every step introduces potential for error. Incomplete tracking misses touchpoints… boken identity resolution… splits one buyer into two… the wrong model overweights specific channels. Attribution isn't a set-it-and-forget-it system; it requires ongoing calibration and a healthy skepticism about any single data point.
What are the most common multi channel attribution models?
Choosing a multi channel attribution model is a bit like choosing a map projection. Every option distorts something. The question is which distortion you can live with, given your marketing strategy and buying cycle. Here's a breakdown of the six most widely used models.
- First-touch attribution
All credit goes to the very first interaction. If a prospect's journey started with an organic blog visit, organic search gets 100% of the credit for that conversion. This model is useful for understanding top-of-funnel discovery... specifically which channels bring people into your orbit for the first time. The limitation is obvious: it ignores every nurturing touchpoint that happened between discovery and conversion. For B2B teams with long sales cycles, that's a lot of ignored activity.
- Last-touch attribution
The mirror image of first-touch. All credit goes to the final interaction before the conversion event. If a prospect booked a demo after clicking a retargeting ad, that ad gets full credit. Last-touch is the default in many analytics tools because it's simple and maps neatly to direct-response campaigns. The downside is that it systematically undervalues upper-funnel channels. The LinkedIn campaign that introduced the prospect to your brand three months ago? Gone without a trace.
- Linear attribution
Credit is split equally across every touchpoint in the journey. If there were five interactions before conversion, each gets 20% of the credit. The appeal is simplicity and fairness: no touchpoint is ignored. The problem is that it assumes every interaction had the same influence, which is rarely true. A casual blog skim and a 45-minute product demo don't carry the same weight in a buying decision. Linear attribution pretends they do... and that's its fatal flaw.
- Time-decay attribution
Touchpoints closer to the conversion receive progressively more credit. The logic is that recent interactions are more influential in the final decision. This model works well for long sales cycles where the most recent engagement signals genuine intent. It does, however, undervalue early-stage touchpoints that planted the seed, which can make your awareness campaigns look weaker than they are.
- Position-based (U-shaped) attribution
This model assigns heavier weight to two key moments: the first interaction and the lead-creation event. The remaining credit is distributed across the middle touchpoints. A common split is 40% to the first touch, 40% to the lead-creation touch, and 20% divided among everything in between. It captures both discovery and conversion signals, making it popular for B2B teams. The trade-off is that middle-funnel activities like email nurture and content engagement get compressed into a small slice of credit.
- Data-driven attribution
Instead of following a fixed rule, this model uses algorithms or machine learning to determine how much credit each touchpoint deserves. It analyzes patterns across many conversion paths to calculate the statistical contribution of each channel. The strength is precision; the weakness is that it requires large datasets to work reliably, and it can feel like a black box when you need to explain the results to stakeholders. (Nothing kills stakeholder trust faster than "the algorithm said so.")
Here's how these multi channel attribution models compare side by side:
None of these models are universally correct or wrong. The strongest B2B teams typically run two or three models in parallel and compare the insights. If linear attribution and time-decay both highlight the same channel as a strong performer, that's a signal you can trust. If they disagree sharply, it tells you the channel's contribution is stage-dependent... which is also useful information.
Multi channel attribution vs. multi touch attribution: what's the actual difference?
These two terms get used interchangeably so often that you'd be forgiven for thinking they mean the same thing. They don't, though the overlap is significant enough to cause genuine confusion in planning conversations.
Multi channel attribution focuses on which marketing channels drive conversions. The unit of analysis is the channel itself: LinkedIn ads, organic search, email, paid search, events. The question it answers is "which channels should we invest in?" When your CMO asks where to allocate next quarter's budget, multi channel attribution provides the answer.
Multi touch attribution focuses on the individual interactions within the buyer journey. It looks at every specific action a prospect took: reading a particular blog post, clicking a specific ad, attending a webinar on a certain date, viewing a pricing page. The question it answers is "which specific interactions influence the buying decision?"
Here's a comparison to make the distinction clearer:
The line between these two approaches has blurred considerably. Most modern customer journey attribution platforms combine both lenses. They can tell you that LinkedIn as a channel influenced 25% of pipeline (multi channel) and that a specific LinkedIn campaign featuring a customer testimonial drove three times more engagement than a product-feature ad (multi touch). The channel-level view informs strategy. The touchpoint-level view informs execution.
For B2B teams, the ideal setup is one that supports both perspectives. Channel-level data without touchpoint detail tells you where to spend but not how to spend it. Touchpoint data without channel context gives you tactical wins without strategic direction. You need both.
What makes multi channel attribution so challenging?
If multi channel attribution were easy, every marketing team would already have it running perfectly. The reality is that most teams struggle with some combination of data problems, identity gaps, and organizational friction. Understanding these challenges upfront saves you from building an attribution system that looks impressive on paper but falls apart in practice.
- Fragmented data across tools
This is the most common obstacle, and also the most stubborn. Marketing data typically lives in separate, disconnected systems: ad platforms like Google Ads and LinkedIn, web analytics tools, marketing automation platforms, and CRM systems. Each platform tracks its own version of reality, using its own definitions and its own attribution logic. Getting these systems to share a unified view of the buyer journey requires deliberate integration work, and often dedicated tooling.
- Identity resolution across devices and sessions
A single buyer might interact with your brand from a phone, a laptop, and a work desktop across multiple browsers. Before logging in or filling out a form, they're anonymous. After that first form fill, their earlier anonymous sessions need to be stitched back to their identity.
In B2B, the problem compounds because you're tracking buying committees, not individuals. Three people from the same company might each have their own anonymous sessions that need to be connected to a single account. This identity resolution challenge is technically demanding and rarely solved out of the box.
- The dark funnel and offline interactions
B2B buying includes a significant amount of activity that no analytics tool can see. Prospects discuss solutions in private Slack channels. They ask peers for recommendations on LinkedIn DMs. They read analyst reports, attend industry dinners, and hear about you from colleagues in conversations that never generate a trackable event.
These "dark funnel" interactions influence pipeline more than most marketers want to admit, and they're essentially invisible to attribution systems. Attribution debates sometimes resemble group projects where everyone claims credit for the final result, but the dark funnel is the quiet member who actually did most of the work.
- Attribution bias from model selection
Different multi channel attribution models produce different insights from the same data. Run a first-touch model and your content team looks like heroes. Run a last-touch model and your paid search team gets the trophy. Run a linear model and everything looks equally important, which means nothing stands out.
This variability isn't a bug; it's an inherent feature of modeling. But it does create confusion in cross-functional meetings where different teams prefer whichever model makes their channel look best. Without a clear governance process for how attribution data gets interpreted, the numbers can end up fueling politics rather than informing strategy.
- Long buying cycles that span quarters
When a deal takes six to twelve months to close, the attribution path stretches across multiple campaigns, budget cycles, and even team reorganizations. The touchpoints that mattered in month one may look irrelevant by the time the contract is signed in month nine.
Long buying cycles also mean your attribution data is always lagging. By the time you see that a channel influenced closed revenue, you've already made three months of budget decisions without that insight. It's a bit like driving using only your rearview mirror... technically you're looking at real data, just not the right direction.
These challenges don't mean multi channel attribution is impossible. They mean it's an ongoing practice, not a one-time setup. The teams that get the most value from attribution are the ones who accept its imperfections and use it as a directional guide rather than a source of absolute truth.
How do you implement multi channel attribution in B2B?
Start with clarity about what you're actually trying to measure and why. Most attribution projects fail because the team never agreed on what a "conversion" meant or which data sources mattered. Here's the path forward.
Step 1: Define your conversion goals
Before you wire up any integrations, get alignment on what counts as a conversion for your business. In B2B, this usually isn't a purchase… it might be a demo request, a sales-qualified opportunity, pipeline creation, or closed-won revenue.
Pick the conversion events that map to real business outcomes, and make sure marketing and sales agree on the definitions (good luck with that tho). If marketing counts "MQL created" as a conversion and sales counts "opportunity created," you'll end up with two attribution systems telling different stories. And yesssss, this happens more often than anyone would like to admit.
Step 2: Integrate your marketing and sales data
You need a unified data layer that connects your CRM, ad platforms, web analytics, and marketing automation. This is the infrastructure step, and it's usually the most time-consuming. Some teams build custom integrations using tools like Segment or a CDP. Others use attribution platforms that come with pre-built connectors. The goal is to get all your interaction data flowing into one place where it can be stitched together into coherent buyer journeys.
Step 3: Track all meaningful touchpoints
Just so you know… ‘meaningful’ is the key word here. You don't need to track every pageview, but you do need to capture the interactions that signal intent or engagement. That includes digital touchpoints like ad clicks, content downloads, webinar attendance, and pricing page visits. It also includes sales activities like discovery calls, demos, and proposal reviews.
Missing a major touchpoint category creates blind spots in your attribution, so take time to audit what you're tracking versus what's actually happening in the buying journey.
Step 4: Select your attribution model (or models)
Your choice of model should reflect your funnel complexity, average deal size, and typical buying cycle length. If your sales cycle is short and primarily digital, a time-decay or last-touch model might be a-ok. But if you're selling enterprise contracts with six-month cycles and five-person buying committees, position-based or data-driven models will give you a more useful picture.
Many teams start with a position-based model as a sensible default and then add data-driven modeling once they have enough volume to support it.
Step 5: Monitor attribution reports and act on them
The system is built, the dashboards exist, but nobody changes their behavior based on the data. Schedule regular reviews, ideally monthly, where marketing and sales leadership examine attribution reports together.
Use the insights to optimize budgets, improve targeting, and refine campaign strategy. If your attribution data consistently shows that a certain channel influences enterprise pipeline but doesn't generate many leads, that's a signal to protect its budget even when the MQL report looks a tad disappointing.
How long do all of these multi touch attribution steps take?
The entire implementation process typically takes B2B teams somewhere between four and twelve weeks, depending on the complexity of their tech stack and the quality of their existing data. It isn't a quick win. But the teams that invest in getting it right end up making dramatically better decisions about where to spend their marketing budget.
Which metrics should you measure in multi channel attribution?
Attribution generates a lot of data. The challenge isn't finding numbers; it's knowing which ones deserve attention. Not every metric that shows up in an attribution dashboard is worth tracking, and focusing on the wrong ones can be just as misleading as having no attribution at all.
The metrics that matter most for B2B multi channel attribution connect marketing activity to revenue outcomes, not just engagement.
- Pipeline influenced by channel
This tells you how much open pipeline each marketing channel contributed to. It's the most direct measure of which channels are generating business opportunities. If LinkedIn ads influenced $800K in pipeline last quarter and webinars influenced $1.2M, that shapes how you think about investment across those two channels.
- Revenue attributed by channel
Similar to pipeline influenced, but specifically tied to closed-won revenue. This metric carries the most weight in executive conversations because it connects marketing spend to actual business results. Revenue attribution in B2B is what turns marketing from a cost center perception into a growth function argument.
- Cost per opportunity
Divide your spend on a channel by the number of opportunities it influenced. This helps you compare efficiency across channels. A channel that generates expensive opportunities isn't necessarily bad if those opportunities are high-value, but cost per opportunity surfaces that trade-off clearly.
- Marketing ROI by channel
Revenue attributed to a channel divided by the spend on that channel. This is the metric your CFO cares about most. In cross-channel attribution, marketing ROI lets you benchmark channels against each other on a level playing field, which is the only fair comparison.
- Conversion rate by channel
What percentage of prospects from each channel ultimately convert? High-volume channels with low conversion rates might be filling the top of the funnel with the wrong audience. Low-volume channels with high conversion rates might deserve more investment than they're currently getting.
- Customer acquisition cost
The total cost of acquiring a new customer, broken down by the channels that contributed. In B2B, where acquisition costs can run into thousands of dollars, understanding how each channel impacts CAC helps you spot inefficiencies before they compound.
These metrics work best when reviewed together rather than in isolation. A channel with a high cost per opportunity but strong conversion rates and large deal sizes might still deliver excellent ROI. Viewing metrics in combination prevents premature conclusions about which channels are "working" and which aren't.
What tools and platforms support multi channel attribution?
The attribution tool landscape ranges from general-purpose analytics platforms that include basic attribution features to purpose-built revenue attribution platforms designed specifically for B2B. Where you fall on that spectrum depends on your team's maturity, your data infrastructure, and how seriously you need to track marketing attribution across channels.
- General analytics platforms
Tools like Google Analytics and Adobe Analytics offer built-in multi channel attribution models. Google Analytics lets you compare first-touch, last-touch, linear, time-decay, and position-based models out of the box. These tools work well for tracking digital touchpoint attribution and understanding web-based conversion paths.
The limitation is that they're primarily session-based and don't natively connect to CRM or revenue data. You can see which channels drove website conversions, but tying those conversions to actual pipeline or closed revenue requires additional integration work.
- Marketing automation and CRM platforms
Platforms like HubSpot include built-in attribution reporting that connects marketing touches to CRM contacts and deals. This is useful because it bridges the gap between marketing interactions and sales outcomes within a single platform. The trade-off is that these tools typically track only the interactions that happen within their own ecosystem.
- Customer data platforms
Tools like Segment help unify data from multiple sources into a single customer profile. They're not attribution tools in themselves, but they solve the data integration problem that often undermines attribution accuracy. If you're struggling with fragmented data across ad platforms, your website, and your CRM, a CDP can serve as the connective tissue that makes attribution possible.
- Dedicated B2B attribution platforms
Purpose-built platforms like Dreamdata are built specifically for the complexities of B2B revenue attribution. They typically offer account-level attribution, integration with major CRMs and ad platforms, and the ability to track long, multi-stakeholder buying journeys. These platforms are designed for teams that need to answer "which campaigns generate qualified pipeline?" rather than just "which pages get the most traffic?"
The difference between basic analytics tools and advanced revenue attribution platforms comes down to what you're measuring. Basic tools tell you what happened on your website. Advanced platforms tell you which marketing activities generated revenue. For B2B teams with complex buying journeys, that distinction matters enormously.
How does Factors.ai approach multi channel attribution?
Most of the challenges discussed throughout this guide converge on a single problem: B2B teams can't attribute revenue accurately because they can't see the full buyer journey. Fragmented data, anonymous website visitors, disconnected CRM and marketing signals... these aren't separate issues. They're the same issue wearing different hats.
Factors.ai is built to solve that specific problem.
The platform identifies anonymous website visitors at the account level, meaning you can see which companies are engaging with your content before anyone fills out a form. That early-stage visibility is crucial for attribution because it captures the top-of-funnel interactions that most tools miss entirely.
Factors connects marketing and sales signals into a unified timeline. Ad impressions, website visits, content engagement, CRM updates, and sales activities all appear in a single view of the buyer journey. No manual stitching across platforms required.
Account-level attribution is a core capability. Instead of tracking individual leads in isolation, Factors maps all the interactions from a buying committee back to a single account. This matches how B2B buying actually works, where multiple people influence a single decision.
Pipeline attribution connects marketing activity directly to opportunity creation and revenue. You can see which campaigns influenced specific deals, not just which campaigns generated clicks. Campaign-level and channel-level attribution reports make it straightforward to answer budget allocation questions.
Intent signals add another layer. Factors surfaces which accounts are showing buying intent based on their engagement patterns, helping teams prioritize accounts that are actively in-market rather than distributing effort evenly across the entire pipeline.
These capabilities help marketing teams answer the questions that actually matter. Which campaigns generate qualified pipeline? Which channels influence enterprise deals? Where should budget be increased, and where should it be pulled back? When attribution is built on complete data and account-level tracking, those answers become defensible rather than debatable.
Best practices that make multi channel attribution super useful
Implementing attribution is one thing. Making it genuinely useful for decision-making is another. Most teams that invest in attribution get the dashboards but miss the operational changes that turn data into action.
- Track the entire funnel, not just the bottom
Attribution reporting often defaults to measuring what happens near conversion: demo requests, trial starts, opportunity creation. But the upper-funnel interactions that drive awareness and consideration are equally important to capture.
If your attribution model only tracks mid-funnel and bottom-of-funnel touchpoints, you'll consistently undervalue the channels and content that fill the top of your pipeline. Measure influence across awareness, consideration, and conversion stages to get the full picture.
- Don't rely on a single attribution model
Every model carries bias. First-touch overstates discovery channels. Last-touch overstates conversion channels. Linear attribution flattens everything into equality. Running multiple models in parallel and comparing the insights gives you a more nuanced understanding of channel performance.
When three models agree that a channel is underperforming, you can act with confidence. When they disagree, that disagreement itself is a useful signal about the channel's role at different funnel stages.
- Focus on pipeline and revenue, not just leads
Lead volume is the vanity metric of B2B marketing. A channel that generates 500 leads and zero pipeline is less valuable than a channel that generates 50 leads and $2M in pipeline. B2B multi channel attribution should be anchored to pipeline creation and revenue, because those are the metrics that drive business decisions.
When your attribution reports speak the language of revenue, they earn trust from finance and leadership in a way that lead-count dashboards never will.
- Align marketing and sales data
Attribution breaks down when marketing and sales systems don't agree on basic definitions. If marketing's attribution tool shows that a lead was influenced by a webinar but the CRM has no record of that interaction, the data loses credibility.
Make sure your CRM and marketing automation systems are tightly integrated, with consistent definitions for lifecycle stages, conversion events, and opportunity ownership. Regular data hygiene reviews aren't glamorous, but they're the foundation that everything else rests on.
- Treat attribution as an evolving practice
Your marketing strategy changes… channels shift… new campaigns launch and old ones retire. An attribution model that was perfectly calibrated six months ago might be missing an entire channel that you've since added.
Review and refine your attribution setup at least quarterly. Check whether new touchpoints need to be tracked. Evaluate whether your model still reflects how your buyers actually purchase. Attribution isn't a project with a finish line; it's an ongoing practice that improves as your understanding of the buyer journey deepens.
- Use attribution data in actual budget conversations
This sounds obvious, but it's where most teams fall short. Attribution data gets produced, reviewed in a meeting, and then filed away while budget decisions get made based on gut feel and historical allocation.
Build a process where attribution insights directly feed into quarterly planning. If the data shows that event marketing consistently influences enterprise pipeline, that should be reflected in the budget. If paid social generates high lead volume but negligible pipeline, that needs to be confronted rather than ignored. The value of attribution lives entirely in the decisions it enables.
In a nutshell…
Multi channel attribution solves a problem that affects every B2B marketing team: understanding which channels actually contribute to pipeline and revenue across long, complex buying journeys. Single-touch models like first-click and last-click ignore the majority of a buyer's path, and that leads to budgets that reward the wrong channels and starve the right ones.
The core process involves tracking touchpoints across channels, connecting buyer identities across sessions and devices, mapping the full journey, and applying an attribution model that distributes credit appropriately. No single model is perfect. First-touch, last-touch, linear, time-decay, position-based, and data-driven models all carry trade-offs, and the best approach is to compare several rather than betting on one.
Implementation starts with clear conversion definitions, integrated data across your CRM and marketing stack, and comprehensive touchpoint tracking. It succeeds when attribution insights are regularly reviewed by marketing and sales leadership together, and when those insights actually change how budget gets allocated.
If you're just starting out, pick a position-based model, integrate your core data sources, and commit to a monthly review cadence. If you're more advanced, layer in data-driven modeling, account-level attribution, and intent signals. Wherever you are, the goal is the same: make marketing spend decisions based on evidence rather than assumptions. Attribution won't give you perfect answers, but it'll give you dramatically better ones than you had before.
Frequently asked questions for multi-channel attribution
Q1. What is multi channel attribution in B2B marketing?
Multi channel attribution is a method of distributing conversion credit across all the marketing channels that played a role in a buyer's journey, rather than giving all the credit to a single touchpoint. In B2B, where buying journeys span 10-20 touchpoints across months, it helps teams understand which channels actually influence pipeline and revenue.
Q2. What's the difference between multi channel attribution and multi touch attribution?
Multi channel attribution focuses on which channels (LinkedIn, organic search, email, events) drive conversions and deserve budget. Multi touch attribution focuses on the specific individual interactions within those channels. Most modern attribution platforms support both lenses because you need channel-level strategy and touchpoint-level execution.
Q3. Which multi channel attribution model is best for B2B?
There's no single best model, which is genuinely frustrating but true. Position-based (U-shaped) attribution is a popular starting point for B2B because it values both the first discovery touchpoint and the lead-creation moment. Data-driven attribution is the most accurate but requires large datasets. The strongest teams run two or three models in parallel and compare the insights.
Q4. How many touchpoints does a typical B2B buyer journey include?
Research consistently shows B2B buying journeys include 10-20 touchpoints before a conversion. Enterprise deals can include even more. This is precisely why single-touch attribution breaks down in B2B: it reduces a multi-month, multi-stakeholder journey to a single interaction.
Q5. What data do you need to implement multi channel attribution?
You need unified data from your CRM, ad platforms, web analytics, and marketing automation tools. Identity resolution across devices is essential, and for B2B specifically, account-level matching is critical since multiple stakeholders from one company contribute to a single buying decision.
Q6. Why does multi channel attribution matter for budget allocation?
Without multi channel attribution, teams tend to over-invest in last-click channels (branded search, direct traffic) because those appear in conversion reports. Upper-funnel activities like brand campaigns and thought leadership look ineffective because they rarely get the final click. Attribution reveals the full contribution of each channel, which prevents budgets from systematically starving the activities that actually generate pipeline.
Q7. What's the dark funnel and how does it affect attribution?
The dark funnel refers to buyer interactions that happen outside your trackable digital channels: peer recommendations, Slack conversations, analyst reports, industry events, private LinkedIn DMs. These interactions influence pipeline but don't generate trackable events. No attribution system captures the dark funnel perfectly, which is why attribution should be treated as a directional guide rather than a source of absolute truth.
Q8. How long does it take to implement multi channel attribution in B2B?
For most B2B teams, implementation takes four to twelve weeks, depending on tech stack complexity and existing data quality. The longer end usually reflects time spent on CRM and ad platform integrations, not the attribution modeling itself. Starting with clear conversion definitions before touching any tools is the single most important thing you can do to shorten that timeline.

Customer journey attribution: a complete guide for B2B marketing
Learn how customer journey attribution works in B2B marketing, including models, tools, and strategies to track revenue across the full buyer journey.
TL;DR
- Customer journey attribution tracks how every marketing and sales interaction contributes to pipeline and revenue, not just which channel got the last click.
- B2B buying cycles involve multiple stakeholders, non-linear journeys, and dozens of touchpoints, making single-touch models dangerously incomplete.
- Multi-touch attribution models like full-path and time decay give B2B teams a far more accurate picture of what's actually driving deals forward.
- Implementing attribution well requires integrated data across your CRM, ad platforms, and analytics tools, plus a clear definition of what counts as a meaningful touchpoint.
- Attribution isn't a set-it-and-forget-it exercise. The best teams revisit their models regularly as their marketing mix and buyer behavior evolve.
I have a theory that every B2B marketing team has, at some point, sat through a pipeline review where someone pointed at a closed deal and asked: "So... who gets credit for this?"
What follows is usually a performance. The paid media team mentions the LinkedIn campaign that 'started everything.' In fact, I feel like it was upto them (read: us), we'd say... we initiated the Big Bang. Now... the content team points to the three blog posts the account read before anyone even filled out a form. Sales says they did the real work, which, as much as I hate to admit, they have a case for. And someone in RevOps is in the corner, staring at their laptop, resisting the urge to pull up a spreadsheet.
All that said... customer journey attribution exists to end that meeting because it's all about mapping every interaction a buyer has with your company across the full journey, then assigning credit to each touchpoint based on what it actually contributed to the outcome. In B2B, where a single deal might involve six stakeholders, thirty touchpoints, and a sales cycle that outlasts a Netflix series, getting attribution right isn't a nice-to-have... it's the only way to know what's actually working... and prevent corporate gang-wars.
This not-so-little blog breaks down what customer journey attribution really means, how the major models work, where they fall apart, and how to implement a system that connects your marketing efforts to revenue in a way that's honest and actually useful.
What is customer journey attribution?
At its core, customer journey attribution is the process of identifying which marketing and sales interactions influenced a buyer's decision to convert. It goes beyond simply knowing that a deal closed and answers the harder question of which touchpoints along the way actually mattered.
Wait, that's not it... understanding customer journeys through attribution allows marketers to identify which channels and combinations produce customers with the highest lifetime value, informing budget allocation decisions. And another important benefit that goes unnoticed is this: customer journeys help create better personalized messaging for each stage.
The difference between basic attribution and journey attribution is something I want to spend three lines on. Basic attribution tends to look at a single moment, like which channel drove a form fill or which ad got a click, journey attribution takes the wider view. It considers the full sequence of interactions a buyer had with your brand, from the first anonymous website visit through to the signed contract, and evaluates how each one contributed.
Think about it this way. A prospect sees a LinkedIn ad in January... they click through, read a blog post, and disappear. THEN, in March, they attend your webinar. A week later, they visit your pricing page directly. By April, they request a demo and close in June. Basic attribution hands ALL the credit to the demo request page or to the LinkedIn ad, depending on whether you're using last-touch or first-touch. Journey attribution recognizes that all four of those interactions played a role in moving the buyer forward.
This difference is especially important in B2B marketing because buying cycles are like loopy roller-coasters. You're dealing with considered decisions made by groups of people over weeks or months. And obviously, the buyer who requests a demo didn't wake up one morning and think, "the sun is shining, the breeze is crisp... the perfect day to book a demo and invest in SaaS software". NO. They were influenced by a sequence of touchpoints that built trust, educated them, and made them ready to talk to sales. Customer journey attribution is the discipline of understanding that sequence.
Why does customer journey attribution matter for B2B marketing?
The strategic case for attribution in B2B comes down to a simple reality: marketing leaders are increasingly expected to demonstrate revenue contribution, not just activity. It's no longer enough to report on impressions, clicks, or even MQLs. Many marketers fall into the vanity metrics trap, celebrating high click-through rates or a large number of leads without asking whether those metrics correlate with revenue. The C-suite wants to know which marketing investments are generating pipeline and influencing closed revenue, and attribution is how you connect those dots.
B2B buying cycles make this particularly... urgent. When a deal takes four to six months to close and involves interactions across paid ads, organic search, content, email nurture, events, and sales outreach, it's genuinely difficult to say which of those efforts drove the outcome. Without attribution, marketing teams end up relying on gut feel or last-click data from Google Analytics, both of which paint an incomplete picture.
The budget implications are significantly high. When you can't prove which channels generate pipeline, you can't defend your budget in quarterly reviews. You end up cutting spend on channels that might actually be working simply because their contribution isn't visible in your reporting. Good attribution flips that dynamic, giving you evidence-based insight into where your money produces returns, so you can double down on what works.
Attribution also surfaces patterns that aren't obvious from surface-level metrics. A LinkedIn campaign might look expensive on a cost-per-click basis, but if attribution reveals that accounts exposed to those ads convert at twice the rate and close 30% faster, that changes the conversation entirely. Revenue attribution shifts the evaluation from channel cost to channel impact, which is a much more useful lens for strategic planning.
There's a reporting dimension here too. CMOs who can walk into a board meeting and say "our content program influenced 40% of pipeline this quarter" have a fundamentally different conversation than those who can only report on traffic and engagement. Attribution gives marketing a seat at the revenue table, and in most B2B organizations, that seat is earned through data.
How does the B2B customer journey actually work?
If you've ever mapped out a B2B buyer journey on a whiteboard, you'll know it looks less like a neat funnel and more like a plate of spaghetti bolognese. The linear model of awareness, consideration, and decision still provides a useful framework, but the actual behavior of buyers rarely follows that tidy path.
- The first complication is buying committees
Most B2B purchases, especially in enterprise software, involve between six and ten stakeholders. These aren't just decision-makers. They include influencers, evaluators, champions, and budget holders, each with their own information needs and preferred channels. One person might discover your company through organic search. Another sees a LinkedIn ad. A third gets forwarded a case study by a colleague. All of them are part of the same buying journey, interacting with completely different touchpoints. - The second complication is that these journeys are non-linear
A buyer might start by reading a blog post, disappear for three weeks, come back through a retargeting ad, attend a webinar, go dark again, and then suddenly request a demo after a peer recommendation you never tracked. The journey loops back on itself, stalls, accelerates, and takes detours that don't fit into any funnel stage. - The third complication is volume
A single account might accumulate dozens of interactions across LinkedIn ads, organic search visits, blog content, whitepapers, webinars, email newsletters, sales outreach, and retargeting before a deal is created. Each interaction contributes something, but the relative importance of each one varies enormously depending on context.
This complexity is exactly why attribution in B2B is both harder and more valuable than in simpler buying environments. An e-commerce company can often get away with last-click attribution because the purchase decision happens in one session (most of the times). In B2B, where the journey spans months and multiple people, that approach misses almost everything that matters.
What are the key marketing touchpoints across the buyer journey?
Understanding where touchpoints cluster across the buyer journey helps you think more clearly about what attribution is actually measuring. Every company's journey is different, but there are common patterns worth mapping.
- Awareness stage touchpoints (ToFu)
At the top of the funnel, buyers are discovering that a problem exists or that a category of solutions is worth exploring. The touchpoints here tend to be broad and content-driven. LinkedIn ads introducing your brand to a cold audience fall here. So do blog posts that rank for educational search queries, podcast appearances that put your company in front of new audiences, and SEO-driven content that captures early research intent. These interactions rarely lead to an immediate conversion, but they plant seeds that matter later.
- Consideration stage touchpoints (MoFu)
Once buyers know you exist, they start evaluating whether your solution fits their needs. The touchpoints here are more focused and often involve deeper engagement. Webinars that demonstrate your approach, case studies that show results from similar companies, product comparison pages, and email newsletters that keep your brand present during a long evaluation period all sit here. These interactions build confidence and move buyers from curiosity to serious interest.
- Decision stage touchpoints (BoFu)
At the bottom of the funnel, buyers are ready to make a purchase decision. The touchpoints here are high-intent and often involve direct interaction with sales. Demo requests, pricing page visits, free trial sign-ups, and sales calls are the obvious ones. But there are also less visible decision-stage touchpoints, like a champion sharing your ROI calculator with their CFO or a procurement team reviewing your security documentation. These final interactions often get disproportionate credit in simple attribution models, even though they wouldn't have happened without the earlier touchpoints that built trust.
Each stage contributes to pipeline influence in its own way. Awareness touchpoints create the conditions for a deal to exist. Consideration touchpoints nurture it forward. Decision touchpoints convert it. A good customer journey attribution model accounts for all three.
How do the most common customer journey attribution models work?
Attribution models are essentially rules for distributing credit across touchpoints. Each model reflects a different philosophy about which interactions matter most. Choosing the right one depends on your sales cycle, your data maturity, and the questions you're trying to answer.
- First-touch attribution
First-touch attribution gives 100% of the credit to the very first interaction a buyer had with your company. If a prospect first discovered you through a Google search and clicked on a blog post, that blog post gets all the credit for the eventual deal.
This model is useful for measuring demand generation effectiveness. It answers the question: "which channels are bringing new prospects into our world?" The limitation is obvious. It completely ignores everything that happened after that first interaction. In a B2B sales cycle with twenty touchpoints, crediting only the first one is like thanking the person who introduced you at a party for your entire friendship.
- Last-touch attribution
Last-touch attribution is the mirror image. It gives 100% of the credit to the final interaction before conversion. If a prospect's last touchpoint before requesting a demo was a retargeting ad, that ad gets all the credit.
This is the default model in most basic analytics tools, including standard Google Analytics setups. It's popular because it's simple and aligns with conversion-focused thinking. The problem is that it erases the entire journey that made the conversion possible. It rewards the closer and ignores everyone who set up the opportunity.
- Linear attribution
Linear attribution distributes credit evenly across every touchpoint in the journey. If a buyer had five interactions before converting, each one gets 20% of the credit.
The appeal is fairness and simplicity. Nobody gets over or under-credited. The drawback is that it assumes every interaction had equal impact, which is rarely true. A quick email open and an hour-long webinar don't contribute equally to a buying decision, but linear attribution treats them as if they do.
- Time decay attribution
Time decay attribution gives more credit to touchpoints that occurred closer to the conversion event. The logic is intuitive: interactions that happened right before a deal closed likely had more direct influence than those from three months earlier.
This model works well for long B2B sales cycles because it acknowledges the full journey while weighting the interactions that drove the final decision more heavily. It's a reasonable middle ground between first-touch simplicity and the complexity of full-path models.
- U-shaped attribution
U-shaped attribution, sometimes called position-based, assigns the most credit to two key moments: the first interaction and the lead conversion moment. A common split is 40% to the first touch, 40% to the lead creation touch, and the remaining 20% distributed across everything in between.
This model reflects the reality that two specific moments tend to be disproportionately important in early-stage marketing: how you attracted someone, and what finally convinced them to raise their hand. It's a popular choice for teams focused on demand generation metrics.
- Full-path attribution
Full-path attribution extends the U-shaped concept across the entire revenue cycle. It assigns meaningful credit to four key milestones: first touch, lead creation, opportunity creation, and closed deal. Each milestone typically receives around 22.5% of the credit, with the remaining 10% spread across the other touchpoints in between.
This is the model that most closely reflects how B2B buying actually works. It acknowledges that generating initial awareness, converting a lead, creating a sales opportunity, and closing a deal are all distinct achievements that deserve recognition. B2B marketers are increasingly adopting full-path attribution because it connects marketing activity to pipeline and revenue in a way that simpler models can't.
Attribution models compared at a glance
Also, there's nothing like 'right attribution model'. Your choice should depend on what questions you need to answer and how mature your data infrastructure is. Many teams start with simpler models and graduate to full-path as their tracking capabilities improve.
Single-touch vs. multi-touch attribution: what's the real difference?
The distinction between single-touch and multi-touch attribution is one of the most consequential choices a B2B marketing team makes when setting up their reporting. It shapes what you can see, what you optimize for, and how you talk about marketing's contribution to revenue.
Single-touch attribution, which includes first-touch and last-touch models, assigns all credit to one interaction. The appeal is obvious: it's simple, easy to implement, and produces clean reports. When someone asks "what channel generated this lead?", a single-touch model gives a clear, unambiguous answer. For small teams with limited data infrastructure, that clarity has real value.
The problem is that single-touch models are fundamentally misleading in B2B contexts. When a deal involves fifteen touchpoints across three stakeholders over four months, giving one of those touchpoints all the credit doesn't just oversimplify. It actively distorts your understanding of what's working. You might end up pouring budget into the channel that happened to be last in the sequence while starving the channels that created the opportunity in the first place.
Multi-touch attribution, which includes linear, time decay, U-shaped, and full-path models, distributes credit across multiple interactions. It reflects the reality that B2B buying decisions are shaped by many moments. The trade-off is complexity. Multi-touch models require better tracking, more integrated data, and a willingness to accept nuanced answers instead of simple ones.
For most B2B organizations with sales cycles longer than a few weeks, multi-touch attribution is worth the additional effort. The insight quality is dramatically better, and it's the only way to credibly connect marketing activity to revenue in a way that the C-suite takes seriously.
What makes customer journey attribution so challenging?
Attribution sounds straightforward in theory. In practice, it runs into a set of real-world obstacles that every B2B team eventually confronts. Understanding these challenges upfront helps you build a system that accounts for them rather than one that breaks the moment reality comes to life.
- Fragmented data across tools and platforms
Most B2B teams run their ad platforms, CRM, marketing automation, and website analytics as separate systems that don't naturally share data. Your LinkedIn campaign data lives in LinkedIn. Your lead data lives in HubSpot or Salesforce. Your website behavior lives in Google Analytics or a product analytics tool. Stitching together a complete buyer journey across these silos is technically demanding and often requires dedicated tooling or engineering support.
- Anonymous website visitors create blind spots
Many buyers interact with your website multiple times before they ever fill in a form or identify themselves. They read blog posts, visit your pricing page, and browse case studies as anonymous visitors. Until they convert, those interactions are invisible to most attribution systems. This means your attribution data is always missing the early chapters of the buyer's story, which are often the most important for understanding what sparked their interest.
- Offline interactions are hard to capture
Events, conferences, sales dinners, phone calls, and partner referrals all influence B2B buying decisions. But these offline touchpoints are notoriously difficult to track in any automated attribution system. Unless your team is disciplined about logging these interactions in your CRM, they'll be invisible in your attribution reports, which means your data will over-credit digital channels by default.
- Privacy regulations and tracking limitations are narrowing the window
Cookie restrictions, browser privacy changes, and regulations like GDPR have made it harder to track individual buyer behavior across the web. Third-party cookies are being phased out. Ad platforms are losing signal fidelity. These changes don't make attribution impossible, but they do require teams to invest in first-party data strategies and privacy-compliant tracking methods.
- Multiple stakeholders on a single account create attribution complexity
When six people from the same company each interact with different touchpoints, stitching those interactions into a single account-level journey is a challenge that most individual-based attribution tools weren't designed to handle. B2B attribution increasingly requires account-level thinking, where you aggregate touchpoints across all known contacts at a target account.
None of these challenges are reasons to abandon attribution. They're reasons to build your attribution system with realistic expectations and the right tools.
How do you implement customer journey attribution in B2B?
Implementation is where most attribution projects either become genuinely useful or quietly stall out. The teams that succeed tend to follow a structured approach rather than trying to boil the ocean on day one. Here's a practical sequence that works for most B2B organizations.
Step 1: Map your buyer journey from first touch to closed deal
Before you choose a model or buy a tool, you need a clear picture of how buyers actually move through your funnel. Interview your sales team. Review your CRM data. Look at the paths your last twenty closed deals took. The goal isn't a perfect map but a realistic one that captures the key stages and common interaction patterns. You'll likely find that your journey is messier than your funnel slides suggest, and that's a useful thing to know before you start building attribution logic on top of it.
Step 2: Define which touchpoints are meaningful enough to track
Not every interaction deserves attribution credit. You need to decide what counts as a meaningful touchpoint versus background noise. Website visits, form submissions, webinar attendance, ad engagement, content downloads, and demo requests are common choices. The key is to be intentional about it. If you track everything equally, your attribution data gets diluted. If you track too little, you miss important parts of the journey.
Step 3: Integrate your marketing and CRM data into a unified view
This is usually the hardest step and the one with the highest payoff. Your attribution system is only as good as the data flowing into it. That means connecting your CRM (Salesforce, HubSpot), your marketing automation platform (Marketo, HubSpot, Pardot), your ad platforms, and your website analytics into a system that can stitch together a complete journey. For some teams, native integrations between these tools are sufficient. For others, a dedicated attribution platform or data warehouse becomes necessary.
Step 4: Select the attribution model that fits your context
Your choice of model should depend on three factors: how long your sales cycle is, how mature your marketing and data operations are, and what questions you're trying to answer. Teams with short cycles and limited data might start with U-shaped attribution. Organizations with longer cycles and strong data infrastructure often gravitate toward full-path or time decay models. A basic model that's actually used and trusted is more valuable than a sophisticated one that nobody believes.
Step 5: Align attribution reporting with revenue metrics
The final step is connecting your attribution data to the numbers that matter. Pipeline generation, opportunity influence, and revenue attribution should be the primary outputs of your system, not just lead counts or channel-level engagement metrics. When your attribution reporting tells you which campaigns influenced how much pipeline and which channels contributed to closed revenue, you have the information you need to make real budget decisions.
Which tools and platforms support attribution analytics?
The attribution analytics landscape ranges from free, built-in features to dedicated enterprise platforms. Where you land on that spectrum depends on your budget, your data complexity, and how seriously your organization treats revenue attribution.
- Google Analytics is where most teams start. It offers basic attribution modeling out of the box, including last-click, first-click, linear, and time decay options. The limitation is that Google Analytics is fundamentally a web analytics tool. It tracks sessions and pageviews, not accounts, pipeline, or revenue. It can tell you which channels drive traffic, but it can't connect that traffic to a deal in your CRM.
- HubSpot's built-in attribution reporting is a solid step up for teams already on the HubSpot ecosystem. It connects marketing interactions to contacts and deals within HubSpot's CRM, giving you a more complete picture than standalone web analytics. It works best when most of your marketing and sales activity happens within HubSpot. If you're running a complex multi-platform stack, the data coverage can feel incomplete.
- Dreamdata is purpose-built for B2B revenue attribution. It focuses on connecting marketing touchpoints to pipeline and revenue at the account level, which is exactly the challenge most B2B teams struggle with. It integrates with CRMs, ad platforms, and marketing automation tools to build a more comprehensive picture of the buyer journey.
- Bizible (now Marketo Measure) is a popular choice for Salesforce-centric organizations. It sits inside Salesforce and tracks marketing touchpoints across the buyer journey, connecting them to opportunities and revenue. It's particularly strong for teams that want attribution data directly inside their CRM where sales and marketing leadership already operate.
Keep THIS in mind:
Between web analytics attribution and B2B revenue attribution platforms… web analytics tools measure channel performance on your website. Revenue attribution platforms measure marketing influence on pipeline and deals. For teams that really care about proving marketing's contribution to revenue, the latter category is where the real value lives.
How does Factors.ai track the full customer journey?
Most B2B attribution tools require a visitor to identify themselves before they can start tracking the journey. Factors.ai takes a different approach by beginning the tracking process before a prospect fills in a form.
Its account-level journey tracking identifies which companies are visiting your website, even when the individual visitors are anonymous. This means you can see that a target account has been browsing your product pages and case studies for weeks before anyone from that company submits a form. That early-journey visibility is exactly the data most attribution tools miss.
On the attribution side, Factors.ai offers multi-touch attribution modeling that measures marketing influence across ads, organic search, campaigns, and website activity. It connects these interactions to pipeline creation and revenue contribution within your CRM, so you can see which marketing efforts are actually driving business outcomes.
The platform also surfaces account intent signals. It identifies which accounts are showing buying behavior based on their engagement patterns, so your sales team can prioritize outreach to accounts that are actively in-market. Marketing sees which accounts are engaging. Sales sees which accounts are ready for outreach. Both teams work from the same data, which sounds simple but is rarer than you'd think.
For teams running account-based marketing programs, this combination of journey tracking, attribution, and intent data creates a feedback loop that actually works. Marketing can see which campaigns are influencing target accounts. Sales can see which accounts are warming up. And leadership can see how marketing activity connects to pipeline and revenue at the account level.
Best practices for B2B attribution
Attribution is as much an organizational discipline as it is a technical one. The teams that get the most value from it tend to follow a few consistent principles that go beyond just picking a model and running reports.
- Default to multi-touch models for any B2B sales cycle longer than a month
Single-touch models are tempting because they're simple, but they're fundamentally incompatible with how B2B buying works. If your average deal involves more than three or four meaningful marketing interactions, you need a model that accounts for all of them.
- Track journeys at the account level (not just the individual level)
B2B purchases are made by buying committees. If your attribution system only tracks the person who filled in the demo form, you're missing all the interactions that other stakeholders had with your brand. Account-level buyer journey tracking gives you the complete picture and aligns your attribution with how deals actually happen.
- Integrate your CRM and marketing data before you worry about models
The most sophisticated attribution model in the world is useless if it's running on incomplete data. Before you invest time in model selection, make sure your CRM, marketing automation, ad platforms, and website analytics are connected and sharing data reliably. Data integration is the unsexy foundation that makes everything else work.
- Monitor pipeline influence and revenue contribution, not just lead volume
Attribution should tell you which channels influence pipeline and closed revenue, not just which ones generate the most form fills. A channel that produces 100 leads but zero pipeline is less valuable than one that produces 10 leads that turn into 5 opportunities. Make sure your reporting reflects that distinction.
- Revisit your attribution model at least once a year
Your marketing mix changes. Your buyer behavior evolves. New channels emerge. An attribution model that was perfect eighteen months ago might be giving you misleading data today. The best teams treat attribution as a living system, not a one-time setup.
- Get buy-in from both marketing and sales leadership
Attribution only works as a strategic tool when both teams trust the data. If sales doesn't believe the attribution numbers, they won't use them. If marketing doesn't trust the model, they'll build shadow reports. Align both teams on what's being measured, how credit is distributed, and what the data means for their shared goals.
- Accept that no model is perfect, and communicate that honestly
No attribution model answers every question perfectly, and anyone who tells you otherwise is probably selling one. Every model has trade-offs and blind spots. The idea is to get a directionally accurate picture that's vastly better than no attribution at all.
Attribution should evolve alongside your marketing maturity. A team that's just starting out might use linear attribution and manual CRM tagging. A team with mature operations might use full-path attribution with automated account-level tracking. Both are valid starting points. What matters is that you're consistently improving your ability to connect marketing activity to business outcomes.
In a nutshell…
Customer journey attribution is how B2B marketing teams move from guessing at channel performance to actually understanding what drives pipeline and revenue. Track the touchpoints buyers interact with across the full journey, then use an attribution model to assign credit based on each touchpoint's contribution to the outcome.
The practical reality is more nuanced than that. B2B buying cycles are long, non-linear, and involve multiple stakeholders interacting with different channels at different times. Single-touch models are easy to implement but dangerously incomplete for this kind of complexity. Multi-touch models, especially full-path attribution, give a far more honest picture of what's working.
Implementation requires three things working together: clean, integrated data across your CRM, ad platforms, and analytics tools; a clearly defined set of meaningful touchpoints; and an attribution model that fits your sales cycle length and data maturity. You also need organizational alignment between marketing and sales on what the data means and how it should inform decisions.
If you're just getting started, pick a multi-touch model, integrate your core data sources, and start tracking at the account level. You can refine the model over time as your data and processes mature. If you've been running attribution for a while, audit your current model against your actual buyer journey. Make sure it still reflects how your customers buy, not how they bought two years ago.
The teams that treat attribution as an ongoing discipline rather than a one-time project are the ones that end up with the clearest view of marketing's contribution to revenue. And that clarity is what earns marketing a genuine seat at the revenue table.
Frequently asked questions about customer journey attribution
Q1. What is customer journey attribution?
Customer journey attribution measures how different marketing and sales interactions contribute to a customer converting, assigning credit across multiple touchpoints rather than a single channel. It gives B2B teams visibility into which activities actually influence pipeline and revenue, rather than just tracking surface-level metrics like clicks or impressions. The goal is to understand the full sequence of interactions that leads to a business outcome.
Q2. What's the difference between attribution and customer journey analytics?
Attribution and customer journey analytics are related but distinct. Attribution assigns credit to specific touchpoints that influenced a conversion, answering the question "what marketing activities deserve credit for this deal?" Customer journey analytics focuses on understanding behavior patterns across the buyer journey, like how long buyers spend in each stage, where they drop off, and which paths are most common. Both are valuable, but they answer different questions.
Q3. Why is attribution important in B2B marketing?
B2B sales cycles are long and involve many interactions across multiple channels and stakeholders. Without attribution, marketing teams can't credibly demonstrate which activities contributed to pipeline and revenue. This makes it difficult to defend budgets, optimize spend, or have meaningful conversations with the C-suite about marketing's impact on business results.
Q4. What is the best attribution model for B2B?
There's no single best model for every B2B organization, but multi-touch models consistently outperform single-touch approaches for complex buying cycles. Full-path attribution and time decay are popular choices because they reflect the reality that multiple interactions across different funnel stages all contribute to a deal. The right model depends on your sales cycle length, data maturity, and the specific questions you need to answer.
Q5. How do attribution tools work?
Attribution tools work by combining data from marketing platforms, CRM systems, and website tracking to build a complete picture of the buyer journey. They identify which touchpoints a buyer interacted with before converting, then apply an attribution model to distribute credit across those interactions. The more data sources connected to the tool, the more complete and accurate the attribution picture becomes. Advanced B2B platforms also track at the account level, aggregating interactions across multiple contacts at the same company.
Q6. What's the difference between single-touch and multi-touch attribution?
Single-touch attribution gives all credit to one interaction, either the first or last touchpoint before a conversion. Multi-touch attribution distributes credit across multiple interactions throughout the buyer journey. For B2B sales cycles longer than a few weeks, multi-touch models give a far more accurate picture of what's actually influencing deals, even if they require more data and setup to implement correctly.

Sales attribution
Learn how sales attribution connects marketing efforts to revenue. Explore models, strategies, and practical steps to prove what's actually driving pipeline.
TL;DR
- Sales attribution connects specific marketing and sales activities to revenue, so you stop defending budgets with vanity metrics and start talking about what actually moved the pipeline.
- Single-touch models (first touch, last touch) are easy to set up but deeply misleading in long B2B sales cycles. Multi-touch models are more work, but they reflect how buying decisions actually happen.
- The right model depends on your sales cycle length, your data infrastructure, and the specific questions your team is trying to answer.
- Getting attribution right requires clean CRM data, integrated systems, aligned definitions between marketing and sales, and a tolerance for directional accuracy over false precision.
- The real payoff is knowing where to invest, what to cut, and why your best deals actually happened.
I was in a quarterly review once where the marketing team had clearly put serious effort into their deck… and I can tell you they did because I was in the marketing team and I saw it. #MarketingRox

The LinkedIn campaign had driven 4,200 clicks… the webinar series had 900 registrants… the content syndication program had generated 1,100 leads. SUCH lovely numbers… beautiful color coding. And THEN… the CFO leaned forward and asked one question (yes, that one we all hate): "Which of these actually led to closed revenue?" We all went quiet for a really long time (6 seconds), and I can most certainly say… we wanted to delete ourselves from the room asap. (Whatever happened to that effort?!)
That one moment shows us exactly why sales attribution has become one of the most important (and most argued-about) topics in B2B marketing. It's the practice of connecting your marketing and sales activities to actual revenue outcomes. Not clicks, impressions, or MQLs crammed into a ex-cell (read: Excel cell) in a spreadsheet, but real pipeline and real closed deals. When you get it right, you stop guessing which campaigns matter and start making investment decisions with actual evidence. When you ignore it, you end up presenting beautiful dashboards to a CFO who just wants to know what made money. (How boring.)
The challenge is that B2B buying journeys look like my 3-year-old nephew’s birthday card to me… it’s well-intentioned but a littttttle haywire. A prospect might read a blog post in January, attend a webinar in March, click a retargeting ad in May, and finally take a sales call in July. Deciding which of those interactions caused the deal is suuuper complicated, and the answer changes depending on the attribution model you choose.
I’ve written this (vvv long) blog with the thought of taking you through all of it: what sales attribution actually means in practice, the models available, how to pick between them, and how to build a system that gives your team real, CMO-y answers instead of decorative reports.
What is sales attribution, and why should B2B marketers care?
Let’s start with a formal definition:
Sales attribution is the process of identifying which marketing and sales touchpoints contributed to a conversion, a pipeline opportunity, or a closed deal. In plain terms, it answers: "What did we actually do that helped win this customer?"
That sounds simple until you remember that B2B is not Walmart… or e-commerce. Someone sees an Instagram ad, buys sneakers, done. The attribution story is as simple as ABC.
In B2B, like we saw above, the average B2B purchase looks like this…

… because it involves multiple stakeholders, research phases stretching over weeks or months, and a mix of marketing channels and sales interactions that blur into each other by the time anyone signs anything.
Without attribution, marketing teams are left defending their budgets with activity metrics. "We generated 2,000 MQLs this quarter" sounds uber-impressive until someone asks how many of those became customers. And this someone is almost always the CMO because that’s their job?! Sales teams, meanwhile, often claim full credit for closing the deal without acknowledging the months of marketing work that warmed the prospect up. (If you’re from sales, I’m glaring at you, but with a sweet smile). Attribution gives both sides a shared reality to work from, which is a much better situation than everyone operating from separate realities and calling it ✨alignment✨.
The reason attribution matters wayyyy beyond budget defense is that it directly shapes where you invest. If you can't connect your webinar program to pipeline, you can't make an informed decision about running it again next quarter. If you can't see that a specific content series is consistently appearing in the journeys of your highest-value deals, you might cut it because the top-of-funnel numbers look weak. Attribution turns marketing from a cost center that reports on activities into a function that reports on outcomes.
There's also the alignment angle. Marketing celebrates lead volume. Sales celebrates closed revenue. Attribution creates a shared language that connects both, letting each team see how their work feeds into the other's results. Attribution debates can start to resemble group projects where everyone claims credit for the final grade, but having data to anchor the conversation is meaningfully better than having no data at all.
How does sales attribution actually work in B2B?
The mechanics depend on what you're tracking, where your data lives, and which model you're using. But the underlying logic is consistent… you're mapping a buyer's journey from first interaction to closed deal, then assigning credit to the touchpoints along the way.
This obviously starts with tracking. Every meaningful interaction a prospect has with your brand needs to be captured somewhere. That includes ad clicks, website visits, content downloads, webinar attendance, email opens, demo requests, and sales calls. Most B2B teams use a combination of their CRM (Salesforce, HubSpot, or similar), a marketing automation platform, ad analytics, and sometimes a dedicated attribution tool to stitch all of this together.
Once you have touchpoint data, the attribution model determines how credit gets distributed. A first-touch model gives all credit to the very first interaction. A last-touch model gives it all to the final interaction before conversion. Multi-touch models spread credit across multiple interactions, using different weighting schemes depending on the model. Each approach tells a different story about the same buyer journey, and each comes with trade-offs worth understanding before you commit to one.
The tricky part in B2B is that buying journeys involve multiple people… I’m not going to repeat the same thing for the third time, ‘cause you’ll stop reading. You know the drill. Account-based attribution handles this roller-coaster-y journey by grouping touchpoints at the account level rather than the individual level. Instead of asking "what did this person interact with?", you're asking "what did anyone at this company interact with before they became a customer?" That's a much more realistic reflection of how B2B buying committees actually work.
There's also the absolutely unavoidable reality of offline touchpoints. B2B deals frequently involve interactions that you can’t see in a trackable digital channel: a conversation at a conference… a referral from a mutual connection… an internal champion who already knew your brand from a previous job. At this point, you should know that no attribution system captures everything. The goal here is not perfect coverage, it's enough visibility to make better decisions than you'd make flying blind.
Single-touch vs. multi-touch attribution: What's the difference?
This is where most B2B teams start their attribution thinking and where a lot of confusion piles up. The distinction is fundamental, so it's worth getting clear on what each approach actually does and where each falls short.
- Single-touch attribution
Single-touch models assign 100% of the credit for a conversion to one touchpoint. The two most common versions are first-touch and last-touch.
- First-touch attribution gives all credit to the very first interaction a prospect had with your brand. If someone first found you through an organic search result, that search gets full credit for everything that followed, even if the deal closed nine months and thirty touchpoints later. The logic is that without that initial discovery, nothing else would have happened.
- Last-touch attribution does the opposite. It gives all credit to the final interaction before the conversion event. If the prospect's last touchpoint before requesting a demo was clicking a retargeting ad, that ad takes full credit. The logic here is that this was the moment that tipped the prospect into action.
Both models are simple to set up and easy to explain to stakeholders, which is exactly why they're popular. The problem is that the answer they give is usually misleading. In B2B, where buying journeys can involve 30 or more touchpoints over several months, giving all credit to one moment is like crediting only the last pass in a soccer match for the entire team's effort. It tells you something. It just ignores almost everything that actually happened.
First-touch attribution tends to over-value awareness channels and under-value anything that nurtures and converts. Last-touch does the reverse, making bottom-of-funnel tactics look disproportionately effective while the content and campaigns that built the relationship get zero recognition. If your team relies solely on last-touch data, you might conclude that your blog, your webinar series, and your LinkedIn program are all useless because they rarely show up as the final click before a demo request. That conclusion would be spectacularly wrong.
2. Multi-touch attribution
Multi-touch attribution (MTA) distributes credit across multiple touchpoints in the buyer journey. Instead of picking one winner, it acknowledges that several interactions contributed to the outcome.
There are several versions of multi-touch attribution, each using a different logic for distributing credit. Linear attribution splits credit equally across all touchpoints. Time-decay attribution gives more credit to interactions that happened closer to the conversion. U-shaped attribution gives the most credit to the first and last touchpoints, with the remainder split among everything in between. W-shaped attribution adds a third high-credit moment, typically the lead-creation event.
The advantage of multi-touch models is that they paint a much more realistic picture of how B2B deals actually develop. They recognize that the blog post that introduced a prospect to your brand and the case study that convinced them to book a demo both played a role, even if those interactions were months apart. This makes multi-touch attribution significantly more useful for understanding your full funnel.
The trade-off is… complexity. Multi-touch data is harder to collect, harder to maintain, and harder to explain to stakeholders who want a simple "so what's working?" answer. It also requires clean, connected data across your entire tech stack. If your CRM doesn't talk to your marketing automation platform, or if your ad data lives in isolation, multi-touch attribution breaks down fast.
Most teams eventually realize that single-touch attribution is a starting point, not a permanent home. It works when you're just getting started and don't have the data infrastructure for anything more sophisticated… but if you're making real budget decisions based on attribution data, multi-touch is where the actual insight lives.
The most common sales attribution models (explained without the buzzy buzzwords)
Let's go over the specific models you'll encounter, what each one does, and where it's most useful. Again, no model is perfect for every situation, so the goal is to understand the trade-offs clearly enough to choose the right one for your context.
- First-touch attribution
This model gives full credit to the first recorded interaction. If a prospect's journey started with a Google search that landed them on your pricing page, that organic search touchpoint gets 100% of the attribution credit.
It's useful for understanding which channels are best at generating initial awareness. If you're trying to answer "where do our best prospects first hear about us?", first-touch data is genuinely helpful. It falls apart when you use it to evaluate anything happening downstream from that first moment.
- Last-touch attribution
This model gives full credit to the final interaction before the conversion. If the prospect's last touchpoint was a direct visit to your demo page, that direct visit takes everything.
It's useful for understanding which activities are most effective at triggering a conversion action. The limitation is the same as first-touch but in reverse: it ignores the entire relationship-building phase that came before.
- Linear attribution
Linear attribution splits credit equally across every touchpoint in the journey. If a prospect had ten interactions before converting, each one gets 10% of the credit.
The advantage is simplicity and fairness. No touchpoint gets overlooked. The disadvantage is that it treats a casual blog visit the same as a high-intent demo request. Not all touchpoints carry equal weight, and linear attribution has no mechanism to distinguish between them. It's a decent stepping stone for teams moving from single-touch to multi-touch, but most outgrow it relatively quickly.
- Time-decay attribution
Time-decay gives more credit to touchpoints that happened closer to the conversion event, and less credit to earlier interactions. The logic is that recent interactions had more influence on the final decision.
This model works well for shorter sales cycles or where bottom-of-funnel activity is genuinely the most decisive factor. It's less useful in long B2B sales cycles where early-stage touchpoints, like a thought leadership piece that first put your brand on someone's radar, play a critical but hard-to-measure role.
- U-shaped (position-based) attribution
The U-shaped model gives the heaviest credit (typically 40% each) to the first touch and the lead-creation touch, with the remaining 20% spread across the middle touchpoints. It prioritizes the moment of discovery and the moment the prospect became a known lead.
This is popular among B2B marketers because it highlights two genuinely important moments: how the prospect found you, and what convinced them to raise their hand. The weakness is that it can undervalue nurture activities that kept the prospect engaged between those two key moments.
- W-shaped attribution
W-shaped attribution extends the U-shape by adding a third high-credit moment: the opportunity-creation event, when a lead becomes a qualified pipeline opportunity. Credit is typically split 30/30/30 across first touch, lead creation, and opportunity creation, with the remaining 10% distributed among everything else.
For B2B teams that track pipeline stages carefully, this model captures more of the journey's critical moments. It's more complex to set up because it requires accurate opportunity-stage tracking in your CRM, but the output is significantly more useful for understanding the full funnel.
- Full-path attribution
Full-path attribution adds a fourth credited moment: the closed-deal event. It typically distributes credit across first touch, lead creation, opportunity creation, and deal close, with a small percentage spread among the touchpoints in between.
This is the most comprehensive model for B2B teams that want to see the entire journey from awareness to revenue. It's also the most demanding in terms of data requirements. You need accurate tracking at every funnel stage, clean CRM data, and a way to stitch together interactions across multiple people at the same account. When it works, it's the closest you'll get to a complete picture. When the data is messy, it produces confident-looking numbers that aren't reliable.
- Algorithmic (data-driven) attribution
Algorithmic attribution uses machine learning to analyze your historical conversion data and determine which touchpoints have the strongest statistical correlation with outcomes. Instead of applying a predetermined weighting scheme, it lets the data decide.
Several dedicated attribution tools (like HockeyStack or Dreamdata) offer cross-channel algorithmic models. The advantage is that the model adapts to your specific data. The disadvantage is that it requires a large volume of conversions to produce reliable results. If you're closing 15 deals a quarter, algorithmic attribution won't have enough data points to be meaningful.
No attribution model answers every question perfectly, and anyone who tells you otherwise is probably selling one. Most B2B teams find the most value somewhere between U-shaped and W-shaped attribution, where the model captures enough of the journey's complexity without requiring a data engineering team to keep it running.
Why does full-funnel attribution actually matter for B2B teams?
B2B sales cycles are loooooong… and so, full-funnel attribution matters because anything less gives you a distorted picture of what's driving revenue.
Say your team runs a LinkedIn awareness campaign targeting VP-level buyers at mid-market SaaS companies. The campaign generates impressions and some engagement, but very few direct conversions. If you're using last-touch attribution, the campaign looks like a waste of money. But when you look at the full funnel, you notice that a significant percentage of your closed-won deals include a LinkedIn impression or click somewhere early in the journey. The awareness campaign isn't closing deals directly, but it's consistently seeding the accounts that eventually convert. Without full-funnel visibility, you'd kill a program that's doing essential work.
The core issue is that B2B buying is too long and too layered to evaluate any single stage in isolation. Top-of-funnel activity builds awareness. Middle-of-funnel activity nurtures interest and builds trust. Bottom-of-funnel activity converts that trust into action. Each stage contributes to the outcome, and judging one without the others leads to bad decisions.
Full-funnel attribution also changes how you think about the marketing and sales relationship. When you can see that a prospect was influenced by marketing at three different stages before sales closed the deal, the "who gets credit?" debate becomes much less interesting. Both teams contributed. The data shows it. That shared visibility is genuinely useful for building a collaborative revenue culture instead of a political one.
One common mistake is treating full-funnel attribution as just combining first-touch and last-touch data. That's better than nothing, but it still misses the middle. The nurture phase, where prospects engage with case studies, attend webinars, read comparison content, and gradually build conviction, is often the longest phase of the B2B journey. Attribution models that skip this phase leave a meaningful gap in your understanding.
How to choose the right sales attribution model for your team?
Choosing an attribution model isn't a one-time decision. The decision to choose an attribution model depends on your team's current situation and the questions you're trying to answer.
Step 1: Assess your sales cycle length and complexity
If your average sales cycle is under 30 days and involves one or two touchpoints, single-touch attribution might genuinely be sufficient. You don't need a W-shaped model to understand a two-step journey. But if your cycle stretches over multiple months and involves multiple stakeholders, you need a multi-touch approach. The more complex the journey, the more important it becomes to distribute credit appropriately.
Step 2: Audit your data infrastructure with max honesty (because it is the best policy… duh?!)
Attribution is only as good as the data feeding it. Ask yourself: is your CRM tracking every meaningful sales interaction? Is your marketing automation platform capturing website visits, email engagement, and form submissions? Are your ad platforms connected to your CRM? Can you link touchpoints to specific accounts, not just individual contacts? Are your lifecycle stages consistently defined and actually maintained? If you answered no to more than two of these, fix your data foundation before investing in a complex attribution model. A sophisticated model running on messy data produces confident-looking numbers that are wrong. That's worse than having no model at all, because people will make decisions based on those numbers.
Step 3: Define what decisions the model needs to support
Different models answer different questions. If you want to know where to invest your awareness budget, first-touch or U-shaped attribution is the right lens. If you want to understand what converts leads to opportunities, W-shaped or time-decay gives you better signal. If you want to understand which channels contribute to closed revenue across the full journey, full-path or algorithmic modeling is worth the investment. Start with the question, then pick the model that answers it.
Step 4: Start simple and layer complexity over time
If you don't currently have any attribution, don't jump straight to algorithmic modeling. Start with first-touch and last-touch. Get comfortable with the data. Identify the obvious gaps. Then move to a multi-touch model. A team that deeply understands U-shaped attribution and uses it to inform budget decisions every quarter is in a much better position than a team with a full-path model sitting in a dashboard nobody checks.
Step 5: Revisit and recalibrate regularly
Your attribution model should evolve as your business evolves. If you add a new channel, the model needs to account for it. If your sales cycle changes significantly, the model's assumptions need updating. A quarterly review cadence works well for most teams.
Common sales attribution challenges, and what you can actually do about them
Attribution in B2B is genuinely hard, I get it. Here are some of the biggest obstacles and what you can actually do about them:
- The data lives in silos
Most B2B teams run their ad platforms, CRM, website analytics, and marketing automation as separate systems that don't share data cleanly. When your data is fragmented, stitching together a complete buyer journey becomes a technical project before it can become a marketing insight. The fix is to invest in integration before investing in attribution tooling. Use native integrations, middleware like Zapier or Workato, or a CDP to connect your systems. Even connecting your top three data sources gives you a dramatically better foundation.
- Offline touchpoints are invisible
Trade show conversations, referral introductions, and in-person meetings are all significant drivers of B2B deals. None of them show up in digital attribution data unless someone manually logs them. The fix is to build a culture of logging offline interactions in your CRM as part of the sales process, not as an optional extra. Use UTM parameters and unique landing pages for events. Create offline campaign tags for trade shows and referral programs. You won't capture everything, but you'll capture enough.
- Long sales cycles create tracking gaps
When a deal takes six months to close, the tracking that links a prospect's early website visits to their eventual conversion may have expired or been broken by device switches, incognito browsing, or untracked channels. The fix is to rely more on first-party data (CRM records, form submissions, email engagement) than on cookie-based tracking for long cycles. Encourage early identification through gated content and webinar registration so prospects enter your CRM early in their journey.
- Multiple stakeholders create attribution confusion
A typical buying committee might include three to ten people, each engaging with different touchpoints at different times. Individual-level attribution misses this entirely. The fix is to move toward account-level attribution, grouping touchpoints by company rather than individual contact. This requires clean data: consistent company naming, proper contact-to-account linking, and a process for merging duplicate records. Unglamorous work, but essential.
- Marketing and sales define things differently
If marketing counts someone as an MQL when they download a whitepaper, and sales doesn't consider them qualified until they've had a discovery call, the attribution data will tell conflicting stories. The fix is to agree on funnel stage definitions before implementing attribution. What constitutes a lead? An MQL? An SQL? An opportunity? Write it down, share it, and use it consistently across both teams. This sounds obvious. It rarely actually happens.
- Stakeholders want simple answers to complicated questions
The CFO wants to know which channel drove the most revenue. The answer is almost never clean in a multi-touch world. The fix is to present attribution data with context rather than just numbers. Explain the model, the assumptions, and what the data does and doesn't tell you. Stakeholders respect transparency more than false precision, even if their first instinct is to push for a single definitive number.
And as if all this was not enough… privacy regulations and the shift towards cookie-less tracking have created challenges for marketing attribution, as traditional methods often rely on cookies to track user behavior across platforms. Cross-device tracking presents a significant challenge for attribution, as users often interact with brands across multiple devices, making it difficult to create a unified view of their journey.
How to set up sales attribution, a step-by-step approach
Building a functional attribution system isn't a weekend project. It's a process that involves data, tooling, and organizational alignment. Here's a practical sequence for getting it right.
Step 1: Define your conversion events
Before you can attribute anything, you need to define what you're attributing to. The most common conversion events in B2B are lead creation (a prospect becomes a known contact), MQL (marketing deems the lead qualified enough to pass to sales), SQL or opportunity creation (the lead enters the active pipeline), and closed-won (the deal is signed). You can run attribution against any or all of these. Most teams start with lead creation or opportunity creation and layer in closed-won attribution as their data matures.
Step 2: Map your touchpoint taxonomy
Create a consistent system for categorizing touchpoints. This typically includes channel (organic search, paid social, email, events), campaign (the specific initiative), content type (blog post, webinar, case study), and interaction type (click, download, registration, submission). Consistency matters enormously. If one team member tags a campaign as "LinkedIn-ABM-Q1" and another tags it as "Q1_LinkedIn_ABM_campaign", your attribution data will treat them as separate campaigns. Set naming conventions early and actually enforce them.
Step 3: Implement tracking across channels
At minimum, you need UTM parameters on every link you share externally, website tracking via your marketing automation platform, CRM activity tracking for sales interactions, and ad platform integration so that click and impression data flows into your central system. The goal is a single timeline for each account that shows every meaningful interaction across channels. Start with your highest-volume channels and expand from there.
Step 4: Connect your systems
Your CRM should be the single source of truth for account and opportunity data. Your marketing automation platform needs to sync lead activities and lifecycle stage changes into the CRM in real time. Your ad platforms need to connect either through native integrations or middleware. Dedicated attribution tools like HockeyStack, Dreamdata, or Bizible can automate the stitching process and provide pre-built models. These are worth considering once your data foundations are solid, not before.
Step 5: Build your reports
Useful reports for a B2B attribution setup include channel attribution by conversion event (which channels contribute most to lead creation, opportunity creation, and closed-won revenue), campaign attribution (which specific campaigns have the highest attributed pipeline), content attribution (which pieces appear most frequently in the journeys of converted accounts), and funnel stage analysis (where in the funnel specific channels are most influential). Build these reports somewhere both marketing and sales can access them.
Step 6: Socialize the data and build trust
This is where most attribution projects stall. You have the data, you've built the reports, but nobody uses them because they don't trust the numbers or don't understand the methodology. Getting attribution adopted requires education (explain what the model does and doesn't tell you), transparency (share the assumptions and limitations openly), regular reviews (make attribution data part of your monthly or quarterly campaign reviews), and early wins (find one insight that leads to a concrete decision and point to it clearly). Tangible outcomes build trust faster than theoretical explanations about model accuracy.
Upper-funnel vs. lower-funnel attribution: Yessss, you need both, and here's why
One of the most common mistakes in B2B attribution is evaluating upper-funnel and lower-funnel activities using the same criteria. They serve different purposes, and judging them by the same metric will distort your picture of what's working.
Upper-funnel activity is about building awareness and generating initial interest. Think brand campaigns on LinkedIn, thought leadership content, podcast sponsorships, conference speaking slots, and educational blog posts. These activities rarely produce direct conversions. Their value shows up much later, when a prospect who was first exposed to your brand months ago eventually enters your pipeline.
Lower-funnel activity is about converting existing interest into action. Think retargeting ads, case studies, comparison pages, demo landing pages, and direct sales outreach. These often appear as the last touch before a conversion, which makes them look disproportionately effective in last-touch attribution.
If you only use last-touch attribution, your data will consistently tell you to cut upper-funnel spending and increase lower-funnel spending. This is a trap most teams fall into at least once. Cut the upper funnel entirely, and your lower-funnel activities gradually lose their raw material. Fewer prospects discover your brand, fewer enter the pipeline, and the decline doesn't show up immediately. You'll celebrate the efficiency gains for one or two quarters before the numbers start softening.
Here's how the two funnel stages compare from an attribution standpoint:
The right approach is to use attribution models that capture both, and to evaluate each stage against the outcomes it's actually designed to drive.
Where does Factors.ai fit in?
If you've read this far, you probably already have some attribution data somewhere. The more common problem isn't a total absence of tracking; it's that the data is scattered across platforms that don't speak to each other, so you can't see the full picture in one place.
Factors.ai connects your CRM, ad platforms, and website data to give B2B marketing teams account-level attribution without a lengthy data engineering project. You can see which campaigns, channels, and content pieces are appearing in the journeys of your best accounts, filter by deal stage or deal size, and share attribution reports with sales in a format that doesn't require them to learn a new tool.
If your current attribution setup involves a lot of manual spreadsheet work or a lot of "I think LinkedIn is probably working," it's worth seeing what connected data actually looks like.
In a nutshell…
Sales attribution is one of those things that sounds like a measurement problem, but it's really a decision-making problem. The question isn't "how do we prove that marketing contributed to revenue?" The question is "how do we figure out what's actually working well enough to invest more in it, and what's not working well enough to stop?"
The teams that get the most from attribution aren't the ones with the most sophisticated models. They're the ones who pick a model they understand, keep their data clean enough to trust, and actually use the insights to change where they spend money. That last part is rarer than it should be.
Frequently asked questions about sales attribution
Q1. What's the difference between sales attribution and marketing attribution?
They're often used interchangeably, but there's a subtle distinction. Marketing attribution focuses specifically on which marketing touchpoints (ads, content, emails, events) contributed to a conversion. Sales attribution takes a broader view, including both marketing and sales activities (calls, demos, proposals) in the credit model. For B2B teams, where sales and marketing both touch the buyer journey, sales attribution gives you the more complete picture.
Q2. Which attribution model is best for a B2B company with long sales cycles?
Most B2B teams with sales cycles of three months or more get the most value from U-shaped or W-shaped attribution. These models acknowledge the importance of both the discovery phase and the conversion phase, without requiring a massive data infrastructure. If your team tracks pipeline stages carefully and has clean CRM data, W-shaped is worth the additional setup. If you're earlier in your data maturity, U-shaped is a solid starting point.
Q3. How do I handle attribution when multiple people at the same account are engaging with our content?
Move to account-level attribution. Instead of tracking touchpoints per individual contact, group all touchpoints by the account (company). This means a blog visit from the marketing manager, a webinar attendance from the director, and a demo request from the VP all appear in the same buyer journey. Most modern CRMs and attribution tools support this, but it requires clean account data to work reliably.
Q4. Do I need a dedicated attribution tool, or can I do this in my CRM?
You can get meaningful attribution insights from your CRM and marketing automation platform alone, especially for simpler models like first-touch, last-touch, or linear attribution. Dedicated attribution tools become worth the investment when you're trying to track cross-channel journeys at scale, run multiple models simultaneously, or connect data from sources that don't have native CRM integrations. Start with what you have, identify the gaps, and invest in tooling based on the specific data you can't currently capture.
Q5. What's the biggest mistake B2B teams make with attribution?
Trusting a complex model built on messy data. A sophisticated attribution setup is only as reliable as the data feeding it. If your CRM has duplicate accounts, inconsistent campaign tagging, and gaps in contact-to-account linking, a W-shaped model will produce impressively formatted reports that are unreliable. Before investing in model sophistication, invest in data quality. It's less exciting, but the outputs are actually trustworthy.
Q6. How often should we review and update our attribution model?
Quarterly is the right cadence for most teams. Review whether the model still reflects how your buyers actually buy, whether any new channels need to be incorporated, and whether your underlying data is still clean and consistent. If your sales cycle length or buyer mix has changed significantly, your model's assumptions may need updating. Attribution isn't a "set it and forget it" system.
Q7. Can attribution data fully replace intuition and team judgment?
No, and it shouldn't try to. Attribution data is a model of reality, not reality itself. Every model makes assumptions about which touchpoints matter and how credit should be divided. Those assumptions are useful for making better decisions, but they're still assumptions. The best use of attribution data is as one input into a conversation, not as a definitive verdict. Use it to inform judgment, not to replace it.
Q8. What if some of our highest-impact touchpoints are offline and untrackable?
Accept that your attribution model will always be incomplete, and build that assumption into how you interpret the data. For offline touchpoints you can influence (trade shows, events, referral programs), create a process for logging them manually in your CRM. For truly untrackable interactions (word-of-mouth, organic reputation), treat your attributed data as a floor, not a ceiling. The actual impact of your marketing is likely higher than what your model can capture.
Google Ads Attribution: A Guide for B2B Marketers
Learn how Google Ads attribution works, compare attribution models, and improve paid search reporting using Google Analytics and modern B2B attribution tools.
TL;DR
- Google Ads attribution determines which keywords, ads, and campaigns get credit for conversions, but its default models only capture a fraction of B2B buying journeys.
- B2B sales cycles involve multiple stakeholders, offline conversions, and cross-channel paths that break most platform-native attribution logic.
- Google now defaults to data-driven attribution, which is an improvement over last-click, but still can't see beyond its own ecosystem.
- Integrating Google Ads with GA4 and importing CRM conversions helps close some gaps, though full-funnel visibility requires account-level attribution tools.
- Platforms like Factors.ai connect paid search data with pipeline and revenue outcomes, giving B2B teams a more complete picture of what's actually working.
Picture this:
You've just wrapped up a quarterly campaign review. The Google Ads dashboard shows 140 conversions last month, cost per conversion looks reasonable, and your team is cautiously optimistic. Then someone from sales asks the question that ruins everyone’s mood instantly: "Which of those conversions actually turned into pipeline?"
The room goes… rather quiet.
You pull up the CRM, cross-reference a few names, and realise that the story Google Ads tells and the story your revenue data tells are… barely on speaking terms.
And to everybody’s solemn surprise, this disconnect is not a bug.
It's how platform-native attribution works, by design. Google Ads attribution measures what happens inside Google's ecosystem, and it does that reasonably well. But B2B buying journeys don't live inside a single platform. They sprawl (and how) across search queries, content downloads, webinars, LinkedIn conversations, and sales calls that happen weeks apart. The gap between what Google can see and what actually drove revenue is where most B2B measurement problems begin.
This blog is written to walk you through how Google Ads attribution actually works, where it falls short in B2B, and what you can do to build a measurement approach that reflects the way your buyers really make decisions.
What is Google Ads attribution?
At its simplest, Google Ads attribution is the process of deciding which ads, keywords, and campaigns deserve credit when someone converts. A conversion could be a demo request, a contact form submission, a trial signup, or a gated content download. Attribution is the system that connects that action back to the marketing touchpoint that influenced it. Accurate attribution is essential for understanding which touchpoints truly drive ROI and campaign performance.
Think of it as the scorekeeping system for your paid search spend. Every time a prospect interacts with one of your Google Ads and eventually takes a desired action, attribution logic decides who gets the point. Did the branded keyword search close the deal, or was it the non-branded awareness campaign three weeks earlier that planted the seed? Attribution is supposed to answer that question.
The mechanics rely on a chain of tracking tools. Google Ads has its own conversion tracking, which records when someone clicks an ad and later completes a conversion action on your website. Google Analytics, specifically GA4, adds another layer by tracking the broader journey across channels and sessions. Together, they form the backbone of how most marketers measure paid search performance.
For e-commerce brands selling a $50 product, this system works reasonably well. Someone clicks an ad, lands on a product page, and buys within the same session. Clean, linear, attributable. B2B is a different animal entirely, and it doesn’t look like this cute three-toed sloth, who looks like he invented the word ‘relaxation.’ Anyhoo, let’s not relax just yet… back to B2B.

Your ‘conversion’ is usually a hand-raise (a form fill, a demo request) that sits at the very top of a long revenue process. The actual purchase decision happens weeks or months later, involves multiple people, and spans channels that Google can’t see. So, while Google Ads attribution can tell you which keyword drove a form fill, it often can’t tell you which keyword drove revenue. That makes a HUGE difference when you’re deciding where to put your next $10,000.
The relationship between Google Ads, Google Analytics, and your CRM is essentially a relay race where each runner can only see their own leg. Google Ads knows about ad clicks. GA4 knows about website sessions and cross-channel paths. Your CRM knows about pipeline and closed deals. Attribution, done properly, means connecting all three so you can see the full customer journey and how conversion credit is assigned to each touchpoint.
Most B2B buying journeys are multi-touch by nature. A prospect might click a Google Ad, read a blog post, attend a webinar two weeks later, see a LinkedIn ad, and then finally book a demo. Giving all the credit to whichever touchpoint happened to be last (or first) doesn’t reflect reality. Accurate attribution helps identify the various interactions in the customer journey that contribute to conversions, enabling more effective campaign optimization and budget allocation.
It’s like crediting the goalkeeper for winning a football match because they were the last person to touch the ball. (On that note, as a former goalkeeper for my school-team, I would say (read: believe) that our team did win the match because of me.)
Simple attribution models produce simple answers, and simple answers can lead to expensive mistakes in B2B.
Why is Google Ads attribution SO difficult in B2B?
If attribution were easy, marketing teams wouldn't spend half their budget reviews softly screaming about which channel ‘really’ drove results.
In B2B, the difficulty is in the way B2B companies sell fundamentally conflicts with how attribution platforms are designed to measure… meaning, it’s structural.
- The most obvious challenge is cycle length
B2B deals can take weeks, months, or in enterprise, entire quarters to close. A prospect might click your Google Ad in January and not sign a contract until June. Google Ads' default attribution window maxes out at 90 days for most conversion types, which means any influence beyond that window simply disappears from the data. The ad that started the entire relationship gets no credit, because the system forgot it existed.
- Then there's the multi-stakeholder problem
In B2B, a junior marketer might click your ad and download a whitepaper. Their manager might visit your pricing page a week later through an organic search. The VP might see a LinkedIn ad and finally agree to a demo. Google Ads sees the first click from the junior marketer and attributes the conversion there. It has no idea that three different people from the same company were involved in the decision. This is the difference between person-level attribution and account-level attribution, and Google Ads only does the former.
- Cross-channel journeys compound the issue further
A realistic B2B path might look something like this: Google Ad click, then a blog visit from organic search, then a webinar registration from an email, then a LinkedIn retargeting ad, and finally a direct visit to book a demo. Google Ads can only see the touchpoints that happened within its platform. Everything else is a blind spot. It's like trying to review a film when you've only watched the first and last five minutes.
Offline conversions create yet another gap. In B2B, many of the most important conversion events happen outside the browser entirely. Sales calls, CRM stage changes, contract negotiations, and closed-won deals all occur in systems that Google Ads can't access by default. You can import offline conversions into Google Ads (and you should), but most teams either don't do it or do it inconsistently. Without that data, Google's conversion reporting tells you about hand-raisers, not buyers.
The cumulative effect is that default Google Ads attribution only sees a slice of the funnel. It captures the initial click and the online conversion event, but misses the cross-channel journey, the multi-stakeholder dynamics, and the offline revenue outcome. Marketers who rely solely on this view end up making budget decisions based on incomplete evidence. You might cut a campaign that looks underperforming in Google Ads but is actually the primary driver of your highest-value pipeline. Or you might double down on branded search that captures demand without realising it was a non-branded campaign creating that demand in the first place.
This is why serious B2B teams eventually realise they need full-funnel attribution systems, ones that connect ad clicks to pipeline and revenue, track account-level journeys across channels, and measure influence rather than just last-touch credit.
How does Google track conversions in paid search?
Before you can debate attribution models, you need to understand the plumbing.
Google Ads conversion tracking is the foundation that everything else is built on, and getting it right is surprisingly non-trivial.
The setup starts with a tracking tag on your website. There are two main approaches. The first is the Google tag (formerly the Global Site Tag), a snippet of JavaScript you place directly on your site that fires when someone completes a conversion action. The second is Google Tag Manager, a container-based system that lets you manage all your tracking tags without touching your website code directly. Most B2B teams use Tag Manager because it's more flexible and doesn't require a developer every time you want to track a new event. Either way, the tag records when someone who clicked a Google Ad later does something valuable on your site.
The types of conversions you can track fall into several categories.
- Website conversions are the most common
Form submissions, button clicks, page visits. These happen on your site and get tracked automatically by the tag. Imported conversions let you bring data from outside Google Ads, most importantly from your CRM. When a lead that originated from a Google Ad click eventually becomes a qualified opportunity or a closed deal, you can import that outcome back into Google Ads. This is critical for B2B measurement, though it requires some technical setup and regular data syncing.
- Enhanced conversions are a newer addition that helps improve attribution accuracy
They work by sending hashed first-party data (like email addresses) from your conversion forms to Google, which then matches it against signed-in Google users. This helps Google connect the dots when cookies are blocked or when someone converts on a different device than the one they originally clicked from. Offline conversions, as the name suggests, capture actions that happen entirely off your website, like phone calls or in-person meetings that lead to a deal.
- Once conversions are tracked, Google attributes them back to specific elements of your campaigns
Every conversion gets connected to the keyword that triggered the ad, the ad itself, the campaign it belongs to, and the audience segment the user was part of. This lets you see performance at multiple levels of granularity. You can answer questions like "Which keywords drive the most demo requests?" or "Which campaign is generating the cheapest leads?"
Common B2B conversion events include lead form submissions (the workhorse of B2B paid search), newsletter signups, free trial activations, and gated content downloads. Each of these represents a different level of intent. A whitepaper download signals curiosity. A demo request signals buying intent. Your attribution setup should distinguish between them, because treating all conversions equally is one of the most common mistakes in B2B conversion reporting.
The tracking itself is relatively straightforward to set up. The harder part is making sure it captures the right events, at the right quality, and feeds into a broader measurement system that goes beyond Google Ads alone.
How do the most common Google attribution models work?
Attribution models are the rules that decide how credit gets distributed across touchpoints.
If a prospect clicked three different ads before converting, which one gets the credit?
The model you choose determines the answer, and different models can tell completely different stories about the same data.
Here are the Google Ads attribution models
Each has a different philosophy about what matters most in a conversion path.
- Last-click attribution is the simplest and, for a long time, was Google's default
It gives 100% of the credit to the last ad interaction before the conversion. If someone clicked a branded search ad right before filling out a demo form, that branded keyword gets all the credit, regardless of what happened earlier in the journey. It's easy to understand and easy to report on. The problem is that it systematically undervalues everything that happens before the final click, which in B2B is often where the real influence occurs.
- First-click attribution is the mirror image
It gives all the credit to the very first ad interaction. If someone's first encounter with your brand was a non-branded search ad six weeks ago, that ad gets 100% credit for the conversion, even if they clicked five other ads before finally converting. First-click is useful for understanding which campaigns drive initial awareness, but it ignores everything that happened afterward.
- Linear attribution takes a more diplomatic approach
It splits credit evenly across all touchpoints in the conversion path. If there were four ad interactions, each one gets 25% credit. It's fairer than last-click or first-click, but it also treats every touchpoint as equally important. In reality, some interactions are more influential than others. The ad that introduced someone to your brand and the ad that got them to finally book a demo probably don't deserve equal credit.
- Time-decay attribution adds a temporal dimension
Touchpoints closer to the conversion get more credit than earlier ones, on the theory that recent interactions are more influential. It's a reasonable heuristic for shorter buying cycles, but in B2B, where early-stage research can be the most important phase, it can undervalue the campaigns that planted the seed months ago.
- Data-driven attribution is Google's current default model
Instead of applying a fixed rule, it uses machine learning to analyse your actual conversion data and determine how much credit each touchpoint deserves. It looks at the conversion paths of people who converted versus those who didn't, and figures out which interactions actually made a difference. Data-driven attribution (DDA) uses advanced machine learning to analyze data and determine the importance of each touchpoint in a customer's journey, providing a more accurate view of the customer journey compared to traditional models. It's the most sophisticated option Google offers, and for accounts with enough conversion volume, it's generally the best choice. When switching to data-driven attribution, Google requires accounts to have a minimum of 300 conversions and 3,000 ad interactions within 30 days to be eligible for this model.
Here's how these models compare side by side:
The shift to data-driven attribution as Google's default was significant. Rule-based models force you to choose a philosophy about what matters. Data-driven attribution lets the data decide. That said, it still only sees touchpoints within the Google Ads ecosystem. If your prospect's journey includes LinkedIn ads, organic search, email campaigns, and sales calls, Google's data-driven model can only distribute credit among the Google Ad interactions it can see.
For B2B marketers, the practical advice is to use data-driven attribution as your default in Google Ads, but don't treat it as the source of truth. Compare it against other models periodically to understand how credit shifts. And recognise that any model operating within a single platform will always tell an incomplete story. The best use of Google attribution models is as one input into a broader measurement framework, not the final word.
How does paid search data work in Google Analytics?
Google Ads gives you the paid search view of your world. Google Analytics, specifically GA4, gives you the wider map. Connecting the two is where paid search Google Analytics reporting starts to get genuinely useful for B2B teams.
The integration between Google Ads and GA4 is surprisingly straightforward, but it's also surprisingly common for it to be misconfigured.
- Linking the two accounts is the first step. In GA4, you navigate to Admin, then Product Links, and connect your Google Ads account. This allows conversion data, audience data, and campaign information to flow between the platforms. Auto-tagging, which is enabled by default in Google Ads, appends a GCLID (Google Click ID) parameter to your ad URLs. This is what GA4 uses to identify that a session came from a paid search click and attribute it correctly.
- Campaign parameters (UTMs) are the backup system. If auto-tagging is disabled for some reason, or if you're running ads on platforms other than Google, UTM parameters tell GA4 which campaign, source, and medium drove the visit. For Google Ads specifically, auto-tagging is more reliable and provides richer data, so most teams use that as the primary mechanism.
- Once the accounts are linked, GA4 opens up several reports that go well beyond what you see in Google Ads itself. The acquisition reports show you how paid search compares to other channels in driving new users and conversions. You can see whether paid search is bringing in first-time visitors or re-engaging people who originally found you through organic or referral channels.
The attribution reports in GA4 are where things get a little more interesting.
- GA4 uses its own attribution model (also data-driven by default) to distribute credit across all the channels it can see, not just Google Ads. This means you can see how paid search interacts with organic search, email, social, and direct traffic in driving conversions. The model comparison tool lets you toggle between different models and see how credit shifts. It's a useful exercise for understanding whether your paid search campaigns are primarily closers (capturing demand) or openers (creating demand).
- Path exploration is another powerful GA4 feature; it lets you visualize the actual sequences of touchpoints that led to conversions. You might discover that your highest-converting path starts with a non-branded paid search click, continues with an organic blog visit two days later, and ends with a direct visit to your demo page. That kind of insight is nearly impossible to get from Google Ads alone.
- GA4 also surfaces assisted conversions, which are interactions that appeared in conversion paths but weren't the last touchpoint. This is crucial for B2B, where paid search often plays an assisting role rather than a closing role. A non-branded keyword might consistently show up early in conversion paths without ever being the last click. If you're only looking at Google Ads' conversion reports with a last-click lens, you'd undervalue that keyword. GA4's assisted conversion data helps correct that bias.
SO, what is the point I’m trying to make?
It is that Google Ads tells you how your campaigns perform within the paid search silo. GA4 tells you how paid search performs within the context of your full marketing mix. For B2B teams trying to understand the real contribution of paid search, you need both views.
How should you read Google Ads conversion reports?
Knowing which reports to look at is one thing. Knowing how to interpret them for B2B is something else entirely.
- The campaign performance report is where most people start
It shows the basics: cost per conversion, conversion rate, and conversion value for each campaign. For e-commerce, a high conversion rate and low cost per conversion are unambiguously good. For B2B, it depends entirely on what you’re counting as a conversion. If your conversion event is a whitepaper download, a 5% conversion rate might look great on paper but mean nothing for pipeline. If your conversion event is a qualified demo request, a 0.5% conversion rate with a $200 cost per conversion might actually be brilliant if those demos convert to $50,000 deals.
This is why cost per conversion in B2B has to be evaluated relative to pipeline value, not in isolation. A campaign that generates ten form fills at $30 each looks cheaper than one that generates two demo requests at $150 each. But if the demo requests produce $100,000 in pipeline and the form fills produce nothing, the ‘expensive’ campaign is actually your best performer. Reading conversion reports without connecting them to downstream revenue is like judging a restaurant by how fast the food arrives without tasting it.
- Keyword conversion reports tell you which search terms are driving your desired actions
In B2B, the most interesting story here is often the split between branded and non-branded keywords. Branded keywords (people searching your company name) almost always have higher conversion rates, because those prospects already know you. Non-branded keywords (people searching for solutions to their problems) typically convert at lower rates but represent net-new demand. If you optimise purely for conversion rate, you’ll end up pouring money into branded terms that capture existing demand rather than creating new demand. The keyword report helps you maintain the right balance, but only if you interpret it with that context. Analyzing ad groups within these reports can also reveal which segments of your Google Ads campaigns are contributing most to conversions, allowing you to assign conversion credit more accurately and focus on the most effective ad groups.
High-intent search terms are especially valuable in B2B. Queries like “attribution software for B2B” or “marketing attribution tool comparison” signal someone actively evaluating solutions. These keywords might have lower search volume but much higher pipeline conversion rates. Your keyword conversion reports should be filtered and analysed with intent in mind, not just volume and cost.
- Attribution path reports show you the sequence of touchpoints that led to conversions
These are arguably the most underused reports in Google Ads for B2B. They reveal patterns like “prospects who convert typically interact with three to four ads over two to three weeks before submitting a form.” That kind of insight changes how you think about campaign structure. If you know that your best leads interact with a non-branded awareness ad first, then a solution-focused ad, then a branded ad, you can design your campaigns to support that natural progression rather than fighting it.
- Assisted interaction reports complement the path data
They show which campaigns and keywords contributed to conversions without being the final click. A campaign with low direct conversions but high assisted conversions is doing important upper-funnel work. Cutting it because it “doesn’t convert” would be like firing your best midfielder because they don’t score goals, ignoring the fact that they create every scoring opportunity.
The core principle for reading B2B conversion reports is to resist the temptation to optimize for surface-level metrics.
- Low conversion volume ≠ low impact.
- High cost per conversion ≠ poor efficiency.
The numbers only make sense when you connect them to what happens after the conversion: pipeline created, deals progressed, and revenue closed. Use attribution insights to optimize campaigns based on which ad groups and keywords are driving the most valuable conversions, ensuring your Google Ads campaigns are continually refined for maximum impact.
What are the most common attribution mistakes in Google Ads?
Attribution mistakes in B2B come from misinterpreting the data you have or from not connecting it to the data you're missing. Here are the five mistakes I see most often, and each one can meaningfully distort your budget decisions.
1. Relying only on last-click attribution
Last-click attribution is comfortable. It's simple, it's decisive, and it gives every conversion a single clear owner. The problem is that it systematically erases the contribution of upper-funnel search queries. If someone first discovered your brand through a broad, non-branded search ("B2B marketing attribution tools"), then came back through a branded search ("Factors.ai pricing") and converted, last-click gives all the credit to the branded term. You'd never know the non-branded query was what started the relationship. Over time, this bias leads teams to underinvest in demand-creation campaigns and over-invest in demand-capture campaigns that wouldn't work without the awareness layer above them.
2. Ignoring assisted conversions
This is a close cousin of the last-click problem, but it shows up even when teams have switched to data-driven attribution. Assisted conversions are touchpoints that contributed to a conversion path without being the final interaction. Many B2B campaigns, especially those targeting early-stage research queries, show up almost exclusively as assists rather than direct converters. If you don't actively review assisted conversion data, you'll misjudge the value of campaigns that are quietly doing essential upper-funnel work. It's the marketing equivalent of only evaluating employees based on who sends the final email to the client.
3. Not importing CRM conversions
This is the biggest gap in most B2B Google Ads setups. Google Ads can only attribute conversions it knows about. If your conversions are form fills and trial signups tracked on-site, that's all it can measure. But in B2B, the most important outcomes, qualified pipeline, opportunities created, and deals closed happen in your CRM. Without importing those CRM events back into Google Ads, you're optimizing your campaigns for top-of-funnel volume rather than bottom-of-funnel value. Two campaigns might produce the same number of form fills but wildly different amounts of pipeline. Without CRM data, they look identical in Google Ads.
4. Treating all conversions equally
A content download is not a demo request. A newsletter signup is not a pricing page visit. Yet many B2B teams track all of these as "conversions" with equal weight in Google Ads. This makes your cost-per-conversion metric nearly meaningless. If one campaign drives 20 whitepaper downloads and another drives 5 demo requests, the first looks more efficient by cost-per-conversion, but the second is almost certainly more valuable. Assigning different values to different conversion types in Google Ads (and ideally tying those values to actual pipeline data) helps your reporting reflect reality rather than vanity.
5. Fragmented reporting
In most B2B organizations, Google Ads data lives in one dashboard, GA4 in another, CRM data in a third, and pipeline reporting in a fourth. Nobody has a single view that connects the full journey from ad click to closed deal. This fragmentation means that the people making budget decisions about Google Ads have an incomplete picture. Until you integrate the data sources that marketing, sales and other teams are using, your attribution will always provide an incomplete picture.
FYI, each of these mistakes is fixable. Some require technical changes (importing CRM data, setting up differentiated conversion values). Others require a shift in mindset (evaluating campaigns on pipeline contribution, not just click-through conversion rates). The first step is recognizing that default Google Ads reporting was designed for direct-response e-commerce, not for B2B buying journeys that span months and multiple stakeholders.
Why do B2B teams need to move beyond Google Ads attribution?
At some point, every B2B marketing team hits the SAME wall.
They've set up conversion tracking properly… they're using data-driven attribution… they've even imported some CRM data. And yet the picture still feels… incomplete. The reason is that Google Ads attribution, no matter how well configured, can only see what happens within Google's ecosystem. The rest of the journey is invisible to it.
- Platform-specific attribution is the fundamental limitation
Google Ads measures Google Ads. LinkedIn measures LinkedIn. Your email platform measures email. Each channel grades its own homework, and surprise, they all give themselves high marks. When you add up the conversions each platform claims, the total is usually two or three times higher than your actual conversion count. That's because multiple platforms take credit for the same conversion, and none of them know about the others.
- Cookie restrictions are making this worse
Browser privacy changes, the decline of third-party cookies, and stricter consent requirements all reduce Google's ability to track users across sessions and devices. A prospect who clicks your ad on their work laptop and converts on their personal phone might look like two separate people to Google Ads. Enhanced conversions help with some of these gaps, but they don't solve the fundamental problem of cross-device fragmentation in a cookie-constrained world.
- Incomplete journey visibility is perhaps the most significant issue for B2B specifically
Your buyers don't just interact with Google Ads. They visit your website directly, read your LinkedIn posts, attend your webinars, receive your emails, and talk to your sales team. Google Ads can't see any of those interactions. It can tell you that someone clicked an ad and later converted, but it can't tell you that between those two events, they attended a webinar, read three blog posts, and had a 30-minute call with your SDR. The conversion path it reports is a skeleton of the actual journey.
This is why modern B2B teams are moving toward measurement approaches that sit above any single platform. Multi-touch attribution, which distributes credit across all touchpoints regardless of channel, gives a more balanced view than platform-native attribution. Account-level attribution, which groups interactions by company rather than by individual, reflects how B2B purchasing actually works. Intent-driven attribution, which incorporates signals like content consumption patterns, website visit frequency, and topic engagement, adds another dimension that pure click-tracking can't capture.
Full-funnel measurement connects the top of the funnel (where Google Ads typically operates) with the middle and bottom (where pipeline is built and deals are closed). It requires bringing together ad platform data, website analytics, CRM data, and sometimes product usage data into a unified view. That's not a trivial project, but it's the direction that every serious B2B marketing team is heading.
Note: The goal is NOT to abandon Google Ads attribution, but to treat it as one input into a broader system rather than the system itself. Google Ads tells you which keywords and campaigns are generating clicks and form fills. The keywords and campaigns that are bringing in money are revealed by full-funnel attribution. If you're only making decisions based on the former, you're leaving a lot of insight (and potentially a lot of money) on the table.
How does Factors.ai improve paid attribution for B2B teams?
The gaps we've been discussing throughout this guide: platform silos, person-level tracking, missing pipeline data, and cross-channel blind spots, are exactly the problems that Factors.ai was built to solve. Rather than replacing Google Ads attribution, Factors adds the layers that Google can't provide on its own.
The most significant capability is account-level journey tracking. Google Ads tells you that an individual clicked an ad. Factors identifies the company behind that click and maps it to an account-level journey that includes every touchpoint across channels. When three different people from the same company interact with your marketing across Google Ads, your website, and LinkedIn, Factors stitches those interactions into a single account journey. This is the difference between knowing "someone converted" and knowing "Acme Corp has engaged with us seven times across four channels over three weeks."
Anonymous website activity tracking fills another critical gap. Most B2B website visitors don't fill out a form. They visit, browse a few pages, and leave. Google Ads sees the click and the session. Factors identifies the company behind that anonymous visit and adds it to the account timeline. That means even if a prospect never converts on-site, you can still see that they came from a Google Ad and engaged with specific content. This turns previously invisible demand signals into actionable data.
Connecting paid ads to pipeline data is where the measurement really changes. Factors pulls in your CRM data and maps it to the account journeys it has already built. This lets you see not just which campaigns drove form fills, but which campaigns influenced accounts that went on to create pipeline and generate revenue. You can answer questions like "What percentage of our qualified pipeline had a Google Ads touchpoint in the journey?" or "Which campaigns are correlated with deals that actually closed?" That's a fundamentally different, and more useful, question than "Which campaigns had the lowest cost per conversion?"
Here's a quick comparison of the measurement you get from each layer:
Factors also helps B2B teams improve their conversion reporting by surfacing metrics that actually matter. Instead of reporting on form fills and cost per lead, teams using Factors can report on influenced pipeline, account engagement scores, and revenue contribution by campaign. This shifts the conversation from "How many leads did paid search generate?" to "How much pipeline did paid search influence?" The first question is tactical. The second is strategic.
For B2B marketing teams that have outgrown platform-native attribution but aren't ready to build a custom data warehouse, Factors provides the connective layer between ad platforms, analytics, and CRM. It doesn't ask you to abandon Google Ads reporting. It makes that reporting more useful by adding the context that Google can't provide on its own.
In a nutshell
Google Ads attribution is a necessary starting point for measuring paid search performance, but it's only a starting point. The models available inside Google Ads, including data-driven attribution, do a reasonable job of distributing credit among the touchpoints Google can see. The problem is that Google can't see very much of a typical B2B buying journey.
If you take one thing from this guide, let it be this: the distance between "conversions" in Google Ads and "revenue" in your CRM is where your real measurement work needs to happen. Close that gap by importing CRM conversions into Google Ads, integrating Google Ads with GA4 for cross-channel visibility, differentiating between conversion types based on intent, and evaluating campaigns on pipeline influence rather than just form fill volume.
For B2B teams ready to go further, account-level attribution tools like Factors.ai connect the dots that platform-native reporting can't reach. They let you see which companies are engaging with your ads, track the full account journey across channels, and tie campaign performance to revenue outcomes. The result is measurement that actually reflects how B2B buying works, not a simplified version that fits neatly into a single dashboard.
Start with getting your Google Ads tracking right. Layer in GA4 for broader visibility. Import your CRM data so conversions connect to pipeline. And when you're ready, invest in account-level attribution so your budget decisions are informed by revenue data, not just click data. That progression, from platform-native measurement to full-funnel attribution, is the path that separates good B2B marketing teams from the ones that can actually prove their impact.
Frequently asked questions about Google Ads attribution
Q1. What is Google Ads attribution?
Google Ads attribution is the system that determines which ads, keywords, and campaigns receive credit when someone completes a conversion. It uses attribution models to distribute that credit, ranging from simple last-click (where the final interaction gets all credit) to data-driven (where machine learning decides how credit is shared). For B2B marketers, understanding attribution is essential because it directly shapes which campaigns appear to be working and where budgets get allocated.
Q2. Which attribution model should I use in Google Ads?
Google now defaults to data-driven attribution, which is a strong starting point for most accounts with sufficient conversion volume. It uses your actual conversion path data to determine how credit should be distributed, rather than applying a fixed rule. That said, no single model tells the complete story. Periodically comparing data-driven attribution against time-decay or linear models helps you understand how credit shifts, and whether certain campaigns are being systematically over or undervalued. For B2B accounts with long buying cycles, it's especially worth checking whether upper-funnel campaigns are getting appropriate credit.
Q3. How does Google Analytics help with paid search attribution?
GA4 provides cross-channel attribution insights that Google Ads can't offer on its own. By linking your Google Ads and GA4 accounts, you can see how paid search interacts with organic search.
Q4. Why do my Google Ads conversions never match my CRM leads?
Google Ads typically attributes a conversion to the date of the ad click, whereas your CRM records the lead on the date the form was submitted. Additionally, Google Ads may count multiple conversions per person if they fill out multiple forms, while your CRM likely deduplicates them.
Q5. Is Data-Driven Attribution (DDA) always better than Last-Click?
For B2B, yes. Last-click usually over-values branded search terms (demand capture) and ignores the non-branded terms that actually introduced the prospect to your solution (demand creation). DDA uses historical data to see the value of those "assisting" clicks.
In fact, DDA is now the default attribution model for most new conversion actions in Google Ads, reflecting a shift towards machine learning-driven measurement rather than rigid rule-based systems. As of 2026, Google Ads primarily supports Data-Driven Attribution (DDA) as the default model for conversion tracking, utilizing AI to analyze past conversion data.
Q6. What is an ‘offline conversion,’ and why should I care?
An offline conversion is a milestone that happens off your website, like a lead moving to "Qualified" status in your CRM. Importing these back to Google Ads allows you to use Smart Bidding to target high-quality prospects rather than just maximizing lead volume.
Q7. What is the "90-day window" limitation?
Google Ads can only look back 90 days from the time of conversion. If your enterprise sales cycle is 6-12 months, the original ad click that started the journey will likely be lost to "Direct" or "Organic" attribution by the time the deal closes.
Q8. How does GA4 help with Google Ads attribution?
GA4 shows you the Assisted Conversion report. This reveals how many times a Google Ad was a middle touchpoint in a journey that eventually closed via an Email or a Direct visit. It prevents you from cutting ‘underperforming’ ads that are actually essential influencers.

Upper Funnel vs Lower Funnel: The B2B Marketing Guide
Understand upper funnel vs lower funnel marketing in B2B. Learn strategies, metrics, and how intent data connects awareness to revenue.
TL;DR
- Upper funnel marketing builds awareness and educates buyers who don’t know you yet, targeting a broad audience at the awareness stage of the buying journey. Lower funnel marketing converts interested prospects into paying customers. Both are essential — not competing priorities.
- Most B2B teams over-invest in lower-funnel activity because it’s easier to measure, which starves the pipeline of future demand.
- Between awareness and conversion sits a layer of intent signals, repeated visits, pricing page views, competitor research, that most analytics tools miss entirely.
- Connecting upper-funnel and lower-funnel data through account-level intent tracking closes the visibility gap and helps teams act on buying signals earlier.
- Full-funnel attribution ties early awareness campaigns to downstream revenue, giving marketing leaders the evidence they need to defend balanced budget allocation.
- The marketing funnel represents the buying journey from awareness to purchase, with upper funnel (TOFU) and lower funnel (BOFU) stages requiring different strategies, content, and metrics.
There’s a meeting that happens in every B2B marketing team, usually around day three of the quarter, and it goes like this.
Someone presents a campaign report. The LinkedIn thought leadership series got great reach. The webinar pulled 400 registrants. Organic traffic is up. Everyone nods. Then the sales lead or someone from finance asks: “But how many deals did this actually close?”
Eerie silence.
Because nobody can draw a straight line from “we ran a great webinar” to “we closed revenue.” So… what happens then? The upper-funnel efforts get labelled as ‘brand activity’, a polite way of saying ‘nice to have.’ Budget shifts to retargeting, to bottom-of-funnel paid search, to whatever has a number attached to it. Pipeline looks okay for a quarter or two… and then (slowly and confusingly), it starts to thin… making you make this exact face:

We’ve all seen this play out more times than we’d care to admit. And the frustrating part is that it’s not a measurement problem. It’s a strategy problem dressed up as a measurement problem. The upper funnel vs lower funnel tension shapes how B2B companies grow, plateau, or hand market share to competitors who invest differently.
This amazing and really long guide covers what both stages actually do, how to measure them, where teams go wrong, and (most importantly) how to connect the two halves into something that actually works. Understanding the entire customer journey and using the sales funnel as a framework is essential for developing strategies that address every stage, from awareness to conversion.
What does ‘upper funnel vs lower funnel’ actually mean?
The marketing funnel is one of those frameworks that’s been around so long it’s almost embarrassing to explain. Wide at the top, narrow at the bottom. Many people enter, fewer people buy. Simple visual, real insight. This entire process is often referred to as the conversion funnel, which maps the customer journey from initial awareness through to purchase and beyond.
- Upper funnel marketing (also known as top of funnel marketing) is the work that happens when someone doesn’t know you yet. This stage of the customer journey focuses on creating awareness, generating interest, and establishing brand recognition. Prospects might be aware that a problem exists, or might not even be sure they have the problem. They’re not comparing pricing pages, they’re still figuring out what they’re looking for. Your job here is to get into the mental shortlist before anyone’s even started shortlisting.
- Lower funnel marketing is what happens after someone knows the problem, knows the category, and is evaluating specific vendors. They’re reading case studies, requesting demos, visiting pricing pages. Your job here is to remove friction and prove you’re the right choice.
In the middle sits consideration… the messy, non-linear, multi-stakeholder zone where most real B2B buying actually happens. Buyers don’t flow neatly from awareness to purchase. They loop back… stall… forward your blog post to a colleague who has no idea who you are yet. THEN, the VP of Marketing discovers you through a LinkedIn ad while the CTO first found you through a technical white paper three months earlier, and the CFO won’t get involved until someone drops a business case on their desk.
The funnel metaphor is both useful and slightly misleading. Useful because it reminds you that there are two fundamentally different jobs to do, building demand and converting demand. Misleading because it implies a neat journey that nobody actually takes. The point is that neglecting either stage makes the whole system break. It’s also important to note that success metrics differ significantly between the upper and lower funnel stages: upper funnel metrics focus on impressions and engagement, while lower funnel metrics emphasize conversion rates and customer acquisition costs.
How the B2B marketing funnel actually works
Most content about B2B marketing funnel stages presents you with three clean stages, awareness (also known as the awareness stage), consideration (the middle funnel), and decision, and implies that buyers move through them like they’re on a conveyor belt. (They actually don’t.)
The funnel framework is still useful for mapping out funnel strategies and understanding how to attract, nurture, and convert leads at each stage. But in reality, buyers move back and forth between the upper funnel, middle funnel, and lower funnel as they research, evaluate, and decide. Optimizing the full marketing funnel requires a comprehensive, collaborative approach that maximizes conversions and fosters lasting relationships with customers at every stage of their journey.
The three stages as a starting point
- Awareness (the awareness stage) is where a potential buyer first encounters your brand or their problem. A blog post. A LinkedIn ad. A colleague saying “have you heard of these guys?” They’re not shopping, let’s just say they’re… orienting.
- Consideration (often referred to as the middle funnel) is where that awareness becomes active research. Comparing approaches, reading industry reports, attending webinars, and visiting multiple vendor websites. In B2B, this can last weeks or months. Buying committees are forming behind the scenes, internal champions are gathering ammunition, and the actual evaluation is happening in Slack threads and internal docs you’ll never see.
- Decision is where shortlisted vendors get evaluated for real. Demos. Procurement. Pricing negotiations. Eventually, a signature. Marketing’s role here shifts to supporting sales, case studies, ROI calculators, comparison pages, but the heavy lifting has largely moved to the sales team.
Why is linearity a myth in B2B?
Here’s where the neat diagram falls apart.
A buyer might attend your webinar (awareness), visit your pricing page the next day (decision), then disappear for six weeks before downloading a technical comparison guide (consideration). They’ve moved backward and forward through the funnel without asking your permission.
Multiple stakeholders make this exponentially messier. The person who discovers your brand is rarely the one who signs the contract. Information gets passed around internally, and different team members enter the funnel at completely different stages. One person’s lower-funnel moment is another person’s first-ever touchpoint with your brand.
Intent signals appear throughout this entire journey, but they don’t map cleanly to any one stage. A pricing page visit could mean someone’s a week away from buying, or it could mean a student doing competitive research for a class project. (Both happen more than you’d think.)
The funnel framework earns its keep not because it’s precise, but because it forces the right strategic question: are you investing in both creating demand and converting it? Because if you’re only doing one, you’re building on sand. Effective funnel strategies require integrating tactics across upper, middle, and lower funnel stages to attract, nurture, and convert leads throughout the customer journey. Optimizing the full marketing funnel requires a comprehensive, collaborative approach that maximizes conversions and fosters lasting relationships with customers at every stage of their journey.
Upper-funnel marketing: goals, channels, and metrics
Upper-funnel marketing involves establishing your presence before your audience requires your services. Brand building at this stage is crucial, as it creates brand awareness, expands your audience reach, and helps generate a steady stream of leads that can be nurtured through the customer journey for long-term ROI.
This is where most B2B teams struggle (not tactically) but philosophically. The payoff is real, but it’s delayed, indirect, and notoriously hard to put in a spreadsheet. Patience is a hard sell when someone wants pipeline numbers by end of quarter.
Goals of upper-funnel marketing
The objectives are simple, even if measuring them isn't:
- Build brand awareness so your target audience knows you exist
- Educate the market on a problem or category, so you're a credible voice in that conversation
- Introduce the problem your product solves, so that when a buyer eventually starts researching, your name is already familiar
None of this generates immediate revenue. That's by design. Upper-funnel marketing plants seeds. The harvest happens later, and usually through a channel that steals all the credit (like a branded search click or a demo request) while the original awareness work goes unrecognized. It's a thankless job. But somebody has to do it.
Common B2B channels for upper-funnel marketing
The best upper-funnel channels deliver value without demanding commitment in return.
- SEO-driven blog content is the classic example. When someone searches “how to improve marketing attribution” and finds a genuinely useful guide from your company, that’s awareness at scale, without a sales pitch in sight.
- Social media ads and paid search ads are also key upper-funnel channels. Social media ads help build brand awareness and engage broad audiences, while paid search ads drive targeted traffic and improve keyword targeting, enhancing overall visibility alongside display ads and other paid campaigns.
- LinkedIn thought leadership has become one of the most powerful upper-funnel channels in B2B SaaS. A founder or marketing leader who shares real, specific, experience-backed insights (not recycled takes) can build brand recognition faster than most paid campaigns. I’ve seen this firsthand: one well-placed LinkedIn post from a CEO can do more for top-of-funnel awareness than six weeks of display ads.
- Podcasts, industry reports, and webinars all serve similar functions. They reach audiences who are actively learning but not yet actively buying. The common thread: they lead with insight, not pitch.
Successful upper-funnel strategies often include content marketing, paid media, influencer collaborations, and events to engage a broad audience and create initial interest. Brands that invest in upper funnel marketing strategies, such as content marketing and social media, can see a significant increase in brand awareness and customer engagement, which are essential for long-term growth.
Marketing funnel metrics for the upper funnel
Upper-funnel KPIs are about visibility and engagement, not revenue, and that distinction is exactly why they get dismissed in budget conversations.
The metrics that matter:
- Impressions and reach (how many people actually saw your content)
- Website visits from non-branded searches
- Engagement rate on social content
- Video views for educational content
- Branded search growth over time (this one is underrated)
Branded search growth is the metric I'd fight hardest to keep. When more people start searching for your company name, something real is happening. Awareness is working. The problem is that nobody can point to a single campaign and say, "that's what did it," which means it gets dismissed as coincidence.
Here's the thing about awareness vs conversion marketing: if your brand isn't part of someone's mental shortlist before they start evaluating vendors, you're entirely dependent on outbound sales and paid ads to get in front of them. That's expensive, and it's fragile. Upper-funnel metrics measure the demand you're creating.
Lower-funnel marketing: goals, channels, and metrics
Lower-funnel marketing picks up where awareness leaves off. It targets warm prospects who already know your brand, understand the problem, and are actively evaluating whether your product is the right fit. Lower funnel tactics and strategies focus on converting these high-intent leads into customers and generating revenue through targeted efforts.
If upper-funnel work is planting seeds, lower-funnel work is making sure nothing goes wrong at harvest time. A buyer who’s interested but hits friction, confusion, or weak proof points will simply choose a competitor. They’ve done the hard work of finding you, at this stage, it’s on you not to blow it. Lower funnel focuses include highlighting benefits, offering incentives, and providing reassurance through demos, customer testimonials, and direct sales ads.
Goals of lower-funnel marketing
The objectives here are tightly tied to revenue:
- Convert qualified prospects into customers
- Reduce friction in the buying process
- Prove ROI in concrete, specific terms
Lower funnel focuses on converting high-intent, warm leads into customers by using personalized content, retargeting, and specific performance metrics like conversion rate and ROAS to optimize sales and ROI. At this stage, marketing emphasizes benefits, incentives, and reassurance through demos, testimonials, and direct sales ads.
Lower-funnel marketing also plays a psychological role that often gets overlooked. By the time a buyer reaches this stage, they’ve often already made a tentative internal decision. What they need from you is ammunition… to justify their preference to skeptical colleagues and a suspicious finance team. Case studies, comparison pages, and product demos all serve this function: ‘Give me the evidence to defend my choice’.
Common channels for lower-funnel marketing
- Product demos are the most direct, a hands-on sense of what buying would actually mean. Free trials also serve the same purpose for product-led growth models.
- Comparison pages address the ‘why you over them?’ question that every buyer is privately asking but might not say out loud. If you don’t answer it, they’ll find the answer on G2 or Gartner instead, and you’ll have no control over what they find.
- Case studies are powerful because they let prospects see themselves in someone else’s success story. ‘Oh, they were struggling with the same attribution mess we have’, that recognition is worth more than any product feature sheet.
- Retargeting ads keep your brand visible during the long B2B evaluation period and can increase conversion rates by up to 150%, with retargeted users being around 70% more likely to convert than first-time visitors.
- Email marketing and email drip campaigns are highly effective lower-funnel tactics, achieving open rates around 60% and click-through rates near 15%, significantly outperforming standard email campaigns.
- Customer testimonials showcased in retargeting campaigns, especially on platforms like Facebook, can effectively convert warm leads and enhance advertising effectiveness.
- Sales outreach, when timed well, converts digital intent signals into real conversations. And pricing pages, whatever you think about showing pricing publicly, are one of the strongest lower-funnel signals a buyer can give you. Lower-funnel strategies also focus on driving repeat purchases to maximize customer lifetime value.
Marketing funnel metrics for the lower funnel
These are the numbers that make finance teams happy:
- Conversion rate
How effectively you’re turning prospects into customers - Pipeline created
Total value of opportunities generated - Cost per acquisition (CPA)
What you’re spending to win each customer - Return on ad spend (ROAS)
Connecting paid activity to actual revenue - Revenue
The ultimate lower-funnel metric, the one everything else ladders up to
Lower funnel efforts and lower funnel strategies are essential for maximizing conversions and revenue, as they focus on guiding prospects through the final stages of the customer journey. The bottom of the funnel targets warm prospects who are ready to make a decision between competing solutions. Lower funnel marketing strategies should be managed by experts skilled in closing deals, and are integral to a comprehensive, full-funnel marketing approach.
These numbers make it easy to defend lower-funnel marketing in budget conversations. And that clarity is a double-edged sword. It makes it easy to justify, and dangerously easy to over-index on, to the point where the entire marketing function starts to look like a demand capture machine with nothing feeding the top.
Upper funnel vs lower funnel: what's actually different?
Here’s a side-by-side that makes the contrast concrete:
Now let’s see the pattern. Upper-funnel activity targets a broad audience and potential customers; it is harder to measure and takes longer to pay off, but it creates the demand that the lower funnel converts. Lower-funnel activity focuses on a narrower group of high-intent prospects, is easier to justify, and is faster to show results, but it can only work with the audience that upper-funnel efforts already attracted.
Each stage requires its own marketing tactics and tailored marketing campaigns to move potential customers through the funnel effectively. Success metrics also differ significantly: upper funnel metrics focus on impressions and engagement, while lower funnel metrics emphasize conversion rates and customer acquisition costs.
You can have the best demo experience in your category, but if nobody’s heard of you, there’s nobody to demo to.
Conversely, you can run brilliant brand campaigns, genuinely great creative, sharp positioning, the works, and if your conversion experience is clunky and unconvincing, all that awareness evaporates exactly at the moment it should be turning into revenue.
The comparison between top of funnel vs bottom of funnel is about recognizing that they operate on different timelines, require different skills, and produce different kinds of evidence. A mature funnel marketing strategy respects both, not because it’s philosophically balanced, but because the math eventually forces the issue.
Why most B2B teams over-invest in the lower funnel
There’s a pattern I’ve seen play out in B2B organizations of almost every size, and it usually starts with entirely good intentions.
The marketing team runs a healthy mix of awareness and conversion activity. Results come in. Lower-funnel campaigns produce clear numbers: demos booked, pipeline created. Lower funnel efforts are specifically focused on converting nurtured prospects to customers and are critical to generate revenue. Upper-funnel campaigns produce… impressions. Maybe some engagement metrics. Maybe a vague branded search uptick that nobody can tie to a specific campaign.
At the next budget review, guess which programmes get expanded and which get trimmed?
Research shows that companies that adopt full-funnel marketing see up to 45% higher customer retention rates and stronger overall ROI.
The gravitational pull of measurability
Lower-funnel marketing attracts disproportionate investment because it produces results that are fast, visible, and easy to put in a spreadsheet. Retargeting shows click-through rates and conversions. Branded search campaigns show direct-response metrics. Sales enablement content gets real-time feedback from the sales team. Everything at the bottom of the funnel comes with a number attached, and in organizations running on quarterly reporting, numbers win.
Upper-funnel activity requires you to argue in probabilities. Things like: ‘Branded search volume grew 35% this quarter, which suggests our awareness campaigns are working’ is a perfectly valid analytical statement. But it doesn't carry the same weight in a budget meeting as ‘this campaign generated £400K in pipeline.’ SEE, how you nodded in agreement, I saw that, too. The measurability gap creates a gravitational pull toward conversion spending, even when everyone in the room intellectually understands that awareness matters.
What happens when the lower funnel eats up the budget?
The consequences don't show up immediately, which is exactly what makes this trap so effective. In the first quarter after shifting budget downward, pipeline might actually improve. You're squeezing more efficiency out of the existing aware audience, and the surplus from previous awareness campaigns is still flowing through.
By the second or third quarter, four problems tend to surface:
- Shrinking pipeline
Fewer new companies are discovering your brand. The top of the funnel narrows. There are simply fewer accounts entering consideration, which means fewer opportunities for the lower funnel to convert. You can't close deals that never started. - Rising customer acquisition cost
As the pool of aware prospects shrinks, you're paying more to reach and convert each remaining one. Retargeting the same audience repeatedly yields diminishing returns. Branded search campaigns start competing against a flat or declining search volume. - Weakening brand awareness
Your competitors, the ones still investing in thought leadership and educational content, start occupying the mental space your brand used to hold. Prospects who would have found you organically now find someone else first. - Dependence on existing demand
Your marketing engine becomes a demand capture machine with no demand creation engine feeding it. You can only convert people who already know you. And that audience isn't growing.
This is the demand capture vs demand creation imbalance, and it's one of the most common strategic pitfalls in B2B. The irony is painful: the teams most focused on proving marketing's impact on revenue are often the ones undermining their future revenue by starving the upper funnel.
It's like only training the muscles you can see in the mirror. Everything looks great until you try to do something that requires the ones you've been ignoring.
The missing layer: intent signals between awareness and conversion
Traditional funnel thinking treats awareness and conversion as two distinct stages with a vague, hand-wavy middle called ‘consideration.’ That wavy middle part is where most of the interesting buyer behavior actually happens, and in most B2B analytics setups, it’s almost entirely invisible.
Understanding the buying journey and customer journey is crucial for mapping the conversion funnel, which tracks the entire process from initial awareness to purchase. Between upper-funnel and lower-funnel activity, buyers leave a trail of digital intent signals. These aren’t conversions. They’re behavioral clues that a prospect is moving from passive awareness into active evaluation. Recognizing and acting on these signals is what separates teams that react to demand from teams that anticipate it.
What intent signals actually look like
Intent signals aren't a single dramatic event. They're a pattern of behaviors that, taken together, suggest a buyer is getting serious:
- Repeated visits to your website from the same company
- Increased time spent on product-specific pages
- A visit to your pricing page (one of the strongest buying signals in B2B SaaS because nobody visits a pricing page out for fun, but if you do, it’s ok… this is a safe space)
- Downloading gated reports or technical documentation
- Researching your competitors on review sites and comparison platforms
FYI: None of these individually means someone is ready to buy.
But when an account starts exhibiting several of them in a compressed timeframe, something has shifted. They've moved from "vaguely aware" to "actively considering." That's the window where the right marketing or sales action can actually hit accelerate on the deal.
So, why is this layer invisible in traditional analytics?
Because it’s traditional… duh! Sorry, just kidding.
Look, most B2B analytics tools are built around individual sessions and known contacts. Google Analytics tells you how many people visited your pricing page. It doesn't tell you which companies those visitors represent. Your CRM tracks named leads but knows nothing about the three other people from the same account who spent 20 minutes on your blog last week without filling out a form.
Marketing sees aggregate traffic trends… sales sees individual leads… and nobody sees the account-level journey connecting the two. It's like watching a film with every third scene removed. You can follow the general plot, but the most important transitions are missing.
This invisible layer is exactly where intent data platforms add lotsa value. They surface the account-level patterns that reveal which companies are researching, what topics they care about, and how far along they are in their evaluation. When you can see this layer, the gap between upper-funnel and lower-funnel stops feeling like a black box. It becomes something you can actually act on.
How do you connect upper-funnel and lower-funnel data?
The typical B2B marketing stack creates a near-comical separation between the two halves of the funnel. Marketing sees traffic, impressions, and engagement. Sales sees leads, opportunities, and pipeline. The journey between those two, where an anonymous visitor becomes a known prospect, is largely undocumented. Connecting data across the entire customer journey and sales funnel is essential for understanding how prospects move from initial awareness to final purchase.
This isn’t just an analytics inconvenience. It has real strategic consequences. If you can’t connect upper-funnel activity to lower-funnel outcomes within the conversion funnel, you can’t prove which awareness campaigns contribute to revenue. And if you can’t prove that, the budget conversation becomes almost impossible to win.
The visibility problem (in simple words)
Imagine a SaaS company running a strong content programme. Their SEO blog drives thousands of monthly visits. Their LinkedIn posts get solid engagement. Their webinar series consistently pulls a few hundred registrants per event. By every upper-funnel metric, things look healthy.
Meanwhile, sales is closing deals with accounts that seem to appear from nowhere. A prospect books a demo, the sales team asks "how did you hear about us?" and the answer is usually something like "I came across you online a while back." Now… online could mean a thousand things. And unsurprisingly, there's no thread connecting the blog post they read four months ago to the webinar they attended two months ago to the demo they just booked.
Marketing can't take credit. (as someone from marketing, I’ll <insert a sad face> here). More importantly, they can't learn which combination of touchpoints actually works. So then? Every budget conversation is an argument from intuition rather than evidence. And I’m all for gut feelings and intuition, but it just doesn’t cut it here.
Account-level intent tracking can bridge the gap
This is where account-level intent tracking changes the equation. Instead of tracking individual anonymous sessions, these platforms identify which companies are visiting your site, what content they're engaging with, and how their behavior changes over time.
Here's what this looks like:
- Identifying anonymous company traffic
Even when individual visitors don't fill out a form, intent tracking can match IP data and other signals to identify which organisations are visiting. You go from "1,200 anonymous sessions this week" to "these 85 companies visited, and here's what they looked at." That's a fundamentally different starting point for a Monday morning pipeline review. - Tracking content engagement at the account level
Instead of knowing that a blog post got 3,000 views, you know that Company X read three blog posts and a comparison page within the same week. That's a materially different signal. - Mapping account journeys across the funnel
You can see the progression from initial awareness touchpoints through consideration content to lower-funnel pages, all connected to a single account. The film no longer has missing scenes. - Triggering retargeting or sales outreach
When an account crosses a certain intent threshold, you can automatically activate a retargeting campaign or alert a sales rep. The response happens when the buying signal is fresh, not two weeks later when someone finally fills out a form. - Prioritising high-intent accounts
Sales teams can focus energy on accounts showing the strongest buying signals, rather than working a list built on gut feel or basic lead score alone.
Platforms like Factors.ai are built to solve exactly this problem. They connect anonymous website activity with account-level identity, stitch together cross-channel engagement data, and surface the intent signals sitting between awareness and conversion. Instead of marketing and sales looking at two different halves of the same picture, they're looking at the same account journey, from first touch to closed deal. That shared visibility is what makes a full funnel marketing strategy operationally real, rather than just a nice idea on a whiteboard.
What does a practical B2B full-funnel strategy look like?
Theory only becomes convincing when you can see it working in context. Let me walk you through how a hypothetical B2B SaaS company (one selling a marketing analytics platform) might structure a full-funnel strategy that actually connects awareness to revenue.
- Upper-funnel layer: creating demand
The company invests in four primary awareness channels. Their marketing team publishes SEO-driven guides on topics like “marketing attribution models” and “how to measure campaign ROI.” Their Head of Marketing posts weekly LinkedIn content drawn from real campaign data and lessons learned (not recycled industry platitudes). They produce quarterly industry reports with original research that earns backlinks. And they run a monthly webinar series featuring marketing leaders from their target customer segment. Optimized social media pages play a crucial role here, increasing brand visibility, building authority, and helping attract quality leads through engaging content and consistent social media marketing strategies.
Notice what’s missing from this list: product mentions. None of these activities are pitching. They’re designed to attract marketing leaders who care about measurement and attribution, the exact audience the company wants to reach. The goal is to earn attention and build recognition over months, not to generate instant leads. Yes, this requires patience. No, this is not optional.
- Mid-funnel layer: nurturing interest
As awareness activity brings visitors to the site, some start showing deeper engagement. They visit comparison pages. They download gated reports. They click retargeting ads after an initial website visit.
The crucial addition here is intent tracking. Using account-level analytics, the marketing team can see which companies are engaging across multiple touchpoints. A company that read two blog posts, attended a webinar, and visited the comparison page is sending a very different signal than one that bounced off the homepage after twelve seconds. Treating both the same way is a waste of everyone's time.
- Lower-funnel layer: converting demand
For accounts showing strong buying intent, the company activates its lower-funnel playbook. High-intent accounts get invited to a personalised product demo. The sales team receives alerts with context on what content the account has consumed, so they can tailor outreach instead of starting from scratch. At this stage, marketing campaigns are crafted specifically for bottom-of-funnel conversion, focusing on persuading prospects to choose their solution over competitors. Case studies relevant to the prospect’s industry are shared proactively. And the pricing page serves as both a conversion tool and an intent signal when accounts return to it repeatedly.
How intent data ties the layers together
Without intent data, each funnel layer operates semi-independently. Marketing runs awareness campaigns and hopes they contribute to pipeline. Sales works whatever leads come through without knowing what happened before the form fill. Everyone's doing their job and nobody can see the full picture.
With intent data, the layers connect. Marketing can identify which companies are researching their category based on content engagement patterns. They can activate retargeting precisely when an account shows elevated interest. And they can shorten the sales cycle by equipping sales with context about the prospect's journey before the first conversation even starts.
The prospect who books a demo isn't a mystery anymore. You know they read your attribution guide three weeks ago, attended your webinar two weeks ago, and visited your pricing page twice this week. That knowledge changes how sales approaches the conversation, and it changes how marketing measures its contribution. Finally.
How should you measure funnel performance with attribution?
Attribution is where the upper funnel vs lower funnel conversation either comes together or falls apart. Without a credible way to connect early-stage marketing activity to downstream revenue, every budget conversation becomes an argument from gut feeling. And in B2B, where buying cycles can stretch across months and dozens of touchpoints, getting attribution right is both essential and genuinely difficult. For lower funnel efforts, metrics like customer lifetime value are especially important, as they measure the long-term impact of marketing by tracking repeat purchases, order value, and overall customer engagement over time.
Why is last-click attribution such a problem in B2B?
Most B2B teams default to last-click attribution, either intentionally or because it's the path of least resistance in their tools. Last-click gives all the credit to the final touchpoint before a conversion. Prospect books a demo after clicking a retargeting ad? The retargeting ad gets 100% of the credit.
The problem is obvious when you think about it. That prospect might have first encountered your brand through a blog post, attended a webinar, read a case study, and then clicked the retargeting ad. Last-click ignores everything that came before. It systematically undervalues upper-funnel activity and over-credits the last touch, which is almost always a lower-funnel channel.
In B2B specifically, this distortion is severe. Attribution debates sometimes resemble group projects where the person who showed up for the final presentation takes all the credit, while the person who did six months of foundational research gets nothing. When your attribution model only sees the last step, your budget decisions will inevitably favor the last step, which reinforces the lower-funnel over-investment problem we covered earlier. It's a self-fulfilling prophecy.
Multi-touch attribution as a corrective
Multi-touch attribution distributes credit across all the touchpoints that contributed to a conversion, rather than awarding everything to the last click. There are different models for how to distribute that credit: linear, time-decay, position-based, and data-driven, but the core principle is consistent: multiple interactions share recognition for a conversion outcome.
This matters enormously for upper-funnel marketing. When you can show that a LinkedIn thought leadership campaign influenced 40 accounts that later entered the pipeline, even though none converted directly from a LinkedIn click, you've got evidence that awareness investment is working. That evidence is what keeps the upper funnel funded.
Multi-touch attribution is far from perfect, and we should acknowledge this reality. It requires clean data, consistent tracking, and a willingness to accept probabilistic rather than deterministic answers. No attribution model answers every question perfectly, and anyone who tells you otherwise is probably selling one. But even an imperfect multi-touch model is dramatically better than last-click for understanding how B2B marketing actually works.
Here are the metrics that matter for full-funnel attribution
When you're measuring funnel performance with attribution, the metrics shift from channel-specific vanity numbers to strategic indicators:
- Influenced pipeline. What is the total pipeline value influenced by a specific campaign or channel, even if it wasn't the last touch? This is the metric that gives upper-funnel marketing its due credit.
- Assisted conversions. How many conversions did a channel assist, even when it wasn't the converting touchpoint? A blog post that introduces an account to your brand might assist dozens of conversions without ever being the last click.
- Account journey tracking. Mapping the full sequence of touchpoints an account engaged with before converting. This qualitative view often reveals insights that aggregate metrics miss, like the discovery that webinar attendees convert at twice the rate of non-attendees, which is the kind of data point that justifies an entire content programme.
- Campaign-level ROI. Connecting specific campaigns to revenue outcomes, weighted by attributed contribution. This lets you compare the true return on an SEO content investment against a retargeting campaign on an apples-to-apples basis, rather than just comparing impression cost to CPL and calling it analysis.
These are the marketing funnel metrics that connect early marketing activities to pipeline and revenue, and they're exactly what tools like Factors.ai are designed to surface. By stitching together account-level engagement data across channels and mapping it to pipeline outcomes, attribution platforms give marketing leaders the evidence they need to defend full-funnel investment.
Instead of presenting impressions and hoping the room trusts that awareness matters, you can show the actual account journeys that started with a blog post and ended with closed revenue. That changes the conversation from ‘trust me, brand matters’ to ‘here's what the data shows.’
When attribution is working properly, the upper funnel vs lower funnel debate stops being an argument. It becomes a planning conversation about how to allocate resources across a system that clearly requires both.
In a nutshell
The gap between upper-funnel and lower-funnel marketing in B2B affects pipeline growth, customer acquisition cost, and how confidently you can defend your marketing budget when someone from finance asks the inevitable question.
Upper and lower funnel strategies each play a distinct role in guiding the customer journey from brand awareness to conversion. Upper-funnel marketing creates the demand that lower-funnel marketing converts. When B2B teams cut awareness spending because it’s hard to measure, pipeline eventually thins and acquisition costs rise. The solution isn’t to measure the upper funnel by lower-funnel standards. It’s to use the right metrics: branded search growth, engagement, and reach, and the right tools, account-level intent tracking, multi-touch attribution, to make the connection visible.
Between awareness and conversion sits a layer of intent signals that most analytics setups miss entirely. Repeated site visits, pricing page views, content consumption patterns, competitor research, these all indicate that an account is moving from passive awareness to active evaluation. Surfacing these signals with tools like Factors.ai gives marketing and sales a shared view of the buyer journey, which is the foundation of any real full-funnel strategy.
If you take one thing from this piece, let it be this: audit where your budget actually sits. If more than 70% of your marketing spend targets the lower funnel, you’re likely capturing existing demand rather than creating new demand. Rebalancing, while investing in the intent tracking and attribution infrastructure that connects the two halves, is the single highest-leverage move most B2B teams can make.
Start by identifying the accounts already showing intent signals on your site, and connect those signals to the awareness campaigns that brought them there. That’s where the full-funnel picture starts to become clear. Balancing upper and lower funnel strategies is essential for full-funnel effectiveness, not only driving conversions but also fostering customer loyalty through ongoing engagement and retention.
Frequently asked questions for upper funnel vs lower funnel
Q1. What’s the difference between upper-funnel and lower-funnel marketing?
Upper-funnel marketing focuses on building awareness and educating potential buyers who may not know your brand yet. It uses channels like SEO content, LinkedIn thought leadership, webinars, podcasts, and content marketing to deliver educational value and spark interest. Lower-funnel marketing targets prospects who are already evaluating solutions and aims to convert them into customers through demos, case studies, pricing pages, and sales outreach. Google Ads can be leveraged at both stages, with upper-funnel campaigns driving brand awareness and lower-funnel campaigns focused on conversions. The two stages serve different roles in the buyer journey but work best when they’re connected through consistent messaging and shared data.
Q2. Why is upper-funnel marketing important for B2B specifically?
B2B buying cycles are super long, often spanning months and involve multiple stakeholders. By the time a buyer enters the decision stage, they’ve already formed opinions about which brands are credible. Upper-funnel marketing builds that trust and recognition well before the buying need becomes urgent. Without it, you’re entirely dependent on capturing demand that already exists, which limits your total addressable audience and makes you vulnerable to competitors who invested in awareness while you weren’t.
Q3. Which channels work best for upper-funnel B2B marketing?
SEO-driven blog content, LinkedIn thought leadership, educational webinars, podcasts, industry reports, YouTube videos, and content marketing are the most effective upper-funnel channels in B2B. The common thread is that they deliver genuine value to the audience without requiring a purchase commitment. The best upper-funnel content addresses problems and ideas your target buyers actually care about (even if your product never gets a mention).
Q4. Which metrics matter most for lower-funnel marketing?
The core lower-funnel metrics are conversion rate, pipeline created, cost per acquisition (CPA), return on ad spend (ROAS), and revenue. These are the numbers directly tied to revenue outcomes, which is why they dominate budget conversations and, ironically, why teams tend to over-invest in lower-funnel activity at the expense of building future demand. Google Ads is a common channel for lower-funnel campaigns, where performance is measured closely against these metrics.
Q5. How do you connect upper-funnel and lower-funnel data?
Account-level intent tracking is the most effective way to connect the two. Instead of tracking anonymous individual sessions, intent platforms identify which companies are visiting your site, what they’re engaging with, and how their behaviour evolves over time. Tools like Factors.ai stitch together cross-channel engagement data and surface the intent signals that live between awareness and conversion, giving marketing and sales a shared view of the buyer journey rather than two disconnected halves of a story nobody can fully read. Mapping the customer journey is essential to ensure that marketing strategies and data are aligned at every stage, from initial awareness to final conversion.
Q6. What is full-funnel attribution in B2B marketing?
Full-funnel attribution connects early-stage marketing activity to downstream revenue outcomes. Instead of crediting only the last touchpoint before a conversion, which systematically undervalues awareness work, full-funnel attribution distributes credit across all the interactions that influenced a buyer’s journey. It uses models like multi-touch attribution to show influenced pipeline, assisted conversions, and campaign-level ROI. It’s how marketing teams prove that the blog post someone read four months ago actually contributed to the deal that closed last week.

Full funnel attribution: How does full path attribution work in B2B marketing?
See how full funnel attribution works in B2B marketing, how full path attribution distributes credit, and how to measure upper and lower funnel impact.
TL;DR
- Full-funnel attribution tracks every marketing and sales interaction across the entire buyer journey, from first impression through closed deal, instead of handing all the credit to a single touchpoint.
- Full path attribution is a specific multi-touch model that assigns roughly 22.5% credit each to first interaction, lead creation, opportunity creation, and last interaction, with the remaining 10% distributed across everything in between.
- Upper-funnel marketing builds awareness and generates demand. Lower-funnel activity drives conversions. Most traditional attribution models overvalue the bottom and quietly starve the top.
- Implementing full-funnel attribution requires connected data sources, clearly defined funnel stages, and a reporting layer that maps pipeline and revenue back to actual campaigns.
- The future of attribution is moving toward AI-driven, account-level models that fold in intent data and dark funnel signals alongside traditional touchpoint tracking.
Every quarter, the same ritual plays out in B2B marketing teams. Someone pulls up the campaign report, points at last-click data, and confidently declares that paid search is the only channel generating pipeline. The brand campaign is… apparently useless. The webinar series that educated 400 target accounts over six weeks gets… zero credit. Meanwhile, the SDR team insists they sourced the deal themselves because their outbound sequence landed right before the demo request.
And ALL of this is good enough to confuse you, make you feel seven different emotions, and give you a level-4 headache.
Now… what makes this whole thing a little more frustrating is the fact that nobody's lying here. Everyone's just looking at a teeny-tiny piece of a much larger picture. In B2B buying cycles that span months and involve multiple stakeholders, a single deal might touch a dozen different interactions before it closes. Full funnel attribution solves exactly this problem: distributing credit where it's actually earned, across every stage of the journey, so marketing and sales leaders can make budget calls based on reality rather than whichever touchpoint happened to fire last.
This guide breaks down what full-funnel attribution actually means in practice, how the full path model calculates credit, and why it matters specifically for B2B teams running multi-channel go-to-market motions.
What is full-funnel attribution?
Attribution, at its core, is trying to answer one deceptively simple question: which marketing activities actually influenced this conversion? The challenge is that ‘influenced’ carries a lot of weight in that sentence.
A prospect might move through the marketing funnel, seeing a LinkedIn ad in January, reading a blog post in February, attending a webinar in March, getting an SDR email in April, and finally booking a demo in May. So, which of those touchpoints deserves the credit?
Even Mr. Bean doesn’t know…

- Single-touch models answer that by picking one moment and giving it everything.
- First-click attribution hands all the glory to that January LinkedIn ad.
- Last-click ignores every prior touchpoint and credits only the demo booking.
Both are simple, both are fast, and both are wildly misleading, especially when they ignore the need for consistent messaging throughout the funnel.
Full-funnel attribution takes a different approach entirely. Instead of picking a single winner, it tracks every interaction across the buyer journey and distributes credit across the full conversion path, mapping each touchpoint to its place in the sales funnel. Awareness-stage touches get recognized alongside consideration-stage engagement and bottom-of-funnel conversion events. And then, what you see is a more accurate picture of how your marketing actually works (not how it looks in a dashboard that’s already made up its mind).
In B2B specifically, this approach is more useful than almost any other context. Because you’re not dealing with a single buyer making an impulse decision. You’re dealing with buying committees of five, ten, sometimes fifteen people, each engaging with different channels at different times, over a sales cycle that might stretch across three to nine months. In this case, the marketing team must manage and align strategies across all funnel stages to ensure accuracy and effectiveness. Trying to compress all of that into a single ‘source’ field in your CRM actively misleads everyone who reads the report.
What is full funnel marketing?
Full funnel marketing is a strategy that addresses all stages of the marketing funnel, from building brand awareness at the top to driving conversions and fostering loyalty at the bottom. Rather than optimizing for a single stage, a full funnel marketing strategy ensures your own marketing tactics are tailored to each phase, guiding potential customers through the entire journey. Instead of running separate, disconnected campaigns for awareness, consideration, and conversion, you design a coordinated system that moves accounts through each phase deliberately. That sounds obvious when I write it out, but in practice, most B2B teams still operate in stage-specific silos. The demand gen team runs top-of-funnel campaigns, content owns the middle funnel, and sales handles everything below. Nobody’s really looking at the full picture at the same time.
You obviously know this, but for the sake of clarity, I’m going to go over this again. The marketing funnel breaks down into three broad stages, and each one requires a different playbook.
- ToFu (top of funnel) is where you’re building brand awareness and educating your market by targeting a broad audience of potential customers. The buyer might not even know they have a problem yet, or they know the problem but haven’t started evaluating solutions. Full funnel marketing tactics at this stage include thought leadership content, LinkedIn video ads, industry reports, and podcast appearances. The goal isn’t conversion. It’s recognition and relevance, which are harder to measure but no less important.
- MoFu (middle of funnel) is where evaluation and nurture happen. At this middle funnel stage, potential customers have awareness of your product or service and are actively considering if it meets their needs. This is the time for targeting prospects and providing your marketing tactics tailored to your target audience, such as webinars, comparison guides, customer stories, and email nurture sequences. This is where most of the invisible work happens, the stuff that doesn’t show up in last-click reports but absolutely shapes the buying decision.
- BoFu (bottom of funnel) is where purchase decisions get made. Demo requests, pricing page visits, proposals, and contract negotiations all fall here. It’s the most measurable part of the funnel, which is precisely why it tends to hog all the attribution credit in simpler models.
In B2B, a prospect might bounce between the middle funnel and bottom of funnel multiple times. Different members of the buying committee might be at different stages simultaneously, with one person reading your blog while another is already on a sales call. This mess is exactly why attribution becomes critical once you’re running a full funnel marketing strategy.
Without visibility into how your ToFu investments feed middle funnel engagement, which feeds BoFu conversions, you’re flying blind on budget allocation. And…
Upper funnel vs lower funnel: What's actually different in B2B?
The difference between upper and lower funnels shows up in every marketing textbook (okay, not really… mine only had the 3 Ps of marketing). A full funnel approach is essential for coordinated tactics across all stages of the customer journey.
- Upper-funnel marketing focuses on awareness, audience expansion, and problem discovery. You’re trying to get in front of accounts that don’t know you (yet) or haven’t started thinking about the problem you solve. The content is educational and broadly relevant: thought leadership articles, LinkedIn video campaigns, industry benchmark reports, and conference talks, as well as content marketing, social media marketing, social media campaigns, social media ads, search ads, and paid search ads. Effective upper-funnel marketing strategies include content marketing and social media, which help develop relationships with potential customers and build brand recognition. The goal is building relationships, addressing pain points, and increasing brand recognition. You’re not really asking anyone to buy anything… but earning the right to be considered when the buying process eventually starts.
- Lower-funnel marketing focuses on conversions, product evaluation, and purchase decisions. Here, the buyer is actively comparing solutions. They’re requesting demos, visiting your pricing page, engaging with case studies, and talking to your sales team. Lower funnel marketing strategies are focused on converting leads into customers through targeted marketing campaigns and coordinated marketing efforts. The content is specific, practical, and designed to reduce risk and build confidence in choosing your product.
Here’s a quick comparison to make the distinction concrete:
The problem is that traditional attribution models systematically overvalue lower-funnel actions. Last-click attribution, which is still the default in many analytics setups, gives 100% of the credit to whatever happened right before conversion. Your demo page wins all the praise, but the webinar series that actually educated the buyer and brought them to your site gets nothing.
Over time, this creates a not-so-fun feedback loop. Leadership sees that lower-funnel channels drive all the pipeline. Budget shifts away from upper-funnel programmes, brand awareness declines, and the top of the funnel dries up. Then… six months later, everyone wonders why pipeline volume is dropping despite increasing spend on bottom-of-funnel tactics.
I’ve watched this exact pattern play out multiple times, and it almost always traces back to an attribution model that couldn’t see past the last click. Proper implementation and optimization at each stage can make all the difference in driving conversions and overall marketing effectiveness.
So, then what is full path attribution?
Full path attribution is a specific multi-touch attribution model where simpler models pick one or two moments to credit; full path attribution distributes credit across the key milestones of the entire buyer journey.
The model recognizes four critical stages in the B2B conversion path:
- First touch: The very first interaction a prospect has with your brand. For example, the LinkedIn ad they clicked, the blog post they found through search, the event where they scanned your booth.
- Lead creation: The moment an anonymous visitor becomes a known contact. For example, they filled out a form, signed up for a webinar, or downloaded a resource.
- Opportunity creation: The point where a lead becomes a qualified sales opportunity. This is where the marketing-to-sales handoff typically happens.
- Deal closed: The final conversion. Contract signed, deal won, party time!
What makes this model suitable for B2B teams is that it explicitly recognizes the marketing-to-sales handoff as a critical moment. Most attribution models either focus entirely on the marketing side and ignore what happens after lead creation or focus on the sales side and ignore everything that came before. Full path attribution bridges that gap by treating opportunity creation as equally important to first touch and lead creation.
This makes it especially useful for pipeline attribution, where you’re trying to understand which marketing activities actually contribute to qualified pipeline and revenue, not just raw lead volume. Importantly, full path attribution also enables organizations to evaluate customer lifetime and customer lifetime value (CLV) as key metrics for long-term success. By tracking the entire journey, you can assess which activities drive initial conversions and which ones impact customer retention, repeat purchases, and overall profitability over time.
If your organization is trying to align marketing and sales around shared revenue goals (and you should be), full path attribution gives both teams a common language for evaluating contribution across the full journey.
How does the full path attribution model calculate credit?
The full path model uses a rule-based credit distribution structure that weights the four key milestones roughly equally, then spreads the remaining credit across everything else that happened in between. This approach aligns with the structure of the sales funnel and marketing funnel, ensuring that each stage of the buyer journey is properly represented.
Here’s the typical breakdown:
The logic is this: each major funnel milestone gets an equal, significant share of credit because each represents a distinct and meaningful transition in the buyer journey. The remaining 10% is distributed across all other interactions that occurred between those milestones. This ensures that mid-journey touchpoints like blog visits, email clicks, and webinar attendance still receive some recognition, even if they’re not treated as primary conversion drivers.
Let’s make this tangible with a more concrete example for people like me who need to see examples to understand what these numbers even mean. Imagine a B2B SaaS deal that closes for £50,000 (Wohoo!) in annual contract value.
The buyer journey looked like this:
- LinkedIn ad click (first interaction): The prospect clicked a sponsored post about your product category.
- Blog visit: They read a comparison article on your site a week later.
- Webinar signup (lead creation): They registered for a live webinar, providing their contact details.
- Demo request (opportunity creation): After the webinar, they booked a product demo and sales qualified them.
- Closed deal (last interaction): After a sales process, the contract was signed.
Under full path attribution, credit distributes like this:
Here’s what’s going on… the LinkedIn ad (which last-click attribution would have completely ignored) gets credited with over £11,000 in influenced revenue. The blog visit, which rarely shows up in any single-touch report, still earns £5,000 in credit. This is a fundamentally more complete picture of how your marketing contributed to that deal.
When evaluating the effectiveness of your full funnel attribution model, it’s important to track not only sales and CLV, but also repeat purchases. Monitoring repeat purchases at the lower end of the funnel helps you assess customer retention and loyalty, providing a more comprehensive view of marketing performance.
One important caveat: the 22.5% split is a convention (it’s NOT a universal truth). Some organizations adjust these weights based on their own data. For example, a company with a very long consideration phase might weight MoFu touches more heavily. Others use algorithmic attribution to let the data determine the weights dynamically. The full path model gives you a solid, defensible starting point, but treat it as a framework to refine rather than a permanent answer.
Why does full-funnel attribution matter for B2B teams?
There’s a reason this topic keeps appearing in every B2B marketing strategy conversation. The stakes are high, and the problems it solves come up every single quarter.
- Long, complex buying cycles make single-touch attribution absurd
A typical enterprise deal involves weeks or months of research, multiple stakeholders engaging across different channels, and dozens of touchpoints before anyone signs anything. Giving all the credit to the first or last interaction in a journey like that is like judging a film based only on the opening scene or the closing credits... or judging a book by the cover (front or back). You’re missing the entire plot. Full-funnel attribution captures the full narrative, recognizing that the conference talk planted the seed of curiosity, the case study that built confidence, and the sales call that closed the deal all played distinct and necessary roles.
- Channel silos create incomplete pictures
Different teams and pods own different channels. Paid media runs ads. Content produces blog posts and guides. Events manages webinars. SDRs handle outbound. Each team reports on its own metrics in its own tools, and none of them see how their work connects to what the others are doing. Full-funnel attribution stitches these interactions into a single unified journey. Attribution debates sometimes resemble group projects where everyone claims credit for the final result, but at least when you have the data, the conversation is grounded in something real.
- Budget allocation breaks down without cross-funnel visibility
Without full-funnel attribution, lower-funnel channels systematically steal credit from upper-funnel programmes. Your LinkedIn brand campaigns look like a money pit. Your blog content appears to have zero ROI (and as a content person, please know that I’m crying). Your webinar series seems like a nice-to-have that doesn’t drive pipeline. Meanwhile, your retargeting ads and paid search campaigns look like heroes because they’re the last thing people click before converting. And so, budgets shift accordingly; *crying intensifies,* and a few months into it, you’re wondering why pipeline has dried up even though conversion rates look great on paper.
Full-funnel attribution breaks this cycle by showing you how upper-funnel investments feed the pipeline that lower-funnel tactics convert, and it also helps foster customer loyalty by ensuring bottom-of-funnel marketing is effectively targeted for long-term business growth.
How do the most common attribution models stack up?
Attribution models distribute conversion credit across touchpoints based on either predefined rules or algorithms. Each one makes different assumptions about which interactions matter most, and those assumptions shape the conclusions you draw. Here's how the main models compare:
A few things stand out when you look at these side by side. The simpler the model, the easier it is to implement, but the more it distorts your understanding. First-touch and last-touch models are trivially easy to set up, which is why they remain so popular. They're also fundamentally unable to capture the multi-stage reality of B2B buying.
Linear attribution is a step up, but it treats every touchpoint as equally important, which isn't true either. A random blog visit three months ago probably didn't matter as much as the demo that happened last week. Time decay tries to solve this by weighting recent interactions more heavily, but in doing so it recreates the same problem as last-click, just in softer form. Your upper-funnel investments still look undervalued.
The U-shaped and W-shaped models are closer to what B2B teams actually need, because they explicitly weight the key milestone moments. Full path attribution extends this logic to include the deal close, making it the most complete rule-based model for teams that want to track the entire journey from first interaction to revenue.
Algorithmic attribution sits in a category of its own. Instead of predefined rules, it uses machine learning to determine which touchpoints are most predictive of conversion. In theory, this gives you the most accurate picture. In practice, it requires large data volumes, technical resources to build and maintain, and a level of trust in black-box models that not every organisation is comfortable extending. No attribution model answers every question perfectly, and anyone who tells you otherwise is probably selling one.
What are the real challenges of implementing full-funnel attribution?
If full-funnel attribution sounds like an obvious choice at this point, there's a reason most B2B teams still haven't implemented it well. The concept is straightforward. The execution is where things get genuinely difficult.
- Data fragmentation across tools and teams
The biggest obstacle is that your data lives in silos. Ad platforms track impressions and clicks. Marketing automation tracks email engagement and form fills. CRM tracks leads, opportunities, and deals. Website analytics tracks page views and sessions. Product analytics tracks in-app behavior. Each system has its own data model, its own identity logic, and its own definition of a "user." Stitching these together into a unified buyer journey requires either dedicated tooling, significant engineering investment, or both. Most teams underestimate how hard this integration work actually is. It's not just connecting APIs. You need to resolve identity across systems, handle data quality issues, and build a timeline that accurately represents how real humans interacted with your brand across channels and devices.
- The dark funnel is invisible by design
Not every meaningful interaction is trackable. Let’s take a few examples: when a prospect mentions your product in a private Slack community, when a colleague recommends you over coffee, and when someone reads a LinkedIn post without clicking anything, those signals influence the buying decision but never appear in your attribution data. You can't attribute what you can't measure. The best you can do is acknowledge the gap, layer in qualitative signals like "how did you hear about us?" fields, and resist the temptation to treat your attribution data as the whole truth.
- Cross-device and cross-channel journeys create identity gaps
A single prospect might research your product on their phone at lunch, visit your website from a work laptop, and attend a webinar from a tablet at home because that’s unfortunately how humans are. Now, each device creates a separate session, and unless your tracking can stitch those sessions together, your attribution model sees three different people instead of one. Privacy regulations and browser restrictions on third-party cookies are making this harder, not easier.
- Privacy and consent regulations keep raising the bar
GDPR, CCPA, and the ongoing deprecation of third-party cookies all limit what data you can collect and how you can track users across properties. These are necessary protections, but they create real constraints for attribution. Building attribution systems that work within these constraints is both an ethical and practical requirement. Every year, the gap between what happened and what you can measure grows a little wider. That's just the reality you're working with.
How Factors.ai enables full-funnel attribution
Most of the challenges we've just walked through boil down to ONE core issue: connecting the dots across fragmented data, anonymous visitors, and disconnected tools.
This is where Factors.ai comes in. *cue superhero music*
Factors.ai helps B2B teams identify anonymous website visitors at the account level. Instead of seeing a generic session from an unknown visitor, you see that someone from a specific target account visited your pricing page. That's a fundamentally different data point, and it changes what your attribution model can actually capture.
Factors.ai maps journeys across accounts rather than individual cookies. It connects marketing signals (ad impressions, content engagement, webinar attendance) with sales signals (CRM activity, pipeline movement, deal outcomes) into a unified account timeline. Your attribution model can see the full picture, from the first anonymous visit through to closed revenue.
Here's what Factors.ai helps you with:
Account-level attribution ties marketing touchpoints to accounts (not just individual leads), which aligns with how B2B buying actually works. Our intent signal capture identifies buying signals before a formal conversion event happens, so you can see when an account is researching your category even if nobody's filled out a form yet. Ad exposure tracking connects ad impressions to downstream pipeline, so you can measure the real impact of upper-funnel campaigns that don't generate direct clicks. CRM pipeline integration pulls deal data directly into the attribution model, so you're reporting on revenue influence rather than just lead volume.
And a typical workflow looks like this:
An anonymous visitor lands on your site and gets matched to a target account. Over the next few weeks, that account engages with multiple campaigns. Those engagements get stitched into a single account timeline. When a deal is created in the CRM, Factors maps all prior touchpoints to that opportunity and distributes credit according to your chosen model. The result is a clear view of which campaigns and channels actually influenced pipeline and revenue.
Note: Factors.ai doesn't replace strategic thinking with a dashboard., you will still have to do that with the brain assigned to you at birth. It gives your team the ✨data foundation ✨ to make attribution conversations productive rather than what can I say… political.
How do you implement full-funnel attribution in your B2B GTM?
Before we start, implementing full-funnel attribution is not something you will do on a lazy Wednesday afternoon while sipping your oat flat white. It’s a project that involves data infrastructure, cross-team alignment, and some difficult decisions about what to measure and how. But it doesn’t need to be overwhelming if you break it down into clear steps, and that’s why… the following:
Step 1: Map the customer journey across all channels
Before you can attribute anything to anything, you need to know what you’re attributing. (I know you’re wondering whether I’ve lost the plot… but stay with me). List every channel and touchpoint a prospect might interact with during their buying journey. Paid ads, organic search, email campaigns, SDR outreach sequences, webinars, in-person events, product-led experiences, and anything else your team runs. Most organizations are genuinely surprised by how many touchpoints exist once they map them out. As you map these touchpoints, consider how you will launch campaigns at different funnel stages: upper-funnel campaigns to build brand awareness and lower-funnel campaigns to drive conversions.
Your attribution model can only be as complete as your touchpoint map, please do not rush this step.
Step 2: Define your funnel stages with both marketing and sales
You need shared, explicit definitions for each stage of your funnel. An example framework might look like this: Awareness (account has been exposed to your brand), Engagement (account has actively interacted with your content), MQL (a contact meets your marketing qualification criteria), SQL (sales has accepted and qualified the lead), Opportunity (a deal is created in the CRM), Closed won (the deal is signed). If marketing thinks an MQL means ‘downloaded a whitepaper’ and sales thinks it means ‘expressed buying intent on a call,’ your attribution data will be meaningless because you’re measuring different things.
Step 3: Connect your data sources
You need your core systems to send data to a single place. At minimum, that means connecting your CRM, your ad platforms, your website analytics, and your marketing automation tool. Each integration needs to pass through identity resolution to match touchpoints to the correct accounts and contacts. Tools like Factors are specifically designed to make this step more manageable, but regardless of which tooling you choose, expect this step to be the most time-consuming part of the process.
Step 4: Choose your attribution model
Based on your data maturity and the questions you need to answer, select the model that makes sense for where your organization is right now. For most B2B teams with a meaningful sales process, a W-shaped or full path model is a strong starting point. I’ll tell you this, you don’t need to pick the perfect model on day one, but start with something defensible and refine it as you gather more data.
Step 5: Build reporting dashboards that actually get used
Attribution data only matters if people look at it. Build dashboards that answer the questions your stakeholders care about. Marketing leadership wants to know which campaigns influenced pipeline and revenue; sales leadership wants to know which marketing activities generated their best opportunities; finance wants ROI by programme.
Keeping all this in mind, track pipeline attribution by channel, revenue influence by campaign, and stage conversion rates across the funnel. When analyzing lower-funnel tactics, be sure to include persuasive offers like free trials, which can be highly effective in encouraging conversions at the decision and purchase stage.
Point to remember: The fanciest attribution model in the world is worthless if it sits in a spreadsheet nobody opens.
Key metrics to track across the funnel (because no metrics = no clear progress = no job = no oat flat white :( )
Once your attribution system is running, you need to know what to measure at each stage. The metrics that matter shift as prospects move from awareness to conversion, and tracking the right ones at each stage gives you a meaningful picture of overall funnel health. Recent industry estimates place average sales funnel conversion rates in the low single digits (around 3% for many businesses), while optimized funnels can exceed 9% depending on industry and funnel design.
- Upper-funnel metrics tell you whether your awareness programmes are working. You’re looking at:
a. Reach (how many accounts are seeing your content)
b. Impressions (how often your brand appears in front of target accounts)
c. Engaged accounts (how many target accounts have interacted with your content in a meaningful way).
At this point, you need to know that these numbers won’t directly correlate with the pipeline in the short term; they’re leading indicators of future demand, which means you need to track them consistently over time, not just in the week after a campaign launches.
- Mid-funnel metrics tell you whether your nurture and education efforts are moving accounts toward buying intent.
You’re looking at:
a. Content engagement rates
b. Webinar attendance
c. Email click-through rates
d. Return visit frequency
If these metrics are healthy, your pipeline will follow. If they’re declining, your bottom-of-funnel numbers will eventually dry up too, even if they look a-ok today.
- Lower-funnel metrics tell you whether your conversion engine is working.
You’re looking at:
a. Demo requests
b. Pipeline created
c. Opportunities generated
d. Revenue influenced
e. Customer lifetime value
f. Repeat purchases
Tracking customer lifetime value and repeat purchases helps evaluate long-term success, customer retention, and overall profitability. The key insight is that lower-funnel metrics are the output of everything that happened above them. When you see a dip in demo requests, the root cause often lives in the upper or mid-funnel (not in the demo page itself). Full-funnel attribution gives you the framework to trace back and find where the problem actually lives.
The future of attribution: AI, intent data, and dark funnel signals
Attribution doesn’t stand still (just like my -year-old nephew). The models and methods we use today will look noticeably different within the next few years, driven by three major shifts that are already underway, and I’ve listed them here:
- AI-driven attribution models are moving beyond simple rule-based logic.
Instead of manually assigning weights to touchpoints, machine learning models can analyse thousands of buyer journeys to identify which combinations of interactions are most predictive of conversion.
This tells you which touchpoints touched the deal (get it?), AND tells you which touchpoint sequences actually influenced the outcome. As these models get better and as B2B data volumes grow, algorithmic attribution will become the default for more ‘mature’ teams.
- Account-based attribution is replacing contact-based attribution as the B2B standard.
Traditional attribution tracks individual contacts through a funnel, but B2B buying happens at the account level, with multiple people from the same company engaging across different channels, as I’ve said 47 times above.
Account-based attribution aggregates all of these interactions into a single account journey, which much more accurately reflects how decisions actually get made. Platforms like Factors (yes, I know, shameless plugin), are already built around this principle, and the broader market is following.
- Intent data and predictive signals are expanding what attribution can see.
Instead of waiting for a prospect to visit your site or fill out a form, intent data captures research behaviour happening across the broader web.
You can see when a target account is actively searching for topics related to your solution, even before they've engaged with your brand directly. Layering these signals into your attribution model gives you a more complete picture of the buying journey, including the parts that happen outside your own properties.
And then there's the dark funnel, the growing body of buyer activity that's inherently untrackable. Community conversations, peer recommendations, private social discussions, and offline word-of-mouth all influence buying decisions in ways that no attribution model can fully capture. The smartest teams are learning to complement their quantitative attribution data with qualitative signals. "How did you hear about us?" surveys, win/loss interviews, and sales call notes all provide context that fills in the gaps.
The future of attribution is about combining multiple signal types: quantitative touchpoint data, account-level intent signals, AI-driven pattern recognition, and qualitative buyer feedback, into a composite picture that's directionally accurate and strategically useful. Perfect precision isn't the goal, but better decisions are (just like real life).
Before you go, I just want to tell you… this is what I think of whenever anyone says dark funnel…

In a nutshell
Full-funnel attribution gives B2B marketing and sales teams the ability to see how their entire go-to-market motion contributes to pipeline and revenue, not just the final click or the first impression. The full path model offers a structured, defensible way to distribute credit across the four key milestones of the buyer journey: first touch, lead creation, opportunity creation, and deal close, with the remaining credit spread across mid-journey interactions.
The biggest practical takeaway from this guide is that attribution is not just a measurement exercise you do to pass time (because who in the world will look at attribution to kill time?!). It's a ‘budget protection mechanism’ in some sense… without cross-funnel visibility, upper-funnel programmes will always look unproductive in reports, which leads to budget cuts that starve the very programmes feeding your pipeline. Full-funnel attribution breaks that cycle by connecting early-stage awareness work to downstream revenue outcomes.
If you're starting from scratch, map your customer journey, define your funnel stages with input from both marketing and sales, connect your data sources, and start with a full path model. You obviously don't need perfect data on day one… but you DO need a framework that's directionally correct and a team that's committed to refining it over time. Tools like Factors can accelerate the process by handling account identification, journey mapping, and CRM integration in a single platform.
The companies that get attribution right make better investment decisions, align their teams around shared goals, and consistently outperform competitors who are still arguing about which channel ‘sourced’ the deal.
At the end of it… I just hope we don’t feel what this little kid feels, while doing our jobs
Frequently asked questions about full-funnel attribution
Q1. What is full-funnel attribution?
Full-funnel attribution is a marketing measurement approach that assigns credit to every interaction across the buyer journey, from first awareness touchpoint through to closed deal. Unlike single-touch models that credit only the first or last interaction, it recognises that multiple touchpoints at multiple funnel stages all contribute to a conversion. This gives B2B teams a more complete and accurate picture of which marketing activities actually influence pipeline and revenue.
Q2. How does the full path attribution model calculate credit?
Full path attribution assigns roughly 22.5% credit to each of four key milestones: first interaction, lead creation, opportunity creation, and last interaction (deal close). The remaining 10% gets distributed across all other touchpoints that occurred between those milestones. This structure ensures that every stage of the journey receives meaningful credit while still weighting the most important transitions more heavily. Some organisations adjust these percentages based on their own data and sales cycle dynamics.
Q3. What is full funnel marketing?
Full funnel marketing is a strategy that targets every stage of the buyer journey, from initial awareness through consideration and evaluation to final purchase decision. Instead of optimising for a single stage, it coordinates activities across ToFu (awareness content, brand campaigns), MoFu (webinars, nurture sequences, comparison content), and BoFu (demos, sales calls, proposals). The goal is to create a connected experience that moves buyers through each phase deliberately and measurably, rather than treating each stage as a separate programme.
Q4. What's the difference between upper funnel and lower funnel marketing?
Upper-funnel marketing focuses on awareness, education, and audience expansion. It's designed to reach buyers who don't yet know they have a problem or haven't started evaluating solutions. Lower-funnel marketing focuses on conversions, product evaluation, and purchase decisions. The key tension is that traditional attribution models overvalue lower-funnel actions because they're easily measurable, which causes teams to underinvest in upper-funnel programmes that actually generate future pipeline.
Q5. Why does full-funnel attribution matter more in B2B than in other contexts?
B2B buying cycles are longer, involve multiple stakeholders, and span many more touchpoints than typical consumer purchases. A single enterprise deal might involve a buying committee of ten people engaging with different channels over six to nine months. In that context, any attribution model that only credits one or two touchpoints will actively mislead your budget decisions. Full-funnel attribution is designed specifically to handle this complexity.
Q6. What's the hardest part of implementing full-funnel attribution?
Most teams say data fragmentation is the biggest hurdle. Your touchpoint data lives in ad platforms, your CRM, your marketing automation tool, and your website analytics, and each system has its own identity logic. Stitching these into a unified buyer journey requires either dedicated tooling or real engineering investment. Identity resolution across devices and channels adds another layer of complexity. Starting with a clear data audit before you pick an attribution model will save you a lot of pain down the road.
Q7. What's the difference between full path attribution and W-shaped attribution?
Both models weight key funnel milestones more heavily than mid-journey touches. The main difference is that W-shaped attribution gives equal weight to first touch, lead creation, and opportunity creation (30% each), while distributing 10% across everything else. Full path attribution adds a fourth milestone, deal closed, and assigns 22.5% to each of the four stages. This makes full path a better fit for teams that want to track the complete journey from first interaction to revenue, not just from first touch to opportunity.
Q8. Can you use full-funnel attribution alongside account-based marketing?
Yes, and they're actually stronger together. Account-based marketing (ABM) focuses your efforts on a defined set of high-value accounts. Full-funnel attribution tells you which marketing activities are actually influencing those accounts throughout the buying journey. When you combine the two, you can see which ABM tactics are working at each funnel stage, for each account, and allocate budget accordingly. Platforms like Factors are specifically designed to support this combination by tracking attribution at the account level rather than the individual contact level.
AI in Advertising for B2B: Strategy, Tools & ROI Guide
See how AI in advertising drives B2B revenue. Targeting, attribution, ABM, predictive optimization, and real-world AI marketing examples.
TL;DR
- AI in advertising helps B2B teams move from lead generation to revenue orchestration by connecting ad data, CRM stages, website behavior, and third-party intent signals at the account level.
- Modern AI-driven digital marketing improves targeting precision through behavioral segmentation, real-time audience updates, and intent-based activation rather than static demographic lists.
- The biggest impact of AI in B2B marketing shows up in pipeline progression, including faster deal velocity, stronger MQL-to-SQL conversion, and clearer multi-touch revenue attribution.
- AI works best when integrated across systems, syncing ad platforms, CRM, analytics, and sales workflows to enable predictive budget allocation and next-best-action recommendations.
- When treated as revenue infrastructure instead of a campaign feature, AI in advertising becomes a strategic advantage that improves efficiency, forecasting accuracy, and executive confidence.
If you work in B2B marketing today, you’ve been through it all… budgets feeling tighter than the jeans you wore in college, CFOs wanting revenue to pour in, sales wanting better accounts, and founders want pipeline faster than you want your pizza.
And somewhere in every meeting, someone says, “Can we use AI for this?”
Now, the problem is that most conversations about AI in advertising float at the surface; they talk about tools, or creative automation, or Chatgipity (ChatGPT) writing ads.

Unfortunately, the world is spinning too damn fast, and the AI revolution is really getting the better of us… AND the above use-cases are not where the real shift is happening.
In fact, the real shift is structural… AI is changing how we target, orchestrate, measure, and activate revenue across the entire buyer journey.
This ✨practical✨ guide breaks it down clearly, practically, and from a B2B lens.
What is AI in advertising?
When most people hear AI in advertising, they picture one of three things.
- ChatGPT writing ad copy
- An algorithm automatically adjusting bids
- Or some mysterious black box deciding who sees what
All of that is part of it, but none of that explains it properly.
Here’s the simple definition of AI in advertising:
AI in advertising is the use of machine learning and predictive models to analyze data, identify patterns, and make optimization decisions that improve targeting, personalization, and revenue outcomes.
Now let’s break that down in plain English.
Automation vs Machine Learning vs Predictive AI
This distinction matters more than people think.
Automation follows rules:
If someone downloads a whitepaper, send them an email.
If cost per click exceeds X, pause the ad.
The system does what you told it to do.
Machine learning looks at historical data and finds patterns you did not manually define.
For example, it may detect that cybersecurity buyers from mid-market companies convert faster when they engage with comparison pages before booking a demo.
You did not hard-code that rule. The model learned it.
Predictive AI goes one step further, it forecasts what is likely to happen next.
- Which accounts are most likely to convert this quarter?
- Which deals are at risk of stalling?
- Which audiences are most likely to respond to a specific message?
That predictive layer is where modern AI in marketing and advertising is heading.
So, where does AI fit inside marketing?
Advertising is not a standalone function in B2B; it’s a part of a larger (revenue) system.
AI can sit inside:
- Audience targeting
- Creative optimization
- Bid management
- Attribution modeling
- Revenue forecasting
- Account scoring
But its real impact shows up when those systems talk to each other… if your ad platform optimizes for clicks but your CRM tracks revenue, and those systems never connect, you are optimizing for the wrong outcome.
AI becomes powerful when:
Ad data + CRM data + website data + product data + third-party intent signals are unified.
Now the model understands the entire buyer journey, not just a single channel.
Why does this matter in B2B?
In B2C, the journey is often short… you see it, you buy it (after sending your partner a picture, and them saying “do you really need this?”), but in B2B, it is layered because then… your CMO, CFO, CS team, Sales, and a 14 more people will ask “do you really need this?”
That’s not it… there are multiple decision-makers, six-month buying cycles, and dozens of touchpoints. (I’m tired of typing that, imagine going through it ALL).
I remember working with a US SaaS client targeting enterprise IT teams. Their Google Ads dashboard looked noice, LinkedIn Ads showed healthy-ish engagement, but the pipeline was inconsistent. When we mapped it properly, we realized that the deals closed had:
- At least three stakeholders engaging
- A competitor comparison page visit
- A webinar registration
- Follow-up ad retargeting within two weeks
No single channel caused the conversion… the journey caused it.
That is where AI in B2B marketing changes the game… it identifies cross-touchpoint patterns at the account level instead of over-crediting the last click.
Does AI replace marketers?
No, no, and no. AI can surface signals, identify patterns, and suggests optimizations.
Humans still:
- Define strategy
- Set positioning
- Control messaging
- Validate insights
- Govern data integrity
The smartest teams treat AI as augmentation, as something that reduces manual analysis, highlights opportunities, and increases decision confidence.
But it DOES NOT (yes, I’m screaming) replace strategic thinking. Don’t believe me? Here, read this blog that answers the million-dollar question: Will AI replace replace Digital Marketers?
(Also, why don’t you believe me?! That’s just sad. :(
The transition into B2B complexity
As ad budgets grow and sales cycles lengthen, the margin for error shrinks.
When a CFO asks which $200,000 in ad spend influenced $5 million in pipeline, “engagement was strong” is not an answer.
AI in advertising gives B2B marketers something better:
- Connected visibility
- Predictive prioritization
- Revenue-level measurement
And once that foundation is clear, the next question becomes more interesting: how exactly is AI reshaping the structure of B2B marketing and advertising?
How is AI changing B2B marketing and advertising?
If you zoom out over the last ten years, B2B advertising has evolved in waves.
First wave: demographic targeting
Second wave: automation and retargeting
Now we are in the ‘orchestration wave’ (Is that a thing? Well, now it is).
And that is where AI in advertising becomes très important.
1. From Demographic Targeting to Intent-Based Targeting
For years, B2B targeting meant selecting:
- Job title
- Industry
- Company size
- Geography
That worked when competition was lighter, and budgets were looser.
Today, if you are a US-based SaaS company targeting mid-market CFOs, you are competing with ten other vendors showing up in the same feed.
Demographics tell you who someone is, and intent tells you what they are doing right now.
AI analyzes:
- Website engagement patterns
- Content consumption depth
- Repeat visits
- Third-party research spikes
- CRM lifecycle stage
- Ad engagement across stakeholders
Now, instead of targeting all CFOs in fintech, you can prioritize fintech CFOs whose accounts:
- Visited pricing twice
- Researched competitor alternatives
- Showed a 3rd-party intent spike in the last 14 days
This is the backbone of modern AI-targeted marketing.
And it dramatically reduces wasted impressions.
2. From channel-level optimization to journey-level orchestration
Most B2B teams still optimize in silos.
The Google Ads team improves CPA, the LinkedIn team improves CTR, and the content team tracks downloads.
Each dashboard looks a-ok in isolation, but AI changes the frame. It asks:
What combination of touchpoints actually drives account progression?
Instead of optimizing a single campaign, AI models analyze cross-channel sequences.
For example:
- Account sees LinkedIn thought leadership ad
- Visits blog
- Downloads gated guide
- Engages with retargeting ad
- Books demo
AI detects that this sequence converts 2.3x higher than random exposure.
Now optimization shifts from individual ad performance to journey orchestration.
This is where AI-driven digital marketing becomes strategic infrastructure rather than a feature.
3. From lead-based measurement to account-level revenue tracking
Lead-based measurement made sense when marketing owned top-of-funnel and sales owned the rest. Yeah… unfortunately, that world no longer exists.
In B2B:
- Multiple stakeholders engage
- Sales and marketing overlap
- Revenue accountability spans both team
AI aggregates signals at the account level.
Instead of tracking one email address, it tracks engagement across:
- Multiple users
- Multiple sessions
- Multiple channels
- Multiple timeframes
This shift is SO important in AI B2B marketing, because it allows marketers to answer questions like:
- Which accounts are heating up?
- Which campaigns influence opportunity creation?
- Which channels accelerate deal velocity?
And all this in measurable terms.
4. Moving to predictive next-best action
Traditional reporting tells you what happened last month.
AI tells you what is likely to happen next.
Predictive models can identify:
- Accounts with rising engagement velocity
- Deals showing early-stage stalling signals
- Campaign fatigue patterns
- Budget inefficiencies
Imagine logging into your dashboard and seeing:
These 27 accounts show multi-stakeholder engagement and strong intent signals, driving spend and alerting sales. That is predictive orchestration.
This is where AI in marketing and advertising becomes proactive rather than descriptive.
5. From fragmented data to unified revenue intelligence
One of the biggest structural shifts is data unification.
In many B2B teams, data lives in:
- CRM
- Ad platforms
- Website analytics
- Product analytics
- Third-party intent tools
Without AI stitching it together, teams rely on manual exports and spreadsheet patchwork.
Once unified, AI can:
- Detect patterns across systems
- Surface hidden correlations
- Align targeting with revenue outcomes
- Forecast pipeline impact
And suddenly marketing conversations change.
Instead of discussing impressions and form fills, teams discuss:
- Pipeline velocity
- Opportunity influence
- Revenue attribution clarity
That shift changes how marketing is perceived at the executive level.
AI is redefining how B2B marketing connects activity to revenue, and now that we understand the structural change, let’s get tactical.
What are some core use-cases of AI in advertising (with B2B examples)
If you’re running B2B campaigns right now, firstly, God bless you, and secondly… these are the areas where AI in advertising is actively driving impact.
So let’s break this into the four areas where AI in advertising actually changes outcomes for B2B teams:
- Targeting
- Creative
- Budget and bidding
- Attribution and analytics
Each one works alone… but together, they become ‘orchestration’ (I told you… it’s a thing now).
A. AI-targeted marketing
If you strip everything down, targeting is where money is won or wasted. In B2B, broad targeting is expensive. Especially in US markets, where LinkedIn CPCs can cross $15 to $25 for competitive segments. AI improves targeting in four practical ways.
- Behavioral targeting
Instead of building audiences only by job title or industry, AI builds segments based on behavior patterns.
For example:
- Accounts that visited pricing more than twice
- Companies where multiple stakeholders engaged within 30 days
- Users who consumed competitor comparison content
Behavior is a stronger buying signal than static attributes; this is the foundation of effective AI-targeted marketing.
- Account-based ad activation
In account-based strategies, timing is everything… imagine you are targeting 500 enterprise accounts. AI monitors intent signals from:
- Website activity
- CRM lifecycle stage
- 3rd-party intent platforms like Bombora
- Ad engagement trends
If an account suddenly shows an intent spike in your category and three people from that company visit your product pages in one week, AI can automatically:
- Increase bid aggressiveness
- Trigger LinkedIn Sponsored Content
- Activate retargeting sequences
- Alert sales
That shift from manual activation to signal-based activation reduces response lag dramatically.
- Lookalike modeling using intent signals
Traditional lookalikes copy demographic traits, but AI-driven lookalikes replicate high-performing account patterns.
For example, instead of saying, find more companies with 500 to 1000 employees in fintech. The model says, find companies that behave like the accounts that reached the opportunity stage within 45 days. That is a stronger signal set.
- Dynamic audience updates
Static audience lists decay fast in B2B.
AI updates audiences in real time:
- Moves accounts from cold to warm when engagement increases
- Removes converted customers from acquisition campaigns
- Suppresses low-fit accounts
This reduces waste and improves efficiency across the board.
B. Creative optimization
Most people assume AI in ads means copy generation. That is the shallow layer. The deeper value is performance modeling.
- A/B testing at scale
Humans can test five variations at once.
AI can evaluate hundreds of micro-variations across:
- Headlines
- CTAs
- Industry-specific messaging
- Social proof angles
The model identifies which creative patterns perform best for specific verticals or deal sizes.
- Predictive creative scoring
AI analyzes historical campaign performance and predicts which messaging themes are likely to resonate with:
- CFOs versus CMOs
- Enterprise versus mid-market
- Healthcare versus fintech
Instead of testing randomly, teams test strategically.
- AI-generated variations with guardrails
Creative teams define tone, positioning, and compliance constraints. AI produces variations within those boundaries.
This accelerates production without sacrificing brand integrity, and in highly regulated industries like fintech or healthcare, guardrails make a huge difference.
C. Bid and budget optimization
Ad spend in B2B is almost always in thousands of dollars, and AI improves financial efficiency in these three key ways.
- Smart bidding
Machine learning models adjust bids based on conversion likelihood rather than just click probability, ensuring high-intent accounts receive stronger exposure.
- Budget allocation based on pipeline impact
Instead of optimizing for cost per lead, AI optimizes for:
- Opportunity creation
- Pipeline velocity
- Revenue influence
I worked with a SaaS company that shifted 25% of its LinkedIn budget toward accounts showing faster deal progression. Within one quarter, opportunity-to-close velocity improved noticeably.
That decision came from an AI modeling pipeline progression data, not gut instinct.
- Channel performance forecasting
AI can project the expected pipeline impact by channel based on historical data, allowing marketers to justify budget shifts with predictive confidence.
When a CFO asks why LinkedIn deserves more budget next quarter, data-backed forecasts change the conversation.
D. Attribution and analytics
This is where AI delivers executive-level clarity.
- Multi-touch attribution
AI distributes credit across touchpoints such as:
- Awareness ads
- Retargeting
- Content downloads
- Demo reminders
This provides a more realistic picture of influence.
- View-through attribution
In many B2B scenarios, stakeholders see ads without clicking. They return later through direct or branded search. AI connects impression data to downstream pipeline events. And without this layer, awareness campaigns look ineffective on paper.
- Revenue influence modeling
This is the layer boards care about.
AI models connect ad exposure and engagement patterns to:
- MQL to SQL progression
- Opportunity creation
- Closed-won revenue
For example, a SaaS company may discover that accounts exposed to a specific industry-focused campaign progress to SQL 1.8x faster.
That insight changes budget allocation immediately.
Let’s look at some AI marketing examples across the funnel
One mistake I see often is treating AI as a top-of-funnel tool. In B2B, that leaves revenue on the table.
The real power of AI in advertising shows up when it operates across the full buyer journey. Awareness to closed-won. Here is what that actually looks like in practice.
TOFU: Awareness
At the top of the funnel, AI improves precision and reduces wasted spend.
- Predictive audience targeting on LinkedIn and Google
Instead of targeting every VP of Marketing in SaaS, AI narrows to those whose accounts show rising category intent signals, recent site visits, or engagement with competitor content. - AI-driven content recommendations
Landing pages adapt dynamically based on visitor industry, company size, or prior engagement. A healthcare prospect sees healthcare proof. A fintech visitor sees fintech use cases. - Lookalike modeling based on high-velocity accounts
AI builds new prospect lists from accounts that progressed to opportunity within a defined time frame, rather than generic customer traits.
These are practical AI marketing examples that improve awareness efficiency without increasing budget.
MOFU: Consideration
This is where many B2B funnels leak. AI helps close the gap between interest and serious evaluation.
- Dynamic retargeting sequences
If an account downloads a pricing guide but does not book a demo, AI triggers tailored retargeting messaging focused on ROI, case studies, or security documentation. - AI-scored accounts for mid-funnel prioritization
Accounts are scored based on multi-stakeholder engagement and depth of interaction. Ad spend is concentrated where evaluation behavior is strong. - Industry-personalized messaging
Creative changes automatically based on firmographic data. Enterprise healthcare messaging differs from mid-market SaaS messaging without manual campaign rebuilds.
These are real AI in marketing examples that push qualified accounts deeper into the funnel.
BOFU: Conversion
At the bottom of the funnel, AI shifts from engagement optimization to revenue acceleration.
- Predictive deal scoring
AI analyzes engagement trends across stakeholders to forecast which opportunities are most likely to close this quarter. Marketing can increase exposure around high-probability accounts. - CRM-stage-based ad activation
When a deal enters the proposal stage, ad messaging shifts to social proof, security validation, and executive testimonials. - Budget intensification for high-intent accounts
Instead of evenly distributing spend, AI concentrates the budget on accounts showing strong purchase signals, improving close velocity.
This is where AI-powered digital marketing moves from generating leads to influencing revenue timing.
Tools powering AI in marketing and advertising
When people talk about AI in advertising, they often think about one tool, but AI really operates across a stack. And, understanding that stack is important because most limitations in B2B marketing do not come from a lack of AI. They come from fragmentation.
Let’s break this down into the four main categories powering modern AI in marketing and advertising.
1. Native AI inside ad platforms
Most major ad platforms already use machine learning.
Google Ads uses predictive bidding models to optimize for conversions and revenue. LinkedIn uses AI for audience expansion, delivery optimization, and engagement prediction.
These tools are strong at optimizing within their own ecosystems.
However, they are limited to the data available inside that platform. Google optimizes Google. LinkedIn optimizes LinkedIn. Neither sees your full CRM journey unless you integrate it properly.
For many teams, this is where AI adoption begins (not ends).
2. AI content and creative tools
This category includes tools that:
- Generate ad copy variations
- Suggest headline improvements
- Analyze creative performance patterns
- Produce visual assets at scale
These tools accelerate production and testing. They reduce bottlenecks for lean marketing teams. However, creative AI alone does not solve targeting precision or attribution clarity. It improves efficiency, not orchestration. In B2B, where messaging nuance and compliance matter, human oversight remains critical.
3. AI analytics and attribution platforms
These tools focus on measurement.
They handle:
- Multi-touch attribution modeling
- Channel contribution analysis
- Revenue influence reporting
- Funnel progression tracking
This layer is crucial because it connects advertising activity to pipeline. Without attribution intelligence, budget decisions rely on surface metrics. However, analytics platforms often describe performance rather than activate change. They tell you what happened. They do not always execute the next step.
4. ABM and orchestration platforms
This is where AI becomes strategic.
Orchestration platforms unify:
- 1st-party CRM and website data
- 2nd-party ecosystem data
- 3rd-party intent signals
- Ad platform engagement
- Sales workflows
Instead of optimizing one campaign, these systems optimize account journeys.
They can dynamically:
- Update audiences
- Trigger account-based campaigns
- Sync CRM stage changes with ad messaging
- Alert sales teams
- Allocate budget based on pipeline signals
This is where AI-powered digital marketing shifts from channel optimization to revenue orchestration.
Are your AI tools talking to each other (or are they like the Mean Girls)?
Most B2B teams use at least five to seven tools across advertising, CRM, analytics, and intent. Now, each tool uses AI in isolation.
The challenge is whether those systems communicate with each other… if Google optimizes for conversions, but your CRM defines success differently, you create misalignment.
If attribution data never feeds back into targeting logic, learning loops break.
True maturity in using AI for B2B marketing happens when:
Insights inform targeting ▶️ Targeting informs spend ▶️ Spend informs revenue ▶️
Revenue informs optimization
That loop requires lots of integration.
Benefits (and ROI) of AI in advertising
AI sounds exciting, but unfortunately, CFOs are not impressed by exciting… they care about all the boring but important stuff… efficiency, predictability, and revenue impact.
But the good news is… when implemented correctly, AI in advertising delivers value in ways that are measurable and financially meaningful.
Let’s break this down in terms that executives understand.
1. Higher targeting precision
AI reduces wasted spend by prioritizing high-intent accounts over broad demographic segments.
Instead of showing ads to every VP in SaaS, campaigns focus on accounts that show real buying signals such as pricing page revisits, stakeholder engagement, or third-party intent spikes.
The result is:
- Lower impression waste
- Stronger engagement quality
- Better pipeline fit
Precision matters more in competitive US B2B markets where CPCs are high and budgets are closely scrutinized.
2. Lower customer acquisition cost
When targeting improves and the budget is allocated to accounts with higher conversion rates, cost efficiency naturally improves.
This does not always mean cheaper clicks. It often means better downstream conversion rates.
AI optimizes for accounts that progress to SQL and opportunity rather than just generating top-of-funnel leads.
Over time, this improves the effectiveness of CAC because spend aligns more closely with revenue outcomes.
3. Faster pipeline velocity
One of the most overlooked benefits of AI-powered digital marketing is acceleration. When AI identifies high-engagement accounts and increases exposure during active buying windows, deals move faster.
For example:
- Increasing ad intensity during the proposal stage
- Triggering industry-specific case studies during evaluation
- Alerting sales when competitor research spikes
Small timing improvements can reduce sales cycle length, which directly impacts quarterly revenue predictability.
4. Improved attribution clarity
Many B2B teams struggle to justify ad budgets because attribution remains unclear.
AI-driven multi-touch models connect:
- Ad exposure
- Website engagement
- CRM stage movement
- Closed-won revenue
When marketing can demonstrate which campaigns influenced $2 million in pipeline rather than reporting on lead volume alone, executive confidence increases.
Attribution clarity changes budget conversations.
5. Better MQL to SQL progression
AI surfaces behavioral signals that indicate qualification strength.
Instead of treating all MQLs equally, marketing and sales can prioritize accounts showing deeper engagement and multi-stakeholder activity.
This improves:
- SQL conversion rates
- Opportunity creation
- Sales productivity
It also reduces friction between marketing and sales teams.
6. Reduced manual campaign management
Behind the scenes, AI eliminates a surprising amount of manual work.
No more:
- Constant CSV exports
- Manual audience rebuilding
- Static suppression lists
- Spreadsheet stitching
Real-time audience updates and automated orchestration reduce operational drag.
That time savings compounds across teams.
The compounding effect
Individually, these benefits look incremental, but together, they create compounding gains:
- Better targeting improves pipeline quality
- Improved pipeline quality strengthens forecasting
- Stronger forecasting increases executive trust
- Increased trust stabilizes budget allocation
That loop is where AI in B2B marketing becomes a strategic advantage rather than a tactical upgrade.
Challenges and risks of AI-powered digital marketing
AI is powerful, but it is not self-correcting. In B2B environments, where budgets are high and sales cycles are long, poor implementation can create expensive blind spots. If you are investing in AI in advertising, you need to understand the risks as clearly as the benefits.
1. Data quality dependency
AI models are only as strong as the data feeding them. In many B2B organizations, CRM fields are incomplete, lifecycle stages are inconsistent, and attribution tracking is fragmented. If your foundational data is messy, AI will amplify it. Before layering advanced AI-driven digital marketing systems, teams must ensure CRM hygiene, consistent lifecycle definitions, and clean event tracking.
2. Over-automation without any real strategy
Automation can create a false sense of sophistication. It is easy to activate smart bidding, audience expansion, and automated targeting without aligning those systems to revenue goals. When optimization focuses on surface metrics such as clicks or leads instead of pipeline progression, efficiency improves while revenue impact stagnates. AI must be guided by strategic objectives, not left to optimize blindly.
3. Black-box algorithms and limited transparency
Many ad platforms operate as closed ecosystems. Marketers often cannot see exactly why certain targeting or bidding decisions are made. This lack of transparency can create challenges in executive reporting and compliance-heavy industries such as fintech, healthcare, and cybersecurity. Governance and performance validation become critical.
4. Privacy and compliance risks
With increasing regulations across the United States and globally, including state-level privacy laws, improper data usage can create legal and reputational exposure. AI systems that layer first-party, second-party, and third-party data must operate within strict compliance boundaries. Data governance policies need to evolve alongside AI adoption.
5. Creative hallucination and brand risk
AI-generated creative can accelerate production, but it can also introduce inaccuracies or messaging misalignment. In B2B, where positioning and credibility matter deeply, unsupervised AI copy can damage trust. Human oversight, brand guidelines, and approval workflows remain essential.
6. Misaligned success metrics
One of the most common risks of using AI in B2B marketing adoption is optimizing for the wrong outcome. If marketing success is defined as lead volume while finance measures revenue efficiency, AI systems will amplify the misalignment. Clear definitions of pipeline influence, opportunity progression, and revenue attribution must be established before scaling automation.
So, how does Factors.ai use AI to power B2B advertising?
To understand how AI in advertising works in practice, it helps to examine how orchestration occurs within a unified system.
Factors.ai was built around one core B2B reality: revenue happens at the account level, not the lead level. Advertising, website engagement, CRM stages, product signals, and third-party intent data all contribute to that journey. When these signals live in isolation, marketing teams rely on manual exports and disconnected dashboards. When they are unified, AI can act on them.
- Unified first-, second-, and third-party data ingestion
Factors.ai ingests first-party data, including CRM lifecycle stages, website behavior, and campaign engagement. It also integrates second-party ecosystem signals and third-party intent data sources, including platforms like Bombora.
This unified data model allows AI to evaluate accounts holistically rather than based on a single channel interaction.
For example, an account that revisits pricing pages, shows rising third-party research intent, and has multiple stakeholders engaging can be identified as high-priority automatically.
- Account-level journey visibility
One of the layers inside Factors.ai is journey tracking. Instead of reporting on isolated clicks or form fills, it visualizes engagement chronologically at the account level.
Marketing teams can see how:
- LinkedIn ads influenced website visits
- Organic engagement supported paid campaigns
- Multiple stakeholders interacted over time
- CRM stages progressed after specific campaign exposure
This visibility helps answer executive-level questions about influence and progression.
- LinkedIn ads attribution: Paid and organic
In B2B, LinkedIn often plays a major role across awareness, retargeting, and thought leadership. Factors.ai connects LinkedIn’s paid campaigns and organic engagement signals to account journeys.
This means marketing teams can evaluate:
- How sponsored content influenced the downstream pipeline
- Whether organic posts contributed to account engagement
- Which audiences progressed from engagement to opportunity
Attribution moves beyond last-click logic and connects LinkedIn exposure to revenue influence.
- AI-driven audience updates and lifecycle sync
Because Factors.ai integrates with CRM systems, audiences are updated dynamically as lifecycle stages change, for example:
- If an account progresses from MQL to SQL, messaging can shift.
- If a deal enters the opportunity stage, ad sequencing can adapt.
- If an account becomes a customer, acquisition campaigns are suppressed automatically.
This is practical AI-targeted marketing, grounded in real-time account behavior rather than static list management.
- Next-best-Action recommendations
AI models inside Factors.ai analyze engagement velocity, multi-stakeholder depth, and intent signals to surface recommended actions.
For example:
- Increase spend on accounts showing rising engagement intensity
- Trigger ABM campaigns when competitor research spikes
- Alert sales when multiple stakeholders return within a defined window
Instead of manually monitoring dashboards, teams receive signal-based prioritization.
- Ad activation synced with revenue stages
One of the most powerful aspects of orchestration is stage-based activation.
Campaign logic can align with CRM progression. Awareness messaging at early stages shifts toward proof points and validation as accounts move deeper into evaluation.
This reduces generic messaging and strengthens contextual relevance across long B2B sales cycles.
The outcome: Less manual glue work, more pipeline clarity
At its core, Factors.ai applies AI-powered digital marketing principles to unify targeting, attribution, and activation within a single revenue framework.
The outcome is not simply better click performance.
It is:
- Account-level visibility across touchpoints
- Revenue-connected attribution
- Dynamic audience management
- Sales and marketing alignment through shared signals
- Reduced manual operational work
In B2B environments where buying cycles are complex and budgets are scrutinized, that level of orchestration creates clarity.
And clarity is what turns AI from a buzzword into a measurable advantage.
The future of AI in advertising for B2B
The future of AI in B2B advertising is not about more tools; it is about connected systems.
- Budget allocation will become predictive rather than reactive, with AI forecasting where the pipeline is likely to emerge before performance drops.
- Account-based marketing will become dynamic, expanding and contracting target lists in real time based on engagement velocity and third-party intent signals.
- Real-time activation will shorten response windows when buying signals spike, giving faster-moving teams a competitive edge in crowded US markets.
- Most importantly, AI will operate as a revenue co-pilot across CRM, ads, and sales workflows, surfacing next-best actions while humans retain strategic control.
The shift is from isolated campaign optimization to unified revenue orchestration, and the teams that build for that system-level intelligence will outperform those that layer AI as a feature.
Final thoughts: AI in advertising is a revenue decision (not something you do because ‘everyone’s doing it’)
If you’ve made it this far, one thing should be clear.
AI in advertising is not about writing better ad copy or automating bids… but it IS 100% about building a system that connects engagement to revenue in a way that is measurable and defensible.
As we saw above, complexity in the B2B space is unavoidable, and without connected intelligence, marketing activity fragments across tools and dashboards. But when implemented thoughtfully, AI in advertising becomes the connective tissue… identifying high-intent accounts, prioritizing timing, aligning targeting with CRM stages, linking campaigns to opportunity progression, strengthening forecasting, and reducing operational friction.
You stop optimizing for surface metrics… and start optimizing for revenue.
For B2B teams to thrive in competitive markets… amid rising acquisition costs and executive scrutiny, AI feels like strategic infrastructure they absolutely must invest in.
The real question is this tho: Is your AI connected to revenue? Because isolated intelligence can improve efficiency, but connected intelligence improves growth, and in B2B, growth is what keeps the lights on.
FAQs for AI in Advertising for B2B
Q1. What is AI in advertising?
AI in advertising refers to the use of machine learning and predictive algorithms to improve how ads are targeted, optimized, personalized, and measured. In B2B marketing, AI analyzes signals from CRM systems, website activity, ad platforms, and third-party intent data to prioritize high-value accounts and connect advertising performance directly to pipeline and revenue outcomes.
Q2. How is AI used in B2B marketing?
AI in B2B marketing is used to score accounts, detect buying intent, optimize ad targeting, automate budget allocation, personalize messaging, and improve attribution modeling. Unlike B2C, B2B marketing involves longer sales cycles and multiple stakeholders, so AI evaluates engagement at the account level rather than focusing only on individual leads.
Q3. What are real examples of AI in marketing?
Common AI marketing examples in B2B include predictive deal scoring, dynamic retargeting based on website behavior, smart bidding tied to revenue outcomes, multi-touch attribution modeling, and account-based campaign activation triggered by third-party intent spikes. These examples of AI in marketing help reduce wasted spend and improve pipeline velocity.
Q4. How does AI improve ad targeting?
AI improves ad targeting by analyzing behavioral data instead of relying solely on demographics. It identifies accounts that show high-intent signals such as pricing page revisits, competitor research activity, or multi-stakeholder engagement. AI then dynamically updates audiences in real time, allowing marketers to focus budget on accounts most likely to convert.
Q5. What is the difference between AI marketing and marketing automation?
Marketing automation follows predefined rules, such as sending an email after a form fill. AI marketing uses predictive modeling and machine learning to identify patterns and forecast future behavior. In AI-driven digital marketing, systems continuously learn from data and adapt targeting, bidding, and personalization strategies based on performance trends.
Q6. How does AI help with marketing attribution?
AI improves marketing attribution by using multi-touch models that distribute credit across multiple interactions rather than overvaluing the last click. In B2B environments, AI connects ad exposure, website engagement, CRM progression, and closed-won revenue to show how campaigns influence pipeline and deal velocity.
Q7. Is AI-driven digital marketing suitable for small B2B companies?
Yes. AI-driven digital marketing can benefit small and mid-sized B2B companies by reducing wasted ad spend and improving targeting precision. Even with limited budgets, AI can prioritize high-intent accounts, automate audience updates, and provide clearer attribution insights, making marketing investments more efficient.
Q8. What are the risks of using AI in advertising?
Risks of using AI in advertising include poor data quality, over-automation without strategic oversight, black-box algorithm limitations, privacy compliance concerns, and inaccurate AI-generated creative. To mitigate these risks, B2B teams should ensure strong CRM hygiene, governance frameworks, and human validation of AI outputs.
Q9. How does AI support account-based marketing?
AI supports account-based marketing by continuously analyzing engagement and intent signals to prioritize target accounts dynamically. It can trigger account-specific ad campaigns, update audience lists in real time, and align advertising activity with CRM lifecycle stages. This makes AI B2B marketing more responsive and less dependent on static account lists.
Q10. How can AI in advertising improve revenue outcomes?
AI in advertising improves revenue outcomes by connecting targeting, personalization, and attribution directly to pipeline progression. It helps marketers allocate budget toward high-converting accounts, accelerate deal velocity, improve MQL to SQL conversion rates, and provide clearer revenue attribution. When integrated properly, AI becomes a revenue orchestration system rather than just a campaign optimization tool

Using LinkedIn Sales Navigator & Factors.ai to build predictable revenue
Learn how to combine LinkedIn Sales Navigator’s professional data with Factors.ai’s account intelligence to identify buying committees and engage high-intent accounts at the perfect time.
Being in sales often feels like trying to start meaningful conversations in a crowded room where everyone is already talking. You know your buyers are out there and that your product can help. But figuring out who actually matters, who is involved in the decision, and when to reach out is harder than it should be.
Most reps end up working long account lists with limited context. They connect with one or two people, while decisions are shaped by entire buying committees behind the scenes. Outreach happens, follow-ups happen, and deals still stall because timing and visibility go missing.
This is the gap LinkedIn Sales Navigator is designed to solve. It helps sales teams work in the buyer’s world rather than guessing from the outside.
What does LinkedIn Sales Navigator actually do?
Sales Navigator is built specifically for selling (not for general networking).
It uses LinkedIn’s first-party, real-time professional data to help sellers understand who matters inside an account and how to reach them. Because this data is updated continuously by professionals themselves, it reflects what is actually happening in the market right now.
At a practical level, Sales Navigator helps sellers:
- Identify the full buying committee, including hidden influencers who do not always hold obvious titles (but will heavily influence the buying decision, for example, the marketing team that will actually use your reporting tool)
- Find the right people using advanced filters, lead recommendations, and persona-based searches
- See relationship paths through TeamLink so outreach can start warm
- Prepare for conversations using account and lead-level context, such as role changes, priorities, and activity
With access to over 1.2 billion professionals, 69 million companies, and 130 million decision-makers, it gives sales teams reach and relevance, all at the same time.
Unstuck your GTM team with LinkedIn Sales Navigator and Factors.ai
Sales Navigator is extremely strong at helping sellers find people and build relationships. But teams still struggle with prioritisation and timing.
Unfortunately, buyers don’t research in one place. They move between LinkedIn, your website, ads, content, review platforms, and events. A sales rep may know who to contact, but still not know whether an account is actively evaluating solutions or just browsing.
This leads to very real day-to-day problems:
- Outreach that feels well-written but poorly timed
- Time spent on accounts that are not actually in market
- Missed opportunities where intent was present but not visible to sales
- Difficulty proving whether (and how) Sales Navigator activity influenced pipeline or revenue
With a broader view of account behaviour, good outreach can get better than the best.
How does connecting Sales Navigator with account-level intelligence make a difference?
Connecting Sales Navigator with account-level intelligence changes how teams prioritise and engage.
Factors.ai uses predictive account scoring to help teams focus on the right companies at the right time. By combining third-party intent signals, it surfaces accounts actively researching and showing real buying intent.
Each identified account is enriched with firmographic and technographic data, relevant buyer personas, and a clear view of where that company sits in its buying journey. Instead of working through broad lists and hoping for traction, sales teams can concentrate on a focused set of high-intent accounts that are already demonstrating meaningful activity.
At that point, Sales Navigator becomes far more powerful. Sellers are not simply reaching out to names on a list. They are engaging decision-makers inside accounts that are already exploring solutions. Outreach feels timely because it aligns with actual behaviour, and conversations begin with context that reflects what the buyer is already looking into.
Here’s what it looks like when sales and GTM teams are aligned
Out of the box, Factors.ai connects account intelligence directly with Sales Navigator. The same account list is then activated across the broader GTM motion, including:
- Email and calling workflows
- CRM updates and GTM automation
- ABM campaigns across LinkedIn Ads, Google Ads, Microsoft Ads, and display inventory
This means sales outreach absolutely doesn’t happen as an isolated event. When a rep reaches out on Sales Navigator, the account is also seeing coordinated ads, emails, and brand messaging. Familiarity builds before conversations start, and reinforcement continues after.
For sellers, it makes outreach warmer and more effective, and for buyers, it feels consistent.
Why does this matter for sales teams and GTM teams?
For sellers, this setup removes a lot of friction from daily work:
- Clear visibility into which accounts deserve attention
- Better timing for outreach based on real buying signals
- Less guesswork and fewer dead-end conversations
For GTM teams or revenue leaders, it brings something teams often fall short of: proof.
Sales Navigator activity can now be connected to pipeline and revenue outcomes through attribution. Teams can see which accounts converted faster after Sales Navigator engagement, how outreach performs when combined with ads, and where effort is actually paying off. This closes the loop between intent, outreach, and impact.
Why buy LinkedIn Sales Navigator via Factors.ai?
The Sales Navigator product itself remains exactly the same, with the same LinkedIn pricing. What changes is how quickly teams can extract value from it.
Buying Sales Navigator via Factors.ai brings teams the best of both worlds. Here’s why we say this:
- Additional onboarding and enablement
- Ongoing support for sales and GTM teams
- A discounted Factors.ai plan with GTM setup
- Full configuration of account intelligence, GTM agents, and ABM workflows
This helps teams move beyond adoption and into consistent execution.
In a nutshell
Sales Navigator helps sellers find the right people and build real relationships. Intent intelligence helps teams understand which accounts matter right now. Activation and attribution ensure that effort turns into measurable revenue outcomes.
Together, they create a closed-loop revenue engine that feels practical, coordinated, and grounded in how modern buyers actually behave.

Why we built Scout
Stop wasting hours piecing together siloed CRM, web, and ad data. Discover why we built Scout to help sales and marketing teams act on live pipeline signals instantly.
TL;DR
- Revenue teams lack the ability to act on it quickly enough.
- Every simple question turns into a multi-tab exercise across CRM, ads, analytics, and spreadsheets, which delays decisions.
- The real problem is not visibility. It is the time and effort required to connect signals and trust the answer.
- That delay quietly kills opportunities since signals show up early, but action comes late.
- Improving dashboards or adding features doesn’t really solve this; the gap between insight and execution still remains.
- Scout closes that gap by starting with your existing data and turning questions into answers, outputs, and actions in one system.
- Watch answers what is happening, Studio turns it into something shareable, and Patrol ensures it happens automatically next time.
- The goal is simple: reduce the distance between signal and action so teams stop researching and start moving.
At Factors, we spend an embarrassing amount of time talking to sales and marketing teams. And after enough of those conversations, a pattern becomes impossible to ignore.
Every revenue team, regardless of size or stack, is stuck in the same loop. Someone needs to understand what's happening. They pull it together from five different places, explain it to someone else, and then try to act on it before the moment passes. Three steps. Sounds simple. Except today, each of those steps lives in a different tool, a different tab, and often a different team entirely. By the time the loop completes, the window has already moved.
In simpler words, this is the problem: The gap between having information and doing something with it and how much of a team's actual working week disappears into that gap.
The frustration shows up everywhere. Someone asks which accounts to prioritize, and a thirty-second question becomes a thirty-minute project: open the CRM, check the ad dashboard, pull the website analytics, find the spreadsheet someone shared on Slack two weeks ago, piece it together, and arrive at something that feels reasonable but never quite feels complete. The answer existed all along. Getting to it was the job.
The real cost of fragmented data is the delay in action
When data lives in five different places, every question becomes a small, dreadful project. Marketing sees engagement across campaigns. Sales sees deal progression and conversations. RevOps sees reporting and attribution. Leadership sees pipeline numbers. Each view is useful (and incomplete) on its own, which means that every time someone needs to make a decision, the entire synthesis process has to happen from scratch, like we saw in the section above.
Pull the data, cross-check it, add context manually, and then try to arrive at something everyone can agree on. Even then, there is usually a layer of doubt about whether you got it right.
That delay has a compounding cost that is easy to underestimate. Signals exist across your systems all the time. We’re referring to signals like accounts coming in-market, customers showing early signs of churn or upgrade intent, stakeholders engaging with content, or activity suddenly spiking across channels. However, by the time someone notices and acts on them, the window has often already shifted (and shut down for the day). In all of this, the problem is that signals were not surfaced at the exact moment they mattered.
The issue was never what the data said or the lack of it. It was how much work it took to hear it clearly enough to act on it with confidence.
Ask three people why a deal moved forward, and you'll hear three different explanations. All of them are partly right; none of them is completely there. Over time, this ambiguity leads teams to rely more on their intuition than on their data, as assembling the evidence in a clear manner is too costly (and that’s not a good look).
So, what’s the solution? Better features were clearly not on that list
For a while, our instinct was to solve this by building better individual capabilities: stronger intent signals, cleaner dashboards, more sophisticated attribution models. Each improvement helped in isolation, but none solved the core problem. We were making individual steps faster without touching the gaps between them, which is a bit like optimizing every traffic light on a road while ignoring the five roundabouts in the middle.
The real revolution (okay, not really) came when we started asking, "Why does every answer still feel like SO much work?" Because, when you think about it, the data was there. The tools were there. And yet, the distance between a signal firing and someone actually doing something about it remained stubbornly AND frustratingly wide.
Now, that gap puts a glaring light on a handoff problem, and no amount of better features can fix it. You can only fix it by removing the handoff entirely.
And that's what we built Scout to do.
Scout was built on a simple premise: The system should already understand your pipeline before you ask it anything
And for that, the system can’t be trained on generic intelligence about how businesses work. It’s grounded in what your business specifically looks like: your CRM history and deal movement, your website behavior and engagement patterns, your campaign performance across channels, and your intent signals tied to real accounts.
All of that data already exists in your stack. It just doesn’t come together easily.
But Scout brings it together into a single system that works the way teams already think.
We built it as three connected modes, each designed for a different moment in your working day, and all three sharing the same underlying data layer so that every answer, report, and automated action is based off exactly the same intelligence.
- Watch surfaces the signal.
- Studio turns it into something you can share.
- Patrol automates what happens next, every time that same signal fires again.
What was once a recurring, mundane manual process becomes something that simply runs… without anyone having to remember to check, without anyone being the last to know.
And there’s one more thing that mattered deeply to us: Built-in context
If Scout felt like another tool to configure and maintain, it would add to the problem instead of solving it. So we built it on top of the existing Factors data layer, which means there is no separate implementation, additional data to connect, or new workflow to learn.
The system already has the context it needs from the data that is already being collected. You don’t schedule time to use Scout; you reach for it when you need clarity, and it is already there.
We kept seeing capable teams spend a disproportionate amount of time answering questions for which they already had the data. Signals often went unnoticed due to their dispersion across various systems. We kept seeing decisions delayed because no one fully trusted the story behind the numbers. Scout is an attempt to fix that by reducing the distance between data, understanding, and action.
So, yes, there’s a version of this workflow where answering a question doesn’t feel like a yet another task, where alignment doesn’t require multiple iterations, and where acting on a signal doesn’t depend on anyone happening to notice at the right moment. That’s what we are building toward, and Scout is the first full expression of it.
Scout is launching soon. If you’re already on Factors, it’ll already have all the context about your data.
Read more about it here.
Frequently Asked Questions for why we built Scout
Q1. What problem is Scout actually solving?
It solves the delay between knowing something and doing something about it. Teams already have the data, but connecting it fast enough to act is where time gets lost.
Q2. Why is fragmented data such a big issue?
Because every decision requires stitching together multiple tools. That slows teams down and introduces doubt in the final answer.
Q3. Can’t better dashboards or attribution tools fix this?
They improve visibility, but they do not remove the effort needed to move from insight to action. The handoff still exists.
Q4. What makes Scout different from existing tools?
It does not start from scratch every time you ask a question. It already understands your pipeline using your CRM, website, and campaign data.
Q5. How does Scout actually work day-to-day?
You ask a question and get an answer grounded in your data. You turn that into a report if needed. You then automate the action so it runs every time the same signal appears.
Q6. What are the three parts of Scout?
Watch answers questions. Studio builds reports and views. Patrol runs actions automatically when signals appear.
Q7. Do teams need to set up anything new?
No separate setup is required if you are already using Factors. It runs on the data you already have.
Q8. What kind of signals does Scout act on?
Things like accounts showing buying intent, deals slowing down, spikes in engagement, or early churn signals.
Q9. Who is this most useful for?
Sales, marketing, and RevOps teams who spend time piecing together data before making decisions.
Q10. What changes after using Scout?
Questions stop feeling like projects. Teams spend less time researching and more time acting on what actually matters.

Introducing Scout
Say hello to Scout by Factors. Stop digging through siloed CRM and ad data. Use Scout to instantly find, visualize, and automate your first-party account data.
TL;DR
- Revenue teams are drowning in data, yet still spend hours figuring out which accounts to act on each week.
- The real gap is not access to information, it is the lack of systems that turn signals into action fast enough.
- Scout runs on your first-party data across CRM, website, ads, and intent signals, so it already understands your pipeline before you ask anything.
- It does three jobs in one system: Watch answers questions instantly from your own data; Studio builds reports and dashboards you can actually share; Patrol runs agents that act on signals automatically.
- The biggest shift is this: work starts before you ask the question, so decisions and actions happen at the same time.
- Instead of teams manually stitching together insights, Scout drafts outreach, updates CRM, triggers campaigns, and prioritizes accounts on its own.
- The goal is simple to understand but hard to achieve without this layer: less time researching, more time closing.
Here's something that should not be true in 2026: the moment you identify a high-intent account, nothing happens. The account sits in a list. Someone has to write the outreach. Someone else remembers to add them to the LinkedIn campaign. A third person (if you're lucky enough to have one) goes and enriches the CRM with funding rounds and hiring signals that are already two weeks old by the time they land. And somewhere in all of that, the window closes, and everyone goes home with a frown.
Most account intelligence tools tell you things. Scout does things. When a high-intent account hits your pipeline, Scout doesn't wait around for anyone; it drafts personalised outreach for every contact, fires them into your LinkedIn campaigns, enriches your CRM with funding rounds, hiring signals, and tech stack data, and triggers whatever workflow comes next. And the question of which accounts to focus on? Scout answers that, too. BUT answering questions was never the point. By the time you're reading the answer, the work is already underway.
Scout is built on the data your business has already been collecting: your CRM, your website activity, your ad platforms, your G2 intent signals, and it knows your pipeline before you ask it anything. That's what makes the action possible. It's not guessing which accounts matter or pulling from generic third-party signals nobody else can access. It's using your first-party data. Finally doing something more than sitting in a dashboard waiting to be interpreted by a person who has seventeen other urgent and important things to do.
Scout Watch: for when you have a question that can’t wait and needs to be answered right now
You know what this is about. Someone pings you to ask why a deal went south. Or your VP wants to know which accounts visited the pricing page this week. Or you need to figure out what your ten best-converted accounts had in common before you get on a call in twenty minutes. And then, sweat beads appear out of nowhere.
Normally, that question kicks off a process: open the CRM, check the website data, pull up the campaign dashboard, and try to remember where that spreadsheet is saved.
Scout Watch collapses all of that into a single plain-language question.
Think of Scout Watch as that colleague who has read every note your team has ever written about an important account. One knows everything Factors knows, which at this point, is quite a lot. The other knows nothing about your business.
Scout Map: for when you need to show (off) your work
Getting to an answer is one problem, but turning it into something you can actually share with your team, your manager, or a cross-functional meeting is a different one. Right now, that second step usually means rebuilding a report from scratch in a spreadsheet, or asking RevOps to pull something together, or cobbling it into a slide that is already out of date by the time it lands in an inbox.
Scout Studio is the BI capability you always wanted but never had the data team to build. Tell it what you need in plain language, and it builds a report from your actual data, formatted and ready to share.
Did we mention? It doesn’t need a data team or weeks of setup. Just ask Scout Studio to build the report you would normally have spent a Tuesday afternoon rebuilding from a template that was already two versions out of date.
Scout Patrol: for when you want it to run without you, so you can bask in the sun on a sunny Wednesday afternoon
This is where it gets genuinely useful for teams at scale.
Scout Patrol lets you deploy agents that watch your pipeline continuously, detect signals as they happen, and trigger the right action automatically, without anyone having to be the one who notices. (Did we just see you shed a tear of joy?)
There are 18 pre-built agents ready to go, covering account intelligence, sales, intent signals, attribution, retention, and ops. You can also build your own in plain language using the built-in prompt framework (no code required, obviously).
Agents deliver their output wherever your team already works, whether it’s a Slack alert, a CRM workflow trigger, a column in your segment view, a report, or the public API. You set it up once, and it runs every time the signal fires. But guess what? You stop being the person who missed it.
Watch knows. Studio shows. Patrol does.
One data layer underneath all three.
Who is Scout for, tho?
Scout is built for the people who sit at the intersection of data and action:
- AEs trying to prioritize their week without spending half of it on research
- Demand gen managers who need to prove which channels are actually moving pipeline
- RevOps leads who are tired of being the bottleneck every time someone needs a report
- CSMs who want to know which accounts are quietly shopping for alternatives before they show up in a churn number
It’s also for the teams who already use Factors. Because if that is you, Scout is not a new product to onboard, it’s already built on your data. There is nothing to connect or configure and no checklist to complete before you can use it. You open Scout Watch and ask your first question. That’s the whole onboarding.
What are the possibilities with Scout?
There is a better way for revenue teams to operate, where answers are instant, reviews run on their own, and the right signals reach the right people in time to act.
Scout is how you get there And Scout is live now.
If you are already on Factors, your data is already inside it. Open Scout Watch and ask your first question.
FAQs for Introducing Scout
Q1. What exactly is Scout?
Scout is an account intelligence system that sits on top of your existing data and turns it into answers, reports, and actions without manual effort. It combines three modes in one system so teams can move from question to execution without switching tools.
Q2. How is this different from tools that just show dashboards?
Most tools stop at showing you what happened. Scout goes further by telling you what to do next and triggering that action automatically when signals appear.
Q3. What data does Scout use?
Scout runs on your own data, including CRM activity, website behaviour, ad engagement, and intent signals. That is why the answers are grounded in your pipeline and not generic outputs.
Q4. What does Scout Watch do?
Scout Watch lets you ask plain-language questions about your pipeline and get immediate answers pulled from your actual data. It replaces the need to dig through multiple tools for every query.
Q5. What does Scout Studio do?
Scout Studio builds reports, dashboards, and attribution views in minutes. You describe what you need, and it creates something ready to share without involving a data team.
Q6. What does Scout Patrol do?
Scout Patrol runs agents that monitor your pipeline continuously and act on signals automatically. These agents can prioritise accounts, detect churn risk, trigger workflows, and surface next steps without anyone checking manually.
Q7. Do teams still need to do manual research?
Very little. Scout reduces research time from long manual workflows to near-instant outputs, so teams can spend more time on conversations and execution.
Q8. Who is this built for?
It is built for revenue teams across sales, marketing, RevOps, and customer success who need to move from data to action without delays.
Q9. Does Scout require a long setup or onboarding?
If you are already using Factors, Scout is available immediately on top of your existing data. If you are new, setup is mainly about connecting your data sources once.
Q10. What changes after adopting Scout?
The biggest change is speed and timing. Signals do not sit idle anymore, and teams stop reacting late. The system moves as soon as the data moves, which is where most pipeline wins are actually decided.

Never had more data, never been more lost
78% of B2B teams use AI, but only 19% see revenue impact. Read about why the ‘data problem’ in 2026 is a timing issue and how to bridge this gap with Scout.
78% of B2B teams have adopted AI in some form. 19% can point to a real revenue impact. Which one are you part of?
TL;DR
- Most teams have a decision timing problem; the signal exists, but it shows up too late to change anything.
- AI has mostly been used to answer questions faster, while the real bottleneck sits in what happens after the answer.
- The gap between adoption and revenue impact comes from workflows staying the same, even as tools get smarter.
- High-performing teams stop treating AI as a search layer and start using it to continuously watch, prioritize, and nudge action.
- The shift happens when signals don’t wait for humans to go looking for them; they surface on their own with clear next steps.
- When that happens, pipeline movement becomes less reactive and a lot more intentional.
Nobody woke up one day and said, “let’s build a data problem🙂”. Every tool your revenue team adopted was a reasonable decision made at a reasonable time: a CRM to track deals, an ad platform to run campaigns, a BI tool to make sense of the numbers, and an intent tool to find accounts in-market. Each one solved a real problem (or so it promised). And each one, without anyone planning for it, became another place where data lives, one nobody is fully responsible for connecting to anything else.
What happens next? Revenue teams (objectively overwhelmed by information) consistently find it challenging to address the most critical questions, such as:
- Which accounts deserve attention right now?
- Why is this deal moving slowly?
- What actually drove the pipeline last quarter? Was it the campaigns, the events, the outbound, or something else entirely?
These are not exotic analytical questions; they’re the questions that should take thirty seconds, and for most teams, they still take three hours, a Slack thread, and at least one 30-minute meeting.
This is the real shape of the data problem in B2B in 2026: a fundamental disconnect between the information being collected and the decisions it is supposed to support.
Here’s a stat that should make you a little uncomfortable
78% vs 19%
AI adoption across B2B teams vs. teams that can point to meaningful revenue impact from it.
Sit with that gap for a moment, because it tells a more specific story than it first appears to. The 78% figure means that the question of whether AI belongs in the revenue stack is essentially settled; teams have made their bets, and most of them have made the same one. The 19% figure means that the vast majority of those bets have not yet paid off in any measurable way. Note: This is not about AI failing, per se, but about how AI has been deployed.
Most B2B teams have adopted a similar model under the AI banner: you pose a question, and the tool provides an answer. Chat interfaces layered on top of CRM data, natural language queries against dashboards, and assistants that can summarize a deal or draft an email if you give them the right prompt. These are genuinely useful capabilities; they’re also, in a structural sense, the same workflow as before, just with a smarter search engine in the middle. You still have to know what to ask, interpret what comes back, and decide what to do with it.
The 59-point gap between adoption and impact is, to a significant degree, the cost of that structural limitation. Teams adopted the tools and then discovered that making them work still required the same human judgment and manual effort as before. The tools got smarter, but unfortunately, the process didn’t change.
Adding AI to a broken workflow does not fix the workflow. It just means you reach the same bottleneck faster.
The way data actually fails teams (and it is not what most people think)
The failure mode most people describe when they talk about data problems is inaccuracy: dirty CRM records, unreliable attribution, and intent signals that don't map to real buying behavior. Those problems are real and worth solving, but they’re not the primary reason that 59% of AI-equipped teams are not seeing revenue impact, because you can have perfectly clean, perfectly accurate data and still have the same problem.
The more common failure mode is timing.
Your CRM knows which deals are open; your website knows which accounts visited the pricing page three times this week; your ad platform knows which contacts engaged with the campaign’ your G2 data knows which accounts are researching your category right now. All of that is accurate and ALL of it is sitting somewhere, correct and unconnected, waiting for someone to pull it together and do something with it.
By the time that happens, by the time the SDR opens the account, by the time the marketing manager pulls the engagement report, and by the time RevOps finishes the attribution analysis, the moment has passed; the ships have sailed off the coast, probably even anchored.
Either the account that researched alternatives three days ago has moved on or someone faster has reached them. The deal that showed early churn signals two weeks ago has already started to slip. The signal was right, but the timing was wrong. And the reason the timing was wrong is that the signal had to wait for a human to go looking for it.
This is the data problem, as it actually exists for most B2B revenue teams (not a shortage of information). A systematic failure to get the right information to the right person at the moment it would change what they do.
Why didn’t the obvious fixes fix it?
- The first wave of responses to this problem involved creating more dashboards.
If the issue is that people can’t see the data, build better visualizations and give everyone access. This helped at the margins and didn’t solve the underlying issue, because the problem was access to the data in practice, not in principle. Accessing it required switching tools, knowing what to look for, and taking time that most revenue team members don’t have between the task they just finished and the next meeting. - The second wave was better integrations.
Connect the CRM to the ad platform, the ad platform to the BI tool, and the BI tool to the intent data. This was closer to the right instinct but ran into a practical reality: integrations are a RevOps project; they break; they require maintenance; and they still produce data that someone has to interpret and act on. The loop was tighter this time, but it was still a loop that required a human to close it. - The third wave (the current one) is AI assistants.
These, as discussed, are genuinely useful at the task of answering questions but leave the fundamental structure of the workflow intact. You still have to show up with a question and have to do something with the answer. The AI is a faster research assistant. But again, the problem was never the speed of the research.
Every solution to the data problem so far has made it easier to access to the information. None of them changed what happens after you arrive there.
What are the 19% doing differently?
The teams that have moved from AI adoption to AI impact are not, by and large, the ones with the cleanest data or the most sophisticated tooling. They’re the ones who changed what they expect the system to do. Instead of building AI into the workflow as a smarter tool for humans to query, they have started building it as a participant in the workflow. This participant watches the pipeline continuously, surfaces what matters before anyone asks, and, in an increasing number of cases, takes the first action rather than waiting for a human to decide.
In practice, this looks like a rep starting their morning with a ranked list of accounts that need attention today, each with a specific reason and a recommended next step, because the system identified it overnight. It also looks like a CMO walking into a pipeline review with attribution already assembled and the key questions already answered, rather than spending the first twenty minutes of the meeting pulling numbers together. It looks like a churn risk surfacing in Slack with the relevant account history and a suggested action three weeks before the renewal conversation, rather than the day before it.
The common expectation is that the system's job is to ensure the right actions occur without anyone needing to remember or recommend them.
So, what actually closes the gap?
Closing the gap between the 78% and the 19% requires being honest about what that gap actually represents. It’s not really a gap in data quality or AI capability, but a gap between what teams have built, systems that respond to questions, and what they actually need, which is systems that participate in the work without needing to be prompted.
The data your business has already collected is (in most cases) sufficient to do this. Your CRM history and deal movement, your website engagement and campaign performance, and your intent signals tied to real accounts; all of it already exists, and most of it is already accurate enough to act on. The missing piece is a system that treats the data as something to work from continuously rather than something to query occasionally.
Here’s what changes: the system continuously monitors the pipeline, surfaces signals, and connects the dots across tools; questions that currently take thirty minutes will take only thirty seconds. And the signals that currently get missed because nobody happens to check at the right moment will no longer be missed, because the system eliminates the "right moment." It is always checking. All this is possible because the work of assembling the answer happened before anyone thought of involving a real human in this whole process.
That’s not a far-fetched vision of where B2B revenue teams are going. It is a description of where the best of them already are. The gap between 78% and 19% is the distance between having adopted something and having changed something. Closing this gap is the actual work.
Scout is Factors' answer to this gap.
Built on the first-party data your business already has. Watch your pipeline before you ask anything. Closing the loop between signal and action so your team doesn't have to.
Scout for more pipeline; here’s how.
Frequently Asked Questions (FAQs) for never had more data, never being more lost
1. Why is there such a large gap (59%) between AI adoption and revenue impact?
The gap exists because most teams use AI as a smarter search tool for their existing data. You still have to know what to ask and when to ask it. If the underlying manual workflow hasn't changed, the AI can't fix the timing issues that cause deals to slip.
2. Is "dirty data" the main reason B2B marketing fails?
While data accuracy matters, the blog argues that latency (timing) is the bigger killer. Even with perfect data, if it takes three hours and a meeting to realize an account is ready to buy, you’ve likely already lost the lead to a faster competitor.
3. What is the difference between an AI Assistant and an AI Participant?
An Assistant waits for a human to prompt it with a question (e.g., "Summarize this account"). A Participant (like Scout) monitors the data in the background and proactively alerts the team (e.g., "This account just viewed the pricing page and G2, act now").
4. How does Scout specifically solve the "timing" problem?
Scout connects your first-party data sources, CRM, website behavior, and intent signals—and monitors them 24/7. It identifies high-intent patterns overnight and provides a ranked list of actions for reps every morning, eliminating the need for manual research.
5. Do I need a new data stack to use Scout?
No. Scout is designed to sit on top of the first-party data you are already collecting in your CRM, ad platforms, and website. It turns your existing data into a "live" system of action.

The Copilot Era is Over
Copilots dropped the friction of finding information but left the ‘doing’ to humans. Discover why 2026 is the year B2B revenue teams move from reactive chatbots to proactive AI agents.
TL;DR
- The Copilot era solved the problem of access to information, but it created a new bottleneck: action.
- Copilots are interrogative; they wait for a human to ask a question and then hand the manual work back to the user.
- While manageable for 10 accounts, the Copilot model breaks down at 100+ accounts, as the volume of signals outpaces the human capacity to "chat" with a tool.
- Unlike Copilots, Agents are proactive, they use your proprietary first-party data to monitor the pipeline 24/7, drafting outreach and enriching CRM records before a human even opens their laptop.
- We’re moving from a world of "AI as a research assistant" to "AI as a participant" in the revenue team.
Somewhere in your company right now, a revenue rep is doing something that would look absurd if you described it out loud: they have found a high-intent account, confirmed it fits the ICP, and established that the timing is right, and now they are switching between four tabs to write an email, manually adding the account to a LinkedIn campaign, and making a note to ask someone in RevOps to enrich the CRM record when they get a moment. The intelligence part took thirty seconds. The doing-something-about-it part will take most of the morning.
This is the gap that AI was supposed to close. And for a while, the category that emerged, copilots, assistants, and chat interfaces built on top of your data, looked like it was closing it. You could ask your pipeline a question and get a clean answer. You could surface an intent signal without writing a SQL query. It felt like ✨magic✨ (until it didn’t). The friction of getting to information dropped dramatically, and that felt like progress because, for a time, it was.
But there is a version of progress that solves one problem so visibly, it obscures the problem it leaves untouched. Copilots made it easier to know things, but they did almost nothing about what happens after you know them.
The half-solved problem that nobody wanted to name
The promise of AI in B2B has always been about reclaiming time, giving revenue teams back the hours they spend stitching together data, interpreting signals, and producing reports that are outdated before they are shared. And copilots delivered on part of that promise. Ask the right question, get the right answer, and move faster. That part worked.
What it didn’t account for is the actual work that begins after the question has been answered.
In practice, the bottleneck for most revenue teams is not only finding the answer. It is the chain of actions that the answer is supposed to trigger. A rep learns that a key stakeholder just changed roles at an open deal (a great signal and genuinely useful). But now, they have to write personalized outreach for every contact in the account, update the deal record, adjust the sequence, fire the LinkedIn campaign, and probably brief their manager before the next forecast call. The insight arrived in seconds, but the work it created will take hours.
Copilots, by design, hand the work back to you.
They were built on the assumption that a human will always be in the loop to interpret every answer and decide what to do next. That assumption made sense when the alternative was doing all the research manually, too. It makes much less sense now that we know the research can be automated, because it turns out the research was never really the hard part.
Copilots made it faster to know things, but what revenue teams actually needed was for things to happen.
What happens when you scale the Copilot model? It breaks
The copilot approach is forgiving when your pipeline is small. When you have a handful of accounts to think about, the human handoff between answer and action is annoying but manageable. A rep can take the signal, process it, and respond within a reasonable window. The gap between knowing and doing is measured in minutes.
Scale that up to fifty accounts, and the gap starts to widen. At a hundred accounts, it becomes structurally unsustainable. Because the volume of signals doesn’t grow linearly with the number of accounts, it compounds. More accounts mean more intent signals, more stakeholder changes, more website visits, more campaign interactions, and more churn risks surfacing simultaneously. A copilot that answers questions one at a time cannot keep up with a pipeline that continuously generates signals. And the signals that go unacted upon aren’t a minor inefficiency. These are the deals that go cold while your team is busy processing the signals they managed to catch.
Note: This is not a criticism of the companies that built copilots. It is a recognition that the category solved a genuine first problem (access to information) and that solving it has now made the second problem impossible to ignore. The question is whether the model of a human asking questions and then executing the answers manually is the right one for where we are now.
The shift that is already underway
The teams that have moved furthest in this direction are not waiting for someone to notice a signal and ask the right question. They’ve started building systems that continuously monitor their pipeline and act on what they see, without needing to be prompted.
Let’s take an example: a high-intent account appears in the pipeline, outreach is drafted for every contact, the LinkedIn campaign fires, the CRM record gets enriched with the latest funding round and hiring signals, and the rep gets a briefing rather than a task list. The system doesn’t wait for someone to type a lengthy prompt while it waits. Instead, it moves, and it moves before your team figures out where to start.
This way of thinking is different because it asks, ‘What is AI for?' but in a revenue context. The copilot model is interrogative; you ask it questions, and it gives you answers. What is emerging now is continuous and proactive; the system watches your pipeline the way a very attentive colleague would, surfaces what matters before you think to ask, and, in an increasing number of cases, has already started acting on it by the time you look up.
It’s important to note that the difference is not the quality of the intelligence because both systems know the same things about the account. The difference is what the intelligence does next and whose time it consumes getting to that point.
Why does first-party data change everything about this?
One of the underappreciated reasons the copilot model persists is that most AI tools are still working from third-party data: generic signals scraped from the web, intent data aggregated from browsing behavior across the whole market, and enrichment pulled from sources that every competitor also has access to. When your intelligence is the same as everyone else's, the advantages you can extract from it are limited. The value is in the speed of access and the depth of the signal.
First-party data changes the equation entirely. Your CRM history, your website behaviour, your ad engagement, your G2 intent signals tied to specific accounts that already know you; this is context that no third-party source can replicate, because it is a record of the specific relationship between your company and your accounts. An AI system that is grounded in this data is not working from the same signals as your competitors. It is working from something genuinely proprietary, and its actions are proportionally more targeted as a result.
This is why the shift from the Copilot to Agent model is an important theory of what makes AI valuable in a B2B context. Copilots are more valuable when the data is richer, but they still ultimately depend on a human to act on what they surface. Agents that are grounded in first-party data and built to act continuously are compounding advantages in a way that copilots structurally cannot.
Your first-party data is the one thing your competitors can’t copy. An agent built on it is a compounding and competitive advantage.
What does this actually look like in practice?
The teams making this transition are not ripping out their existing stack and starting over. They are changing where the work happens. Research that used to happen in a tool now happens in an agent that runs before the rep opens their laptop. Reports that used to be built manually on a Tuesday afternoon are now auto-generated from live data and ready to share before the meeting starts. Signals that used to get missed because nobody happened to check at the right moment are now surfaced automatically, with the recommended action already attached.
The practical effect is that the work itself changes shape and becomes efficient by itself. Less of it happens in response to questions. More of it happens in response to things the system has already figured out. Pipeline reviews become conversations about what to do next rather than investigations into what happened. Sales calls start with context rather than with a rep scrambling to remember where they left off. Churn risks surface before the renewal conversation, not after.
None of this requires a different kind of data. It needs a new relationship with your existing data, one in which the system constantly works with it instead of waiting for a request.
What’s next?
Copilots were not a mistake. They were the right first step for a category that needed to prove that AI could work reliably with business data before it was trusted to act on it. That proof has been made. The next question is not whether AI should be doing more of the work; most teams that have used a copilot for a year will tell you the answer is obvious. The question is what the architecture looks like when the goal is action rather than answers.
The answer emerging is a system that starts with your first-party data, continuously understands your pipeline rather than on demand, and closes the loop between signals and actions without requiring a human to serve as the bridge. Something closer to a very capable, very fast, permanently attentive member of your revenue team.
The Copilot era established that AI belongs in the revenue stack. What comes next establishes what it is actually there to do.
Scout is Factors' answer to this ✨new era✨. Built on your first-party data, it's already running before you ask for anything.
Learn more at Factors - Scout.
Frequently Asked Questions (FAQs) for the Copilot era is over: why are B2B teams shifting to AI agents
Q1. What do you mean by the ‘Copilot era’?
The Copilot era was the first phase of AI in B2B, where tools helped you ask better questions and get faster answers. They reduced the effort required to find information, but they still depended on a human to decide what to do next.
Q2. Why does the Copilot model break at scale?
Because signals grow faster than your team’s ability to process them. As your pipeline grows, so do intent signals, stakeholder changes, and engagement data. A system that waits for you to ask questions cannot keep up with a constantly changing pipeline.
Q3. What is different about the Agent model?
Agents do not wait for prompts. They continuously monitor your data, identify what matters, and take the first steps automatically, whether that is drafting outreach, updating CRM records, or triggering campaigns. The goal is to reduce the gap between signal and action.
Q4. Why does first-party data matter so much here?
Most tools rely on third-party data that everyone has access to. Your first-party data, like CRM history, website behavior, and campaign engagement, is unique to your business. Agents built on this data can act with far more precision because they understand your actual relationship with each account.
Q5. Does this approach mean humans are no longer needed in the process?
Not at all. The role of the human shifts. Instead of spending time on research and manual execution, teams start with context and focus on decisions, conversations, and closing deals. The system handles the groundwork so the team can move faster.
Q6. Do you need to replace your entire stack to adopt this?
No. The shift is not about replacing tools; it is about changing where the work happens. Instead of manually pulling data and acting on it, the system starts doing that work in the background using the data you already have.
Q7. Where does Scout fit into this?
Scout is built for this exact shift. It uses your first-party data and connects signals to actions, so your team doesn't have to start over every time something changes.

LinkedIn Ad Copy and Creative Best Practices: A guide for B2B marketers
A practical guide to writing LinkedIn ad copy that actually converts: copy frameworks, creative playbooks, format benchmarks, and templates for B2B marketers.
TL;DR
- Keep intro text under 150 characters because that’s all that shows above the fold, and going over means paying to see more clicks.
- Thought Leader Ads are the highest-performing format right now. Most B2B teams are barely using them.
- Running hard conversion CTAs to cold audiences is the fastest way to burn budget on LinkedIn. Match copy to funnel stage.
- The 95-5 rule from the LinkedIn B2B Institute should shape how you think about every campaign you run.
- Video ads without captions are invisible to 80% of your audience; and ‘sound off’ is the default.
- Great creative drives 40% higher purchase consideration in B2B. Creativity is not a nice-to-have.
You just hit publish. The targeting is… pristine, you’ve got every VP of Sales at every Series B SaaS company locked in. You lean back, wait for the pipeline, and... nothing.
Three weeks later, your CTR is hovering at a miserable 0.3%. Your CPL is high enough to make your CFO cry. The leads that did trickle in? They aren’t the buyers you wanted; they’re just people who got tricked into clicking.
I’ll die on this hill: LinkedIn is the most powerful B2B platform in existence. It’s the only place your buyers show up with their ‘work brains’ on, ready to think about the problems you solve. But the gap between a campaign that builds pipeline and one that just drains your bank account comes down to the copy.
Most B2B ads fail because they’re written for committees, not people. Here is how to fix it.
Why is LinkedIn the B2B advertiser’s best friend? (and what makes copy the deciding factor)
You know it… LinkedIn is home to over a billion members, with more than 180 million senior-level influencers and 65 million decision-makers accessible through paid targeting.
It delivers leads at roughly three times the conversion rate of other major social platforms for B2B, drives 80% of all B2B social media leads, and consistently ranks as the top channel for reaching buying committees across enterprise and mid-market accounts.
But what makes it even more powerful is the context. Someone scrolling LinkedIn at 10 am on a Wednesday is in an entirely different headspace than someone scrolling Instagram at 9 pm. The former are thinking about vendors, evaluating tools, and catching up on their industry. This context allows your ad dollar to stretch further when the message is well written. Who wants to buy a B2B SaaS product that’s revolutionary, transformative, ground-breaking, blah, blah, blah? NO ONE.
And that’s where good copy becomes the single biggest lever you have. LinkedIn targeting gets you in front of the right people, but the copy and creative are what decide whether they stop scrolling… or make this face and scroll past the ad you spent 27 hours working on:

And yes, I AM a little biased towards good copy because I come from the world of content… but you gotta have an ad that’s worth reading, right? Sooo, let’s solve for it.
The 95-5 Rule: here’s why this framework should shape every LinkedIn campaign
Before you write a single word of copy… I want you to (please) remember this: research from the LinkedIn B2B Institute is the most useful thing you can internalize: Only 5% of your market is looking to buy right now. The other 95%? They aren't in-market yet.
If every ad you run is a "Request a Demo" pitch, you’re ignoring 95% of your future revenue. Those people are forming brand memories today. Your goal is to be SO specific and SO useful that when they do enter the market, your name is the only one on the shortlist.
Note: Don't be ‘warm and fuzzy’, be insightful. Write copy for where the reader actually is in their buyer journey… not where you wish they were.
LinkedIn Ad copy best practices
- The fold is the most important 150 characters you will write
On desktop, you get 150 characters before LinkedIn hits you with the ‘see more’ button. On mobile… you’re lucky to get around 100 characters.
Clicks on ‘see more’ are paid clicks. If your value proposition is hidden below that truncation, you’re literally paying for reader curiosity instead of intent. Your hook, your value proposition, the reason someone should care… it all needs to land in those first 150 characters.
- 10/10 would not recommend: "We are a dedicated team of experts focused on empowering the next generation of enterprise leaders through our suite of..." (Zzzzz. You lost them).
- 10/10 would recommend: "Your sales team is chasing leads that marketing already knows are cold. Here is why it keeps happening and the 3-step fix."
The first one is a corporate brochure; the second one feels like a supportive(?) mirror.
Here are two more intro text examples for the same product:
| Type | Intro Text |
|---|---|
| Weak | At CompanyName, we’re dedicated to empowering enterprise teams with our comprehensive suite of solutions designed to accelerate growth and optimize... |
| Strong | Your sales team is following up on leads your marketing team already knows are cold. Here is exactly why that keeps happening and how to fix it. |
The second one is specific and true. The reader is already asking themselves whether it applies to their team. That’s exactly what the first 150 characters need to do.
- Headlines are the first thing people read (you have to make them work)
LinkedIn headlines truncate at around 70 characters with no expansion option. Whatever gets cut is gone forever. Every word needs to earn its place.
The strongest B2B headline structures:
| Pattern | Example |
|---|---|
| Benefit for a specific persona | See Which Companies Are Visiting Your Site Right Now |
| Action verb + outcome | Cut Your Cost Per Lead by Knowing Who Is Actually In-Market |
| Number + specific result | 37 B2B Teams Found 00K in Untouched Pipeline This Quarter |
| How-to + tangible outcome | How to Stop Wasting Ad Budget on the Same 10 Accounts |
| Contrarian opener | Your LinkedIn Ads Aren't Underperforming Because of Targeting |
Notice what every one of those has in common: they could only apply to one type of company, solving one type of problem… this specificity really makes a difference.
- Match copy to funnel stage (this is non-negotiable)
Running a ‘Request a Demo’ CTA to cold traffic is the paid advertising equivalent of proposing on the first date… a little embarrassing because there’s a high chance the receiver in both cases will hard pass. Cold audiences need educational, low-friction copy that gives before it asks. Mid-funnel audiences who have engaged with your content or visited your site can handle comparative messaging and case studies. Only warm, high-intent audiences should see hard conversion asks.
A simple audit: if someone has never heard of your company and they see this ad, would they click? If the honest answer is no, the copy is working against you.
- Write for one person with one problem
The most common LinkedIn copy mistake is trying to address multiple pain points, multiple personas, and multiple use cases in 150 characters. The result is copy that is hedged and doesn’t resonate with anybody.
Pick one pain, agitate it, offer a credible path out, and if you have multiple segments to reach, build multiple campaigns (not multiple paragraphs inside the same ad).
Character limits: The spec sheet every LinkedIn advertiser needs
Before copy can strive to be good, it has to fit the character limit.
Here are the limits that shape good copy:
| Ad Element | Character Limit | Practical Guidance |
|---|---|---|
| Introductory text | 600 max | Keep to 150 or under. Everything after truncates behind see more. |
| Headline | 200 max | Hard truncate at ~70 characters on display. No expansion. |
| CTA button | 20 max | Use the most direct action verb possible. |
| Carousel card headline | 45 per card | Short and punchy. Each card should stand on its own. |
| Message Ad subject | 60 recommended | Short subjects get higher open rates. |
| Message Ad body | 500 recommended | Under 400 characters earn significantly more replies. |
Copy frameworks that work for B2B LinkedIn ads
Frameworks are a lot like scaffolding… the copy still needs to be human and specific. But having a structural frame helps you avoid the trap of writing something that sounds important but says nothing.
| Framework | What does it do? | Best For | Funnel Stage |
|---|---|---|---|
| PAS | Problem, Agitation, Solution. Starts with the reader's reality. | Pain-forward categories, demand gen | ToFu / MoFu |
| BAB | Before, After, Bridge. Shows transformation. | Audiences new to the category | ToFu / MoFu |
| Stat Lead | Opens with a specific, quantified result. | Case studies, performance claims | MoFu / BoFu |
| Contrarian Hook | Challenges a widely-held assumption. | Thought leadership, brand building | ToFu |
| Question Hook | Pulls the reader into a problem frame. | Cold audiences, scroll-stoppers | ToFu |
ToFu
- PAS framework in action
Problem: Name a specific, uncomfortable truth about the reader situation. Agitation: Make the consequence feel real and costly. Solution: Introduce your offer as the specific fix.
|
LinkedIn ad example for PAS: "60% of your LinkedIn ad budget is probably hitting the same 10 overexposed accounts. Meanwhile, your actual target list barely sees your ads. Factors.ai Smart Reach fixes account-level frequency, so your impressions spread across your whole ICP, not just the accounts who happen to refresh their feed." |
- BAB framework in action
Before: Paint the painful current state. After: Describe the aspirational outcome. Bridge: Position your offer as the path between the two. This framework works well for audiences who may not know a solution to their problem even exists.
|
LinkedIn ad template for BAB: "Before: Manual reporting eats 8 hours a week and the numbers are stale before leadership sees them. After: Real-time dashboards that update automatically and take five minutes to set up. Bridge: That is what 5,000 revenue teams use today." |
- Social proof and stat lead
Opening with a specific, quantified result is one of the highest-performing patterns in B2B LinkedIn copy, particularly for consideration and conversion stages. The specificity does the majority of the heavy-lifting… to give you an example, "increased pipeline" means nothing… but "2M in influenced pipeline from one quarter of LinkedIn ABM" is a completely different sentence.
If you have strong customer results, your ads is where they belong. Add names, logos, percentage lifts, time-to-value claims. The more concrete, the more credible.
LinkedIn Ads best practices by format: Here’s a format-by-format playbook for LinkedIn Ads
Copy and creative are not separate decisions. The image or video either reinforces the copy argument or competes with it. Here is what the evidence shows for each major format.
| Format | Avg CTR | Relative CPC | Best Use Case |
|---|---|---|---|
| Thought Leader Ads | Highest | Lowest | Awareness, trust-building, retargeting seed audiences |
| Message / Conversation Ads | High open rate | Varies | Direct outreach, event invites, warm audiences |
| Single Image Ads | Moderate | Mid-range | Lead gen, content offers, product announcements |
| Document Ads | Moderate | Higher CPM | Gated content, playbooks, benchmark reports |
| Carousel Ads | Moderate | Mid-range | Storytelling, comparisons, step-by-step frameworks |
| Video Ads | Strong engagement | Mid-range | Brand awareness, retargeting, product demos |
| Text Ads | Low | Lowest | Retargeting, low-cost impression coverage |
- Single Image Ads
Single Image Ads are the most widely used format for good reason. Flexible, reliable, and effective across all funnel stages when matched to the right creative approach.
- LinkedIn recommends a 1200x1200px square (1:1) for the widest delivery across desktop and mobile. Vertical 4:5 maximizes mobile real estate but does not serve on desktop, so match your choice to where your audience primarily engages.
- Creative direction that consistently outperforms stock imagery:
- Real people over stock images. A genuine customer photo or candid team shot will outperform the generic diverse-professionals-on-a-laptop every time.
- Text overlays (if you use them) should be under 20% of the image area and high contrast so they read at small sizes.
- Colors that stand out against LinkedIn's interface. Bright, high-contrast visuals earn more attention in a predominantly blue-and-white feed.
- 4 to 5 ad variations per campaign. Run them with LinkedIn's optimize for performance rotation and plan to refresh every four to six weeks.
- Thought Leader Ads (the format most B2B teams are under-using)
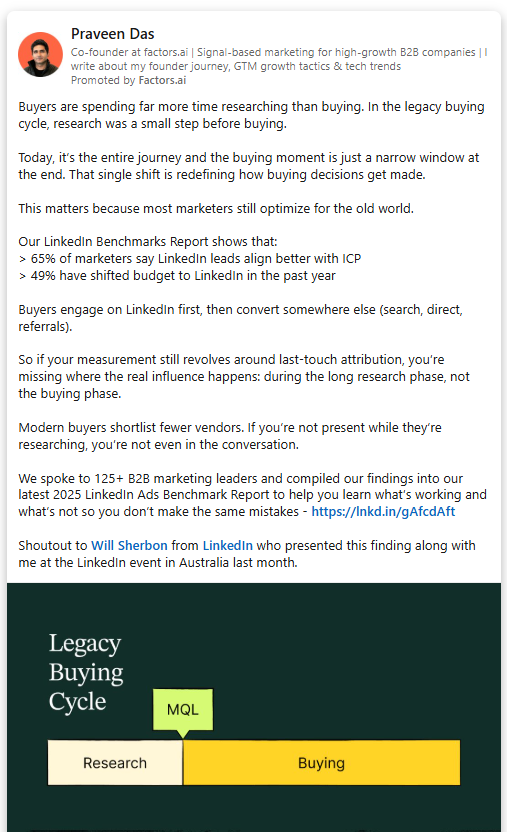
Thought Leader Ads (TLAs) are the only LinkedIn ad format that sponsors an individual organic post rather than brand content. The post runs in-feed with a Promoted by <Company> label, but the framing is personal and human (and that is exactly what makes it work).
People scroll past brand content instinctively. First-person posts from a credible individual do not look like ads. They look like content worth reading. That distinction shows up in performance.
What makes a strong Thought Leader Ad post:
- First-person voice throughout. "I" consistently outperforms "we" in this format.
- A clear narrative arc: what I observed, what it means, what you should do about it.
- 1,000 to 1,500 characters of real insights, not a verbose paragraph and a link.
- CTA in the bottom quarter (not the opening line).
The best posts to promote are ones that already generated inbound interest organically: DMs, thoughtful comments, shares from people in your ICP. If a post already did the persuasion work, amplifying it is just distribution.
TLA interactions also feed retargeting audiences. Anyone who engaged with the promoted post can be served sponsored content next, creating a natural mid-funnel step that feels like a continuation rather than a cold follow-up.
- Document Ads
Document Ads let you display a PDF natively in the LinkedIn feed: a whitepaper, checklist, template, benchmark report, or playbook… readable without clicking away. The first page functions as your cover poster and needs to communicate value immediately.
Keep documents to 5 to 10 pages for optimal in-feed performance. If you want to gate the full content, put the lead gen form after 3 to 4 preview pages, enough to justify the exchange, not so much the form becomes unnecessary.
Document Ads perform especially well for audiences actively evaluating options. Playbooks, comparison guides, and benchmark reports consistently outperform pure thought leadership at this stage because they are decision-stage useful.
- Carousel Ads
Carousel Ads are a storytelling format. Start with 3 to 5 cards. Card one stops the scroll. The deeper cards are where genuine engagement happens, readers who reach Card 4 or 5 are expressing real intent. Save your sharpest argument or CTA for there.
Use carousels to walk through a framework step by step, present a before-and-after case study, compare options with honest trade-offs, or tease the structure of a longer piece of content that the reader can then access.
- Video Ads

LinkedIn Video Ads generate strong engagement rates and earn lower CPMs than static formats. The key is matching video objectives to what video actually does well, building brand presence and keeping you top of mind, rather than asking it to carry the full conversion load.
The critical stat: 80% of LinkedIn video viewers watch with sound off. Captions are not optional. If your video depends on audio to make sense, it is not working for most of your audience. Burn captions directly into the video or upload an SRT file.
Your hook needs to land in the first three seconds. A visible brand logo in the first two seconds lifts recall. Keep cold audience videos under 30 seconds. Longer formats (one to two minutes) work for warm retargeting audiences where context already exists.
For video creative specifically, native uploads always outperform sharing external links. LinkedIn's algorithm rewards content that keeps people on the platform, and native video autoplays in-feed while a YouTube link sits as a static thumbnail waiting for a click that rarely comes.
- Message Ads and Conversation Ads
Message Ads and Conversation Ads go directly to a member's LinkedIn inbox. The key difference: Message Ads deliver a single message, while Conversation Ads offer branching CTAs that let the recipient self-select their path.
Best practices for both formats: keep the subject line under 60 characters. The message body performs best under 500 characters. Write as if it’s being sent from a real person with a specific reason for reaching out… it’s not a broadcast from a brand account. Include a banner image and always offer an opt-out option.
Conversation Ads work particularly well for event invites, webinar registrations, and warm audiences. Design 2 to 3 CTA branches that let the reader signal intent without feeling cornered.
LinkedIn ad templates you can adapt today
These are structural patterns that have been proven to work. The specifics: the stat, the company name, the pain point… need to come from you.
|
Template 1: The sharp stat open (consideration stage) [Specific result] in [time frame]. [Company] used [specific approach] to [outcome]. Not by adding headcount. By [mechanism]. Here is the breakdown. [Link or CTA] Template 2: The uncomfortable truth (top of funnel / Thought Leader Ad) Most [role]s believe [common assumption]. I spent [time/context] testing whether that is actually true. The short answer: it depends. The longer answer is more useful. [3 to 4 lines of genuine, specific insight] If you are running [relevant scenario], the thing worth knowing is: [specific actionable takeaway] Template 3: The pain point hook (cold audience, lead gen) [Specific painful situation your reader knows too well]. Most teams solve this by [wrong common approach]. Which is why [bad outcome] keeps happening. [Product or offer] gives you [specific fix]. [CTA] Template 4: The comparison (mid-funnel, retargeting) We compared [approach A] vs [approach B] across [number] of [companies or campaigns or deals]. [Finding 1] [Finding 2] [Finding 3] Full breakdown in the guide. [CTA] |
The LinkedIn Ads wall of shame: 8 LinkedIn ad copy mistakes you cannot be seen making
Most of these mistakes are avoidable once you know of them. But they keep happening because there is always pressure to launch and always a template from last quarter that is good enough. And before we move ahead, I’d like to apologize for being a little… what can I say… rude?! But I can’t have you making these mistakes in 2026, dude. Get a grip, and let’s go.
- Proposing on the first date:
Running a ‘Request a Demo’ CTA to a cold audience is… embarrassing. Give them a checklist or a guide first. Earn the right to ask for their time. - Features over outcomes:
Nobody cares that you have ‘40 integrations.’ They care that they can finally stop manually syncing CSVs on Friday afternoons. So tell them that. - The ‘Corporate Speak’ Trap:
Ew. Don’t get me started on this one. If your ad sounds like it was approved by a legal committee, it’s not going to convert Linda. Talk like a peer, not a vendor trying to shove a product in their cart, please. - Ignoring the Headline:
LinkedIn headlines cut off at 70 characters. If your punchline is character 71… it doesn't exist. - Static Creative:
Running one image for three months. Run 4-5 variations and kill the losers after two weeks.
Here’s the same thing in a table… because tables are good:
| Mistake | Why It Costs You |
|---|---|
| Pitching demos to cold audiences | LinkedIn cold audiences are not ready to buy. High friction CTAs to people who have never heard of you drive up CPL and deliver low-intent leads. |
| Burying the message below the fold | Anything after 150 characters is hidden. If your best line lives there, you are paying for see more clicks instead of real intent. |
| Writing for committees not people | "We enable enterprises to streamline their GTM operations" says nothing to nobody. One person. One pain. One sentence. |
| Features over outcomes | "40 integrations" means nothing without context. "Know which accounts are hot before your sales team calls them" is a different sentence entirely. |
| Ignoring headline character limits | Headlines truncate permanently at ~70 characters. Whatever gets cut is gone. Count before you launch. |
| Vague social proof | "Trusted by thousands of companies worldwide" earns zero trust. Named logos, specific metrics, and percentage lifts do. |
| Running one creative variation | One ad is a bet, not a test. Run 4 to 5 variations per campaign so you can learn what actually wins. |
| Not refreshing creative | Ad fatigue builds silently. A campaign running 8+ weeks to the same audience will see declining performance whether or not the dashboard shows it yet. |
What do good LinkedIn ads look like? The anatomy of a strong LinkedIn Ad
Instead of naming specific campaigns, here are the structural patterns behind LinkedIn ad examples that consistently drive results, with the reasoning behind each choice.
| Element | The Case Study Ad (MoF) | The Benchmark Ad (ToF) | The TLA (Awareness) |
|---|---|---|---|
| Intro text | "[Company] cut cost per opportunity from ,300 to under 00 by changing one thing about how they measured LinkedIn." | "We analyzed 20M in B2B LinkedIn ad spend. These are the benchmarks your team should actually be comparing against." | "Most LinkedIn campaigns optimise for clicks. Clicks are not buyers. Here is what actually changed when we measured at the account level..." |
| Why it works | Specific numbers, familiar pain, credible one-thing framing that earns curiosity. | Scale of data creates authority. Benchmark content works because it is useful and buyers self-assess. | First-person. Specific experience. A clear perspective the reader can agree or disagree with. |
| Headline | "The LinkedIn attribution problem most B2B teams have and do not know about" | "2025 LinkedIn Ads Benchmark Report, download free" | Post text carries the weight: No separate headline in TLA format. |
| Creative | Customer quote pull on clean background with company logo. No stock imagery. | Report cover with title and one arresting stat visible in-feed. | Text-only post performs extremely well because it reads as organic content. |
| CTA | Read the Case Study | Download Now | Embedded naturally in the last paragraph of the post. |
Targeting and copy alignment: matching message to audience
Writing great copy for the wrong audience is wasted spend. Writing great copy for the right audience but framed incorrectly for their role or mindset also underperforms.
- Copy by seniority
| Seniority | What They Care About | Copy Direction |
|---|---|---|
| C-suite (CEO, CMO, CRO) | Competitive advantage, strategic risk, org-level outcomes | Keep it outcome-first, one sentence on the problem, one on the strategic fix |
| Directors and senior managers | ROI, justifiable decisions, evidence they can take upward | Case studies, named results, comparative language, give them the deck-ready data point |
| Individual contributors | Day-to-day workflow, specific tools, tactical efficiency | How it changes Tuesday morning, not Q3 revenue projection |
Here, you see three campaigns with three sets of copy for the same product can lead to a meaningful difference in performance. I know this feels like A LOT of extra work… but I need you to know that this is the work and what will work.
- Copy by funnel stage
| Stage | Budget % | Copy Tone | Best CTA |
|---|---|---|---|
| Awareness (ToF) | ~60% | Educational, insight-led, no product pitch | Learn More, Read the Guide, Get the Checklist |
| Consideration (MoF) | ~30% | Comparative, credibility-building, proof-forward | See How [Company] Did It, Download the Report |
| Conversion (BoF) | ~10% | Direct, specific offer, friction matched to intent | Request a Demo, Start Free Trial, Talk to Sales |
Most B2B advertisers spend the majority on conversion. The result is high CPLs from audiences who were not ready and an awareness gap that makes the pipeline increasingly expensive to fill. The 60/30/10 allocation is a starting point; adjust based on your cycle length and how warm your existing audience is.
LinkedIn Video Ads best practices
Video has its own creative rules that do not apply to static formats. Here is the structured version.
| Element | What Works | What to Avoid |
|---|---|---|
| Length (cold audience) | Under 30 seconds. Key message in first 3 seconds. | Long-form for cold traffic. Nobody is watching 90 seconds of brand video uninvited. |
| Length (retargeting) | 60 to 120 seconds where context exists. | Starting from scratch with a warm audience: build on what they already know. |
| Captions | Always. Burn in or upload SRT. | Sound-dependent video. 80% watch on mute. |
| Format | 4:5 vertical for mobile, 16:9 for desktop-first audiences. | Horizontal video on mobile-heavy placements. |
| Opening | Human face, brand logo in first 2 seconds, hook in first 3. | Logos-only intros, slow pans, animated bumpers that eat the hook window. |
| Upload type | Native LinkedIn upload always. | Sharing YouTube links: they lose autoplay, algorithm priority, and retargeting data. |
For an awareness-stage video, the goal is staying top of mind and being associated with specific buying situations. For retargeting video you can go deeper, but only because you are building on context the viewer already has.
Creative specs quick reference
Before launching, use this as your final format check.
| Format | Recommended Size | File Type | Max File Size | Key Spec Note |
|---|---|---|---|---|
| Single Image Ad | 1200x1200px (1:1) | JPG or PNG | 5MB | Square for widest delivery. Vertical 4:5 for mobile-only. |
| Video Ad | 4:5 vertical recommended | MP4 only | 200MB | 30fps. Captions mandatory. Under 30s for cold audiences. |
| Carousel Ad | 1080x1080px per card | JPG or PNG per card | 10MB per card | 2 to 10 cards. CTA on final card. |
| Document Ad | PDF recommended | 100MB | 5 to 10 pages optimal. First page is your cover visual. | |
| Thought Leader Ad | Organic post (no image spec) | N/A | N/A | Sponsor an existing post. Text-only posts earn long dwell time. |
| Message Ad | Banner: 300x250px | JPG or PNG | 2MB | Subject under 60 chars. Body under 500 chars. |
Measuring what your copy actually does: Close that attribution gap
Writing strong copy is about 50% of the job, but knowing which copy is actually driving pipeline is the other, important half and that is where most marketers shed a few tears.
LinkedIn Campaign Manager is built around click-through and form-fill attribution. But in B2B, the buyer journey is not a straight line… and we all know that by now. A decision-maker sees your Thought Leader Ad on Tuesday, does not click it, searches your brand name on Thursday, visits your pricing page a week later, and shows up in a sales conversation three weeks after that. Standard attribution gives your LinkedIn ads zero credit for any of that.
Factors.ai, an official LinkedIn Partner for B2B Attribution and Analytics (sorry, I just had to), addresses this directly with LinkedIn AdPilot.
We connects LinkedIn ad impressions, including view-throughs, to downstream account-level behavior: website visits, intent signals, pipeline movement, and revenue. This gives you a full-funnel view of what your ad spend is actually generating, not just the last-touch slice.
Factors.ai also solves for the frequency distribution problem at the account level (not just the individual level) through its Smart Reach feature, which caps impressions per target account and redistributes budget to reach more of your actual ICP instead of overserving the same accounts repeatedly. LinkedIn Audience Builder in Factors keeps intent-based lists synced automatically to Campaign Manager so your targeting stays fresh without manual CSV uploads.
All that said and done… none of this can ever replace strong copy. But it does mean that when your copy works, you can see it AND prove it.
Wrapping up… what does strong LinkedIn ad copy actually do?
LinkedIn is the platform where B2B buying decisions get shaped. Your buyers are there, in the right mindset, at a scale no other social channel matches for professional targeting. The opportunity is real every time you launch a campaign.
What separates the campaigns that build pipeline from the ones that run quietly into the void: specificity, funnel alignment, and a creative that respects the reader's intelligence enough to be genuinely useful rather than generically persuasive.
The research from LinkedIn B2B Institute confirms that creative B2B ads drive meaningfully higher purchase consideration than functional ones. Emotional resonance and memorable framing are not vanity metrics; they are how buyers decide who makes their shortlist before they are even in market.
The pre-launch gut-check:
- Does the first 150 characters say something worth reading?
- Is the headline under 70 characters and specific enough to act on?
- Is the creative format matched to the objective?
- Is the CTA appropriate for where this audience is in their journey?
- And are there at least four variations running so you can learn what actually works?
This little checklist clears the bar most LinkedIn ads never reach. And on a platform this powerful, clearing that bar is where the pipeline starts. Ooh, what a line… and on that note, BYE.
May the LinkedIn Ads be with you, 4eva!
FAQs for LinkedIn Ad Copy and Creative Best Practices
Q1. What is the best character length for LinkedIn ad copy?
Short answer: shorter than you think.
Longer answer: LinkedIn cuts off your intro text pretty aggressively, so if your main point is buried somewhere in the middle, most people will never see it. Try to keep your opening line (or at least your core message) within 150 characters so it shows up before the “See more” button.
For headlines, stay under 70 characters. There’s no expansion option there, so anything longer just gets awkwardly chopped off.
And for CTA buttons, you’ve got about 20 characters to work with. Think simple, clear, and direct. “Download Guide” works better than trying to get clever and running out of space.
Q2. What LinkedIn ad format works best for B2B lead generation?
It depends on what part of the funnel you’re targeting, but a couple of formats consistently stand out.
If you're trying to build awareness and trust, Thought Leader Ads tend to perform really well because they feel like content, not ads. People are far more likely to engage with a person than a brand.
If you're focused on actual lead generation, then Document Ads + LinkedIn Lead Gen Forms are a very strong combo. Documents get attention and engagement, and Lead Gen Forms make it ridiculously easy for users to convert without leaving LinkedIn.
That last part matters more than you think. The less friction you create, the better your conversion rates.
Q3. How often should I refresh LinkedIn ad creative?
More often than most teams do.
A good rule of thumb is every 4 to 6 weeks for active campaigns. But here’s the catch: ad fatigue doesn’t announce itself. You won’t always see a dramatic drop, it just slowly stops working as well.
The smartest way to manage this is to run 4–5 variations per campaign instead of relying on one “hero” creative. This gives LinkedIn room to optimize and also keeps your audience from seeing the exact same thing over and over again.
Think of it less as “refreshing ads” and more as “rotating variations.”
Q4. Should I use LinkedIn Lead Gen Forms or link to a landing page?
If your goal is conversions, Lead Gen Forms usually win. By a lot.
In most B2B cases, they convert 2–5x better than landing pages. The reason is simple: LinkedIn pre-fills user data and keeps them on-platform, so there’s almost zero friction.
That said, landing pages still have a place.
Use them when:
- You need to build deeper credibility (like for high-ticket offers)
- You want to control the narrative and experience
- You need more detailed qualification fields than LinkedIn allows
A good way to think about it:
Use Lead Gen Forms for volume and efficiency, and landing pages for depth and qualification.
Q5. What’s the difference between a LinkedIn Thought Leader Ad and regular Sponsored Content?
This is one of those things that seems small but makes a huge difference.
Sponsored Content comes from your company page. It looks and feels like a brand talking.
Thought Leader Ads, on the other hand, promote a post from an individual (usually a founder, CMO, or someone with a voice). It still shows “Promoted by Company,” but the tone stays personal.
And that changes everything.
People trust people more than brands. A first-person post feels like an opinion or insight, not a sales pitch. That’s why Thought Leader Ads usually see higher engagement and better quality interactions.
Q6. How do I write LinkedIn ad copy for a cold audience?
Start by accepting this: they don’t care about your product yet.
So don’t lead with it.
Instead, lead with something they do care about:
- A problem they’re dealing with
- A sharp insight they relate to
- A situation that feels uncomfortably familiar
Once you’ve got their attention, offer something genuinely useful. A guide, a checklist, a breakdown, a real example.
And keep your CTA soft:
- “Read the Guide”
- “See How This Works”
- “Get the Checklist”
Save “Book a Demo” or “Start a Free Trial” for retargeting. Cold audiences need context before commitment.

We don’t just write about demand gen. We deliver it.
Our AI Agents help you uncover high-intent accounts, run campaigns that actually convert, and keep your GTM motion in sync.
1000+ GTM teams have already scaled their pipeline with Factors.
*Includes built-in peace of mind. And fewer late-night funnel audits.






.svg)



.avif)

