
Good Reads
Fix pipeline pains. Solve GTM puzzles. Read strategic brain dump.
Written for marketers who want real solutions to a leaking pipeline (and their dark circles).
Want to read more from us?


I’m looking for…
.avif)
The Ultimate Guide to Marketing Analytics for SaaS Companies
Discover the importance of marketing analytics for SaaS businesses, its benefits, challenges, use cases, and best practices for driving growth and success.

Marketing analytics has become an integral part of any successful marketing strategy.
The industry is expected to grow at a CAGR of 14.8% between 2023 and 2028. Meanwhile, businesses of all sizes must spend the time to upgrade their in-house tech and employee skill-set to stay ahead of the curve.
But with the industry peppering buzzwords and jargon, marketing analytics can seem more complicated than it actually is.
In this guide, we’ll work to make the complex simpler. We’ll discuss what marketing analytics is, why it is necessary, which teams and people in a company should look into it, common limitations and pitfalls, and more. Let’s get started.
What is Marketing Analytics?
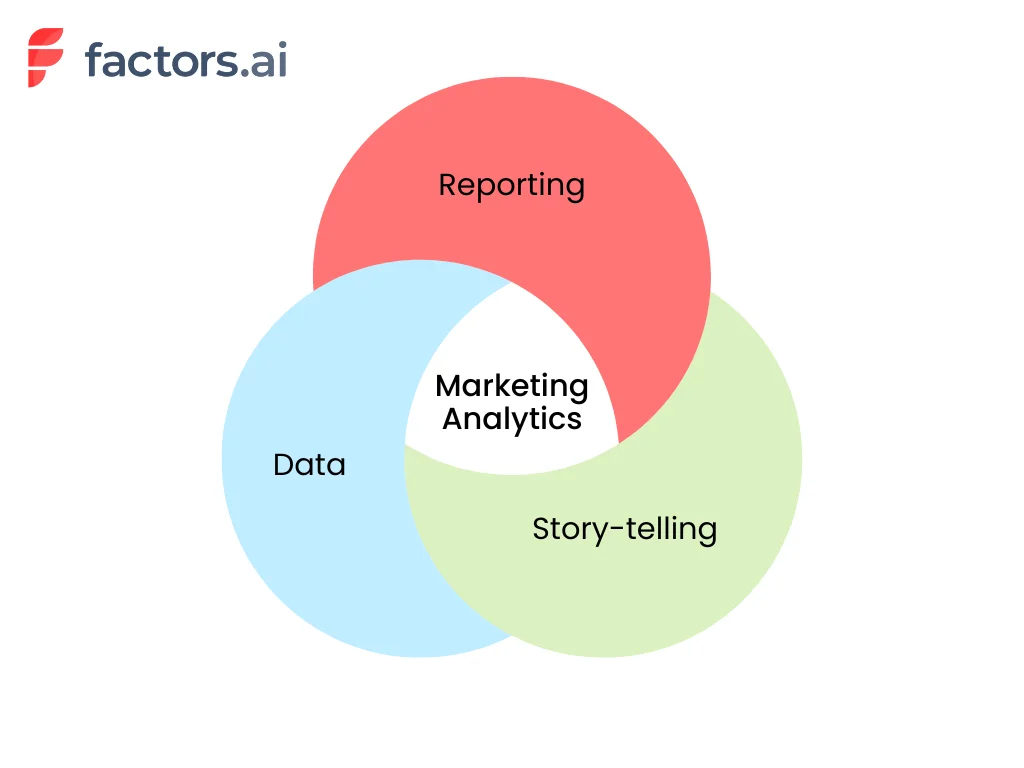
Marketing analytics refers to the analysis of data to gain insights into the performance of marketing campaigns and activities. It relies on the number of leads generated, conversion rates, customer acquisition cost (CAC), and customer lifetime value (LTV). Analyzing these metrics can help marketers and founders pave the way for marketing campaigns.
For instance, marketing analytics can help businesses understand which marketing channels or strategies are generating the most leads or conversions, and which ones may need improvement. It can also help identify trends and patterns in customer behavior, preferences, and buying habits, enabling businesses to make more informed decisions about their marketing efforts.
This is done through the use of tools like Google Analytics, Looker Studio, Factors.ai, and others for data visualization, statistical analysis, and predictive modeling.
The data is analyzed from various sources, such as website traffic, social media platforms, email campaigns, and Customer Relationship Management (CRM) systems.
The Benefits of Marketing Analytics
Marketing analytics offers multiple benefits in a B2B context. It helps businesses with interpreting data and making the most accurate and informed decisions. But that’s just one aspect of it. Let’s take a look at some other benefits of marketing analytics:
Improves Targeting
Marketing analytics enables you to identify the most relevant and receptive audience for your product or service. Then combining demographic, psychographic, and behavioral metrics, you can create a detailed customer persona that represents your ideal target audience. This data-driven approach allows you to tailor your messaging, offers, and content to resonate with these individuals, ultimately leading to higher conversion rates.
For instance, suppose your marketing analytics reveals that your most engaged customers are millennial entrepreneurs in the tech industry. In that case, you can fine-tune your marketing campaigns by focusing on the channels they frequent—such as LinkedIn and Twitter. Then begin creating content around industry trends, tips for startup growth, or case studies of successful tech entrepreneurs while subtly pitching your product or services.
Reduces Cost of Acquisition
The cost of acquiring a new customer can often exceed the expenses related to retaining an existing one. The average customer acquisition cost (CAC) including all SaaS industries is $704. Marketing analytics helps businesses identify the most cost-effective channels and methods for customer acquisition by studying metrics like cost-per-click, cost-per-lead, and return on ad spend.
.webp)
Let’s take an example here. Say your marketing analytics data shows that LinkedIn ads are generating a lower cost per acquisition (CPA) and higher conversion rate compared to Facebook ads. In this case, you can shift a larger portion of your ad budget to LinkedIn, driving down your overall cost of acquisition.
Improves the Customer Experience
86% of buyers are willing to pay more for brands that offer great customer experience. And SaaS companies doing $1 billion annually can expect to earn an additional $1 billion with just 3 years of investing in customer experience.
Analyzing customer feedback data can help SaaS marketers identify areas of improvement in their products or services. This leads to a better overall experience for customers. Marketing analytics can also help companies understand customer touchpoints, identify gaps in their communication strategies, and improve customer support.
Helps with Customer Retention
As time goes by, fewer and fewer customers stick around. This can be clearly demonstrated with the retention curve.
.webp)
However, spending money to retain existing customers is often more cost-effective than acquiring new ones.
Existing customers are 50% more likely to buy a product and spend 31% more on average than new customers. Marketing analytics can help businesses identify patterns and trends in customer behavior that may indicate potential churn or dissatisfaction.
For instance, if your marketing analytics reveals that customers who don't engage with your email campaigns are more likely to churn, you can modify your campaigns to launch a re-engagement strategy. You can target these at-risk customers with personalized content and offers to reignite their interest and loyalty. Sometimes, special pricing or preferential rates go a long way for customers.
Unveils Upselling Opportunities
Upselling is a powerful strategy in the B2B SaaS world. An average SaaS business generates 16% of its annual contract value (ACV) from upselling to customers. Companies doing $40 to $75 million annually can attribute twice as much revenue to upselling. With marketing analytics, you identify existing customers who are most likely to benefit from and be receptive to upgrading their current plans or purchasing additional products or services.
For instance, with marketing analytics data you may notice a few high-usage customers that could benefit from improved speed or better service offerings in your higher plans. Personalizing an upsell for those businesses and accounts can help you better improve your bottom lines in the long run.
What’s the Difference Between Product Analytics and Marketing Analytics?
Product analytics and marketing analytics are two important types of analytics that businesses need to use for making informed decisions. Unfortunately, these terms are used interchangeably and can cause confusion. Let’s look at the differences between product analytics and marketing analytics.

Product analytics analyzes the product experience. This type of analytics is generally performed on the data of users already using the product. It focuses on understanding how users interact with a product, including feature adoption, engagement, and product usage. With product analytics, the goal is to drive product-led growth by identifying areas for improvement, prioritizing feature development, and optimizing user experience.
Marketing analytics, on the other hand, helps identify how effective your marketing campaigns are. It helps identify how easily customers can find your product or website, what channels are working best for your marketing, and how many users are converting into paid users through the journey. Metrics for marketing analytics include lead generation, conversion rates, customer acquisition cost (CAC), and customer lifetime value (LTV).
For B2B businesses, both product and marketing analytics are important for driving growth. Product analytics helps businesses optimize product offerings and user experience. Marketing analytics helps companies improve their marketing strategies, target their audience more effectively, and allocate resources better.
{{INLINE_TOFU}}
Are Marketing Analytics and Marketing Attribution the Same Thing?
Marketing analytics and marketing attribution are complementary, yet distinct, disciplines within the realm of digital marketing. While both are essential for evaluating and optimizing marketing efforts, they serve different purposes and bring unique insights to the table. In this article, we will delve into the nuances of each concept, highlighting their primary focus, use cases, metrics, tools, and more.
Marketing Analytics vs Marketing Attribution - Quick Comparison
| Aspect | Marketing Analytics | Marketing Attribution |
|---|---|---|
| Primary Focus | Evaluating overall marketing effectiveness | Measuring the impact of touchpoints on conversions or other outcomes |
| Use Cases | Identify high-performing channels, calculating CAC & LTV, evaluating ROI, tracking customer engagement, and informing marketing strategy | Evaluating individual channel effectiveness, identifying influential touchpoints, optimizing spend, tailoring messaging, and informing marketing strategies |
| Metrics | CAC, LTV, Churn Rate, Retention Rate, ROI | Measured using models such as Single-Touch Attribution, Multi-Touch Attribution, Position-Based Attribution, Custom Attribution |
| Tools | Google Analytics, Adobe Analytics, Mixpanel, Tableau, HubSpot | Factors.ai, Adobe Marketo, Dream data, |
Marketing Analytics
Marketing analytics encompasses the measurement, management, and analysis of marketing performance data to optimize marketing effectiveness and maximize return on investment (ROI). Its primary focus is to provide a comprehensive understanding of marketing efforts, from the impact of individual campaigns to the overall health of a marketing strategy.
Use Cases:
- Identifying high-performing marketing channels
- Calculating customer acquisition cost (CAC) and customer lifetime value (LTV)
- Evaluating marketing ROI
- Tracking customer engagement and retention
- Analyzing data to inform marketing strategy and decision-making
Metrics:
Here are some of the marketing analytics metrics that you must keep a watch on.
- Customer acquisition cost (CAC): This metric helps you identify the cost of acquiring a new customer. It accounts for all the marketing and promotional costs involved in reaching and converting the customer.
- Lifetime value (LTV): Once a customer is converted, how long do they remain a paying customer? To find this value, note the length of time that each customer has stayed with your business and the total revenue generated by each. Then, multiply the average revenue per customer by the average length of time (lifespan). For example, if you have 100 customers paying, on average, $300 per month for 6 months, your customer lifetime value will be $300 x 6 = $1800.
- Churn Rate: How many of your customers are dropping off after they turn into paying customers? In fact, you can even count the churn rate for your free users as this can help you start digging deeper into the reasons why they don’t sign up for one of your paid plans.
- Retention Rate: This is the opposite of the churn rate. Here we check how many customers stick around for a specific period of time and more. For example, you may want to consider a customer as a retained one if they continue to pay for your SaaS for longer than 3 consecutive months.
- Return on investment: This metric is a must for businesses, no matter the industry. In the case of B2B SaaS businesses, this metric lets you understand how much money you are making based on the marketing spend.
Tools:
- Google Analytics: This is the most popular tool for marketing analytics—majorly because it’s free of cost. Google Analytics provides a wealth of information about traffic, user behavior, and much more.
- Factors: Factors is a powerful marketing analytics platform that specializes in B2B visitor identification, account analytics, and more. It integrates with your existing marketing stack and helps businesses reveal anonymous website visitors, decode customer journeys, and drive marketing ROI.
- Adobe Analytics: Adobe Analytics has a range of tools for tracking customer behavior, segmenting users, and identifying trends to improve overall marketing performance.
- Mixpanel: Mixpanel is more focused on product analytics. It enables businesses to monitor user interactions within web and mobile applications.
- Tableau: Tableau helps marketers transform raw marketing data into interactive visualizations that are easy to understand and share.
- HubSpot: HubSpot provides businesses with a holistic view of their performance and the tools necessary to optimize their strategies. From tracking website traffic and user behavior to measuring the effectiveness of email campaigns and social media outreach, it enables companies to make smarter marketing decisions and achieve better results.
Marketing Attribution
Marketing Attribution is the process of determining the value and impact of various touchpoints along the customer journey, helping marketers understand which channels, campaigns, and tactics are most effective in driving conversions and other desired outcomes. Attribution primarily focuses on assigning credit to specific marketing efforts that contribute to a conversion, sale, or other predefined goals.
Use Cases:
- Evaluating the effectiveness of individual marketing channels and campaigns
- Identifying the most influential touchpoints in the customer journey
- Optimizing marketing spend and resource allocation
- Informing marketing strategy and tactics based on attribution insights
- Tailoring messaging and targeting to maximize conversion potential
Attribution Models:
There are several attribution models available that help businesses assess the impact of their marketing efforts. Here is a breakdown of some of the most common types:
- Single-Touch Attribution: Assigns credit to a single touchpoint, either the first touch or the last touch. Common single-touch models include First-Touch Attribution, Last-Touch Attribution, and Last Non-Direct Touch Attribution.
- Multi-Touch Attribution: Distributes credit across multiple touchpoints throughout the customer journey. Examples of multi-touch models are Linear Attribution, U-Shaped Attribution, and Time Decay Attribution.
- Position-Based Attribution: This attribution model allocates credits based on the position of a touchpoint in the customer journey. For instance, it gives 40% of the credit to both the first and last ad interactions and corresponding keywords. The remaining 20% is spread across the other ad interactions on the user journey.
- Custom Attribution: Utilizes data and machine learning algorithms to create custom attribution models tailored to the unique needs of a specific business or industry. This approach allows for a more accurate representation of the customer journey and the impact of various marketing channels and tactics.
Tools:
- Factors: Factors is an AI-driven marketing attribution platform that provides detailed insights into the impact of each touchpoint on your customer journey. With its advanced modeling capabilities, Factors helps businesses make informed decisions on marketing spend and resource allocation.
- Adobe Marketo Measure: A part of the Adobe Marketo suite, Measure offers powerful marketing attribution and revenue planning features. By connecting marketing and sales data, Measure enables businesses to accurately attribute revenue to specific marketing efforts.
- Dreamdata: Dreamdata is a B2B revenue attribution platform that allows you to track and analyze the performance of your marketing efforts across all channels. By unifying data from various sources, Dreamdata provides a holistic view of your customer journey and helps optimize your marketing strategy.
- Ruler Analytics: Ruler Analytics is a marketing attribution platform that connects closed revenue data with the customer journey. It provides insights into which marketing channels are driving conversions, allowing businesses to optimize their efforts and improve ROI.
Who Should Be Thinking About Marketing Analytics at SaaS Companies?
Marketing analytics helps businesses measure the effectiveness of their marketing campaigns, optimize strategies, and make data-backed decisions to drive growth. But who should be thinking about marketing analytics at SaaS companies? Generally, it is CMOs, marketing executives, and CROs who stay updated with this information.
But, there's more to the story.
While it's essential for top-level executives and decision-makers to understand marketing metrics, it's not practical for everyone involved to monitor every single metric. Requiring the marketing team to constantly share their progress is counter-intuitive to progress as well. That’s where dashboards help teams stay in sync and keep tabs on what’s happening within marketing.
Dashboards offer a streamlined and efficient way to stay on top of the effectiveness of marketing strategies. They present data in a visually appealing and easy-to-understand format, allowing for quick insights and adjustments when needed. Here are a few benefits of dashboards.
- Enhanced collaboration: A well-designed dashboard helps teams across the board to stay updated with the changes in marketing. It also reduces the communication required to get data from individual teams as everyone can directly pull data from the dashboards. This increases transparency between teams.
- Increased accountability: Because of the increased transparency, teams, and individuals have accountability for the tasks assigned to them. This allows for greater productivity across teams and helps things progress faster.
- Customization: Dashboards are designed to be completely customizable. You do not need to showcase the same verbose data to everyone involved. Dashboards can help you summarize and visualize the required data based on who you want to demonstrate or showcase the data to.
If you want to implement a marketing dashboard within your company, we have an in-depth article on CMO dashboards. This will guide you through the process of designing a dashboard that serves the unique needs of your SaaS app development company.
Addressing Common Marketing Analytics Challenges
As businesses continue to evolve and adapt to the digital era, marketing analytics has become a vital aspect of marketing success. However, there are several common challenges that marketers face when trying to harness the power of data analysis.
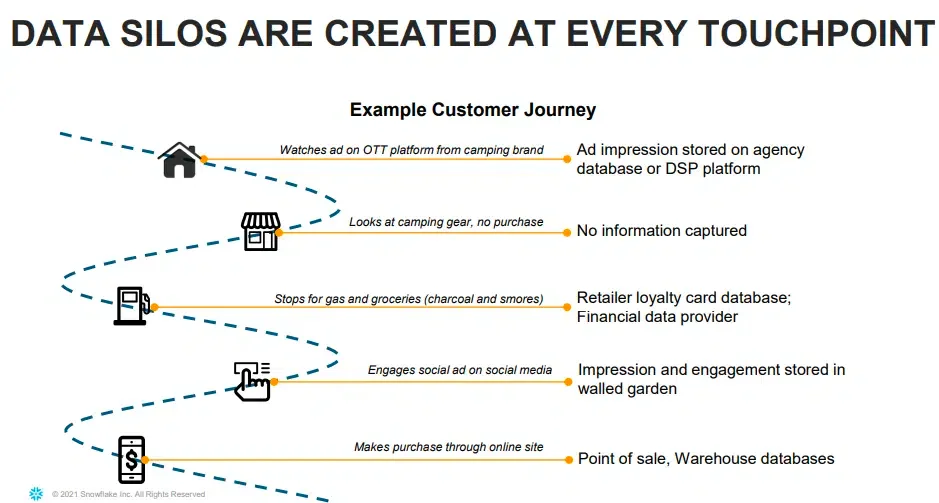
Siloed data
The importance of seamless data integration cannot be overstated. With various marketing tools and platforms being used simultaneously, data can become fragmented and difficult to consolidate. Apart from that, customer data can get siloed at each of the touchpoints as well.
This siloed data can lead to an incomplete view of your marketing efforts and hinder your ability to make data-driven decisions. Marketing attribution tools like Factors combine data from multiple platforms and create a unified timeline that helps you view all the touchpoints of your customers in a single place.
Not knowing what to track
Identifying the right metrics to track is essential for marketing success. Focusing on the wrong metrics or not tracking them at all can lead to misguided decision-making. In fact, tracking a metric incorrectly can lead to worse outcomes than not tracking it at all.
For example, if you incorrectly attribute the success of your conversions to your paid ads, you may end up spending more on the wrong channel and wasting your marketing efforts.
Incorrect understanding of metrics
Metrics should be analyzed in tandem with other data to gain meaningful insights. For example, if the cost of acquisition in one quarter is dramatically lower than that of the previous two quarters, it could be the direct result of pausing a poor-performing marketing campaign.
But only looking at the CAC may lead to incorrect conclusions—CAC is going lower and thus your profits are going up.
Lack of automation and limited visualizations
Manual data analysis can be time-consuming, and error-prone, and ultimately limit your ability to make the most of it. Automating data collection and analysis processes is essential for maximizing efficiency and accuracy. Also, visualizing data through intuitive dashboards and reports enables easier understanding for everyone involved.
Factors address these common challenges by offering a powerful marketing analytics platform featuring seamless integrations, automation, and advanced visualization capabilities. Comprehensive marketing analytics and attribution solutions like Factors help overcome these challenges and ultimately achieve better results from your marketing efforts.
Top Marketing Analytics Use Cases for SaaS Companies
Marketing analytics can provide valuable insights and drive growth in various aspects of a SaaS company’s marketing efforts. The three key use cases for marketing analytics include acquisition and conversion tracking, campaign performance analysis, and customer segmentation and personalization. Here’s what each of them means:
1. Acquisition and Conversion Tracking
Acquisition and conversion tracking allows SaaS businesses to monitor how efficiently their marketing efforts are attracting and converting customers. For example, a SaaS company offering project management software might use acquisition and conversion tracking to analyze the sources of their website traffic. This could include social media platforms, search engines, and email marketing campaigns. They can then determine which channels are most effective in driving new users to sign up for their software. If the analysis reveals that content and SEO are generating a high number of sign-ups, the company can allocate more resources to that platform to capitalize on its success.
2. Campaign Performance Analysis
Campaign performance analysis evaluates the effectiveness of marketing campaigns and helps improve the campaigns through data. This involves monitoring click-through rates, conversion rates, and cost per acquisition, to determine the overall success of each campaign.
Imagine a SaaS company specializing in human resources software launches a Google Ads campaign targeting HR managers.
Campaign performance analysis can be used here to evaluate the effectiveness of the ads. If the data indicates that one type of ad is outperforming the others, the company can optimize the campaign by allocating a higher budget to the more successful ad. This constant analysis and improvement can lead to more efficient marketing campaigns and higher ROI.
3. Customer Segmentation and Personalization
Customer segmentation and personalization involve grouping customers based on shared characteristics and tailoring marketing messages and offers to meet their specific needs.
For instance, a SaaS company that provides email marketing software could segment its customers into groups based on their industry, company size, or the frequency of their email campaigns.
They could then create content and offers targeted at each segment. A small e-commerce business might receive tips on how to maximize its email open rates during the holiday season. A large enterprise client, on the other hand, might receive a case study showcasing how their email marketing success has successfully scaled email campaigns for similar organizations.
Grow your business with streamlined marketing analytics
Marketing analytics is a powerful tool for driving growth and improving marketing performance in B2B companies. Focusing on key use cases, such as acquisition and conversion tracking, campaign performance analysis, and customer segmentation and personalization, will enable you to make data-driven decisions and optimize your marketing efforts.
As a result, you'll attract more customers, improve customer satisfaction, and ultimately, increase your company's revenue. Don't miss out on the potential that marketing analytics can unlock for your SaaS company—start harnessing the power of data with Factors.ai today.
Marketing Analytics: Driving Data-Driven Growth
Marketing analytics involves measuring, managing, and analyzing data to optimize strategies and maximize return on investment (ROI). For SaaS companies, it provides insights into customer acquisition, behavior, and retention, enabling informed decision-making.
Key Benefits
1. Improved Targeting – Identifies and engages receptive audiences.
2. Enhanced Customer Experience – Delivers personalized and relevant content.
3. Optimized Marketing Spend – Focuses resources on high-performing channels.
Common Challenges
1. Data Integration – Aggregating insights from multiple sources.
2. Ensuring Accuracy – Maintaining reliable and consistent data.
3. Choosing the Right Metrics – Identifying KPIs that align with business goals.
Best Practices
1. Set clear objectives to guide analytics efforts.
2. Leverage advanced tools for comprehensive data analysis.
3. Foster cross-functional collaboration for cohesive decision-making.
By implementing strong marketing analytics practices, businesses can refine their strategies, improve efficiency, and drive sustainable growth.
FAQs
Why is marketing analytics important?
Marketing analytics makes marketing effective. It offers deep insights into the preferences and behavior of your customers. It allows you to shape the marketing campaigns in accordance with your customer’s expectations and helps you make data-backed decisions rather than relying on intuition and experience.
What are the three types of analytics that can be used in marketing?
Descriptive analytics, predictive analytics, and prescriptive analytics.
- Descriptive analytics analyzes historical data to understand past performance.
- Predictive analytics uses data and statistical algorithms to forecast future outcomes
- Prescriptive analytics provides recommendations on how to optimize marketing efforts based on data-driven insights.
%2520(1).avif)
SaaS Google Ads: How To Build High ROI Google Ads Campaign For Your SaaS Business
A step-by-step guide to Google Ads for SaaS companies. Learn keyword strategy, landing page optimization, bidding tactics, and how to measure ROI with real benchmarks.

TL;DR
- Launch Google Ads for your SaaS business only after achieving product-market fit and acquiring 10-15 customers.
- Set SMART goals, understand your audience, and conduct in-depth keyword research.
- Choose ad formats based on goals—Search for intent, Display for reach, and YouTube for engagement.
- Optimize landing pages, monitor performance, and adjust budgets to ensure ROI.
If you're building a SaaS company and haven't invested in Google ads yet, you have no idea what you're missing.
Over 80% of businesses use Google ads as a part of their marketing strategy and typically see a return of $2 for every $1 spent on Google ads. If you want to target in-market prospects and grow pipeline, this is the way to do it.
But how can SaaS companies leverage Google ads for revenue growth? Find your answer here, where we discuss the ABCs of SaaS google ads ⬇️
Google Ads for SaaS is a pay-per-click (PPC) advertising strategy where SaaS companies bid on high-intent keywords to reach prospects actively searching for software solutions. Unlike brand awareness channels, Google Ads captures existing demand — targeting users who are already looking for tools like yours. The key to SaaS Google Ads success is targeting tight, long-tail keywords, optimizing for downstream revenue (not just leads), and measuring success through LTV:CAC ratios rather than immediate ROAS.
Firstly, when should SaaS companies run Google ads?
Ishaan Manchanda, the founder of GrowthSpree, has over 7 years of experience in PPC marketing, and he recommends that you begin running ads once you achieve product-market fit (PMF):
"Consider launching Google search ads only when you've achieved PMF and acquired at least 10-15 customers. If you're still in the very early stages, paying for ads won't make sense when you're still making changes to your product."
Running ads on Google has many benefits, the main one being that Google ads are intent-driven. Unlike other platforms, Google only shows your ads to folks looking for your solution. So, you only have to pay when a user clicks on your ad.
Your ad data also clarifies how you can modify your strategy for greater conversions. Now, let's explore the types of ad formats you can leverage when launching Google ads.
Types of Google ads
Google Search Ads
These ads appear in search results above the organic results when people search for relevant keywords like "email marketing automation software." They are intent-based ads targeting existing demand.

Google Display Ads
These ads are shown on a vast collection of third-party websites that agreed to display Google ads. They can be in text, image, video, or rich media formats.

YouTube Ads
Video ads are an underrated method of generating leads for your business. SaaS companies can create video and display or text ads shown during or before YouTube videos or elsewhere on YouTube's platform. Video ads can be skippable or non-skippable.
App Campaigns
If the SaaS company has a mobile app, Google automatically creates ads by pulling the most relevant text, images, and ratings from the app store to drive mobile app installs and in-app conversions.
{{INLINE_TOFU}}
How to run Google ads for SaaS companies: a step-by-step guide
Here is a step-by-step guide for SaaS companies to launch effective Google Ads campaigns:
1. Define Your Campaign Objectives
When asked, "What is your campaign objective?" The most obvious answer is "to generate revenue." However, you need to establish SMART goals to establish more clarity amongst the team, so that you can refine your ad strategy moving forward.
Example: Increase qualified leads from Google Ads by 30% in Q3 2026 by implementing targeted campaigns, optimized landing pages, and SMART Goals in Google Analytics.
2. Develop Audience Personas
Create detailed profiles of your ideal customers - their demographics, interests, pain points, etc.
Identify the keywords and search queries they will likely use when looking for a solution like yours. Determine the most relevant ad formats, landing pages, and offers for each persona.
3. Set Up Your Google Ads Account
Create a new Google Ads account or link an existing one to your SaaS business. Set your campaign objective to "Leads" to drive signups and demos. Choose the Search campaign type to reach people actively searching for your solution
4. Conduct Keyword Research
Use the Google Ads Keyword Planner to find relevant keywords and assess their potential.
Identify long-tail keywords that indicate high purchase intent. Group keywords into themed ad groups for more targeted ads
We've researched what keyword themes work best and have analyzed the following keyword types:
- Branded keywords
- Competitor keywords
- Pricing keywords
- Product/Feature keywords
💡Find out how to use these keywords in your Google ads strategy.
Bonus: Competitor Conquesting Strategy
One of the most effective SaaS Google Ads tactics is bidding on competitor brand terms. This means showing your ads when prospects search for your competitors by name.
How to execute:
- Create a dedicated campaign for competitor terms to control budget separately
- Target '[Competitor] alternative', '[Competitor] vs', and '[Competitor] pricing' keywords
- Write ad copy that highlights your differentiators (don't mention the competitor by name in ad copy — it can violate trademark policies)
- Direct traffic to a dedicated comparison landing page, not your homepage
Important: Competitor campaigns typically have lower CTR and higher CPC than branded or generic campaigns. Expect 1-3% CTR and 2-3x higher CPC. But the intent is extremely high — these searchers are actively evaluating solutions.
5. Optimize Landing Pages
Create dedicated landing pages for each ad group with a clear value proposition and call-to-action. For instance, if you're creating a competitor landing page, you need to ensure
Ensure pages load quickly and are mobile-friendly. A/B test different page elements to improve conversion rates.
Tas Bober, a paid ads landing page expert and founder at Delphinium Solutions, recommends placing your form fields and displaying your product in the first fold of the landing page
"Create landing pages that:
1/ Deliver on the promise of the ads
2/ Showcase your product
3/ Call out who you're for
4/ Use clear language (think 5th grade)
5/ Bucket features into themes
6/ Save the company awards for the About page
7/ Use *relevant* social proof
8/ Tell the user what to expect after reaching out"
At Factors, we highlight the core value propositions in the first fold to drive consideration and engage prospects

6. Set Your Bids and Budget
Set a daily budget that allows you to get sufficient data to assess performance. Adjust bids and budgets over time based on the cost per click and conversion rates. You should also keep these metrics in mind when setting a Google ads budget:
- Calculate your Customer Acquisition Cost (CAC) and ensure your budget allows you to acquire customers at or below this cost.
- Determine your Customer Lifetime Value (LTV) and set a budget that reflects this value to ensure profitability.
Distribute your budget across different campaigns and ad types to test and find the most effective strategies. To optimize your budget allocation, you can also employ automated bidding strategies like Target CPA.
7. Monitor and Optimize
Regularly check your Google Ads dashboard to analyze key metrics like CTR, conversion rate, CPC, and ROAS. Use the Search Terms report to identify negative keywords to add to your campaigns. Make ongoing optimizations to bids, budgets, ads, and landing pages to improve performance.
8. Set Up Remarketing Campaigns
Most SaaS website visitors don't convert on their first visit — especially in B2B with longer decision cycles. Remarketing lets you stay top-of-mind with prospects who've already shown interest.
SaaS remarketing tactics:
- Website visitors who didn't convert: Show display ads across Google's network reminding them of your key value props
- Trial users who didn't upgrade: Target with ads highlighting premium features or case studies
- Blog readers: Retarget content consumers with ads promoting free trials or demos
- YouTube remarketing: Show video testimonials or product demos to warm prospects
Remarketing campaigns typically have much lower CPA than prospecting campaigns because you're reaching people who already know your brand.
9. Implement Offline Conversion Tracking
For SaaS companies, a form fill or trial signup is just the beginning — the real goal is a paying customer. Offline conversion tracking connects your CRM data back to Google Ads so you can optimize for revenue, not just leads.
How it works:
- Track conversion actions in Google Ads (form submits, trial signups)
- Connect your CRM (Salesforce, HubSpot) to Google Ads
- Import offline conversions (SQLs, closed-won deals) with their revenue values
- Google's Smart Bidding will then optimize for conversions that actually generate revenue
This is a game-changer for SaaS because it shifts optimization from 'most leads' to 'best leads' — dramatically improving lead quality and reducing wasted spend on low-intent clicks.
SaaS Google Ads Benchmarks
When monitoring performance, here are industry benchmarks to measure against:
- Average CPC: $3-$15 for generic SaaS keywords; $5-$25+ for competitor terms (WordStream)
- CTR: 3-6% for search ads (below 2% signals ad copy needs improvement)
- Conversion Rate: 3-5% for landing pages targeting trial signups or demo requests (Unbounce)
- Cost Per Lead: $50-$200 for SMB SaaS; $200-$1,000+ for enterprise
- LTV:CAC Ratio: Target 3:1 or better — if your ratio is below 1:1, pause and re-evaluate
- First-touch ROAS: ~78% for non-branded campaigns — looks negative but becomes positive when factoring in customer LTV (Involve Digital)
What SaaS Marketers Say About Google Ads
Based on discussions across Reddit (r/PPC, r/SaaS, r/googleads):
Start tight, scale later: "Run no more than ~20 keywords per ad group, stick to long-tail + exact match, and keep everything tight." Most SaaS ad waste comes from going too broad too early.
Bidding progression: Start with manual CPC or Maximize Clicks. Switch to Maximize Conversions after 15+ conversions. Graduate to Target CPA or tROAS once you have stable data.
The LTV trap: Don't judge SaaS Google Ads by immediate ROAS. First-touch ROAS for non-branded SaaS campaigns is typically ~78% (below breakeven). The real value shows up 6-12 months later through renewals and expansion revenue.
Budget reality check: Most SaaS marketers recommend $500-$1,000/month minimum to generate statistically significant data. Below that, you're guessing, not optimizing.
Measure your Google ads performance with Factors
Google ads are critical to your overall GTM strategy. If you want to make the most of Google ads, Factors is the tool you need!
You can use our "Account Identification" feature to deanonymize visitors who visit your site and also identify which campaign brought them to the website:

With our advanced attribution and analytics features, you can visualize how they engage with your ads and how your ad campaigns contribute to generating pipeline:

You can also leverage our Segment Insights features to understand how paid search is performing in comparison to other performance marketing initiatives (e.g. LinkedIn ads), thereby allowing you to strategize and change your approach to generate maximum ROI.

You can also connect Factors with G2 to understand how many accounts visit G2 product pages, competitor pages, and category pages after viewing your ads.
Well, we aren't going to reveal it all here! Contact our sales team to learn more about how you can leverage Factors to make the most of your Google ad spend.
How SaaS Companies Can Maximize Growth with Google Ads
For SaaS companies, Google Ads can be a powerful growth lever when used strategically. Companies should wait until they achieve product-market fit and have at least 10-15 customers before investing in ads. This ensures the product is stable and ready for a broader audience.
Clear campaign objectives aligned with revenue goals are critical. Defining SMART goals helps track progress and refine ad strategies. Understanding your target audience and conducting detailed keyword research covering branded, competitor, pricing, and product-related terms ensures ads reach high-intent prospects.
Choosing the right ad format is essential. Search ads target active demand, while display and YouTube ads expand brand visibility. App campaigns promote mobile apps if applicable. High-performing ads direct users to optimized landing pages that match the ad's message, highlight product value and include a clear call to action.
Budgeting should align with customer acquisition cost (CAC) and lifetime value (LTV). Automated bidding strategies like Target CPA help improve cost efficiency. Continuous monitoring and optimization, like adjusting bids, refining keywords, and improving landing pages, ensures sustained performance and ROI.
A thoughtful, data-driven approach helps SaaS companies turn Google Ads into a scalable pipeline growth engine.
Frequently Asked Questions on Google Ads For SaaS
Q1. What's a realistic Google Ads budget for SaaS?
Start with $500-$1,000/month to test keywords and collect data. Scale to $5K-$25K/month once you identify winning campaigns. Your budget should align with your Customer Acquisition Cost (CAC) and Customer Lifetime Value (LTV) — aim for at least a 3:1 LTV:CAC ratio.
Q2. How long until Google Ads generate results for SaaS?
Expect 2-3 months to collect meaningful data and optimize campaigns. SaaS sales cycles are longer than e-commerce, so optimize for micro-conversions (trial signups, demo requests) initially, then track through to closed-won deals using offline conversion tracking.
Q3. Should I use Smart Bidding or manual bidding for SaaS campaigns?
Start with manual CPC or Maximize Clicks to control costs while collecting data. Switch to Target CPA or Maximize Conversions after you have 15+ conversions per month — Smart Bidding needs sufficient data to optimize effectively.
Q4. What's a good CPA for SaaS Google Ads?
CPA varies widely by segment: $50-$200 for SMB SaaS, $200-$1,000+ for enterprise. The key metric isn't CPA alone — it's your LTV:CAC ratio. A $500 CPA is excellent if your customer LTV is $15,000, but terrible if your LTV is $600.
Q5. Should SaaS companies bid on competitor keywords?
Yes, but strategically. Competitor 'alternative' keywords (e.g., 'Salesforce alternative') often have very high purchase intent but also higher CPCs. Create a dedicated campaign with a separate budget, use comparison landing pages, and test with small spend before scaling.

The ROI of Website Visitor Identification Software for B2B Companies
Learn how to measure and maximize the ROI of website visitor identification tools at different growth stages, from finding your ICP to driving revenue and ACV growth.

TL;DR
- Website visitor identification ROI depends on how you use the data and your company’s growth stage.
- Early-stage companies can use it to identify their ICPs and understand which content resonates.
- Mid-stage companies can leverage it to acquire new prospects and move upmarket by targeting larger accounts.
- Measure success through meeting booking rates and ACV growth to ensure you're turning insights into revenue.
Measuring the ROI of website visitor identification tools for B2B/SaaS companies is pretty tricky. I say tricky because just having the data isn’t enough; you need to act on it to see real returns.
From my experience working with companies of all sizes, ROI boils down to two key factors:
1. What you do with the data (your sales and marketing workflows)
2. Where your company is in its journey (whether you’re just starting out or scaling).
Let me break this down further.
Early-Stage Companies: Finding Your ICP
If you're running an early-stage company, you're likely not doing a ton of marketing yet. At this stage, the ROI from website visitor identification is pretty straightforward - it helps you figure out who your Ideal Customer Profile (ICP) really is.
Think about it. You've launched your website, done your Product Hunt debut, published a few blogs, and maybe shared some LinkedIn posts or early sales outreach. What you really need to know is: who's actually interested in what we're building?
Here's a scenario I see often: you send out emails to 1,000 companies, and 60 or 70 of them visit your website. That’s gold—you’ve just identified the companies where your message is resonating. This insight is invaluable when you’re just starting out.
On top of that, visitor identification shows you which content pieces are landing with different types of companies. When resources are tight (and when aren't they?), knowing what works helps you focus your efforts where they matter most, ensuring every piece of content makes an impact.
To understand how visitor identification works and how it tracks anonymous website traffic, check out our in-depth guide How Does Website Visitor Identification Technology Work?.
Mid-Stage Companies: Expanding Use Cases
As your company grows, things get more interesting. Website visitor identification takes on new importance. You’ll start exploring different use cases, and two major opportunities usually stand out:
Getting New Prospects
This is where the rubber meets the road. Your ultimate ROI measure is precise: out of the companies identified on your website, how many turn into meetings, pipelines, and revenue?
We typically see two main approaches:
Sales Workflows
- Add identified companies to your sales sequences.
- Reach out to the right contacts via LinkedIn or direct calls.
- Use insights to tailor your outreach.
Marketing Workflows
- Target these companies on LinkedIn with personalized campaigns.
- Use the Google Display Network to stay visible (we will be launching Google ABM capabilities soon).
Moving Upmarket
I see the following scenario all the time with our clients who've just raised a Series B (think $20-25 million range). The VCs often push them to increase that average contract value (ACV) by expanding into the mid-market or enterprise segments, as the SMB space can plateau.
Website visitor identification becomes super valuable here because it helps you spot larger companies that are already browsing your site. Even if you’re not part of their conversation yet, this insight opens the door for targeted outbound efforts. You can proactively reach out to engage these bigger accounts before your competitors do.
Whether you’re growing your pipeline or moving upmarket, visitor identification ensures you’re seizing the right opportunities at the right time.
Learn how website visitor identification feeds into intent scoring to prioritize engaged accounts in our detailed guide: Intent Scoring via Website Visitor Identification.
{{INLINE_MOFU}}
Measuring the ROI
At the end of the day, you need to measure the impact of website visitor identification. Here’s how we do it:
- Meeting Booking Rate: Are you more likely to book a meeting with a company that visited your website compared to a cold account? That lift in conversion rates is your ROI right there.
- ACV Growth: For companies moving upmarket, track your average contract value (ACV) quarter over quarter. Are you landing larger deals by focusing on those bigger companies showing interest?
First, look at your meeting booking rate. Are you more likely to book a meeting with a company that visited your website compared to a cold account? That lift in conversion - that's your ROI right there.
For companies moving upmarket, track your ACV quarter over quarter. Are you landing bigger deals by focusing on those bigger companies showing interest?
Bottom Line
Here's what I've learned: the ROI of website visitor identification isn't about having the fanciest tech. It's about how you use it. Whether you're identifying your market as a startup or targeting bigger enterprise deals, this data can be incredibly valuable if you put it to work effectively.
And don’t forget, what drives success for a large company will look very different from what works for an early-stage startup. The key is matching your approach to where you are in your journey.
Want to dive deeper into website visitor identification, intent scoring, and LinkedIn Ads? Check out our in-depth guides:
Understanding Website Visitor Identification
- How Does Website Visitor Identification Technology Work? – Learn how visitor identification uncovers anonymous traffic and drives marketing success.
- Website Visitor Identification Metrics: What to Track – Discover key metrics to measure the effectiveness of visitor identification.
- Website Visitor Identification & Privacy: What You Need to Know – Understand compliance, GDPR, and privacy best practices.
- How to Choose the Right Website Visitor Identification Tool – Compare different tools and find the best fit for your business.
- Website Visitor Identification Implementation Guide – Step-by-step setup guide for seamless implementation.
Leveraging Visitor Identification for Business Growth
- Guide: How to Integrate Website Visitor Identification with Your CRM – Learn how to connect visitor insights with your CRM for better sales and marketing alignment.
- Why Website Visitor Identification is Critical for ABM Success – Understand the role of visitor data in Account-Based Marketing (ABM).
Advanced Use Cases: Intent Scoring & LinkedIn Ads
- Intent Scoring via Website Visitor Identification – Learn how to prioritize high-intent accounts using website data.
- Making LinkedIn Ads Work: Targeting B2B Audience Intent – Optimize LinkedIn Ads using visitor intent data.
.avif)
Revenue Forecasting Models: 7 Methods for 2026
Explore 7 proven revenue forecasting models — from linear regression to pipeline-based and AI-driven methods. Includes comparison table, examples, and best practices for 2026.
TL;DR
- Revenue forecasting predicts future income using historical data, market trends, and statistical models to guide budgeting, hiring, and growth decisions.
- The 7 most common models are: linear regression, time series analysis, moving average, bottom-up, top-down, pipeline-based, and scenario-based forecasting.
- No single model fits all — SaaS companies benefit from time series + pipeline models, while B2B enterprises often combine bottom-up with top-down approaches.
- The biggest mistakes are relying on stale data, using only one model, and ignoring external market signals.
- Tools like Factors unify CRM, marketing, and analytics data to improve forecast accuracy with real attribution insights.
Revenue forecasting is critical for any business, especially when it comes to B2B SaaS. The immense speed of progress in this industry requires keeping up with trends, continuously experimenting with fresh channels, and adjusting budget allocation based on future predicted revenue.
Accurate revenue forecasts help organizations make data-driven growth decisions.
This comprehensive guide will cover everything you need to know about revenue forecasting models
What is Revenue Forecasting?
Revenue forecasting is the process of predicting future revenue for a company using historical performance data, predictive modeling, and qualitative insights. Revenue forecasts provide an estimated projection of the total revenues expected in a future period.
Forecast time horizons can range from next month to next quarter to five years from now. Short-term forecasts may focus on immediate sales pipeline conversion, while long-range forecasts take a broader market-based approach.
With revenue forecasting, the goal is to provide the most accurate prediction of future revenue based on current insights. These reports can also be improved by leveraging attribution data so you know exactly what functions of marketing or sales bring in real revenue.
Revenue forecasting helps answer questions like:
- How much revenue can we expect to generate in the next quarter/year?
- How will seasonality trends and new product launches impact revenue?
- How quickly are we expected to grow over the next 5 years?
When done right, revenue forecasting can power key business functions:
- Financial planning: Building P&L statements, budgets, valuation
- Sales planning: Setting quotas, territory mapping, compensation
- Marketing planning: Demand generation budgeting, growth modeling
- HR planning: Hiring goals, resource allocation across teams
- Manufacturing planning: Inventory needs, capacity expansion
- Executive planning: Strategy setting, investment decisions
While revenue forecasting attempts to predict future revenues, it differs from a revenue projection which is typically more aspirational. Let's understand the differences.
Revenue Forecasting vs. Revenue Projections vs. Sales Forecasts
These three terms are used quite often when it comes to budgeting and strategic planning but they mean different things.
- Revenue Forecasts model the actual monetary revenue expected based on sales forecasts, historic performance, market conditions and statistical modeling. It provides the most likely, evidence-based scenario.
- Revenue Projections are what leadership desires to happen—an optimistic target rather than a data-driven expectation. Projections represent an aspirational revenue goal.
- Sales Forecasts predict expected sales bookings and pipelines based on leading indicators like open opportunities. They are an input into revenue forecasts.
Now, let's understand the types of revenue forecasts that you may come across.
Key Types of Revenue Forecasts
There are also different types of revenue forecasts based on methodology and time span:
- Short-term vs. Long-term - Short-term forecasts focus on immediate pipeline conversion, while long-term forecasts take a broader market-based view.
- Top-down vs. Bottom-up - Top-down forecasting starts with macro assumptions and allocates them across business units. Bottom-up rolls-up forecasts built from ground realities.
- Operational vs. Financial - Operational forecasts model near-term revenue streams. Financial forecasts take a holistic P&L view including costs and expenses.
- Deterministic vs. Probabilistic - Deterministic forecasts provide a single expected outcome. Probabilistic forecasts model a range of outcomes and probabilities.
Now, let's examine some key business uses and benefits of revenue forecasting.
Why is revenue forecasting important?
Accurate revenue forecasts can be the difference between success and failure for a business. Here are a few ways forecasting powers planning across the organization:
1. Budgeting with Realistic Precision
For finance teams, the single biggest use of forecasts is to build organization-wide budgets.
Budgets dictate how much gets spent on everything from R&D investments to marketing programs and payroll. Without reliable revenue forecasts, budgets devolve into guesswork.
For example, assume a company's revenue was $5M last year. Now the CFO needs to build next year's budget.
With intelligent forecasts, finance can model that based on new product launches, a 10% industry growth rate, and sales team expansions, revenues are likely to reach around $7.5M next year.
The CFO can now budget for expenses accordingly - say $1M for new engineering hires, $500K for more marketing, $150K for sales operations software etc.
Without forecasts, the CFO is flying blind. Maybe she pads the budget with a 20% increase to $6M. But if actual revenues only end up at $5.5M, suddenly there's a multi-hundred thousand dollar budget shortfall, requiring drastic cuts.
Conversely, if revenues actually reach $8M but budgets are based on last year's numbers, the company is now missing key growth opportunities due to under-investment.
2. Optimize Operations Management
Beyond budgets, forecasts guide operational decisions across departments:
- Sales: Forecasts feed territory assignments, quota setting, compensation planning, and capacity modeling whereas under-forecasting leaves money on the table.
- Marketing: Forecasts dictate digital and outbound campaign budgets and funnel targets where bad forecasts can waste spending and lead to missed opportunities.
- Product: Prioritizing the roadmap requires expected revenues from new features so bad forecasts can result in misplaced priorities.
- HR: Hiring and workforce planning requires expected growth rates and flimsy forecasts risk talent shortages or bloat.
Across the board, teams depend on forecasts to optimize operational management for future success amid constraints.
3. Fuel Strategic Decisions
Forecasts also provide the quantified confidence executives need to drive growth through major strategic moves:
- Funding rounds: Forecasts build credibility on growth potential to establish valuations. Weak forecasts undermine bids for capital.
- M&A valuation: Pre-transaction due diligence depends on target revenue forecasts. Bad forecasts lead to overpayment or lost deals.
- Market expansion: Breaking into new regions or verticals requires quantifying addressable revenues and investment payback.
- New product prioritization: High-impact opportunities are identified by revenue potential under constrained resources.
- Executive recruitment: Attracting star senior talent requires painting a compelling growth.
Creating reliable revenue forecasts empowers executives to place decisive strategic bets amid uncertainties, as opposed to shooting blind.
4. Track Performance to Plan
Revenue forecasts also provide a scorecard against which actual results can be monitored. Comparing real revenue performance vs. forecasted expectations then allows deviations to be easily flagged. With this information at hand, teams can course-correct before small misses snowball into major disasters.
Without forecasts as the reference point, there is no way to reliably track progress against potential. Revenue actuals in a vacuum don't reveal whether performance is on-target or off-course.
{{INLINE_TOFU}}
What are the types of revenue forecast models?
Now that we understand the fundamentals of revenue forecasting, let's examine some of the most common revenue forecasting models and techniques.
Broadly, forecasting approaches can be divided into two families:
- Quantitative models take a data-driven statistical approach to identifying trends and patterns in historical data that can be used for future predictions.
- Qualitative models incorporate expert perspectives, market analyses and contextual business insights to predict future revenues.
There are four common forecasting models namely linear regression, time series, bottom-up, and top-down. The best way to perform revenue forecasting is by combining multiple models to benefit from each of them.
Let's explore some of these popular models.
1. Linear Regression Models

Linear regression analyzes historical data to model how changes in key variables impact revenue.
Regression provides a data-backed view into drivers of revenue growth and contraction.
However, regression models are only as good as the input data. They may miss complex real-world dynamics that are not reflected in historical data. Approaching them as helpful guiding tools rather than absolute truth is important.
Key Benefits
- Quantifies the relationship between revenue drivers and outcomes
- Calculates the impact of each variable on revenues
- Models complex interactions between multiple variables
- Provides data-driven revenue projections
How It Works
Simple linear regression uses one variable, often time, to predict revenue.
For example, it can help a business quantify how much additional revenue every $1 increase in marketing spend has historically generated. This insight can be used to forecast revenue under different scenarios.
Multiple linear regression incorporates additional factors simultaneously like marketing spend, sales activities, market dynamics etc.
The model examines historical data to calculate coefficients measuring each variable's unique relationship with revenue. These insights feed the predictive model to forecast expected revenue under different scenarios.
Considerations
- Regression modeling requires large volumes of accurate historical data
- Predictive power diminishes beyond modeled relationships
- Difficult to model nonlinear variable interactions
Regression provides a data-backed view into drivers of revenue growth and contraction. It brings statistical rigor to projecting the top and bottom-line impact of decisions around pricing, hiring, product launches, geographical expansion and more.
However, these models are only as good as the input data. They may miss complex real-world dynamics that are not reflected in historical data. Approaching them as helpful guiding tools rather than absolute truth is important.
2. Time Series Forecasting

Time series analysis detects historical patterns in data over time. This helps tease out seasonal and cyclical trends from broader growth trajectories and random noise.
It decomposes revenue time series into:
- Trend - Overall upward/downward trajectory
- Seasonality - Cyclical patterns
- Noise - Random unexplained variations
Time series models maximize signals and minimize noise in historical data for sophisticated revenue projections tailored to the business. These models can incorporate recent data, balancing responsiveness to change with smoothing noise and help you extract actionable insights for reporting and forecasting.
Key Benefits
- Models trends and seasonality specific to the business
- Highlights time-based nuances impacting revenue
- Provides granular, frequently updating forecasts
How It Works
Time series techniques like moving averages, exponential smoothing, and ARIMA modeling analyze a revenue time series to optimize the predictive modeling of its components.
For example, enterprise software revenues may spike every fourth quarter due to a year-end budget flush. Media subscriptions may dip in the summer months when travel is high. Understanding these nuances helps make more contextual and accurate forecasts.
You can then use the insights generated from the time series forecasts to smoothen the growth curve giving you more predictable revenue.
Considerations
Time series models need sufficient history to detect reliable patterns. They may miss entirely new market dynamics or one-off events, unlike the past. Hence, combining them with human judgment is important.
3. Bottom-Up Forecasting

Bottom-up forecasting taps insights from sales, account management and other frontline teams to build projections. They incorporate pipeline health, competitive threats, and market mood along with historical data.
How It Works
Let's take an example organization with sales, marketing, finance, and leadership teams. Here's how bottom-up forecasting would work:
- The sales team starts by analyzing the health of its current pipeline and expected deal cycles to forecast expected conversion rates by product line and region.
- Meanwhile, marketing examines recent campaign performance and lead generation trends to estimate new MQLs by campaign channel. They apply conversion rates to project new SQLs.
- Finance consolidates these detailed bottom-up forecasts from each department. They identify and resolve any inconsistent methodologies or assumptions between teams.
- Leadership reviews the consolidated forecast and makes final top-down adjustments to determine the official revenue projection.
Key Benefits
- Incorporates insights from sales, account management, and other frontline teams
- Reflects pipeline health, competitive dynamics, and micro-market nuances
- Promotes buy-in through the inclusion of cross-functional inputs
Considerations
Inconsistent assumptions between teams can skew the overall forecast. Guidance from leadership on industry outlook, macroeconomic factors and growth objectives helps align assumptions and methodologies.
4. Top-Down Forecasting

Top-down forecasting starts with the big-picture view of the total addressable market, growth trajectories, economic conditions and business strategy. Leadership sets goals and divides revenue targets across functions.
This ensures strategic alignment between long-term goals and short-term operations. However, seemingly arbitrary targets could demotivate teams without context on the rationale so with top-down forecasting, you need to ensure two-way communication and transparency from leadership.
How It Works
Let's look at top-down revenue forecasting through an example.
- The executive/leadership team starts with the overall revenue growth target based on market outlook and strategic goals. They divide this target across sales, marketing and customer success based on revenue impact capacity.
- Each team gets their individual revenue target along with guidance on growth assumptions like pricing, conversions, expansions etc.
- Teams build goal-aligned execution plans around sales territories, campaigns, and account targeting to meet their top-down number.
- Leadership reviews department plans to ensure coordination and consistent assumptions are in place.
Considerations
- Teams lack insights into the rationale behind seemingly arbitrary targets
- Overlooks micro-market nuances and competitive dynamics
- Requires reconciliation of opposing projections
Blending both top-down and bottom-up approaches for revenue forecasting can help set realistic targets based on market conditions while aligning activities to growth objectives.
5. Pipeline-Based Forecasting
Pipeline-based forecasting uses your active sales pipeline to predict future revenue by applying conversion probabilities at each deal stage.
This model is especially popular with B2B SaaS companies that have well-structured CRM data. Rather than relying solely on historical trends, pipeline forecasting looks at what's actually in your funnel right now.
How It Works
Each deal in your pipeline is assigned a probability based on its current stage. For example:
- Discovery stage: 10% close probability
- Demo completed: 30% close probability
- Proposal sent: 60% close probability
- Negotiation: 80% close probability
The weighted sum of all deals gives you the expected revenue. For instance, a $100K deal at the proposal stage contributes $60K to the forecast.
Key Benefits
- Directly tied to real sales activity, not just assumptions
- Updates in real-time as deals progress
- Helps sales leaders identify pipeline gaps early
Considerations
Pipeline forecasting depends on accurate CRM data and consistent stage definitions across the team. If deal stages are subjective or data entry is inconsistent, the forecast will be unreliable. Pairing it with historical conversion rates improves accuracy.
6. Scenario-Based Forecasting
Scenario-based forecasting builds multiple revenue projections — best case, base case, and worst case — to prepare for different business outcomes.
Instead of relying on a single number, this model accounts for uncertainty by mapping revenue under different assumptions. It's particularly valuable for startups, businesses entering new markets, or companies operating in volatile industries.
How It Works
Define 3 scenarios with different assumptions:
- Best case: Higher win rates, faster deal cycles, successful product launches. Example: 20% growth if new enterprise segment converts at expected rates.
- Base case: Continuation of current trends with modest improvements. Example: 10% growth in line with historical averages.
- Worst case: Market downturn, lost key accounts, or delayed product launches. Example: Flat or -5% growth under economic slowdown.
Leadership uses these scenarios to plan contingency budgets and resource allocation.
Key Benefits
- Prepares the organization for multiple outcomes, not just one target
- Forces leadership to identify risk factors and mitigation strategies
- Useful for board presentations and investor communications
Considerations
Scenario-based forecasting works best when combined with a data-driven base model (like time series or pipeline). Without grounding in real data, scenarios can devolve into arbitrary guesses.
7. AI and Machine Learning Forecasting
AI and machine learning (ML) forecasting uses algorithms to identify complex, nonlinear patterns in large datasets that traditional models may miss.
As businesses accumulate more data from CRMs, marketing platforms, and product analytics, ML models can process these signals to generate more accurate and adaptive revenue predictions.
How It Works
ML forecasting models are trained on historical data and learn to recognize patterns without being explicitly programmed. Common approaches include:
- Random Forests and Gradient Boosting: Ensemble methods that combine many decision trees for robust predictions. These handle mixed data types and provide feature-importance metrics showing which variables drive revenue most.
- Neural Networks (LSTM/GRU): Deep learning models that capture temporal dependencies in sequential data — ideal for businesses with complex seasonal patterns.
- Regression-based ML: Enhanced versions of traditional regression that automatically detect variable interactions.
Key Benefits
- Processes far more variables simultaneously than traditional models
- Self-improves as more data becomes available
- Captures nonlinear relationships between revenue drivers
Considerations
ML models require large, clean datasets to train effectively. They can also be 'black boxes' — harder to explain to stakeholders than a simple regression. For most mid-market companies, combining ML insights with traditional models provides the best balance of accuracy and interpretability.
What is the Best Method for Revenue Forecasting?
The best forecasting method depends on your use case. Here's a quick comparison of all 7 models to help you decide:
ModelBest ForData NeededComplexityTime HorizonLinear RegressionQuantifying revenue driversLarge historical datasetMediumShort to mediumTime SeriesSeasonal/recurring revenue12+ months historyMedium-HighShort to longBottom-UpCompanies with strong CRM dataPipeline + team inputsMediumShort to mediumTop-DownMarket-entry or strategic planningMarket size + share dataLowMedium to longPipeline-BasedB2B SaaS with active sales pipelineCRM deal stagesLow-MediumShort (quarterly)Scenario-BasedUncertain markets, board reportingAssumptions + base modelMediumMedium to longAI / Machine LearningLarge datasets, complex patternsBig data, clean inputsHighAny
Let's understand this with two examples.
A SaaS company with recurring subscription revenue may find time series analysis to be very effective. That's because, studying historical revenue patterns over time, seasonal cycles and trends become apparent. Statistical time series models can help quantify these patterns to accurately predict recurring revenues.
On the other hand, for a retail chain opening new store locations, a bottom-up approach could prove more useful. Each new store manager could prepare detailed forecasts for their location based on demographics, nearby competitors, marketing plans etc. Aggregating these bottom-up projections provides a realistic the overall revenue forecast.
The point is, every business is situated differently. The ideal approach depends on:
- Data availability - length of revenue history, presence of relevant drivers/variables
- Revenue characteristics - recurring/seasonal patterns, level of variability
- Business structure - centralized/decentralized, product diversity
- Strategic context - expanding to new markets/geographies, introducing major new offerings
Leaders need to understand revenue drivers in their industry and business and use the insights to tailor the forecasting methodology to their specific situation and objectives.
Combining methods can also be beneficial. For example, a short-term quarterly forecast may use time series analysis to leverage recent revenue trends. And for the annual budget, a bottom-up approach could then add local market perspectives for a comprehensive view.
The key is adapting forecasting approaches to match business realities which provides the accuracy and insights required for confident decision-making across the organization.
Recommended Models by Business Type
Not sure which model fits your business? Here's a quick guide:
- B2B SaaS (subscription-based): Start with time series analysis for recurring revenue patterns, then layer in pipeline-based forecasting for new business. Track MRR/ARR components — new revenue, expansion, churn — separately for the most accurate picture.
- B2B Sales-Led (enterprise deals): Combine bottom-up forecasting from your sales team with pipeline-based models. Long sales cycles make pipeline stage probabilities critical.
- Product-Led Growth (PLG): Use usage-based signals (active users, feature adoption, seat expansion) as leading indicators. Pair with scenario-based models to plan for viral growth or plateau scenarios.
- Early-Stage Startups: With limited historical data, rely on top-down market sizing combined with bottom-up pipeline estimates. Use scenario-based models for investor conversations.
- Established Enterprises: Leverage time series + linear regression with deep historical data. Add AI/ML models when data volume justifies the complexity.
How to Forecast Revenue: A Step-by-Step Process
Regardless of which model you choose, the revenue forecasting process follows a consistent framework. Here's how to build a reliable forecast from scratch:
Step 1: Gather and Clean Your Data
Pull historical revenue data from your CRM, accounting software, and marketing platforms. Ensure data is complete, deduplicated, and covers at least 12 months. The more history you have, the more reliable your forecast.
Step 2: Define Your Forecast Horizon
Decide whether you're forecasting for next month, next quarter, or next year. Short-term forecasts (1-3 months) work best with pipeline and moving average models. Long-term forecasts (1-5 years) benefit from time series and top-down approaches.
Step 3: Identify Revenue Drivers
Map the key variables that influence your revenue: sales headcount, marketing spend, average deal size, conversion rates, churn rate, and seasonality patterns. These become inputs for your forecasting model.
Step 4: Select and Apply Your Model(s)
Choose from the 7 models above based on your data availability and business type. Most companies get the best results by combining 2-3 models — for example, pipeline-based for Q1 accuracy plus time series for annual planning.
Step 5: Validate and Adjust
Compare your forecast against actual results monthly. Track forecast accuracy as a percentage and investigate significant variances. Adjust your model inputs as new data becomes available — forecasting is iterative, not a one-time exercise.
Revenue Forecast Formula: A Quick Example
Here's a simple revenue forecast using the straight-line method — one of the most accessible models for businesses with steady historical growth:
Formula: Forecasted Revenue = Last Period Revenue x (1 + Growth Rate)
Example:
- Q4 2025 revenue: $500,000
- Average quarterly growth rate (last 4 quarters): 8%
- Q1 2026 forecast: $500,000 x 1.08 = $540,000
For a more nuanced forecast, apply a weighted moving average that gives more importance to recent quarters:
Weighted Forecast: (Q4 x 0.4) + (Q3 x 0.3) + (Q2 x 0.2) + (Q1 x 0.1)
These formulas give you a starting point. Layer in pipeline data, seasonality adjustments, and market signals for a more complete picture.
Revenue Forecasting Models: Best Practices
What are some of the best practices for ensuring accurate revenue forecasting when using these revenue forecasting models? Let's look at 4 of the best practices that you should consider following.
1. Start with high-quality data
Remember this—garbage in, garbage out. Even the most advanced model cannot compensate for poor-quality data. Invest in processes and systems to collect accurate, complete revenue data, with proper change logs and auditing.
2. Eliminate outdated information
Stale data loses relevance quickly. Establish mechanisms to continually gather the latest data on revenue drivers. This could involve surveys, sales team feedback, customer interviews etc.
3. Reduce the length of planning cycles
Annual plans using old assumptions miss market shifts. Re-forecast more frequently using the latest data to stay agile. Quarterly or even monthly cycles are preferable.
4. Avoid a futile bid for perfection
Obsessing over tiny accuracy improvements is counterproductive beyond a point. Focus on balancing usefulness and cost when selecting model sophistication.
Common Revenue Forecasting Mistakes to Avoid
Even with the right model, forecasting can go wrong. Here are the most common pitfalls and how to avoid them:
1. Relying on a Single Model
No single model captures every variable. Combining a quantitative model (like time series) with a qualitative approach (like bottom-up sales input) provides a more balanced forecast.
2. Ignoring External Market Signals
Internal data tells you what happened. External signals — economic indicators, competitor moves, regulatory changes — tell you what might happen next. Build these into your assumptions.
3. Over-Relying on Excel Spreadsheets
Excel-based forecasting is error-prone, hard to version-control, and burns out teams with manual updates. As one FP&A practitioner noted, version-controlled assumption templates with automated data ingestion produce more reliable results than spreadsheet-based models.
4. Setting It and Forgetting It
A forecast created in January is outdated by March. Re-forecast quarterly at minimum — monthly is better. The best teams treat forecasting as a continuous process, not an annual exercise.
5. Conflating Forecasts with Targets
A forecast is what you expect to happen based on data. A target is what you want to happen. Mixing the two leads to inflated projections and missed budgets. Keep them separate.
What Practitioners Say About Revenue Forecasting
Revenue forecasting isn't just a finance exercise — it's a cross-functional challenge that impacts every team. Here's what real practitioners are saying:
- Automation is replacing spreadsheets. FP&A teams are increasingly moving from Excel-based forecasting to Python scripts and purpose-built tools. Version-controlled assumption templates with automated data ingestion produce more reliable, auditable results.
- Simpler models often outperform complex ones. Data science practitioners note that for small datasets (common in mid-market B2B), classical methods like moving averages and linear regression frequently beat ML models that need large training sets.
- Forecasting cycles burn out teams. Monthly re-forecasting in manual spreadsheets is a top complaint. The solution: invest in tools where departments update their inputs independently and the forecast consolidates automatically.
- The art-vs-science debate is over. Revenue operations leaders emphasize that gut-feel forecasting is no longer sufficient. 'We have models, AI, and abundant data. Together, they make the science of revenue forecasting accessible to every RevOps professional.'
How Factors Can Help Your Business Drive Revenue
Let's face it—optimizing your GTM strategy is tedious, and time-consuming without having all the right data in one place.
You have your metrics in different silos across marketing, sales, and revenue and piecing together a complete picture feels impossible. You could have leaks in your funnel, but cannot find the exact pages. Attribution has become a shot in the dark. And you're pouring money into campaigns without knowing if they're working or not.
This is where Factors comes in.
Factors integrates all your disparate data sources—CRM, MAP, web analytics, social media, ad platforms—into one unified view.

You can quickly pull custom reports to get insights and answers on the fly. Factors also leverages leading IP resolution technology to reveal anonymous website traffic. Helping you discover up to 64% of untapped traffic and turn them into known, sales-ready accounts. More accounts to market means more pipeline and revenue.
With unified data and a complete view of your funnel, you gain the power to make strategic decisions that move the revenue needle. Scale what works, fix leaks, attribute MQLs to campaigns, analyze account journeys—Factors has you covered.
Don't shoot in the dark. Book a demo with Factors to see how we can help you get better insights and data to power your forecasting models and make data-driven decisions to boost pipeline and growth
Optimize Revenue Forecasting for Smarter Business Decisions
Accurate revenue forecasting models help businesses predict future income and make informed financial, sales, marketing, and operational decisions.
Key forecasting models include:
- Linear Regression & Time Series Analysis: Use historical data to identify trends and predict future revenue.
- Bottom-Up & Top-Down Forecasting: Build projections from frontline sales insights or allocate from macro-level market targets.
- Pipeline-Based Forecasting: Convert active deals into expected revenue using stage probabilities — ideal for B2B SaaS.
- Scenario-Based Forecasting: Model best, base, and worst-case outcomes for strategic planning.
- AI & Machine Learning: Process complex datasets to uncover nonlinear revenue patterns at scale.
The bottom line: No single model works for every business. The most accurate forecasts combine 2-3 models tailored to your data maturity, business type, and planning horizon. Start with the simplest approach that fits your data, then layer in complexity as your needs grow.
Choosing the right model depends on business type, data availability, and forecast horizon. By leveraging predictive analytics and market insights, businesses can refine strategies, improve budgeting, and drive sustainable growth.
FAQs
1. What is revenue forecasting and why is it important?
Revenue forecasting is the process of predicting future revenue for a company using historical data, predictive modeling, and insights. Accurate forecasts empower data-driven planning and growth decisions across functions like finance, sales, marketing and operations. Reliable revenue forecasts are mission-critical for budgeting, managing operations, fueling strategic growth moves and tracking performance.
2. What are the top revenue forecasting models?
Popular models include linear regression to model revenue drivers, time series analysis leveraging historical patterns, bottom-up forecasting aggregating projections from frontline teams, and top-down forecasting starting with leadership's total target. Combining approaches provides flexibility to tailor models to business needs and data availability.
3. How often should you update revenue forecasts?
Outdated assumptions lose relevance quickly, so forecasts should be refreshed frequently. Quarterly or monthly re-forecasting cycles are preferable to stay agile versus annual plans. Access to latest revenue driver data enables more responsive modeling.
4. What are some common pitfalls of revenue forecasting?
Potential pitfalls include unpredictable market shocks, limitations of available data, human errors in model assumptions, and finite resources to build sophisticated models. Perfection is unrealistic but maximizing useful accuracy is key.
5. What data is needed for accurate revenue forecasts?
Quality historical revenue data is the foundation. Relevant drivers like market trends, sales activities, product changes, and economic indicators help explain revenues. Updated inputs prevent stale assumptions. Data challenges need pragmatic solutions.
6. How can technology enable better revenue forecasts?
Tools like CRM, account intelligence and analytics tools like Factors, etc. provide key sales and marketing data inputs. Purpose-built FP&A software centralizes data for modeling and reporting. Technologies like AI and machine learning can boost forecasting sophistication.
7. What best practices improve revenue forecasting?
Best practices include maintaining high-quality data, eliminating outdated information, shortening planning cycles, combining modeling approaches, and focusing models on business needs. Avoid needless complexity but leverage enough sophistication to meet objectives.
8. What is the difference between revenue forecasting and sales forecasting?
Sales forecasting predicts expected bookings and pipeline conversions based on leading indicators like open deals and rep activity. Revenue forecasting is broader — it incorporates sales forecasts alongside other revenue sources like renewals, expansions, and usage-based income to project total company revenue. Sales forecasts are one input into the overall revenue forecast.
9. Can you forecast revenue in Excel?
Yes. Excel supports basic forecasting using built-in functions like FORECAST.LINEAR, TREND, and moving average calculations. For simple models with limited data, Excel works well. However, as data volume grows and you need real-time pipeline integration or multi-variable regression, purpose-built FP&A tools or CRM-connected platforms like Factors provide more reliable, automated results.
10. How do you forecast revenue for a new product with no historical data?
Without historical data, combine top-down market sizing (total addressable market x expected capture rate) with bottom-up estimates from early sales pipeline and beta customer signals. Scenario-based forecasting is especially useful here — model best, base, and worst cases to set realistic expectations for stakeholders and investors.
Revenue Marketing: New and Improved
Discover the top trends and improved strategies in revenue marketing. Learn how to maximize growth and achieve success in the modern marketing landscape.

I recently came across an article that placed a great deal of emphasis on getting your definitions right. Of course, ‘defining’ things — roles, processes, objectives — holds plenty of value. From providing clarity and purpose to qualifying breakthrough ideas, a good definition can help teams go a long way in reaching their goals. And yet, even the most precise definitions are bound to change.
With that in mind, this post discusses the elements that define the new and improved Revenue Marketer. In particular, we explore six pillars of Revenue Marketing and highlight the value of data, technology, and organisational alignment in effectively driving revenue growth.
But first, let’s quickly run over the fundamentals of Revenue Marketing.
Like many others, I learned about the term 'Revenue Marketing’ through Dr. Debbie Qaquish. About 10 years ago, during a transition from a long career in sales to a role in marketing, her CEO sat across her desk and posed a single question: “What are you going to do about revenue?” Long story short, this set off the development of a significant approach that transforms marketing teams from flowery cost centers to high-performing revenue machines. This approach, we've come to know as ‘revenue marketing’.
“Revenue marketing is the combined pillars of strategies, processes, people, technologies, content, and results across marketing and sales that drop leads to the top of the funnel, accelerates sales opportunities through the pipeline, and measures marketing based on repeatable, predictable, and scalable contribution to pipeline, revenue, and ROI”
Phew.
That was a mouth full.

Now don’t get me wrong; this continues to remain the foundation upon which Revenue Marketing is built. But back then, the market looked very different from what it is today. We’ve had major changes that mandate an updated definition of revenue marketing. Accordingly, here are three additional challenges that redefine what it means to be a revenue marketer today.
Challenge #1 - Digital transformation
In 2011, the average number of technologies available to the marketing industry was about 150. Today, that same measure stands at an astonishing 7000. It’s becoming increasingly normal for marketing teams to employ upwards of 30, or even 40 different pieces of MarTech products. But digital transformation isn’t just about getting your hands on the hottest new tech toy. Now, Marketers have to choose between all-encompassing platforms like SalesForce and specialised best-in-class solutions for each use-case. The key challenge here is to centralise customer data and orchestrate these platforms to deliver a personalised customer experience.
Challenge #2 - Customer centricity
It's no secret that as an industry, marketing has been progressing towards customer-centricity. Now more than ever, a firm’s customer experience signals its competitiveness in the market. Again, at the root of this change is digitalisation and technology. Digital customers are in control because your competition is now a single click away from you. Accordingly, identifying and employing the appropriate marketing channels — and distributing relevant content within those channels becomes a key challenge.
Challenge #3 - Revenue accountability
A 2019 report by Duke University found that 80% of CMOs are under pressure to deliver ROI, revenue, and growth. However, only about a third provide any financial reports as a result of technological inaccessibility and an overall lack of training. Though we have countless programs and platforms to crunch marketing data and derive revenue metrics, they can be a little too inaccessible for marketers without analytical backgrounds to make effective use of.
And so, we arrive at three challenges — each one based to varying extents in data, technology, and alignment — that are driving the new definition of revenue marketing.
The new and improved Revenue Marketer
Teams in leading B2B companies continue to transform themselves from cost centers to predictable and scalable revenue machines. Except now, they have an additional focus on digital transformation, customer-centricity, and revenue accountability. As an outcome, marketing is driving non-linear growth in a world where buyers are averse to direct sales.
Okay - so far, we’ve established our basis for the contemporary definition of revenue marketing. But let’s go even further. Not only is data, technology, and alignment fundamental in defining revenue marketing; it is essential to every capability within every pillar associated with the approach as well.
Strategy
In revenue marketing, strategy involves understanding your team’s readiness for change, aligning your company’s key business initiatives, and most importantly — forming revenue synergy with sales. While a large part of this ‘getting everyone on the same page’ process involves planning, communication, and leadership; technology is playing an increasingly important role as well. Though instinct and qualitative responses can complement strategy, data, metrics, and indicators are crucial ingredients in developing accurate customer profiles and journeys. And as all three merge across sales and marketing, teams require ecosystems that are conducive to a symbiotic, well-aligned workflow. An easily accessible analytics platform (*ahem* Factors.AI) enables sales and marketing folk to speak the same language — revenue.
//Factors.AI is an AI-powered marketing analytics platform that provides critical insights into your marketing activities, decodes customer behaviour, and empowers your marketing team to focus on real strategic decisions. In short - we do all the analytical heavy lifting for you.//
Process
The process pillar isn’t dissimilar to traditional marketing. In general, Process primarily involves campaigns and data. Accordingly, there are two aspects worth highlighting — campaign management and data management.
Campaign management involves executing, tracking, analysing, and measuring digital conversions in terms of business impact. There has been tremendous progress in the MarTech space within each of these functions. Not simply to automate the process, but to derive detailed insights as well. It’s a similar story with data management. Easy access and insight into your marketing data can make all the difference in the world. Implementing this process could be as simple as consolidating all your data under a single roof or automating any recurring analysis.
//Factors.AI enables your marketing team to consolidate and crunch marketing data from across all your sources - Google, Linkedin, Facebook, and more. Our integration process is completely code-free as well. In fact, we could have your marketing team onboarded in a single week.//
People
The people pillar consists of broad capacities involving the management of people in and outside of marketing. Stakeholder alignment, resource planning, and talent acquisition are important, but talent management in particular, is an aspect worth highlighting. A firm can employ all the data and technology in the world, but if the marketing team doesn’t have sound control over these tools, they won't be of much use at all. One solution to avoid this issue is to keep things simple.
//Factors.AI is simple by design. Our platform has been tailored to make the user experience very, very intuitive. In fact, our AI-powered analytics platform does all the work behind the scenes, so detailed insights into your data becomes as straightforward as a google search.//
A training program with a specific focus on revenue marketing tools can also go a long way in improving technical fluency and ensuring your team has a good grasp of revenue-oriented data.
Customer
As a revenue marketer, it is important to understand your customer across their entire life cycle. It’s no longer sufficient for marketers to get a customer through the door and call it a day. Revenue marketing encourages you to keep tabs on all the touchpoints a customer goes through. Additionally, a revenue marketer aims to optimize their customer data - not only to improve campaign performance but to access valuable business insights as well. A second aspect that’s closely tied to the customer is content management. The batch and blast approach simply doesn’t make the cut anymore. It’s just as important for content to be relevant to the intended audience as it is for that content to travel through the right channels.
//Multi-touch attribution, End-to-end customer insights, and Automated analysis are but a few of the several features Factors.AI has to offer. When coupled with highly customisable campaign analytics - our platform makes for a very simple, very powerful marketing tool.//
Results
Finally, we arrive at Results. Results to a revenue marketer involves a variety of measures associated with financial outcomes (Shocker!). But it doesn't end there. Along with delivering an impressive ROI, revenue marketers also aim to accurately forecast their revenue. In essence, they construct a marketing machine that drives repeatable, predictable, and scalable revenue. I probably sound like a broken record at this point but analysing data, utilising the right tools, and ensuring organisational alignment are crucial elements at this stage. Needless to say, sufficient training and practice won’t do any harm either.
//Factors.AI’s explain feature differentiates us from the rest of the game. Along with consolidating your data and performing automated analytics, our AI-powered platform provides actionable insights in a matter of minutes.//
Over the course of this post we’ve discussed what it means to be a Revenue Marketer today, we’ve briefly explored the six pillars associated with revenue marketing, and we’ve highlighted the value of utilising data, ensuring alignment, and employing the right tools and technologies. At the end of the day, revenue marketing is a pretty straightforward idea — A well-organised, well-equipped approach that empowers marketing teams to bring in money in a predictable, scalable manner. So as a marketer, the only question left to ask yourself is this:
“What are you going to do about revenue?

Predictive Sales Intelligence: Close More Deals in 2026
Predictive sales intelligence helps sales teams close more deals by analyzing data to identify top leads. Learn how AI and automation improve sales strategies.
TL;DR
- Predictive sales intelligence analyzes data to forecast buying behavior and prioritize leads.
- Key components include customer behavior tracking, market trend analysis, and competitive intelligence.
- AI-powered tools like ZoomInfo and LinkedIn Sales Navigator improve sales efficiency and forecasting.
- Overcoming challenges requires strong data management, team training, and seamless tool integration.
What is Predictive Sales Intelligence
Predictive sales intelligence uses data analysis and market insights to help sales teams find and close deals more effectively. It looks at patterns in past sales data, customer interactions, and market signals to predict future buying behaviors and sales outcomes.
Sales teams use this information to see which leads are most likely to convert, what products customers might buy next, and when they are ready to purchase. Predictive sales intelligence analyzes data from sources like CRM systems, social media, company websites, and third-party databases to provide useful insights for salespeople.
The system tracks key indicators such as:
- Past buying patterns
- Customer engagement levels
- Website interaction data
- Company growth signals
- Technology changes
- Hiring patterns
- Financial indicators
These insights help sales teams focus on leads most likely to convert. For example, if a company has recently received funding, hired new executives, and increased technology spending, the system might flag them as a high-potential target.
Unlike traditional sales methods that rely on intuition and relationship building, predictive sales intelligence adds a data-driven approach that helps teams decide where to focus their time and resources.
Key Components of Sales Intelligence
Modern sales intelligence systems have four key parts:
Data Collection and Analysis: This is the base, gathering information from sources like CRM systems, emails, social media, and other databases. It gives insights into customer actions, market trends, and sales performance.
Customer Behavior Tracking: This watches how prospects interact with your company on different channels. It looks at website visits, email opens, content downloads, and social media engagement. These interactions show buying signals and readiness to purchase.
Market Trend Analysis: This looks at broader industry patterns, including:
- New technologies
- Competitor actions
- Industry rules
- Economic factor
- Customer likes
Competitive Intelligence: It focuses on understanding competitors' strategies, products, and market positions. It includes:
- Pricing strategies
- Product features
- Marketing campaigns
- Customer reviews
- Market share
These parts work together to give a full view of the sales landscape. They help sales teams make informed choices about prospect focus, outreach timing, and deal strategies when integrated well.
Tools and Technologies Used In Predictive Sales Intelligence
Predictive Sales intelligence uses four main types of technology to improve sales results:
Leading Sales Intelligence Platforms
In 2025, Factors.ai, ZoomInfo, LinkedIn Sales Navigator, and 6sense are the top choices. These platforms offer detailed data on prospects, including contact info, company details, and buying signals. ZoomInfo is known for its accurate B2B data, while LinkedIn Sales Navigator uses professional network insights.
CRM Integration
CRM systems like Salesforce and HubSpot are key to sales intelligence. They link with other tools to provide a complete view of customer data. This helps track interactions, manage sales pipelines, and automate tasks. Check out our Workflow Automations page for more details on CRM integration.
AI and Machine Learning Tools
AI tools look at sales data patterns to predict which leads will convert. They handle routine tasks, suggest the next best actions, and let sales teams focus on important activities. Popular tools include Gong.io for conversation insights and Clari for revenue forecasting.
Data Visualization Solutions
Tools like Tableau and Power BI turn complex data into clear visuals. They help teams find trends, track performance, and share insights. These tools make it easier to understand data and make quick decisions.
To learn more about choosing the right tool, read our blog on how to choose the best sales intelligence tool.
{{INLINE_TOFU}}
Implementing Predictive Sales Intelligence
Building a strong sales intelligence system involves four main steps:
Building a Data-Driven Sales Team
Hire or train people who know both sales and data analysis. Your team needs skills in using CRM systems, analyzing sales metrics, and making decisions based on data. Look for people who can turn data insights into actions.
Setting Up Data Collection Systems
Set up a clear process for gathering customer data, market insights, and sales metrics. Use tools that automatically collect data from sources like emails, website visits, and social media. Make sure your systems can handle both structured and unstructured data.
Creating Analysis Frameworks
Develop standard ways to analyze sales data. This includes making templates for reports, setting up dashboards for different team members, and establishing regular review processes. Your framework should help spot patterns in successful sales and areas needing improvement.
Training and Skill Development
Provide ongoing training to keep your team effective. Focus on practical skills like using sales intelligence tools, interpreting data, and applying insights to sales talks. Regular workshops and hands-on practice help team members stay current with new tools and techniques.
Leveraging Data for Better Sales
Lead Scoring and Prioritization
Create a lead scoring system based on customer actions like website visits, email opens, and content downloads. This helps sales teams focus on leads most likely to convert, saving time and resources. Check our Account Intelligence page for more information on lead scoring.
Customer Journey Mapping
Track how prospects move through your sales funnel. Use data to see where leads get stuck or drop off. Identify key moments to improve the buying process and provide timely support.
Predictive Analytics
Use past data to forecast future sales. Analyze patterns in successful deals to predict which prospects are most likely to buy. This helps in managing resources and the sales pipeline.
Personalization Strategies
Tailor your sales approach using customer data. Create targeted messages based on industry, company size, past interactions, and specific needs. Use behavioral data to time your outreach and choose the best communication channels.
By using these data-driven methods, sales teams can:
- Focus on high-value opportunities.
- Spend less time on unqualified leads.
- Improve conversion rates through personalized engagement.
- Make more accurate sales forecasts.
- Spot cross-selling and upselling opportunities earlier in the sales cycle.
Sales Intelligence KPIs
To measure sales success, track metrics that impact revenue and efficiency. Focus on Key Performance Indicators (KPIs) for a full view of performance.
Track these KPIs:
- Lead-to-opportunity conversion rate.
- Average deal size.
- Sales cycle length.
- Win rate percentage.
- Revenue per sales rep.
- Customer acquisition cost.
Track Return on Investment (ROI) by comparing:
- Cost of tools and training.
- Time saved in prospecting.
- Increase in deal size.
- Improvement in close rates.
- Reduction in sales cycle length.
Sales Velocity Metrics show how fast deals move through your pipeline:
- Number of opportunities.
- Average deal value.
- Win rate.
- Length of sales cycle.
Conversion Rate Analysis shows success at each stage:
- MQL to SQL conversion.
- SQL to opportunity.
- Opportunity to closed deal.
- First meeting to proposal.
- Proposal to close.
Review these metrics monthly and quarterly to spot trends and make informed decisions for your sales strategy.
Predictive Sales Intelligence Best Practices
Strong data practices are key to effective sales intelligence. Keep these core practices in mind:
Data Quality Management:
- Clean data to remove duplicates.
- Update contact information monthly.
- Verify data accuracy before importing.
- Set data entry standards for all teams.
Regular Data Updates:
- Schedule weekly data refreshes.
- Monitor data sources for changes.
- Update customer profiles after interactions.
- Keep competitor information current.
Team Collaboration:
- Share insights between sales and marketing.
- Hold weekly data review meetings.
- Create clear documentation for processes.
- Use shared dashboards for transparency.
Security and Compliance:
- Follow data protection regulations.
- Implement strong access controls.
- Train team on security protocols.
- Conduct regular security audits.
- Document all data-handling procedures.
These practices maintain data integrity and ensure reliable insights. Make them part of daily operations. Consistent use builds trust in data and leads to better decisions.
Remember: good data leads to good decisions. Insufficient data leads to costly mistakes.
Common Challenges and Solutions While Setting Up Sales Intelligence Systems.
Sales teams often face problems when setting up sales intelligence systems. One common issue is data integration. This happens when trying to combine different data sources. You can solve this by using standard data formats and strong ETL (Extract, Transform, Load) processes. This ensures data moves smoothly between systems.
Another big challenge is getting the team to use new tools. Sales reps might see these tools as extra work. You can address this by quickly showing the tools' value, offering thorough training, and celebrating successes. Start with team influencers who can help others get on board.
Data accuracy is always a concern. Tackle this by:
- Setting validation rules.
- Using data verification tools.
- Doing regular data audits.
- Making clear data entry guidelines.
Resource allocation is another hurdle. Teams may face budget limits and lack technical skills. Handle this by:
- Starting with essential features.
- Expanding based on ROI.
- Using vendor support.
- Training internal leaders.
Each challenge needs a clear plan and good communication. Success comes from being proactive, not reactive. These challenges are common, so learning from others can help you avoid similar problems.
Understanding Predictive Sales Intelligence
Predictive sales intelligence helps sales teams close deals more efficiently by analyzing data to forecast buying behavior. It identifies high-potential leads by examining past sales patterns, customer interactions, and market signals from CRM systems, social media, and financial reports.
Key components include:
- Data Collection & Analysis: Gathers insights from multiple channels.
- Customer Behavior Tracking: Monitors engagement to assess readiness to buy.
- Market Trend Analysis: Evaluates economic, industry, and competitor trends.
- Competitive Intelligence: Analyzes rivals' pricing, strategies, and market share.
Advanced tools like ZoomInfo, LinkedIn Sales Navigator, and AI-driven CRM integrations refine lead targeting. AI and machine learning predict conversions, automate tasks, and improve forecasting. Data visualization tools help sales teams interpret complex insights.
Effective implementation requires a skilled, data-driven team, structured data collection, and continuous training. Businesses optimize sales by leveraging predictive analytics for lead scoring, personalized engagement, and sales forecasting. Key KPIs include conversion rates, deal size, sales velocity, and ROI.
Challenges include data integration, adoption resistance, and accuracy concerns, which can be addressed with strong validation rules, streamlined onboarding, and incremental tool implementation. A data-driven approach enhances sales efficiency and decision-making.

Revenue Intelligence is Changing B2B Marketing
Read to know more about how B2B marketing uses revenue intelligence, cutting-edge technology that help your business drive growth and increase revenue.

In this article we’ll cover,
1. What is Revenue Intelligence?
2. Why are teams increasingly opting for Revenue Intelligence?
3. Revenue Intelligence to Optimize Conversions
- Breaking down silos between marketing and sales
- Solves for uncaptured data
- Solves for outdated and stale data
- Targeting entire accounts with ABM
- Give sales leaders total visibility/Access to the larger picture
- Accelerate sales cycles with more efficiency
- Forecasting
4. The Emergence of Revenue Operations and Intelligence (RO&I)
Revenue intelligence (RI) is a popular buzzword in today’s marketing landscape. This enthusiasm may be warranted. RI is revealing itself to be a powerful tool for marketing and sales teams to derive powerful data insights that were hitherto unforeseen. RI uses AI to gather data that would otherwise remain uncaptured.
Let’s start with an example.
GrowNow is a marketing agency for start-ups. They focus on both digital and event services. Their content team has put out several articles on how marketers should approach scaling at various stages of growth.
Akshat is the marketing head of Company X that has a fintech product. They’ve found their product-market fit and now they are looking to scale. He is searching online for ways to scale marketing and branding efforts. He comes across GrowNow’s website and finds the information that he is looking for.
He is not a lead yet but marketing has the information on how he came upon the website and what pages he’s engaged with. He finds his way back to the website a few days later whilst searching for more information on what tech stack his team would need. He downloads a free report on GrowNow’s website on the latest trends in martech.
Finally, after a few weeks, Akshat comes back to GrowNow’s website, this time with a direct search and the intent to check out the services that GrowNow provides. He even fills a form for a preliminary call.
Now that Akshat has been converted, he is pushed to Sales and GrowNow’s CRM has the information that he filled on the form: his name, email address, title and company. They might also have other information like the report downloaded by him. Marketing directs a few more adverts towards Akshat over the next few weeks. Soon sales gets on call with Akshat, they use this information to convert him and they are successful.
Later on, Deepti, the CEO of clothing brand Y which has several pop-up stores finds GrowNow in an article on up-and-coming marketing agencies and clicks on the link which redirects her to their website. She spends some time looking through the website and fills a form. On receiving a call from an SDR, she learns more about their services. Marketing continues to send the same adverts based on Deepti’s website activity. However, after a few calls, they quickly realise that Company Y and GrowNow do not have a good fit. Sales had the same basic information about Deepti as they did with Akshat.
Both Akshat and Deepti’s customer journeys were a little different which sales were unable to access — like the data on their journeys pre-form fills. Similarly, marketing was unable to personalise websites based on Deepti and Akshat’s activities once they went down the funnel to SDRs. This in part, came about due to different locations of this data. Marketing has its data on first touch, web pages visited, time spent on webpages, adverts clicked on Google Analytics or other marketing platform while sales has its data on its CRM like Salesforce. Both departments were unable to access the other’s platform nor did they have an integration in place that allows for seamless flow of this information.
This is where Revenue Intelligence comes in.
What is Revenue Intelligence?
In its simplest terms, revenue intelligence refers to the process of leveraging AI to collect, sync and analyse data across sales, marketing and customer success to produce critical insights and generate revenue.
It is a powerful revenue operations tool that helps companies bring synergy between their customer-facing teams (marketing, sales and customer success) and make decisions that are powered by metrics.
Why are teams increasingly opting for Revenue Intelligence?
More and more companies are increasingly realising the limitations of human intelligence in identifying important data points as well as the limitations on relying only on CRM data for insights on customer journeys.
The solution to this, has been to look at AI to collate and identify data that humans cannot. Furthermore, RI helps teams coordinate and capture data at the right time, before data decay diminishes value -
1. Breaking down the silos between marketing, sales and customer success
Data silo is a problem when there is a lack of seamless coordination between teams, especially in terms of data collection and storage. A huge chunk of insights get lost when the data captured by these teams remains limited to their own teams. This is propelled by storing of data on different locations and difficulty in cross-departmental access of this data. All three of these departments are interacting with customers and have intelligence on customer trends and opportunities that get lost with interdepartmental misalignment with data getting siloed.
A revenue intelligence system captures and integrates the data from all these teams in real-time and creates a single, consolidated platform for the entire organisation. This ensures that everyone is on the same page and allows for seamless coordination between teams that helps create a unified strategy.
2. Solves for uncaptured data
Sales and customer success teams have to manually enter customer data like contacts, engagements, etc into their CRM. Two problems arise with this:
1. Manually entering data for each and every customer interaction is time consuming.
2. This leads to negligence as many sales and customer success fail to enter all a lot of this data. Around 55% of salespeople admit that they do not enter all lead and customer data.
Resultantly, a lot of available data remains uncaptured and the company relies on this incomplete data for reporting, planning and forecasting.
RI solves for uncaptured data by automatically capturing contacts and engagements data from all customer facing teams, solving for both time and incomplete data, leading to more accurate and reliable sales reporting and forecasting.
3. Solves for outdated and stale data
Sales and marketing data is susceptible to becoming stale.
Relying on manually entered contact details and the fact that people change jobs and positions and do not update their linkedin profiles leads to databases and CRMs being outdated and filled with errors. Good, high intent leads are very critical for both sales and marketing to reach their conversion goals.
Then there is also the consideration for the hidden cost of redundant data. Bad or outdated data can muddle up research, competitiveness and accuracy of forecasts. Poor data leads to the wastage of sales’s time and IT’s time in syncing systems. It causes frustration when data-backed decisions fail to execute results.
RI solves for this by automatically tracking and updating changes to the leads in the CRM. This ensures more up-to-date and reliable prospect data.
Revenue Intelligence To Optimize Conversions
1. Capturing missing sales activity
We’ve spoken about the problems of unco-ordination and data silos between sales and marketing. When marketing is unable to access sales data, it prevents potential for improving marking activity and checking for inefficiencies in the existing process. As discussed earlier on the Factors Blog, getting multitudes of leads won't have a positive impact on revenue unless they are good, qualified leads. Infact, it may just lead to a waste of the sales efforts. In such a case, RI helps marketing access sales data that is pertinent for marketing’s processes and planning for more efficient campaigns.
Auto-creating of leads based on sales’ experiences, auto-removal of leads that sales has already dealt with or are low-intent based on previous experiences — both lead to coordination of data as well as a more seamless process of lead identification and capturing of contacts.
Furthermore, automated opportunity association of leads and tracking of interactions (emails, meetings, etc) helps get more insights from available data.
2. Attributing Marketing Touchpoints
Apart from sending better leads to sales, RI also helps paint a clearer picture of how marketing is helping sales acquire leads that lead to conversions. This helps in both having a better understanding of customer journeys and measuring the impact of marketing in the organisation’s overall functioning.
Revenue intelligence helps with marketing attribution reports that highlight marketings total impact, impact in each channel and the creation of first-touch, last-touch and multi-touch reports. RI also simplifies visualising the opportunity journey with easy spotting of marketing email and campaign touchpoints and deal updates as leads move through the funnel.
3. Enhances ABM
Revenue Intelligence helps optimise ABM by improving the data quality of the contacts that are captured for the various accounts. With automation, more contacts can be captured. These contacts are also of better quality due to the improved tracking of customer engagements.
RI also allows you to pursue better personalisation and target marketing efforts based on an account’s firmographic features and funnel position. So teams can get more meaningful insights from CRM and build improved target account audiences.
4. Giving sales leaders access to the larger picture
RI helps sales leaders have a better understanding of the customer journey and gain insights into the prospects that are coming in. Furthermore, having a real-time system of data relating to sales helps with insights into the sales process.
5. Improved sales pipeline
Better prospects, higher intent leads determined based on historical and real-time data improves the quality of leads entering the sales pipeline which in turn leads to higher conversions. Apart from higher output, RI also helps SDRs close deals faster and improve productivity.
6. Forecasting
Revenue Intelligence helps sales forecasting by solving for outdated and uncaptured data to improve the reliability and accuracy of predictions.
{{INLINE_TOFU}}
The Emergence of Revenue Operations and Intelligence (RO&I)
RO&I is a tech category that leverages AI to perform the principal task of revenue operations: integrating sales, marketing and customer success. In other words, RO&I is technology that allows the integration of sales technology, marketing technology and customer success technology to provide an end-to-end solution from customer acquisition to retention and expansion.
Revenue Intelligence tools help teams get the best out of revenue intelligence and empower their Rev Ops efforts with better data and more improved efficiency in mapping customer journeys. Knowing when to reach out to potential customers with the right information at the right time is critical to improving experience and conversions.

Why It's Worth Prioritizing Product Marketing
Discover the transformative power of prioritizing product marketing and explore the benefits, strategies, and insights for the future of your business.
The modern business landscape requires modern solutions for several reasons. The market nurtures fierce competition while the expectations of customers are always evolving. In such a landscape, a business should ask itself how seriously it should approach product marketing. The answer to that is very simple - prioritizing product marketing is a must and non-negotiable. Stick around and explore why you should put an emphasis on your marketing efforts.

Benefits of Prioritizing Product Marketing
Product marketing encompasses the end-to-end journey of bringing a product to market and ensuring its growth. It involves using customer data and feedback from various sources. In the competitive business world, prioritizing product marketing offers a strategic advantage that shouldn't be overlooked. Here are the most prominent benefits of making product marketing a priority:
- It boosts product visibility so that the offering has a higher chance of being seen by the right people.
- It crafts clear and compelling messages that resonate with your audience, which makes the product irresistible.
- It gives your business a competitive edge by thoroughly understanding the competition and setting your product apart in a crowded market.
Nurturing the Customer Journey
When it comes to nurturing the customer journey, keep in mind that this process consists of two parts. First, you should view it as a guide that has the purpose of educating potential customers about the value and benefits of your product. It helps them make informed decisions and steers them from initial awareness to becoming a satisfied buyer.
You should also remember that product marketing doesn't stop at the point of purchase. It also plays a role in maximizing user adoption and satisfaction, making sure that customers not only choose your product but also get genuine satisfaction from its use. Such a focus on customer satisfaction is very important in cultivating loyalty and advocacy, which in turn contributes to business growth.

The Role of Product Marketing in Product Development
Effective product marketing bridges the gap between product development and the customer. It ensures that the development team understands customer needs and that customers get products tailored to their requirements. This is done by gathering market insights, which then influence product development decisions and steer them in a direction that aligns with market demand and innovation.
{{INLINE_TOFU}}
Measuring Success and Overcoming Challenges
Another important thing about product marketing that will ensure you are on the right path is to gather the necessary metrics. This type of measurement can help you overcome any upcoming obstacles and adapt your current strategy to get better results.
Demand metrics provide invaluable insights into what's working and what needs adjustment. In the broader perspective, the triumph of a marketing campaign essentially depends on your ability to measure and evaluate your efforts tangibly.
Key Performance Indicators (KPIs)
Key Performance Indicators, or KPIs, are like the compass for your marketing game. They're super important because they tell you how well your strategies are doing and guide your progress. We're talking about conversion rates, how much it costs to snag a new customer, how happy your customers are, and the return on investment (ROI).
What can help you get a better grasp on KPIs is a tool called a marketing dashboard. There are several marketing dashboard examples that can visualize a summary of your strategy, including Google Ads dashboard, LinkedIn Ads performance marketing dashboard, and more.
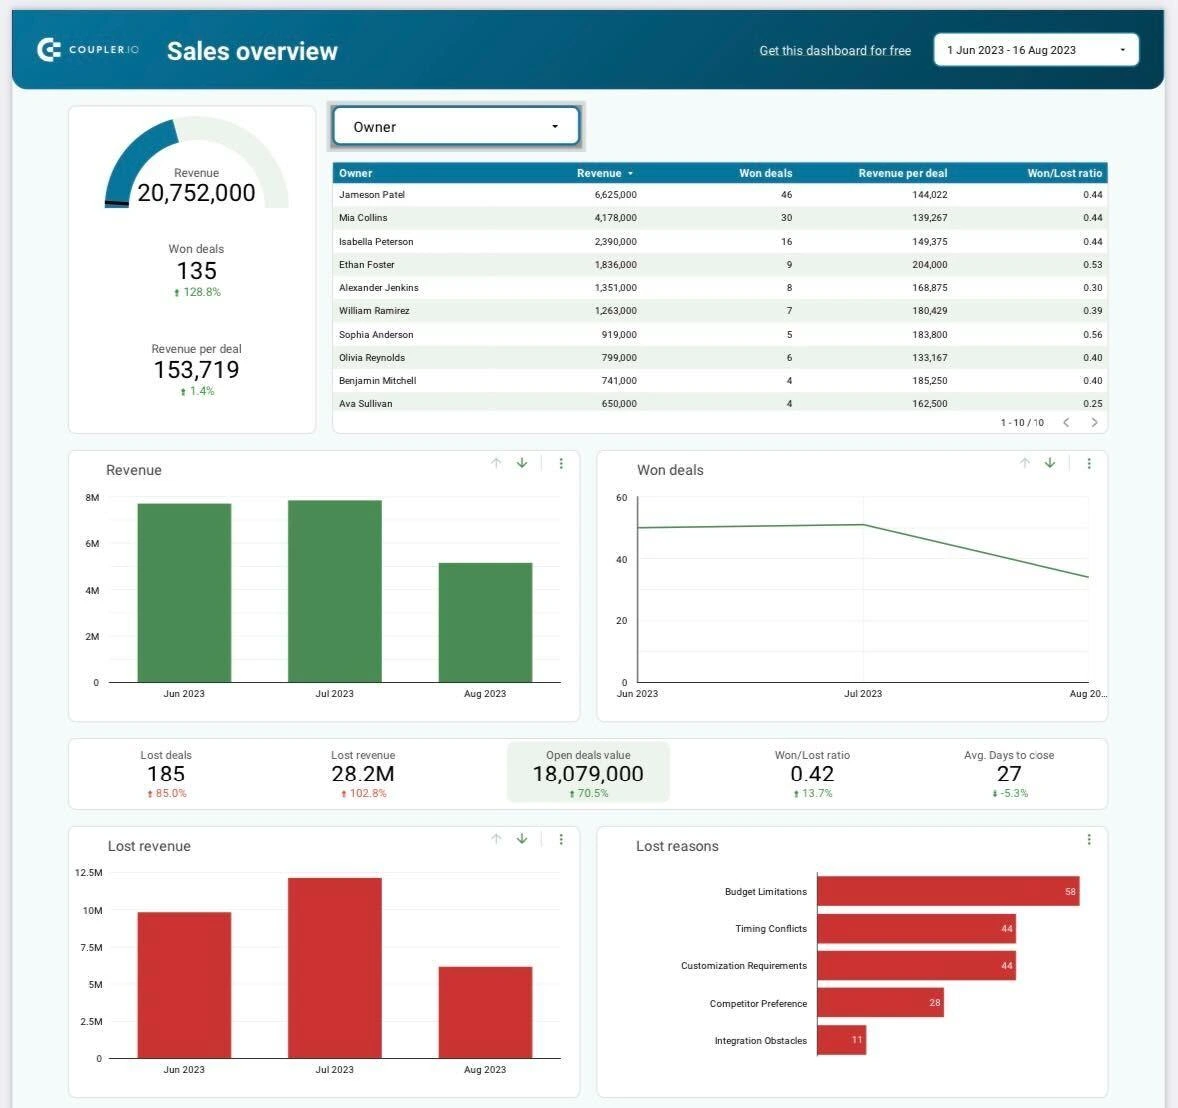
Common Hurdles
The journey of product marketing has its challenges. Common hurdles often include fierce market competition, shifting consumer preferences, and the rapid evolution of marketing technologies. To overcome these obstacles and ensure success, leveraging skills assessment tools using surveys and the right blend of adaptability, creativity, and strategic skills becomes crucial. This approach allows for a comprehensive understanding of team strengths and areas for development, enabling more informed and effective strategies in the dynamic landscape of product marketing.
The Future of Product Marketing
Marketing has evolved through the decades. From the simplest ways of reaching out to consumers through cold calls to modern-day digital marketing efforts, the future of product marketing holds the promise of transformation and innovation.
Emerging Trends and Technologies
Product marketing is about to go through a significant change thanks to new trends and remarkable technologies. We're talking about using AI and machine learning to understand what customers want, making excellent marketing experiences with virtual and augmented reality, using data analytics for super personalized marketing, and adopting unified marketing measurement strategies. It's like we're on the verge of a new product marketing era. To stay on the right path to success in the future will mean staying ahead of all these trends.
Preparing for the Future
Businesses should proactively prepare for the future of product marketing to be able to thrive in this dynamic environment. This involves several things, like staying on top of emerging trends, fostering innovation, and strategically building brand awareness. It's all about future-proofing your strategies and ensuring that your product marketing approaches remain relevant in an ever-evolving marketplace. Moreover, cultivating strong customer relationships and adapting swiftly to changing consumer preferences are pivotal aspects of navigating the evolving landscape of product marketing.

Focus on Product Marketing for Ultimate Success
From bringing a product into the market to its growth and adaptation, the importance of prioritizing product marketing is very clear. With benefits that include stronger visibility, compelling messaging, and competitive advantage, businesses are given the tools to help them thrive in a competitive marketplace. Nurturing your potential leads by educating and guiding them and maximizing user adoption and satisfaction solidifies the bond between the brand and its customers.
As we look to the future, the evolving trends and technologies promise to reshape the product marketing landscape. To navigate this dynamic future means staying prepared, embracing change, and fostering innovation. In the grand scheme of things, product marketing isn't simply a choice you may or may not take. It's a vital investment in ensuring your product doesn't just exist but thrives and flourishes. Investing in marketing means prioritizing your growth and solidifying your place as a key player in the ever-evolving world of business.
.avif)
Predictive Marketing Analytics vs. Prescriptive Analytics: A Comparison
Learn how to leverage predictive marketing analytics and prescriptive analytics to improve B2B marketing outcomes, make data-driven decisions, and increase ROI.
TL;DR
- Predictive analytics leverages historical and current data to forecast future trends, helping B2B marketers anticipate customer needs, identify valuable leads, and optimize campaign timing.
- Prescriptive analytics recommends specific actions based on predictions, aiding marketers in budget allocation, personalized outreach, and strategy enhancement.
- Predictive marketing analytics is valuable for lead scoring, sales forecasting, and predicting customer churn. Prescriptive analytics excels in budget management, channel optimization, and campaign personalization.
- Prescriptive analytics often requires more complex data and advanced models, but provides actionable insights that enhance business outcomes.
- Employing both analytics approaches enables B2B companies to transition from reactive to proactive strategies, resulting in smarter, more efficient marketing.
- Success relies on quality data, skilled analytics teams, and a culture that values data-driven decision-making.
- By integrating predictive and prescriptive analytics, B2B marketers can execute targeted campaigns, improve customer experiences, and achieve lasting growth in a competitive market.
Imagine investing heavily in lead generation campaigns, only to find that most leads don't convert into customers. This common frustration among B2B marketers leads to wasted resources, unmet goals, and pressure from sales teams to deliver better prospects. Traditional analytics often fall short, focusing on past results rather than future possibilities or actionable insights. The solution lies in advanced analytics, specifically predictive analytics and prescriptive analytics, to transform your marketing outcomes.
Predictive marketing analytics and prescriptive analytics are powerful tools that enable you to anticipate buyer behavior, enhance campaigns, and make informed decisions. Predictive analytics leverages historical data to forecast future trends, while prescriptive analytics goes a step further by recommending specific actions to achieve your objectives. Understanding the distinction between these two is crucial for B2B marketers aiming to stay ahead and maximize their return on investment.
In this blog, you'll discover the key differences between predictive and prescriptive analytics, how to apply them in B2B marketing, and practical tips for integrating them into your strategy. By the end, you'll be equipped to make data-driven decisions that drive real business growth and marketing success.
What is Predictive Marketing Analytics?
Predictive analytics is essential for data-driven B2B marketing, utilizing historical and current data to forecast future outcomes. This empowers marketers to identify which leads are likely to convert, determine effective content, and pinpoint optimal timing for engagement. By employing statistical models and machine learning, predictive analytics uncovers patterns in customer behavior that might otherwise go unnoticed.
For B2B marketers, the advantages include focusing on high-quality leads, timing campaigns effectively, and personalizing outreach. Predictive analytics can rank leads based on their likelihood to convert, enabling sales teams to target the most promising opportunities. It also aids in revenue forecasting, ensuring efficient allocation of budgets and resources.
Key applications include identifying at-risk accounts, predicting product demand, and enhancing account-based marketing strategies. Predictive analytics allows for data-driven decision-making, enhances marketing ROI, and strengthens collaboration with sales. For more insights on how to leverage predictive analytics, check out our Predictive Marketing Analytics resources.
However, predictive analytics only provides insights into potential outcomes. Prescriptive analytics are necessary to translate these insights into action. This approach sets B2B marketers apart, driving tangible business results.
What is Prescriptive Analytics in B2B Marketing?
Prescriptive analytics guides B2B marketing by recommending actions to achieve optimal results. While predictive analytics forecasts potential outcomes, prescriptive analytics answers the question, ‘What should you do next?’ It employs algorithms and models to evaluate various strategies and their impact on your goals.
In B2B marketing, prescriptive analytics can optimize campaign budgets, recommend the most effective channels, and suggest personalized messages for each account. For instance, if predictive analytics identifies leads likely to convert, prescriptive analytics can propose the best sequence of actions to maximize conversion rates. It also helps marketers allocate resources efficiently, focusing on campaigns with the highest potential return.
Prescriptive analytics is particularly valuable in complex B2B environments with long sales cycles and large buying committees. By continuously learning from new data, prescriptive models update recommendations in real-time, ensuring strategies remain effective as conditions evolve. This approach empowers B2B marketers to transform insights into actions, making data-driven decisions that foster business growth and competitive advantage.
{{INLINE_BOFU}}
Predictive Marketing Analytics vs. Prescriptive Analytics: Core Differences
Understanding the differences between predictive and prescriptive analytics is crucial for B2B marketers looking to refine their strategies.

By understanding these differences, B2B marketers can strategically choose and combine analytics methods, leading to decisions that drive business success.
When Should You Use Predictive Marketing Analytics vs. Prescriptive Analytics?
Selecting predictive or prescriptive analytics depends on your marketing goals and decision-making needs.
1. When to Use Predictive Marketing Analytics?
Use predictive analytics when your goal is to understand what is likely to happen next based on past and current data. It helps you answer questions like:
- Which leads are most likely to convert?
- Which customers might churn?
- How well will this campaign perform?
For example, if your sales team wants to prioritize outreach, predictive analytics can rank leads by their likelihood to close. This helps your team focus on the right accounts and use time and resources more efficiently.
2. When to Use Prescriptive Analytics?
Prescriptive analytics is helpful when deciding what actions to take to get the best results. It uses data to evaluate different options and recommend the most effective course of action.
Use it when you're trying to:
- Choose the best way to allocate your marketing budget.
- Plan campaign timing and messaging.
- Decide which channel will be most effective for a specific audience.
If you're running a campaign and want to know not just who to target, but also how, when, and where to engage them, prescriptive analytics will help guide those choices.
3. Why Combining Both Works Best?
In many cases, the most effective strategy is to use both types of analytics together:
- Start with predictive analytics to identify likely outcomes, such as which accounts are ready to buy.
- Follow up with prescriptive analytics to decide how to act, such as the right time and message to use.
This step-by-step process allows you to make better decisions and improve results across your B2B marketing and sales activities.
Predictive Marketing Analytics & Prescriptive Analytics: Key Challenges and Best Practices
While predictive and prescriptive analytics offer significant benefits in B2B marketing, they also present challenges. Some are:
1. Ensure Data Quality
One of the biggest roadblocks is poor data. Incomplete, outdated, or inconsistent data leads to inaccurate predictions and recommendations.
Quick Tip:
- Regularly clean, update, and unify data across all platforms.
- Use tools that maintain data accuracy and help detect inconsistencies early.
2. Integrate Analytics Into Workflows
Many B2B teams struggle to connect analytics with their day-to-day systems like CRMs, marketing automation platforms, and sales tools.
Quick Tip:
- Choose analytics tools that integrate well with your existing tech stack.
- Encourage collaboration between marketing, IT, and data teams to ensure smooth implementation.
3. Address Skill Gaps
Marketing teams often lack deep analytics experience, which limits the impact of advanced tools.
Quick Tip:
- Invest in training your team in data literacy and analytics fundamentals.
- When needed, partner with external data specialists to support execution and model building.
4. Balance Automation with Human Insight
While predictive and prescriptive tools offer recommendations, they shouldn’t replace human judgment.
Quick Tip:
- Use automated insights to inform strategy, not dictate it.
- Align decisions with your brand voice, customer knowledge, and market context.
5. Track Performance and Adapt
Analytics strategies must evolve as your business and market change.
Quick Tip:
- Set clear KPIs for your analytics efforts.
- Regularly review performance and adjust your models and campaigns based on feedback and results.
Also, read our blog about Predictive Sales Intelligence to close more deals by analyzing data in 2025.
Conclusion: Which Approach is Best to Use?
Predictive and prescriptive analytics are indispensable for B2B marketers aiming to stay competitive. Predictive analytics enables you to anticipate customer actions, identify valuable leads, and forecast campaign outcomes using historical and current data. Prescriptive analytics takes it further by recommending actions to enhance marketing strategies, manage budgets, and personalize outreach for optimal results.
The true advantage lies in combining both methods. This synergy allows your marketing team to transition from reactive to proactive planning, resulting in smarter decisions that drive business success.
However, success depends not just on the tools but also on quality data, skilled teams, and clear objectives. By integrating analytics into your marketing processes and continuously updating your models, you can thrive in the fast-paced B2B landscape.
Utilize Factor’s predictive marketing analytics to forecast lead quality, pipeline trends, and campaign performance. Identify high-value prospects, optimize your marketing budget, and stay ahead of market changes to empower your team to focus on what matters most.

Top 10 PearlDiver Alternatives
Explore the top PearlDiver alternatives: comparing features, pricing, and limitations for Warmly, Leadinfo, KickFire, and LeadMagic, among others.
.avif)
Pearl Diver is a sophisticated web analytics solution, strategically designed to empower businesses in the identification and engagement of website visitors. The platform converts anonymous traffic into high-quality leads, elevates conversion rates, and rejuvenates email marketing strategies.
It also enables businesses to optimize their sales strategy through various functionalities, including in-depth visitor insights, targeted engagement with frequent visitors, segmentation of identified visitors using a diverse range of filters, email marketing optimization based on key performance metrics, and the reconnection with past customers or leads expressing renewed interest.
So, why look for a PearlDiver Alternative?
- Geographic Expansion:
Scenario: Businesses expanding globally may need a solution with broader geographic coverage.
Consideration: Exploring alternatives ensures that the chosen tool aligns with the business's expansion plans and provides comprehensive data coverage across diverse regions.
- Automation and Integration Preferences:
Scenario:
Businesses looking for automated processes and smoother integrations.
Consideration:
Users desiring more automation and integration capabilities may explore alternatives that offer advanced features, ensuring a more efficient workflow and better alignment with existing tools.
- Enhanced User Experience:
Scenario:
Concerns about user interface intuitiveness and ease of onboarding.
Consideration:
Businesses prioritizing a positive user experience may seek alternatives that address interface and onboarding challenges, enhancing overall user satisfaction and adoption.
- Comprehensive Data Sources:
Scenario: Businesses requiring a more extensive range of data sources.
Consideration: Companies seeking a deeper understanding of their B2B target market may explore alternatives providing a broader array of data sources, ensuring a more holistic approach to lead generation and market analysis.
{{INLINE_CTA_A}}
Factors to consider in the alternative
- Geographic Coverage:
Assess the alternative's coverage to ensure it aligns with your business's geographic focus. If you operate globally or in regions outside the primary coverage of Pearl Diver, choose an alternative with a broader geographic reach.
- Data Export and Integration Options:
Evaluate the data export capabilities and integration options of alternatives. If your business relies on integration with existing tools or requires more automated data export processes, prioritize alternatives that offer comprehensive and user-friendly integration features.
- Onboarding and User Experience:
Consider the onboarding process and overall user experience of the alternative. Opt for a solution with an intuitive interface and a smooth onboarding experience to enhance user satisfaction and expedite the adoption of the new tool within your team.
- Automation and Workflow Efficiency:
Assess the automation capabilities and workflow efficiency of potential alternatives. If your business seeks more automated processes and streamlined workflows, choose a solution that offers advanced automation features to optimize your lead generation and marketing activities.
- Scalability and Advanced Features:
Consider the scalability of the alternative and whether it provides advanced features to accommodate your business's growth. Opt for a solution that meets your current needs and offers scalability and additional functionalities to support evolving business requirements.
- Data Privacy and Compliance:
Scrutinize how well each alternative aligns with data privacy regulations. If your business operates in regions with stringent data protection requirements, prioritize alternatives that prioritize and adhere to these standards, ensuring a secure and compliant operation.
- Cost-Effectiveness:
Evaluate the pricing structure and plans of potential alternatives. Choose a solution that offers a cost-effective pricing model aligned with your budget constraints. Ensure the alternative provides good value for money while meeting your business requirements.
- Customer Support and Feedback:
Explore customer support and gather feedback from existing users using potential alternatives. Opt for a solution with responsive customer support and positive testimonials, indicating a reliable and supportive vendor that values customer satisfaction.
Today, we’ll be comparing
- Warmly
- Leadinfo
- Factors.AI
- KickFire - A Foundry Company
- LeadMagic
- LeadRebel
- Snitcher
- Sales Intel
- User.com
- Happierleads
Before we start, here’s a little about PearlDiver
Pearl Diver Features
- Anonymous Website Account Identification:
Pearl Diver excels in identifying anonymous website traffic, offering deep insights into company details, industry, location, and online behavior for a holistic understanding.
- Opportunity Generation and Audience Segmentation:
Facilitating opportunity generation and audience segmentation, Pearl Diver becomes a catalyst for refining targeting strategies and empowering precise sales and marketing approaches.
- Direct Integration:
Integration is achieved through direct compatibility with various marketing and sales platforms via Zapier. This feature ensures efficient audience management, enhancing overall sales cycle efficacy.
- Automated Workflow:
Integrating audiences into marketing and sales services is streamlined through Zapier or by exporting them to email as CSV files. This automation boosts marketing activities, providing a robust workflow.
- Opportunity Management and Real-Time Notifications:
Pearl Diver offers unparalleled visibility, expediting deal tracking, identifying buying signals promptly, and notifying users in real time when existing customers re-enter the market. Advanced tracking capabilities contribute to proactive opportunity management.

Pearl Diver Pricing
Pearl Diver’s Launch plan starts at $387 per month. Currently, they do not have a free trial plan.

Pearl Diver Limitations
- Limited Geographic Coverage:
Pearl Diver currently operates exclusively in the United States, restricting data capture for businesses predominantly functioning in Australia and other countries.

- Manual Data Download Process:
Daily manual data downloads to Excel are a requirement, potentially causing inconvenience. Nevertheless, ongoing efforts hint at the introduction of an API setup to streamline this process.

- Onboarding Process Challenges:
Users have reported challenges with the onboarding process, citing a lack of cleanliness. This could pose hurdles for users during the initial stages of adopting the platform.

{{INLINE_CTA_A}}
1. Warmly

Warmly Features
- All-in-One Access:
Access top-tier enrichment and intent data for streamlined automation.
- Unified Buyer Experience and Automation:
Merge intent insights with immediate action, capturing buyer interest promptly. Consolidate tools, workflows, and actions for instant engagement with decision-makers.
- Autonomous Sales Orchestration:
Bridge the gap between intent signals and outreach, ensuring a competitive edge.
- Integration:
Effortlessly integrate with existing tools, automatically converting high-intent website visitors.
- Reveal & Enrich:
Build real-time comprehensive profiles of site visitors, linking them to opportunities and target accounts.
- Orchestrated Workflows:
Trigger automated prospecting campaigns based on site activity, including emails and social connections.
- Intent-Driven Playbooks:
Enables businesses to Integrate insights to prioritize accounts and orchestrate effective next steps.
- Convert Prospects:
Utilize AI chat for engagement, involving sales when visitors signal readiness for a conversation.
- Attribution & ROI:
Gain real-time visibility into driving ideal customer profile (ICP) traffic, and understanding conversion rates.
- Unified Revenue Team:
Automate handover to sales, enhance pipeline creation efficiency and align sales-marketing efforts.
Warmly Pricing
Warmly offers a free account with access to 500 leads per month. The Business plan, starting at $805 per month, provides users with access to 25,000 leads monthly, offering scalability for growing business needs.
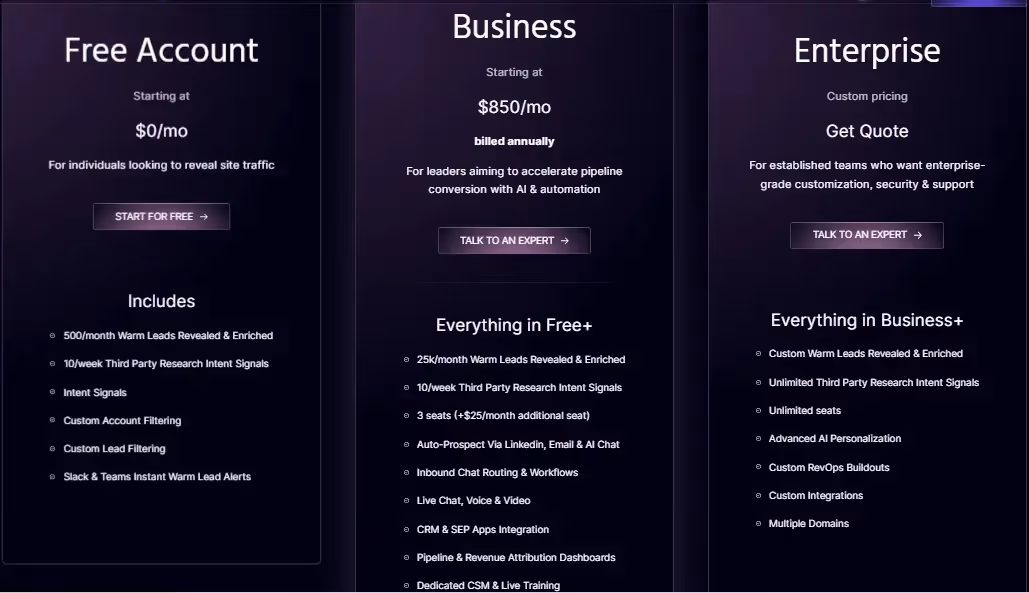
Warmly Limitations
- Bot Traffic and Noise:
Recognizes the challenge of distinguishing valuable leads from bots or short-duration visitors, suggesting a need for enhanced filtering.

- Limited Account Identification:
Some users have pointed out limitations in identifying every user. They have also proposed solutions such as code additions to marketing emails for improved identification.

- Filter Challenges:
Users report occasional difficulty in filters, sometimes displaying existing customers as leads, particularly in intent data.

- Reporting Features Development:
While users acknowledge ongoing development in reporting features, they also anticipate improved data integration into the CRM for more informed decision-making.

2. Leadinfo

Leadinfo Features
- Lead Capture Forms:
Leadinfo facilitates the creation of personalized lead generation forms, leveraging visitor information to increase positive responses and enhance lead conversions.
- Track Browsing Activity:
By tracking visitors' journeys on the website, Leadinfo allows sales and marketing teams to decipher visitor intent, qualifying them as potential leads.
- Intuitive Layout:
Leadinfo adopts an inbox-style layout, akin to email viewing, providing an intuitive overview of each website visitor. This design simplifies the tool, easing teams into its functionality.
- Integrations:
Leadinfo connects with 60+ platforms, including Asana, Discord, Freshworks, Insightly, HubSpot, Zoho, and Slack, among others.
Leadinfo Pricing
The pricing model for Leadinfo is contingent on the total number of monthly unique visitors to your website. Users can input their data into the pricing page to ascertain the corresponding cost.
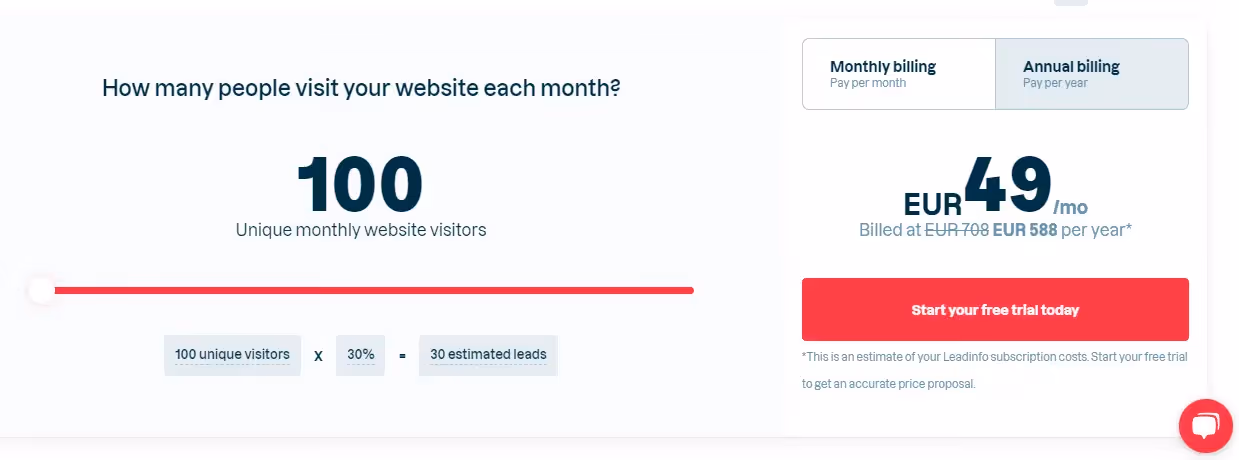
Leadinfo Limitations
- Integration Development:
Enhancements in integration development could amplify functionality, especially in implementing marketing automation. This refinement would streamline the execution of marketing strategies for optimal results.

- Pricing:
While the free demo period offers access to all features, certain functionalities are disabled upon account creation, necessitating a substantial increase in payment. The perceived costliness of Leadinfo is a consideration for potential users.

- Incomplete Prospect Coverage:
Leadinfo may not capture all smaller prospects or clients, potentially limiting its coverage and effectiveness for businesses engaging with a diverse range of prospects.

3. Factors.AI
Factors.AI Features
- Account Identification:
Factors.AI, in collaboration with 6sense, utilizes enterprise-grade IP data to identify up to 64% of anonymous companies. Real-time Slack alerts inform teams of high-intent visitors, configurable based on firmographic features and website behavior.
- Account Timelines:
Integration with campaigns, websites, and CRM data enables Factors.AI to provide end-to-end account-level timelines across the customer journey, offering insights into touchpoints influencing accounts from visitors to paying customers.
- Advanced Analytics:
Beyond account identification, Factors.AI provides advanced analytics features, including ABM analytics for unified reporting across platforms, path analysis for viewing aggregate user behavior, and multi-touch attribution connecting initiatives to the pipeline.
Factors.AI Pricing
Available at $0 per month with no credit card required, the Free plan offers features like identification of up to 100 accounts per month and tracking up to 5,000 monthly visitors, including website intent, account enrichment, B2B website analytics, account journey timelines, custom filters and segments, and real-time intent alerts.
The basic plan is priced at $149 per month (billed annually).
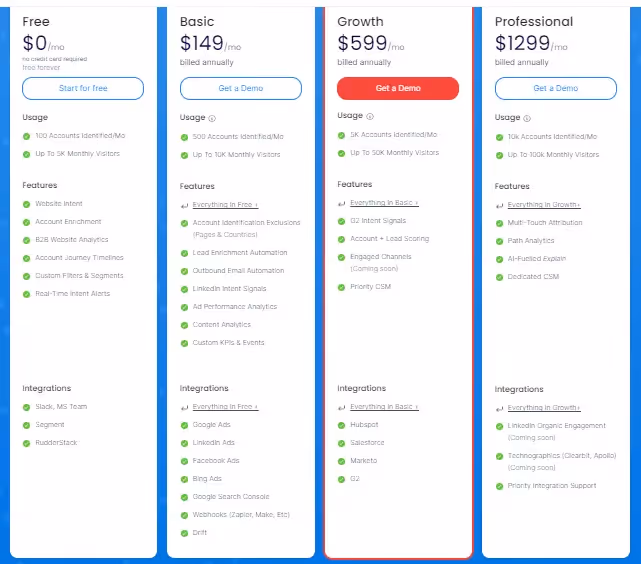
Factors.AI Limitations
- Contact-level Limitations:
For users seeking detailed contact information of individual visitors, Factors.AI falls short due to privacy compliance. Alternative tools with contact-level enrichment may be more suitable for such requirements.
- Limited Documentation and Tutorials:
As per reviews, while the current resources are available, would greatly benefit from being more comprehensive and detailed. Clear and instructive guides would empower users to fully leverage the platform's advanced features, maximizing its potential. Addressing this aspect would contribute to a more user-friendly environment, facilitating a more thorough understanding and utilization of Factors.AI's capabilities.

- User Interface and Experience Enhancement
As per users, an area of consideration is the user interface in Factors.AI, which could benefit from increased intuitiveness, clearer navigation, and visual cues. Improving the overall user experience is crucial for ensuring that new users can swiftly comprehend and effectively utilize the platform's features. Addressing these aspects would contribute to a more user-friendly interface, facilitating a smoother onboarding process and enhancing overall user satisfaction.

- Limited Integration Options
A disadvantage with Factors’ lies in the lower level of integration offered by our platform. Instead of native integrations, we currently rely on webhooks, specifically through Zapier, to push data back into tools that do not have direct integration. While webhooks provide a workaround, the absence of native integrations may pose limitations for users seeking seamless connectivity with a broader array of tools.
{{INLINE_CTA_A}}
4. KickFire - A Foundry Company
KickFire Features
- Intent Data:
Foundry Intent amalgamates website visitor intent from various sources, providing valuable buyer behavior insights. Business teams use this data to confidently create prospecting and outreach campaigns.
- Lead Nurturing:
Foundry's suite facilitates the identification, nurturing, and qualification of sales-ready leads.
- Early Insight:
Sales teams identify purchase intent early, enabling focused efforts on high-potential users and accounts.
- Account-Based Marketing (ABM):
Scale ABM capabilities with Triblio, identifying high-intent accounts based on monthly interactions. This proprietary platform aids in the identification of accounts displaying significant monthly interaction.
- Intent-Driven Identification:
Leverage intent data to identify website visitors displaying buying interest.
- Active Research Recognition:
Identify actively researching buyers for your company.
- Segmentation and Prioritization:
Prioritize the most engaged visitors through effective segmentation.
- Content Discovery Assistance:
Discover resonating content for your audience.
- Data Enrichment:
Enrich various aspects of your technology stack for a comprehensive view.
- Data Normalization:
Normalize data consistently across sales and marketing platforms.
- Free API Key:
Provides a free API key to kickstart the journey of uncovering and prioritizing engaged visitors.
- Integrations:
KickFire offers HubSpot, Salesforce, ConnectWise, and MS Dynamics integrations.
KickFire Pricing
Contact Foundry for a personalized quote as they do not have an open pricing policy.
KickFire Limitations
- Insufficient Filtering for Accuracy:
KickFire lacks robust filtering mechanisms for de-anonymized website visit results. Unlike other solutions that carefully check each visit against multiple indexes and deliver de-anonymized data only when reaching a confidence threshold, KickFire opts for less filtering. This approach increases the likelihood of false positives, where companies may be misidentified, leading to potential inaccuracies in the data provided.
- Dynamic IP Challenges:
Public IP indexes, a key component of KickFire's identification process, face challenges due to the dynamic nature of company IPs. As companies frequently change their IPs, relying solely on public IP indexes may result in discrepancies. Other solutions mitigate this by cross-referencing multiple indexes, ensuring more accurate identification. In KickFire's case, this dynamic environment can lead to misleading data, requiring users to handle additional verification tasks.
- Risk of False Positives:
The limited filtering approach employed by KickFire poses a risk of false positives. In practical scenarios, this may manifest as companies seemingly visiting a website frequently and extensively. However, as illustrated by the example of an ISP/VPN provider, the visits might originate from various entities using the VPN. The burden of discerning accurate visitor details falls on the client, introducing additional workload and potential misinterpretations.
- Manual Handling and Verification Burden:
KickFire's strategy of reduced filtering transfers the responsibility for data accuracy to the client. While this approach allows for capturing a broader range of website activity, it places an increased burden on users to manually handle and verify the identified companies. This manual verification process, as highlighted by the VPN provider instance, demands extra effort and diligence from users to ensure the accuracy of the insights derived from the platform.

5. LeadMagic

LeadMagic Features
- Account Identification:
LeadMagic helps in identifying high-value accounts visiting a website and ensuring timely updates to sales and marketing teams through Slack messages.
- Lead Scoring and Prioritization:
Based on engagement levels, LeadMagic intelligently scores and prioritizes leads, ensuring a focused approach to the most valuable prospects.
- Lead Nurturing and Automated Workflows:
Automate lead nurturing campaigns with LeadMagic to foster relationships with prospects.
- Lead Generation Services:
LeadMagic offers tailored lead generation strategies, lead nurturing and qualification, along with targeted outreach and follow-up.
- Digital Marketing Solutions:
It also offers comprehensive digital marketing solutions. They cover search engine optimization (SEO), social media marketing, and pay-per-click (PPC) advertising, ensuring optimal visibility and engagement for your brand.
- Customer Engagement Programs:
Enables businesses to forge connections with audiences through LeadMagic's customer engagement programs. This service includes personalized email marketing, customer relationship management (CRM) integration, and feedback collection and analysis.
- Strategic Consulting:
LeadMagic specializes in marketing strategy development, data analytics, and insights, along with campaign performance measurement, facilitating informed decision-making for your business.
- Technology Integration:
LeadMagic helps marketing effectiveness through technology integration. From marketing automation implementation to integration with customer data platforms, their solutions leverage innovative technology to streamline marketing efforts.
LeadMagic Pricing
LeadMagic offers pricing based on the number of companies identified monthly, filtering out ISPs and low-quality traffic. Starting at $139 annually upfront, the pricing is tailored to your business size and web traffic.
Pricing for Account Identification with LeadMagic:


LeadMagic Limitations
- Currency Limitation:
Currently, LeadMagic accepts payment in USD, with potential future considerations for billing in AUD.

- Interface Improvement:
The interface has room for enhancement, and developers are actively incorporating customer feedback.

{{INLINE_CTA_A}}
6. Lead Rebel

Lead Rebel Features
- Website Visitor Recognition:
LeadRebel empowers businesses to identify website visitors, offering comprehensive insights into visiting companies. It provides detailed company information, contact details, and key personnel details.
- Integration Process:
The integration process is fairly simple. Adding a small script initiates the tracking process, effortlessly deanonymizing web traffic and providing valuable insights.
- GDPR Compliance:
Respecting GDPR standards, LeadRebel identifies only commercial visitors at the organizational level. Data is sourced from open channels, ensuring 100% GDPR compatibility.
- Tracking and Analysis:
Enable tracking and analysis of visitor behavior, gaining insights into their intentions and interactions with the website, facilitating informed decision-making.
- Detailed Company Information:
LeadRebel furnishes comprehensive information about visiting companies, encompassing name, industry, geography, size, description, and contact data. It aids in identifying ideal contact persons within each company.
- Lead Export and CRM Integration:
Export leads in various formats and integrate with CRM and email campaign software like Hubspot, Salesforce, Zoho, and ActiveCampaigns through APIs.
- Video recording of Website Visits:
The video recording feature allows businesses to observe visitor interactions with their website, providing insights for optimization.
- API and Zapier Integration:
LeadRebel offers API and Zapier integration for third-party software integration, catering to specific business requirements.

Lead Rebel Pricing
LeadRebel offers its software for just 49 Euros/Month, with a 14-day free premium version trial.

Lead Rebel Limitations
- Location Accuracy:
As per users, some location information may need to be more accurate.

- Limited Integration:
LeadRebel currently supports only DACH, with a limited number of integrations.

7. Snitcher

Snitcher Features
- Real-time Account Identification and Tracking:
Snitcher employs cutting-edge identification technology for the real-time tracking of anonymous website visitors. These insights enable effective engagement with potential leads.
- Lead Discovery, Qualification, and Prioritization for Sales Teams:
Sales teams benefit from Snitcher's capability to discover, qualify, and prioritize high-intent target leads. Real-time notifications keep teams ahead of the competition, efficiently filling the sales pipeline.
- Account-Focused Marketing Insights:
Focusing on accounts, Snitcher provides marketing teams insights into engaging their target audience. This enhances website personalization, improving re-targeting efforts and driving more conversions.
- White-Label Solution for Agencies:
Agencies leverage Snitcher's white-label solution for early insights, additional revenue streams, and qualified leads. This enhances client ROI and elevates the agency's value proposition.
- Integration with Over 5,000 Apps:
Snitcher integrates with over 5,000 apps, enhancing campaigns and sales pipelines. This helps streamline processes and workflows.
- Real-time Identification API - Spotter:
Spotter, Snitcher's real-time identification API, offers users full control. It empowers users to utilize identification data flexibly and customize its application.
- Customer Support:
Snitcher offers good data quality, responsive customer support, and frequent feature updates.
- Drive More Revenue from Existing Budgets:
Snitcher equips B2B sales and marketing teams worldwide with insights to optimize campaigns and enhance revenue generation efforts.

Snitcher Pricing
Snitcher offers pricing that is tailored to your needs, starting at USD 39 per month. The platform offers an estimate based on your business size and web traffic. Users can also use the 14-day free trial before getting started.

Snitcher Limitations
- Pricing Concerns
The pricing may seem a bit high for smaller organizations. Allowing subscriptions to lower plans with performance visibility would address this concern.

- Unpredictable Costs
Paying per identified visitor, with no upper limits, could lead to concerns about potentially large bills with a surge in web traffic in a given month.

- Categorization Challenges
Snitcher sometimes faces challenges categorizing businesses accurately, resulting in businesses from one industry appearing in multiple categories.

- URL and Industry Details
Under company details, sometimes the URL doesn't work due to HTTP/HTTPS issues. Improvements in this aspect, along with visible industries in company details, would enhance user experience.

{{INLINE_CTA_A}}
8. SalesIntel

SalesIntel Features
- Verified Contact Data:
SalesIntel provides verified and accurate contact data for key decision-makers, facilitating effective outreach to targeted prospects.
- Company Data Enrichment:
Comprehensive company data enrichment services offer insights into target companies, including firmographic information and key contacts.
- Intent Data:
SalesIntel's intent data provides insights into the online behavior of potential prospects, enhancing their understanding of their interests and needs.
- Technographic Data:
By offering technographic data, SalesIntel helps identify the technology stack and tools used by target companies, enabling tailored sales and marketing strategies.
- Data Hygiene and Compliance:
SalesIntel ensures data hygiene and compliance with data protection regulations, providing peace of mind regarding the quality and legal aspects of the data used.
- API Integration:
API integration allows access to SalesIntel's data directly within CRM and marketing automation platforms, enhancing the efficiency of sales and marketing processes.
Sales Intel Pricing
Sales Intel offers a free 14-day trial to explore its features. Under the individual plan, priced at $69/month, users can find prospects, build lists, and enhance deal closures.

Sales Intel Limitations
- Slow Website and Navigation:
While easy, the website and search process is slow and cumbersome, attributed to the vast information. This can make gathering and exporting contacts time-consuming.
- Limitations on Requesting Additional Information:
There is no way to request additional information for contacts that are already "human-verified," limiting flexibility, especially when direct numbers are lacking

- LinkedIn Integration:
Integration with LinkedIn for verified contacts could be improved to streamline the process, reducing the need for manual data entry into Salesforce.

- Selection Limitation and Download Process:
With a download limit of 100,000, selecting contacts for download can be challenging. The process of managing credits for downloads could be more user-friendly.
9. User.com

User.com Features
- Omnichannel Communication Experience:
User.com offers a comprehensive platform for delivering personalized messages through various channels, optimizing engagement for sales and customer support.
- Easy Team Collaboration:
Facilitating team collaboration, User.com invites members with diverse permission levels to work together on campaigns, automation, and audience lists.
- Hundreds of Integrations:
Empowering teams with dynamic data, User.com integrates with hundreds of apps, enabling access to favorite tools and enhancing workflow efficiency.
- Security and Privacy:
GDPR and CCPA-compliant, User.com prioritizes security, with SSL certification, SOC 2 Type 2 certification, and regular penetration testing, ensuring privacy for user and customer data.
- Customer Success Support:
User.com provides one-on-one coaching, and daily and weekly support, assisting teams in achieving goals through expert guidance on marketing, sales, and product.
- Engaging Multi-Channel Campaigns:
Enabling the planning of customer journey emails and multiple paths based on user engagement, User.com triggers specified actions instantly.
- Automation and Intelligent Automation Workspace:
The drag-and-drop builder and automation capabilities allow businesses to efficiently handle repetitive tasks and create custom triggers, actions, and conditions.
- Better Data Insights:
User.com offers enhanced user insights through behavior tracking, custom events, and engaging timelines, resulting in a more responsive audience.
- Targeted Campaigns:
With a powerful filter engine, User.com enables targeting based on various data parameters, facilitating highly effective and targeted campaigns.

User.com Pricing
Pricing details for User.com are not available at the time of writing this article.
User.com Limitations
- Live Chat Issues:
Some clients reported bugs in the Live Chat widget, leading to the decision to use an alternative platform for live chat support.

- Workflow Impact:
Various post and ad processing slightly impact workflow and processing time, suggesting regular updates address this.

- UX Challenges:
Users find the user experience (UX) challenging, making navigation difficult, especially compared to platforms like Intercom and Zendesk.
- Complex Processes:
The platform tends to complicate simple processes, requiring extra effort to overcome challenges and limiting the focus on customer support.
- Feature Limitations:
Although User.com provides many features, they are perceived as basic or limited, often requiring workarounds for missing functionalities.
- Hidden Charges:
Users mention hidden charges for attached files in letters/chats, not disclosed on the pricing page, raising concerns about transparency.
- Billing Concerns:
Complaints about inflexibility in billing, such as being charged for the entire month despite discontinuing use on the first day of the month.
{{INLINE_CTA_A}}
10. Happierleads

Happierleads Features
- Prospector:
HappierLeads' Prospector identifies prospects based on Ideal Customer Profile (ICP) criteria, offering comprehensive details like direct-dial phone numbers, updated business emails, job titles, and more for over 60 million businesses.
- Segment & Qualify:
Empowering sales and marketing teams, HappierLeads allows the segmentation of accounts and leads based on ICP, utilizing behavioral and demographic filters. The platform assigns scores based on website activity, simplifying the identification of high-fit, high-intent accounts.
- Email Outreach:
Facilitating internal email campaigns and outreach, HappierLeads provides a dedicated tool for prospecting and outreach, eliminating the need for data export to external platforms.
- Integrations:
HappierLeads integrates with popular platforms like Zapier, HubSpot, and Fullstory, enhancing its functionality and compatibility.

Happierleads Pricing
The free trial starts at $0 for a 7-day trial period, while the basic plan starts at $120 per month, billed annually.

Happierleads Limitations
- Identification Limitation:
While HappierLeads excels in identifying companies, it lacks the ability to pinpoint the individual accessing information. This limitation may pose challenges in reaching the right person within large organizations.

- Journey Visibility:
The platform offers limited visibility into potential customers' journeys, and the navigation through a set of cards for activity details may be less intuitive. Export options, while extensive, might risk losing crucial information like visit time and page details.

- Engagement Analytics:
HappierLeads has room to improve in engagement analytics, with users expressing a desire for more detailed information on specific site interactions, such as clicked CTAs, time spent on pages, and scrolling behavior.

Top Pearl Diver Alternatives
Businesses looking to enhance website visitor identification and lead conversion can explore these alternatives.
1. Leading Alternatives: HubSpot Sales Hub for sales analytics, ZoomInfo Sales for B2B data, Lead Forensics for anonymous visitor tracking, Apollo.io for prospecting, and SalesIntel for human-verified contact data.
2. Key Features: Lead management, data enrichment, CRM integration, and real-time visitor insights.
3. Decision Factors: Geographic coverage, data accuracy, integration capabilities, and user experience.
Choosing the right platform ensures better lead generation, improved targeting, and higher conversion rates.
Choosing the Right Fit
The selection among these alternatives ultimately depends on the specific needs, priorities, and goals of each business. Organizations should conduct thorough evaluations, considering factors such as geographic coverage, integration capabilities, user experience, scalability, compliance, cost-effectiveness, and customer support. By aligning the choice with these considerations, businesses can make informed decisions and leverage a web analytics solution that best suits their requirements in 2024.
{{INLINE_CTA_A}}

What is Predictive Marketing Analytics: A Beginner’s Guide
Learn how predictive marketing analytics helps B2B companies improve lead scoring, optimize campaigns, and make data-driven decisions for better ROI.
TL;DR
- Predictive marketing analytics uses past and current data to predict future marketing results, helping B2B companies make better decisions quickly.
- It allows for accurate lead scoring, effective account-based marketing, and precise sales forecasting, guiding marketing and sales teams to focus on the best opportunities.
- The process includes gathering quality data, creating predictive models (like regression and classification), and applying insights directly to marketing tasks.
- Success relies on setting clear goals, building cross-functional teams, selecting the right tools, and ensuring strong data management.
- Challenges like data silos, skill shortages, and model accuracy can be tackled with a good strategy and ongoing improvement.
- Measuring ROI is key. Monitor KPIs like conversion rates, customer retention, and campaign success.
- By using predictive analytics in B2B marketing, you can achieve higher efficiency, better customer experiences, and steady revenue growth.
Imagine nurturing leads for months, only to find that most don't convert. For B2B marketers, this is a common issue: lost time, wasted budget, and missed revenue. The main problem? Decisions based on guesses instead of data. As competition grows and buyer journeys become more complex, relying on intuition alone puts you behind.
Predictive marketing analytics offers a solution. Using historical and real-time data helps B2B organizations forecast outcomes, focus on high-value leads, and improve every stage of the marketing funnel. This guide will cover the basics of predictive marketing analytics for B2B, helping you shift from reactive to proactive and turn your data into a competitive edge.
What is Predictive Marketing?
As is evident from the name, Predictive Marketing helps marketers predict their marketing outcomes in terms of expected traffic, expected leads, conversions and impact on ROI at various touch-points
In other words, predictive marketing is the process of forecasting the influence of marketing campaigns and tactics with the help of:
- Historical data on audience behaviour
- Consumer research
- Purchasing history of target consumers
- Holistic marketing analytics
This forecasting is done using predictive analytics. B2C/E-commerce firms like H&M and Amazon already use this to predict products that their consumers would be interested in buying based on their current search keywords and products that they are clicking and opening in the catalogue, their past purchases, what other products similar consumers have purchased after similar search queries, purchases, items, etc
What is Predictive Marketing Analytics?
Predictive marketing analytics uses statistical models, machine learning, and past data to forecast future marketing outcomes and guide decisions. In B2B settings, it involves analyzing past customer interactions, campaign results, and sales data to predict which leads might convert, which accounts may leave, or which marketing activities will yield the best return.
Traditional analytics report what happened. Predictive marketing analytics answers ‘what will happen next?’ It can estimate the likelihood of a prospect becoming a customer or forecast future sales. With these insights, B2B marketers can prioritize resources, personalize outreach, and improve campaigns.
Predictive marketing analytics turns raw data into useful insights, helping you anticipate trends, reduce waste, and make smarter decisions. This approach is crucial for B2B organizations aiming to grow and stay competitive in a data-driven market.
{{INLINE_TOFU}}
How Predictive Marketing Analytics Powers Data-Driven Decision Making?
Predictive marketing analytics transforms how B2B organizations make decisions by focusing on evidence-based strategies. Instead of relying on gut feelings, you use predictive models to foresee buyer behavior, campaign results, and sales trends. For instance, by examining patterns in your CRM and marketing data, predictive analytics can show which leads are likely to convert or which accounts might leave.
This data-driven approach allows for better targeting, resource use, and forecasting. Marketing teams can focus on high-value accounts, time campaigns well, and tailor messages to predicted needs. Sales teams get more accurate forecasts and can target the best opportunities. Predictive marketing analytics helps you act ahead of time, cut unnecessary spending, and achieve measurable results. By using predictive insights in your decision-making, your organization can quickly adapt to market changes and grow steadily.
Key Components of Predictive Marketing Analytics
To succeed with predictive marketing analytics in B2B, focus on three main components: data collection and integration, predictive modeling techniques, and deployment with action.
1. Data Collection and Integration
Gather and unify data from multiple sources, such as CRMs, marketing automation platforms, website analytics, ad platforms, and sales databases. Clean, consistent, and enriched data is foundational for accurate predictions.
2. Data Enrichment and Quality Control
Before modeling, ensure your data is unified and enriched with external signals (e.g., firmographics, technographics, intent data). Remove duplicates, fill gaps, and standardize formats to increase predictive accuracy.
3. Predictive Modeling Techniques
Use machine learning and statistical methods to uncover patterns:
- Regression for forecasting values like revenue or deal size.
- Classification to predict the likelihood of conversion or churn.
- Clustering to group accounts or leads based on behavior or profile.
4. Deployment and Operationalization
Apply predictive insights to real workflows. Examples include:
- Lead scoring in your CRM.
- Triggered sales alerts for at-risk accounts.
- Personalization in campaigns based on behavioral predictions.
5. Continuous Feedback and Model Optimization
Predictive models are not ‘set and forget.’ Monitor performance regularly, gather feedback from sales and marketing teams, and retrain models with new data to maintain relevance and improve accuracy over time.
Here is a guide describing the process of implementing predictive marketing analytics to drive b2b growth.
Measurement Models for Predictive Analytics
- Cluster Models: These models are used to segment consumer based on behavioural data (past purchases, brand engagement, etc) and demographic data. The most common predictive algorithms used for clustering are behavioural clustering, product-based clustering, and brand-based clustering.
- Propensity Models: As the name suggests, these models are used to evaluate consumers’ tendencies or inclinations to act/engage in specific way. These model evaluate the likelihood of a consumer to purchase, convert, etc.
- Recommendation Filtering: H&M, Amazon and Netflix are some of the most common examples of firm's that use recommendation filtering. It refers to using past purchases or consumption history to find other sales/revenue opportunities.
Use Cases for Predictive Marketing Analytics For B2B Marketers
Predictive marketing analytics provides real value in B2B by addressing key issues in sales and marketing.
1. Lead Scoring and Qualification
Predictive analytics ranks prospects based on their likelihood to convert, using historical behavior and demographic data. This helps sales teams prioritize the most promising leads and reduce time spent on poor-fit prospects.
2. Account-Based Marketing Optimization
By identifying which target accounts are most likely to engage, predictive tools help marketers personalize campaigns and prioritize outreach. This improves engagement rates and increases efficiency in ABM strategies.
3. Customer Churn Prediction and Retention
Predictive models detect signs of customer dissatisfaction or drop-off risk. Teams can then take proactive steps, like personalized support or re-engagement campaigns, to improve retention and reduce churn.
4. Sales Forecasting and Pipeline Management
Predictive analytics estimates which deals are likely to close and when, enabling accurate revenue forecasting and smarter resource allocation. This supports more strategic planning and reduces surprises.
5. Campaign Performance Prediction
By analyzing past campaign data, predictive models forecast which future marketing strategies will deliver the best ROI. This allows for better budget allocation and more effective campaign planning.
6. Automated social suggestions
Predictive analytics can also analyze audience engagement trends across social channels to suggest the best times to post content, provide content suggestions, and conduct granular A/B testing of two or more variations of content to predict which one performs better.
7. Predictive SEO
In addition to improving traffic and SERP rankings, predictive analytics like search trend insights can also prevent the loss of SEO momentum and ranking. Essentially, predictive SEO helps you determine if a webpage is about to lose its SERP rankings and predict topics for blog posts that your audience wants more of.
By applying predictive marketing analytics to these areas, B2B organizations can work more efficiently, increase conversion rates, and achieve steady growth throughout the customer lifecycle.
How to Build a Predictive Marketing Analytics Strategy?
Here’s how to build a predictive marketing strategy for your B2B business:
1. Define Clear Business Goals
Start with specific goals tied to marketing and sales outcomes, such as increasing qualified leads, improving win rates, reducing churn, or boosting customer lifetime value. These goals will shape how you use predictive analytics and what success looks like.
Also, read the blog on lead tracking methods to learn how to qualify leads and prospects.
2. Set Measurable KPIs
Identify performance indicators that align with your goals. Common KPIs include lead-to-opportunity conversion rate, average sales cycle length, customer retention rate, and forecast accuracy. These help track progress and measure the impact of predictive efforts.
3. Assemble a Cross-Functional Team
Bring together data analysts, marketers, sales leaders, and RevOps professionals. Data experts handle modeling, while marketers and sales teams offer context and ensure insights translate into action. Collaboration keeps your strategy grounded in real-world needs.
4. Choose the Right Tools and Platforms
Select predictive analytics tools that integrate well with your existing tech stack, especially your CRM (like Salesforce or HubSpot), marketing automation tools, and customer databases. Look for features like lead scoring, campaign forecasting, and segmentation modeling.
5. Ensure Data Quality and Compliance
Reliable predictions require clean, consistent, and compliant data. Establish clear rules for data collection, validation, and storage. Ensure your practices comply with regulations like GDPR or CCPA when handling sensitive customer data.
6. Test and Refine Predictive Models
Predictive models need regular tuning. Run tests on model performance, gather feedback from your teams, and adjust inputs or thresholds as needed. This helps prevent bias, adapt to changes in buyer behavior, and improve model accuracy over time.
7. Enable Cross-Team Collaboration
Encourage open communication between marketing, sales, and analytics teams. Share insights regularly, translate findings into action plans, and ensure accountability. A shared understanding improves execution and boosts adoption of analytics-driven decisions.
8. Focus on Actionable Outcomes
Don’t just build dashboards, ensure your predictions lead to real changes. For example, prioritize outreach based on lead scores, adjust targeting based on churn risk, or personalize content based on account behavior. The value comes from using predictions to act smarter and faster.
Common Pitfalls in B2B Predictive Marketing Analytics
Implementing predictive marketing analytics in B2B has its challenges. Some are:
1. Fixing Data Quality and Integration Issues
B2B data is often fragmented across CRMs, marketing automation tools, and external platforms. This leads to inconsistencies that hurt prediction accuracy. Start by consolidating your data into a unified system and use data cleaning protocols to maintain accuracy and consistency.
2. Dealing with Limited Sample Sizes
B2B businesses typically have fewer transactions than B2C, which limits the volume of training data for models. To overcome this, focus on quality over quantity and supplement your internal data with third-party intent or industry data to enrich your insights.
3. Breaking Down Organizational Silos
Lack of collaboration between marketing, sales, and data teams slows down adoption. Promote cross-team collaboration by sharing dashboards, insights, and KPIs. A shared view of customer data boosts transparency and trust in analytics-driven decisions.
4. Avoiding Overfitting to Outdated Data
Predictive models trained on outdated or limited historical data may fail to reflect current buyer behavior. Regularly retrain and validate your models using the latest data to keep them aligned with changing market conditions.
5. Managing Privacy and Compliance Risks
Using personal and behavioral data requires strict adherence to regulations like GDPR and CCPA. Make sure your team understands compliance rules and uses secure tools. Invest in systems that allow for consent tracking, anonymization, and audit trails.
6. Starting with Pilot Projects
Instead of deploying predictive analytics across your entire operation, begin with small-scale pilot projects, like lead scoring or churn prediction. Show quick wins to build confidence internally and gather feedback for refining your strategy before scaling up.
7. Building Internal Trust in Predictive Insights
Skepticism from stakeholders can hinder adoption. Share results clearly, explain how predictions are generated, and show real business impact. Involve end-users in the feedback loop to increase trust and buy-in.
By addressing these challenges directly, your B2B organization can fully harness predictive marketing analytics and achieve more reliable, actionable results.
Best Practices in Adopting Predictive Marketing Analytics
Some of the best practices you can use while adopting predictive marketing analytics are:
1. Start with a Clear Business Problem
Begin by identifying a specific challenge, such as improving lead quality, reducing churn, or forecasting revenue. Avoid applying analytics without a purpose. Tying models to real business goals increases focus and impact.
2. Involve Sales and Marketing Early
Predictive success depends on cross-functional collaboration. Involve both sales and marketing teams from the start to ensure alignment, shared ownership, and consistent adoption of insights.
3. Prioritize Data Quality and Integration
Accurate predictions require clean, unified data. Integrate key data sources, like CRM, marketing automation, and web analytics, to implement ongoing processes for deduplication, validation, and accuracy checks.
4. Choose Scalable, User-Friendly Tools
Select analytics platforms that align with your team’s technical capabilities. Look for solutions that are easy to integrate and scale with your organization’s growth.
5. Invest in Continuous Training
Educate teams on how predictive analytics works and how to use the insights in their day-to-day decisions. Ongoing training builds confidence and fosters adoption.
6. Define and Track Clear KPIs
Establish measurable success metrics such as MQL-to-SQL conversion rate, churn reduction, or forecast accuracy. Use these KPIs to assess performance and guide optimization efforts.
7. Share Insights with Dashboards
Use real-time dashboards to make predictions and results accessible across departments. Visibility fosters transparency, encourages collaboration, and drives action.
8. Continuously Update Your Models
Market dynamics and buyer behavior change. Regularly review and retrain models using fresh data and feedback to keep predictions relevant and accurate.
9. Encourage a Culture of Experimentation
Support a test-and-learn mindset. Run small experiments, measure impact, and iterate based on results. This agile approach ensures continual improvement and greater ROI.
Wrapping Up: Why Predictive Marketing Analytics is a Must-Have?
Predictive marketing analytics is key for B2B companies to stay competitive and make smarter decisions. By using past and current data, you can foresee customer needs, improve campaigns, and focus on valuable accounts more accurately. The real benefit comes from linking your data, teams, and technology to build a smooth, insight-driven marketing system. This journey needs investment in data quality, the right talent, and ongoing model updates, but the rewards are clear: better conversion rates, improved customer retention, and more efficient resource use.
Predictive marketing analytics is not a one-time task but a process that grows with your business. By integrating predictive insights into your daily work and decisions, you'll not only boost marketing results but also support steady growth. See predictive marketing analytics as a strategic tool, and you'll be ready for the challenges and opportunities in today's B2B world.

Predictive Lead Scoring: How AI Helps Optimize Sales and Marketing
Discover how predictive lead scoring, powered by AI, is revolutionizing sales and marketing. Get insights on data-driven lead strategies.
Sales and marketing teams struggle to identify and prioritize leads that are highly likely to convert. Manually scoring leads is time-consuming and often results in guessing and methodology inconsistencies.
What if there was a way to automatically score leads based on their conversion likelihood using data-driven insights and machine learning algorithms? This would allow teams to focus on the most promising prospects, personalize outreach, and improve conversion rates significantly.
The answer—predictive lead scoring.
Predictive lead scoring optimizes lead management by identifying leads most likely to convert using AI and historical data. This article will explore predictive lead scoring, its benefits, and how it transforms lead management strategies.
What is Predictive Lead Scoring?

At its core, predictive lead scoring ranks leads based on their likelihood of converting into customers.
It’s a modern approach, evolved from traditional, manual lead-scoring methods.
Previously, sales and marketing teams manually assigned scores to leads based on factors like demographic information and behavior.
This approach was time-consuming and often relied on gut instincts rather than data.
But, as platforms became more advanced, so did their methodologies for lead scoring. In recent years, many platforms have also started using AI to power their lead scoring instead of rule-based scores.
Most lead scoring models use the following pieces of data to make sense of what stage of the buyer’s journey the lead could be at:
- CRM data
- Website behavior
- Social media interactions
- Email Engagement
- Demographic information
With this data, AI algorithms can identify patterns and correlations that indicate a lead’s likelihood of converting. You can use a lead scoring tool to identify and prioritize customers interested in your product.
The idea behind predictive lead scoring is to eliminate the unnecessary blockers that slows and help them make real-time decisions based on the right data. Let’s further explore the benefits of predictive lead scoring
5 Benefits of Predictive Lead Scoring
Predictive lead scoring can be quite powerful and lead to several impactful benefits, including:
- Increased Efficiency: When you prioritize leads based on their likelihood of conversion, your sales team can focus their time and resources on the most promising opportunities. This leads to higher conversion rates, shorter sales cycles, and improved efficiency.
- Better Alignment Between Sales and Marketing: Predictive lead scoring helps bridge the gap between sales and marketing teams. Once you establish a common framework for evaluation, both teams can work together more effectively, ensuring that marketing efforts generate high-quality leads and sales teams follow up on the most valuable prospects.
- Personalized Engagement: You can tailor your engagement strategies to match the preferences and needs of individual leads. , When you know what influences a prospect’s buying decision, you can deliver targeted content, personalized offers, and customized communication that resonates with each lead, increasing the likelihood of conversion.
- Improved Resource Allocation: When you can predict which leads are most likely to convert, you can easily move resources from other leads to focus on them.
- Data-Driven Decision Making: Instead of relying on guesswork and intuition, predictive lead scoring helps you base your decisions on actual customer behavior and preferences. Basing decisions on objective data can help you optimize your sales and marketing strategies, identify areas for improvement, and continuously refine your approach.
Implementing predictive lead scoring has various other benefits that you realize as you start using it within your day-to-day workflows.
Let’s now see how predictive lead scoring works.
How Predictive Lead Scoring Works
Let's examine the process of predictive lead scoring and how it uses data, analytics, and automation to identify and prioritize the leads most likely to become customers. We'll explain each step so you can understand how it all fits together.
1. Know Your Leads
Collect detailed information about your leads from different sources. This includes basic data like job titles and company size, activity data like website visits and email engagement, and any other information that helps you understand their needs, interests, and buying likelihood.
The better you know your leads, the easier it is to evaluate their potential.
2. Add Mined Information
You can improve your lead data by using data mining techniques and adding information from third-party data sources. This means pulling valuable insights from unorganized data like social media posts and web forums and combining them with the lead records you already have. You can find hidden patterns, connections, and details that make your lead-scoring model more accurate.
3. Apply Predictive Analytics
Now, here's where things get interesting. Once you have the improved lead data, you can use predictive analytics algorithms. These algorithms look at past data to find the main factors and patterns that match up with successful conversions.
Suppose your historical purchase data shows that leads from the healthcare industry who visit your pricing page or attend a webinar are 80% more likely to convert than the average lead.
Predictive analytics algorithms can detect this pattern and assign a higher lead score to prospects who exhibit similar behavior.
Using methods like logistic regression, decision trees, and machine learning, you can create a predictive model that gives each lead a score based on how likely they are to convert.
4. Identify Sales Ready Leads
After the predictive model is set up, you can use it on your current lead database to create scores for each lead. These scores show how likely a lead is to become a customer, with higher scores meaning a better chance of conversion.
With this information, you can rank and group your leads based on their buying readiness so your team can focus on the most promising opportunities.
5. Prioritize Highest Value Leads
The leads with the highest scores are the real standouts—they're the most valuable and ready to buy. These are the people whose traits and behaviors most closely match successful conversions in the past.
These high-value leads can help your sales team make the most of their time and resources, increasing their chances of closing deals and growing revenue.
The above steps are automatically handled with predictive lead scoring after you integrate the data.
The result is a ranked list of the high-fit and high-intent leads.
This helps your sales team target the right leads at the right time with personalized outreach strategies. Predictive lead scoring also helps achieve higher conversion rates and grow your business, as your team can connect with potential leads while they’re still hot.
{{INLINE_TOFU}}
What Data is Used for Predictive Lead Scoring?
Creating an effective predictive lead scoring model requires considering a wide range of factors influencing a lead’s likelihood to convert. These factors can be grouped into several categories:
Demographic Data
Demographic information, such as age, location, industry, and company size, can provide valuable insights into a lead’s potential fit for your product or service. For example, if you’re selling enterprise software, leads from larger companies may be more likely to convert than those from small businesses.
Behavioral Signals
A lead’s behavior can tell you a lot about their level of interest and engagement with your brand. Some key behavioral signals to consider include:
- Website visits: How often does a lead visit your website, and which pages do they view?
- Content engagement: Do they download whitepapers, attend webinars, or engage with your blog posts?
- Email interactions: Do they open and click through your emails?
- Social media activity: Do they follow your company on social media or engage with your posts?
External Data Sources
Predictive lead scoring models can also incorporate information from external sources, in addition to data from your systems, such as:
- Social media data: Insights from a lead’s social media profiles and activity can provide valuable context about their interests and behavior. You can even use intent data to drive your pipeline further.
- Third-party data providers: Companies like Clearbit and 6sense can provide additional firmographic and technographic data to enrich your lead profiles. Factors integrates with both the data providers, helping you reveal an industry-leading 64%+ anonymous accounts.
When put together, you get a complete picture of the journey of the lead going from
Challenges with Predictive Lead Scoring
While AI-powered lead scoring can be a powerful tool, there are also some challenges and considerations to keep in mind:
Highly Dependent on Data Quality
The accuracy of predictive lead scoring models depends heavily on the quality of the data they’re trained on. If the data is incomplete, inconsistent, or inaccurate, the model’s predictions will be less reliable. Ensuring that data is properly collected, cleaned, and maintained is crucial.
Regular Model Training
Predictive models require continuous refinement and retraining to stay accurate as new data comes in. This means that implementing AI-powered lead scoring is not a one-and-done process, but rather an ongoing commitment.
Cannot Replace Human Judgment
While AI can provide valuable insights and predictions, it’s important to remember that it’s ultimately a tool to augment human decision-making, not replace it entirely. Sales and marketing teams should use AI-powered lead scoring as one input among many when prioritizing their efforts.
Take Advantage of Predictive Lead Scoring!
Predictive lead scoring offers clear benefits: it increases conversion rates, shortens sales cycles, improves sales and marketing alignment, and optimizes resource allocation.
However, it is a challenge to implement.
You must either rely on internal developer resources and sufficient data to ensure success or partner with third-party tools specializing in this area and have access to extensive datasets for accurate lead scoring and account intelligence features.
Enter Factors.
A powerful platform that combines data from across your marketing stack and channels to get you the best insights under a single roof. Factors automatically assigns lead scores based on data from your CRM and the ads you run, the pages your visitors view, and more to give you a holistic score that considers as much relevant data as possible.
Factors also partners with Clearbit and 6sense to help you reveal anonymous accounts browsing your website or interacting with other marketing channels, which enhances your account-based marketing.
Get ready to level up your marketing stack. Hop on a demo call with Factors and see how you can benefit from Factors today!

Predictive Account Scoring Vs. Manual Account Scoring: A Comparison
Compare predictive account scoring and manual account scoring methods. Learn how to choose the right model for your B2B team and improve sales efficiency.

TL;DR
- Predictive account scoring utilizes machine learning to analyze large, dynamic datasets and identify which accounts are most likely to convert.
- It delivers higher accuracy, scalability, and adaptability, making it ideal for data-rich, growth-focused B2B organizations.
- Manual account scoring is rule-based and relies on human judgment, making it easy to implement but prone to bias, limited in data use, and challenging to scale. It's ideal for smaller B2B teams just starting out with account prioritization.
- As teams mature, many start with manual scoring and transition to predictive models to drive efficiency, reduce bias, and improve alignment between sales and marketing.
Many B2B teams waste up to one-third of their resources chasing accounts that never convert, resulting in stalled pipelines and low ROI. Manual scoring compounds the problem; it’s slow, biased, and doesn’t scale.
Predictive account scoring, on the other hand, uses machine-learning models and rich data signals to:
- Remove bias by standardizing criteria
- Scale instantly as your account list grows
- Speed up decisions by highlighting high-value accounts in real time
That means shorter sales cycles, higher close rates, and smarter budget allocation.
In this guide, you’ll learn how to:
- Select the right scoring approach for your team
- Compare manual vs. predictive scoring to determine which method maximizes pipeline efficiency and ROI.
What is Account Scoring?
Account scoring lets B2B sales and marketing teams zero in on the companies most likely to convert.
By analyzing firmographic, behavioral, and intent data against your Ideal Customer Profile (ICP), it ranks target accounts by their conversion potential. This prioritization helps you:
- Focus outreach on high-value accounts rather than chasing every lead.
- Engage the most promising prospects first, driving higher win rates.
- Create a shared, data-backed view of account priorities across sales and marketing.
In short, account scoring converts your raw data into a roadmap for efficient, revenue-focused growth.
Understanding Predictive Account Scoring vs. Manual Account Scoring
Predictive account scoring uses machine learning to analyze large volumes of historical and real-time data, scoring accounts based on their likelihood to convert. It continuously improves with new inputs, minimizing human error and bias.
This automated method enables B2B teams to prioritize efficiently, improve cross-functional alignment, and respond to market changes with greater agility.
Manual account scoring relies on human judgment to rank accounts based on fixed criteria like company size, industry, or past interactions. Teams define rules and assign weights, then assign scores.
This method offers control and transparency but is labor-intensive, prone to bias, and lacks scalability. It's best suited for smaller datasets or teams just beginning to prioritize accounts systematically.
{{INLINE_BOFU}}
Predictive Account Scoring vs. Manual Account Scoring: A Detailed Comparison
When comparing account scoring methods and models, it's essential to break them down by their core features and functionalities. Here’s how predictive scoring stacks up against manual scoring across key dimensions:
1. Data Handling & Inputs
- Manual Account Scoring:
Relies on limited, predefined criteria, such as company size, industry, or past interactions. These are selected and weighted manually, often based on intuition or fundamental historical analysis. Input data is usually static and prone to becoming outdated. - Predictive Account Scoring:
Ingests large volumes of diverse data, including firmographics, technographics, intent signals, engagement metrics, CRM data, and even data from third-party sources. Uses machine learning to dynamically update inputs and prioritize what truly matters based on real conversion patterns.
2. Scoring Logic & Methodology
- Manual Account Scoring:
Uses rule-based logic with static weight assignments (e.g., “+10 points for companies with over 500 employees”). While simple, it lacks flexibility and fails to uncover deeper patterns in data. - Predictive Account Scoring:
Applies statistical and machine learning models to uncover complex relationships between data points. Scoring is based on patterns from successful past deals and automatically recalibrates as those patterns evolve.
3. Scalability
- Manual Account Scoring:
Works well for small datasets, but becomes more complex as the data volume increases. Re-scoring hundreds or thousands of accounts manually is time-consuming and inefficient. - Predictive Account Scoring:
Built to scale effortlessly. Can process and score thousands of accounts in real-time, without manual input. Ideal for fast-growing B2B teams with expanding data ecosystems.
4. Accuracy & Bias Reduction
- Manual Account Scoring:
Subject to human bias, inconsistency, and oversimplification. Accuracy is highly dependent on the judgment of the team assigning scores. - Predictive Account Scoring:
Reduces human bias by relying on actual data-driven outcomes. Identifies subtle indicators of intent or readiness that manual methods may miss, resulting in more precise targeting.
5. Adaptability to Change
- Manual Account Scoring:
Requires periodic reviews and manual updates to scoring criteria when market conditions shift or new insights emerge. Slow to respond to change. - Predictive Account Scoring:
Continuously adapts as new data comes in. Models can evolve in near real-time, making them highly responsive to shifts in buyer behavior, trends, or competitive dynamics.
6. Team Alignment & Transparency
- Manual Account Scoring:
Can create misalignment between sales and marketing if rules aren’t consistently applied or understood. Lacks a centralized, real-time view. - Predictive Account Scoring:
Promotes alignment by providing a unified, data-backed view of account priority. Real-time dashboards and integrations with CRM platforms make insights transparent and actionable across teams.
7. Implementation & Maintenance
- Manual Account Scoring:
Easy to set up but hard to maintain. Frequent manual updates and validation are required, consuming valuable time and resources. - Predictive Account Scoring:
Requires upfront effort for data integration and model training, but minimal ongoing maintenance. Once deployed, it can automate scoring and learning continuously.
Predictive account scoring stands out as the smarter, more scalable option for B2B organizations focused on long-term efficiency, personalization, and revenue growth.
Predictive Account Scoring vs. Manual Account Scoring: The Comparison Table
Here’s a quick comparison table between predictive account scoring and manual account scoring:
| Feature | Predictive Account Scoring | Manual Account Scoring |
|---|---|---|
| Data Handling | Analyzes large datasets from multiple sources automatically | Relies on limited, manually gathered data |
| Accuracy | High accuracy due to machine learning and continuous updates | Lower accuracy, prone to human error, and bias |
| Scalability | Easily scalable across large account volumes | Difficult to scale; time-consuming with larger datasets |
| Adaptability | Adapts in real-time to changes in buyer behavior and trends | Static unless manually updated |
| Resource Efficiency | Saves time and improves team efficiency | Labor-intensive and slow |
| Insights & Predictive Capability | Provides deep insights and predictive analytics | Offers only surface-level analysis |
| Best for | Mid-to-large B2B organizations with ample data and growth goals | Small teams or businesses just starting account-based strategies |
How to Build and Implement an Account Scoring Model?
Creating an effective account scoring model involves several critical steps that blend strategic planning, data science, and team alignment. Here's how to build and implement one successfully:
1. Define Your Ideal Customer Profile (ICP)
Begin by analyzing your most successful accounts to determine what characteristics define an ideal customer. Consider firmographic traits, including industry, company size, revenue, and geographic location, as well as behavioral indicators such as purchase history and engagement patterns.
2. Select and Prioritize Data Points
Identify which data attributes best predict success. These may include website visitor activity, product usage, technology stack (technographics), and intent signals. Assign weights to each factor based on historical conversion data and business goals.
3. Gather and Clean Your Data
Use your CRM, marketing automation platforms, and third-party data providers to collect relevant account data. Ensure it is clean, deduplicated, and up-to-date. Inaccurate or incomplete data will degrade scoring accuracy.
4. Choose the Right Scoring Methodology
For manual models, apply rule-based logic and custom scoring rules. For predictive account scoring, leverage machine learning tools that analyze patterns in historical data to automatically assign scores. These models adapt as new data comes in, improving over time.
5. Test and Validate the Model
Use past account data to test how well your model predicts actual outcomes. Analyze discrepancies between predicted and real results to fine-tune weights or algorithms. This validation phase is key to ensuring reliability.
6. Integrate Scoring into Workflows
Embed your scoring model into your CRM and sales tools so teams can see account scores in real time. Use the scores to trigger workflows, prioritize outreach, and inform content personalization strategies across the customer journey.
7. Collaborate Across Teams
Ensure sales, marketing, and operations teams are aligned on how the scoring model works and how it informs decision-making. Regular training and documentation can boost adoption and consistency.
8. Automate and Continuously Improve
Automate score recalculations as new data flows in and schedule regular reviews to refine inputs and weights. Predictive models should evolve with your market, customer behavior, and product changes.
Choosing the Right Approach for Your Organization
Selecting between manual and predictive account scoring depends on several internal factors, including team size, data maturity, technology infrastructure, and strategic goals. Each approach offers unique advantages at different stages of organizational growth.
1. When Manual Scoring Makes Sense
Manual account scoring is ideal for small to mid-sized B2B teams with limited data or just beginning to formalize their account prioritization. It allows full control over scoring criteria and weighting, making it easier to align with sales experience and intuition. This approach is also simpler to implement, requiring no complex tools or technical expertise. However, it may become inefficient and inconsistent as data volume and complexity grow.
2. When to Shift to Predictive Scoring
As your organization accumulates more data, whether from CRM systems, intent platforms, website behavior, or third-party sources, predictive account scoring becomes increasingly valuable. By leveraging machine learning, predictive models can analyze thousands of data points across many accounts, surfacing patterns that manual methods might miss. This enables more objective, scalable, and dynamic prioritization that adapts to market changes and customer behavior in real time.
3. A Blended Transition Strategy
Many B2B organizations start with manual scoring and gradually evolve into predictive models. This hybrid phase allows teams to compare both approaches, build trust in data-driven decision-making, and slowly integrate automation into their workflows. Manual scoring can still complement predictive models by validating assumptions or applying expert overrides in niche cases.
4. Key Factors to Consider
- Data Readiness: Do you have access to clean, consistent, and sufficient data?
- Resource Availability: Is your team equipped to manage or implement machine learning models?
- Business Goals: Are you aiming for rapid scaling, tighter targeting, or better sales and marketing alignment?
- Tooling and Integration: Can your current CRM or martech stack support predictive tools?
5. Align with Broader Strategy
Ultimately, the right scoring approach should align with your go-to-market strategy and support your revenue goals. For fast-scaling B2B organizations aiming to optimize efficiency, predictive scoring provides a clear competitive advantage. For more traditional or early-stage teams, starting with manual scoring helps build foundational understanding before automating.
Final Thoughts: Why Predictive Account Scoring Outperforms Manual Methods
Account scoring converts raw data into a targeted outreach roadmap. Manual scoring depends on fixed rules such as company size or industry, and human judgment, which makes setup straightforward but leaves teams vulnerable to bias, outdated inputs, and time-intensive upkeep.
Predictive scoring employs machine-learning models that ingest firmographic, technographic, intent, and engagement signals from multiple sources. Moreover, it continuously re-trains on new results, highlighting high-value accounts in real-time and ensuring that scoring criteria remain current.
Predictive models drive transparency across sales and marketing by feeding unified dashboards, while manual approaches can fracture alignment when criteria shift or are inconsistently applied. Implementation involves defining your Ideal Customer Profile, prioritizing key data points, cleaning input data, and validating model accuracy before integration.
Ultimately, organizations often begin with manual scoring to build foundational understanding, then migrate toward predictive methods as data volume and growth objectives intensify, unlocking greater efficiency and return on investment.
Guide to Predictive Account Scoring in B2B Marketing
Learn how predictive account scoring helps B2B teams identify high-value opportunities, improve conversion rates, and align sales and marketing efforts.
TL;DR
- Predictive account scoring leverages historical and current data to rank B2B accounts based on their likelihood of conversion, allowing for a focused approach on top opportunities.
- Unlike traditional lead scoring, which evaluates individuals, this approach evaluates entire organizations, making it ideal for complex B2B sales.
- Building a predictive account scoring model involves defining your ideal customer profile, gathering quality data, assigning weights to key attributes, and using machine learning for continuous improvement.
- Platforms like Factors offer advanced predictive scoring features, providing valuable insights and seamless integration for B2B teams.
Sales and marketing teams often waste time on accounts that do not convert, missing high-potential opportunities. This misalignment drains resources, frustrates teams, and slows revenue growth. In B2B, where buying decisions involve many stakeholders and long sales cycles, the stakes are even higher.
Companies generate an average of 1,877 leads per month, yet only 20% convert, leaving significant revenue untapped. The solution? Predictive account scoring. By analyzing past and current data, predictive account scoring ranks accounts based on their likelihood to convert, enabling your team to focus on those most likely to succeed.
This guide explains what predictive account scoring is, its benefits, and how to utilize it to enhance your B2B sales strategy and increase ROI.
What is Predictive Account Scoring?
Predictive account scoring ranks business accounts based on their likelihood of becoming customers. It uses machine learning and historical data to identify patterns associated with successful conversions. Unlike traditional methods, it doesn't rely on fixed rules or manual input. It considers factors like company size, industry, website visits, and marketing responses to generate a score for each account.
Also, read Predictive Account Scoring vs. Manual Account Scoring
Sales and marketing teams use this score to focus on accounts that match the ideal customer profile and demonstrate a strong level of interest. In B2B, where many people influence decisions and sales cycles are lengthy, predictive account scoring helps target the best opportunities, boosting efficiency and the likelihood of closing significant deals.
Core Benefits of Predictive Account Scoring
Here are the core benefits of predictive account scoring:
- Improves focus on high-potential accounts: Predictive account scoring highlights companies that are most likely to convert, enabling sales and marketing teams to direct their efforts toward accounts with the highest ROI potential, rather than spreading resources thinly.
- Leverages historical data and engagement signals: By analyzing past performance data, firmographics, technographics, and behavioral signals, the model identifies patterns common among successfully closed deals, helping to surface lookalike accounts.
- Reduces time wasted on poor-fit prospects: Rather than pursuing leads that are unlikely to convert, teams can filter out low-scoring accounts early. This enables more efficient prospecting and minimizes time lost on unqualified opportunities.
- Enhances sales and marketing alignment: A shared scoring model ensures both teams are working from the same set of priorities, which improves coordination, reduces friction, and ensures a smoother handoff between marketing-qualified and sales-qualified accounts.
- Minimizes human bias and manual errors: Unlike manual scoring or gut-feel prioritization, predictive models use objective data, reducing inconsistencies and removing personal biases that often lead to inefficient targeting.
- Shortens sales cycles: When teams focus on the right accounts from the start, they’re more likely to engage decision-makers early, anticipate needs better, and move deals through the pipeline faster.
- Boosts revenue growth: By improving account targeting and conversion rates, predictive account scoring enables organizations to close more deals, reduce acquisition costs, and drive sustainable revenue growth.
For more insights on improving sales performance, check out our B2B Sales Solutions.
{{INLINE_TOFU}}
Key Components and Data Sources in Predictive Account Scoring
Here are the key components in predictive account scoring:
- Firmographic Data: Includes company attributes such as size, industry, location, and revenue. This helps define your ideal customer profile and segment accounts based on business relevance.
- Technographic Data: Details the technologies and tools a company uses (e.g., CRM systems, marketing automation). Knowing their tech stack can indicate budget, sophistication, and compatibility with your solution.
- Behavioral Signals: Captures engagement actions, such as website visits, content downloads, and demo requests, revealing how actively an account is interacting with your brand.
- Intent Data: Reveals the topics or solutions a company is researching online, indicating real-time buying interest and providing a competitive edge in timing your outreach.
- Internal CRM Data: Includes historical interactions, lead status, deal history, and notes from sales teams, offering valuable context and a record of the account’s past behavior.
- Third-Party Data Sources: Supplement internal data with external insights, such as company news, funding events, hiring trends, or market expansion, thereby enriching the scoring model.
- Integrated Predictive Modeling: Combines all of the above data types using AI and machine learning to assign accurate scores, prioritize accounts, and forecast conversion likelihood.
How to Build a Predictive Account Scoring Model?
Here’s an elaborated step-by-step breakdown of how to build a predictive account scoring model:
1. Define Your Ideal Customer Profile (ICP)
Start by outlining what a high-value account looks like for your business. Use firmographic and behavioral traits such as industry, company size, revenue, tech stack, and buying behavior to create a clear benchmark for target accounts.
2. Collect and Clean Relevant Data
Pull data from all available sources such as CRM, marketing automation platforms, web analytics, intent data providers, and third-party tools. Clean this data to eliminate duplicates, fill in missing fields, and standardize formats to ensure high-quality inputs for modeling.
3. Identify Key Predictive Attributes
Analyze historical data to uncover patterns in accounts that converted successfully. Common indicators include frequent website visits, specific content engagement, industry verticals, or the presence of decision-makers. Identify the attributes most closely associated with conversions.
4. Assign Weights to Attributes
Not all traits are equally influential. Assign weight or importance to each attribute based on how strongly it correlates with successful deals. This helps the model prioritize more relevant factors when calculating scores.
5. Train a Predictive Model
Use machine learning or statistical techniques (e.g., logistic regression, random forests) to train a model using your historical data. The model will learn which combinations of traits are most likely to lead to account conversions and generate predictive scores.
6. Test and Validate the Model
Validate your model by comparing its predictions to known outcomes, such as successful versus failed accounts. Evaluate metrics such as precision, recall, and AUC-ROC to assess its performance. Iterate and fine-tune based on validation results.
7. Deploy and Integrate into Workflows
Integrate the scoring model into your CRM and sales/marketing tools so teams can access scores in real time. Align processes to focus on high-scoring accounts and regularly update the model with new data to ensure its accuracy and relevance.
For more on automating these processes, check our Workflow Automations.
Best Practices to Implement Predictive Account Scoring
1. Maintain High-Quality, Up-to-Date Data
Ensure your CRM and other data sources are accurate, complete, and consistently updated. Clean data is foundational for generating reliable predictive scores.
2. Align Sales and Marketing on ICP
Collaborate across teams to define a shared Ideal Customer Profile (ICP). Agreement on what constitutes a “high-potential account” ensures unified targeting and prioritization.
3. Automate Data Collection and Scoring
Use tools that integrate seamlessly with your CRM and marketing platforms to automate the gathering, updating, and scoring of account data. This reduces manual errors and increases efficiency.
4. Regularly Evaluate Model Accuracy
Test your model by comparing predicted high-value accounts to actual outcomes. Use this performance feedback to refine your model and improve its predictive power over time.
5. Involve End-Users for Feedback
Gather insights from sales reps and marketers using the scores. Their feedback helps fine-tune the model to reflect real-world account behavior better and improve user adoption.
6. Document Scoring Logic and Processes
Clearly outline how scores are generated, what data is used, and how decisions are made. This transparency helps with onboarding, training, and internal trust in the system.
7. Revisit and Update the Model Periodically
Markets and customer behaviors evolve. Schedule regular reviews to reassess attribute weights, data sources, and scoring criteria, ensuring your model remains aligned with evolving conditions.
Common Challenges in Predictive Account Scoring and How to Overcome Them
Implementing predictive account scoring in B2B settings can be a challenging task. Some common challenges and how to overcome them are:
1. Poor Data Quality
Outdated or incomplete CRM data can compromise scoring accuracy.
Solution: Implement regular data audits and establish clear guidelines for teams to maintain and update records consistently.
2. Misalignment Between Sales and Marketing
Disagreements on what defines a high-value account can disrupt scoring consistency.
Solution: Organize joint workshops to collaboratively define and refine the Ideal Customer Profile (ICP).
3. Technical Complexity
Complex scoring models may be difficult for teams without data expertise to adopt or trust.
Solution: Choose intuitive, no-code or low-code platforms and offer training to simplify adoption.
4. Lack of Model Maintenance
Static models degrade over time if not updated with new data or market dynamics.
Solution: Schedule periodic reviews to evaluate and recalibrate scoring models for ongoing accuracy.
5. Low Team Engagement or Buy-in
If teams don’t understand or trust the model, usage drops.
Solution: Communicate the scoring methodology, involve users in the development process, and showcase early wins to boost confidence.
Metrics to Track Predictive Account Scoring Effectiveness
To measure the effectiveness of predictive account scoring, focus on clear, actionable metrics. Some of the metrics to track are:
1. Conversion Rate by Score Tier
Measure the frequency at which high-, medium-, and low-scoring accounts progress through the funnel to assess how effectively the model identifies sales-ready accounts.
2. Sales Velocity Across Tiers
Track how quickly deals close for different score groups to identify where your process is most efficient or where delays occur.
3. Revenue Attribution by Score
Determine which score segments contribute most to overall revenue to validate the scoring model’s alignment with business outcomes.
4. Sales Rep Adoption and Activity Alignment
Monitor whether reps are actively focusing on high-scoring accounts and aligning their efforts with the model’s recommendations.
5. Engagement Rates for High-Scoring Accounts
Assess whether marketing and sales outreach is resonating with top-tier accounts through email opens, meeting bookings, or demo requests.
6. Win Rate by Score Tier
Evaluate how often accounts in each score tier result in closed deals, helping further calibrate and validate the model’s accuracy.
7. Model Refresh Frequency and Accuracy Over Time
Track how often your model is updated and whether its predictive power improves with each iteration.
For more on tracking performance, check our Funnel Conversion Optimization page.
Predictive Account Scoring in the Factors Platform
The Factors platform simplifies predictive account scoring for B2B teams. It automatically collects and analyzes engagement signals like visits to pricing pages, demo video views, and email replies. Factors then assigns scores to accounts based on real behaviors. Unlike manual spreadsheets, Factors presents these signals in sortable columns, offering a clear view of account activity.
Its predictive scoring uses historical data to estimate the likelihood of actions like booking a demo or responding to outreach, eliminating guesswork. This enables marketing and sales teams to concentrate on accounts with the best conversion chances, align their strategies, and utilize resources efficiently. With seamless integration into your tech setup, Factors transforms raw data into actionable insights, helping you close more deals and grow revenue effectively.
Wrapping Up
Predictive account scoring revolutionizes how B2B companies identify and focus on valuable opportunities. By leveraging historical data and behavior signals, companies can target accounts more likely to convert, accelerating sales and increasing revenue. Unlike traditional lead scoring, this method evaluates the entire account's engagement, making it ideal for complex B2B sales with multiple decision-makers.
When executed well, with clean data, the right tools, and team cooperation, predictive account scoring provides valuable insights that align marketing and sales efforts, enhance targeting, and drive business growth. Platforms like Factors demonstrate that predictive account scoring is now essential for competitive B2B teams. Adopting this method enables your organization to make more informed decisions, refine its outreach, and close more deals with less effort.
%2520(1).avif)
Top 18 PPC Analysis Tools for B2B Marketers (Free + Paid) In 2026
Want to take your PPC campaigns to the next level? Check out our listicle on the top PPC analysis tools you need to drive revenue from your ads
TL;DR
- PPC analysis tools help B2B marketers optimize paid ad campaigns by tracking performance, audience behavior, and conversions.
- Key features include real-time analytics, cross-platform integration, conversion tracking, A/B testing, and competitor insights.
- B2B marketers can use these tools for precise audience targeting, budget optimization, competitor research, and lead generation with measurable ROI.
Whether you launch a new product or want to advertise your tool in a new market, running paid ads is inevitable. Paid search campaigns have a 200% ROI, meaning that for every $1 spent, $2 is returned.
And to run the perfect PPC campaign, you need the right tools in your arsenal. In this article, we’ll dive deep into PPC analysis tools and how they play a role in creating, launching, and optimizing your campaigns.
What is a PPC Analysis Tool?
A PPC (pay-per-click) analysis tool is a software solution designed to help marketers monitor, manage, and optimize their paid advertising campaigns across platforms like Google Ads, LinkedIn Ads, and Facebook Ads. These tools allow marketers to:
- Track key performance metrics like impressions, clicks, CTR (click-through rate), CPC (cost-per-click), and conversions.
- Understand which ads, keywords, or campaigns are performing best.
- Identify opportunities for optimization by analyzing audience behavior, ad copy, or targeting parameters.
PPC analysis tools help you make data-driven decisions, reduce ad spend waste, and maximize the return on your marketing investment by providing detailed insights into your ads' performance.
Why Do Marketers Need PPC Analysis Tools?
Paid advertising is a significant investment for any business, especially in highly competitive B2B industries. Without the right tools, it's easy to waste budgets on poorly performing ads or to miss opportunities for optimization.
Here are three reasons why PPC analysis tools are crucial for marketers:
- Data-Driven Decision Making: PPC analysis tools provide in-depth performance data on your ads, helping you understand what's working and what's not. This enables you to make informed adjustments to improve targeting, ad copy, or bidding strategies.
- Budget Optimization: By identifying the most cost-effective keywords, audiences, and ad formats, these tools help you allocate your budget more efficiently. You'll be able to focus on high-performing campaigns and cut back on those that underperform.
- Improved Campaign Performance: Continuous monitoring and analysis through these tools enable you to spot trends, identify opportunities, and make real-time adjustments to improve campaign results. A good PPC analysis tool helps marketers scale successful campaigns and optimize underperforming ones.
Essential Features to Look for in a PPC Analysis Tool
WhenIt is important to ensure that the right PPC analysis tool offers the features necessary to monitor and optimize your campaigns selecting the right PPC analysis tool, ensuring it offers the features necessary to monitor and optimize your campaigns is important.
Here are the key features to look for:
1. Real-Time Analytics
Access to real-time data is essential for making quick decisions in fast-moving PPC campaigns. Look for tools that provide up-to-date performance metrics, allowing you to make timely adjustments to optimize your ad spend.
2. Cross-Platform Integration
Most businesses run ads across multiple platforms, including Google, Facebook, LinkedIn, and Instagram. A good PPC analysis tool should integrate with various platforms to give you a holistic view of your ad performance across channels.
3. Conversion Tracking
Understanding how your ads drive conversions is critical. The best tools will offer detailed insights into which ads or keywords are leading to conversions, helping you optimize for what matters most—your business goals.
4. Custom Reporting
Every business has different goals, so being able to create customized reports is important for tracking the metrics that matter to you. Look for tools that allow you to generate reports tailored to your specific KPIs: ROI, customer acquisition cost, or lead generation.
5. A/B Testing Capabilities
One of the best ways to improve campaign performance is through continuous experimentation. A PPC analysis tool should provide built-in A/B testing features so you can test different ad copy, creatives, or targeting strategies and optimize based on results.
6. Competitor Insights
Knowing what your competitors are doing in the paid ad space can give you a competitive edge. Some tools offer features allowing you to analyze competitor keywords, ad copy, and performance, helping refine your strategy.
7. Automation and Optimization Suggestions
Manual optimization can be time-consuming. The best PPC analysis tools have automation features that handle bid adjustments, budget allocation, and ad rotation based on performance metrics. Additionally, some tools provide AI-driven recommendations to improve your campaigns further.
6 Types of PPC analysis tools for your marketing stack
- Keyword Research Tools
These tools help B2B marketers identify high-potential keywords for targeting in search-based PPC campaigns.
- Google Keyword Planner
A free tool offered by Google Ads, Google Keyword Planner is primarily used to find keywords that align with a brand’s goals while providing estimates on search volume and cost per click (CPC).
Marketers can use the Google Keyword Planner to plan their campaigns based on actual data from Google. This allows them to set realistic budgets and bid amounts. It's also helpful for discovering new keyword opportunities and forecasting performance.
Key Features
- Keyword Forecasting & Search Volume Data
- Suggested Bid Ranges
- Geographic Performance Estimates
- Historical Keyword Data
- SEMrush
SEMrush is a powerful SEO and competitive analysis tool that offers extensive keyword research features. It allows marketers to discover profitable keywords, track rankings, and analyze competitors' strategies.
B2B marketers can use SEMrush to uncover the keywords their target audiences are searching for, helping them create more targeted PPC campaigns that align with user intent. The platform also provides insights into competitor PPC strategies, helping marketers find keyword gaps to exploit.
Key Features
- Keyword Difficulty Analyzer
- PPC Keyword Research
- Competitive Keyword Analysis
- Ad Copy Research and Suggestions
- Ahrefs
Ahrefs is a comprehensive SEO and PPC tool with strong keyword research capabilities. It focuses on competitor analysis and organic rankings. B2B marketers can leverage Ahrefs to find PPC keywords that competitors are bidding on and use the data to create highly targeted ad campaigns. It also helps track keyword performance and identify trends in search demand.
Key Features
- Keyword Explorer
- PPC Ad Tracking
- Competitor PPC Data
- Search Volume and Click-through Rate (CTR) Data
2. Campaign Management Platforms
These tools allow marketers to create, manage, and track multiple ad campaigns across different platforms.
- Google Ads
Google Ads is the most widely used PPC platform. It allows advertisers to create, manage, and optimize search, display, and video ad campaigns across Google’s network. Google Ads can target relevant audiences based on keywords, location, interests, and behavior. The platform also offers robust tracking and reporting features to optimize campaigns in real time.
Key Features:
- Smart Bidding and AI Optimization
- Performance Tracking & Conversion Tracking
- Audience Targeting and Remarketing
- Integration with Google Analytics
💡Also read: Dummies Guide to Google Ads Management
- Microsoft Advertising (formerly Bing Ads)
Microsoft Advertising allows marketers to run PPC campaigns on the Bing search engine and its partner networks, offering a lower-cost alternative to Google Ads. You can use Microsoft Advertising to reach a different audience demographic than Google, often at a lower CPC. The platform provides detailed reporting and integration with LinkedIn targeting data for B2B professionals.
Key Features:
- LinkedIn Profile Targeting
- Audience Network for Display Ads
- Keyword Planner Integration
- Cross-Device Conversions
- WordStream
WordStream is a comprehensive PPC management platform offering tools to optimize Google Ads and Microsoft Advertising campaigns. It streamlines PPC management through automated recommendations, budget tracking, and advanced reporting features. It also helps analyze campaign performance and suggest optimization strategies.
Key Features:
- 20-Minute PPC Work Week for Optimization
- Cross-Platform Campaign Management
- Ad Performance Reporting
- Budget Management Tools
3. Analytics and Reporting Tools
These tools provide in-depth data on campaign performance, helping marketers monitor KPIs and adjust campaigns accordingly.
- Google Analytics
Google Analytics (now GA4) is a web analytics service that tracks and reports website traffic, providing detailed insights into how users interact with a site after clicking on a PPC ad. Although GA4 is good for general analytics and reporting, it’s not tailored to B2B marketers so companies may get incomplete insights.
Key Features:
- Goal and Conversion Tracking
- Traffic Source Attribution
- Audience Segmentation and Behavior Reports
- Customizable Dashboards and Reporting
💡Compare Factors Vs. Google Analytics (GA4)
- Supermetrics
A reporting tool that pulls PPC data from various platforms into Google Sheets, Data Studio, or Excel for in-depth analysis.
Key Features:
- Data connectors for multiple ad platforms
- Custom reporting
- Automated report scheduling
💡Learn more about Supermetrics: Features, Alternatives & more
4. A/B Testing and Ad Optimization Tools
These tools are essential for testing different ad variations to optimize performance and increase ROI.
- Optimizely
A powerful A/B testing tool that allows marketers to test various elements of landing pages and ads to optimize conversion rates.
Key Features:
- Multivariate testing,
- behavioral targeting
- Real-time data.
- Unbounce
- Description: A landing page optimization platform that enables marketers to create, test, and optimize landing pages for better ad performance.
- Key Features: Drag-and-drop landing page builder, A/B testing, dynamic text replacement, integrations with PPC platforms.
- VWO (Visual Website Optimizer)
- Description: A full-featured A/B testing tool for optimizing landing pages and improving ad campaign performance.
- Key Features: A/B and multivariate testing, heatmaps, visitor behavior analysis, and real-time reporting.
5. Competitor and Ad Intelligence Tools
These tools help marketers analyze competitors’ PPC strategies, ad copy, and targeting, allowing for better-informed decisions.
- SpyFu
It is a tool that allows marketers to see competitors’ PPC campaigns, keywords, and ad copy, helping refine their strategies.
Key Features: Competitor keyword analysis, ad spend data, historical ad performance, keyword group recommendations.
- Adbeat
A competitive intelligence tool that gives insights into display ads and native ad performance across the web.
Key Features: Competitor display ad strategies, network targeting, ad creative analysis, top publishers.
- iSpionage
A competitive intelligence tool that helps marketers discover competitors’ paid search strategies, ad copy, and landing pages.
Key Features: PPC campaign insights, competitor keyword tracking, landing page analysis, campaign performance benchmarks.
6. Audience Targeting and Retargeting Tools
These tools help B2B marketers refine their audience targeting and run retargeting campaigns for better engagement.
- AdRoll
A tool for running retargeting campaigns across web, social media, and email, focusing strongly on conversion tracking.
- Key Features: Audience segmentation, cross-platform retargeting, dynamic ads, conversion tracking.
- Perfect Audience
A retargeting tool that allows marketers to track visitors and serve them ads across web, social media, and mobile platforms.
- Key Features: Cross-channel retargeting, real-time reporting, dynamic product ads, audience segmentation.
- Criteo
A retargeting tool that helps brands re-engage visitors through personalized ads across various channels.
- Key Features: Dynamic retargeting, omnichannel ad placement, predictive bidding, and performance insights.
Take your PPC campaigns to the next level with Factors
Instead of investing in a suite of tools on this list, you can use Factors to scale and optimize your ad campaigns!
Factors can help you:
- Denonymise accounts visiting your website through paid search
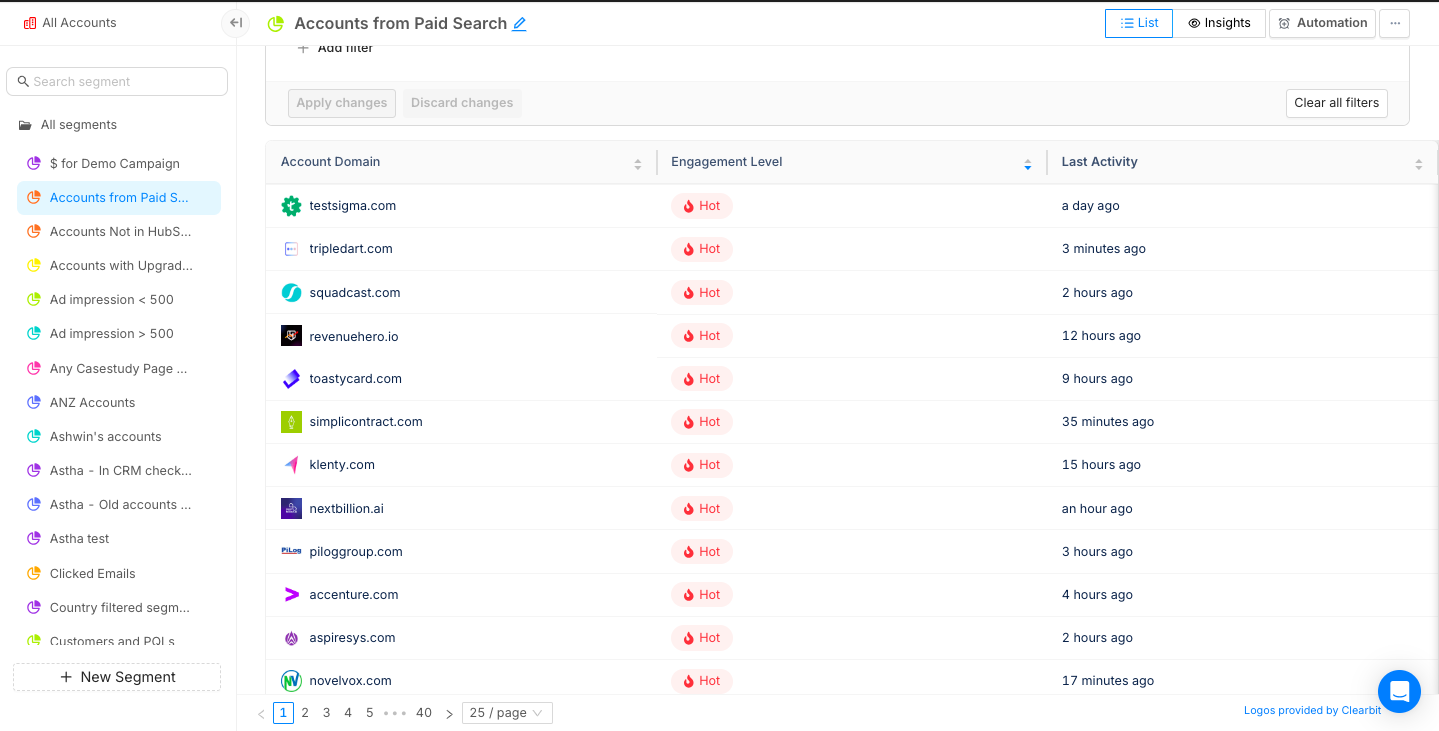
- Analyze Google Ads' performance at a campaign level.

- Use Segment Insights to identify how Google Ads play a role in generating revenue for your business and compare it to other channels.
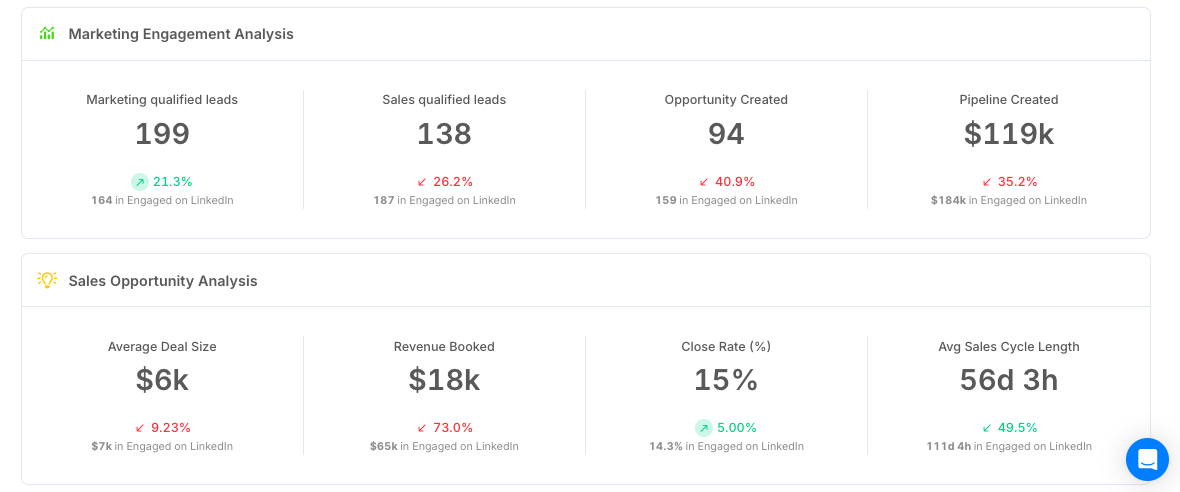
Your GTM team can use these insights to:
- Prioritise accounts during sales outreach
- Improve their retargeting efforts
- Refine ad copy and positioning
- Save ad spend by allocating budgets to high-performing campaigns
{{INLINE_MOFU}}
Enhance B2B Advertising with PPC Analysis Tools
PPC analysis tools help B2B marketers optimize paid campaigns by tracking key performance metrics and audience behavior.
- Key Features: Real-time analytics, cross-platform integration, conversion tracking, A/B testing, and competitor insights.
- Optimization Benefits: Improve audience targeting, budget allocation, and lead generation.
- Competitive Advantage: Gain insights into competitor strategies for better positioning.
- Data-Driven Decisions: Measure ROI and refine campaigns for maximum effectiveness.
Leveraging PPC analysis tools ensures smarter marketing strategies, improved conversions, and higher returns on ad spend.
Book a demo today to learn how Factors can improve your PPC performance.
Post-Sale Customer Journey: A Comprehensive Framework for Long-Term Success
Discover a comprehensive post-sale customer journey framework to boost retention and maximize lifetime value. Learn key stages, metrics, and strategies for B2B success.

B2B businesses love the chase - new logos, fresh leads, that dopamine hit of “another deal closed.” But here’s the problem: customer acquisition costs are climbing like they’ve had three espressos, while retention quietly sits in the corner, ignored, underrated, and, honestly, way more profitable.
Why the Post-Sale Customer Journey Matters
Bain & Company backs this up: You can improve retention by just 5% and profits can jump anywhere between 25% and 95%. (Yes, that stat makes every marketer sit up straighter.)
The secret to hitting those retention numbers is to rethink what customer success actually does for your customers. If it is treated like roadside assistance—only showing up when the car breaks down—you’ll always be one flat tire away from churn.
A smarter move would be to make them the navigators of your post-sale customer journey. They are the ones with the map, pointing out the fastest routes, avoiding potholes, pre-planning rest-stops, and ensuring customers actually enjoy the ride.
Because thriving businesses know this simple truth: post-sale customer journey isn’t a ‘nice-to-have.’ It’s about how many customers stay, how much more they buy, and how excited they are to tell others why you’re worth it.
A fantastic post-sale customer experience ensures renewals don’t come with an awkward pause before the signature. In short, it’s about treating customers like partners, not just paychecks.
Meeting Post-Sale Customer Demands with Data
If your CSMs are the navigators of the post-sale customer journey, then data is their GPS. Without it, they’re basically driving blind.
They expect onboarding faster than a CEO can tweet about ARR milestones, ROI they can point to without squinting, and engagement that’s authentic—not just a random ‘checking in’ email.
And data helps you bring authenticity into the conversations. Customer feedback, behavioral signals and usage patterns show you where the friction is hiding before it blows up. Suddenly, the customer experience isn't a one-size-fits-all snoozefest; it’s tailored, quick, and actually helpful.
Stitch the individual data points into a single dashboard, and sales, marketing, and success teams are all staring at the same picture. No more debates on those private Slack channels. Just a single, shared reality: how healthy the customer relationship really is.

How AI and Automation are Redefining Post-Sale Customer Engagement
Let’s be real: teams have a lot on their plate: cranking out decks, prepping QBRs, and trying to create the most comprehensive dashboard. Meanwhile, the customer sits in the shadows, tapping their watch, quietly wondering whether this is part of the standard procedure.
But here's the shift: AI can now handle the grunt work while you focus on what matters. Here's how it actually works:
- Usage dips flagged → Machine learning models track login frequency, feature adoption, and session length against healthy benchmarks. When a customer's activity falls outside the norm, it triggers an early warning.
- Adoption nudges launched → Automation pulls from usage data to trigger in-app messages, product walkthroughs, or emails when customers stall on key features. These nudges are personalized based on segment and past behavior.
- Upsell intent detected → Predictive AI analyzes purchase history, account growth, and product interactions to spot signals of expansion. It then drops the right playbook into the CSM's workflow, so outreach feels timely, not salesy.
It's like having a teammate who actually understands customers and reacts instantly—without stealing your lunch or the credit for your ideas.
Gartner puts numbers to it: by 2029, agentic AI will resolve 80% of everyday customer issues and shave 30% off operating costs.
{{INLINE_MOFU}}
The Six Stages of the Post-Sale Customer Journey
Dashboards and automation give you clarity, but customers aren’t just data points—they’re very real humans navigating a journey with you. Let’s break this journey down into six stages. Think of these stages as a series of oscillating, complex emotions—part excitement, part panic, part “what did I get myself into?”—that every customer cycles through, as they move from first use to full adoption.
Mastering this emotional rollercoaster is about making customers feel understood, supported, and maybe even a little delighted along the way.
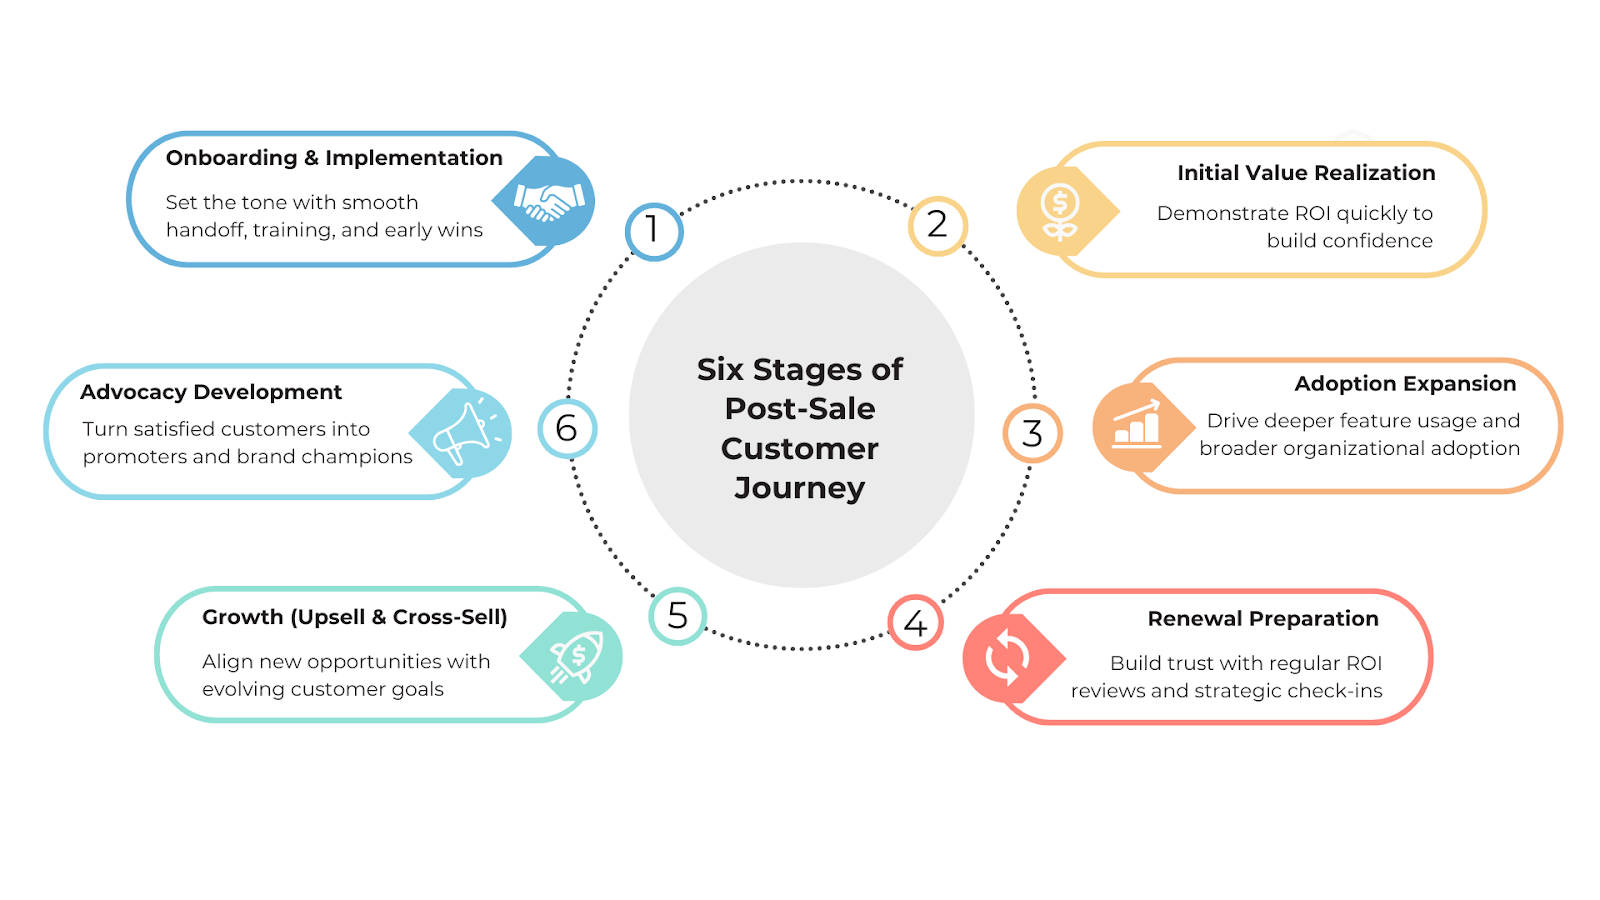
1. Onboarding and Implementation
The journey begins with onboarding—making it a critical first impression. A frictionless onboarding experience goes beyond convenience; it defines how the partnership will evolve.
Great onboarding involves a clear sales-to-success handoff, structured training programs, rapid time-to-value, and the quick realization of early wins. This stage should leave customers feeling confident in their ability to use the solution and optimistic about its impact on their business.
2. Initial Value Realization
The next step is ensuring customers recognize value quickly. Early ROI demonstrations are critical to retain B2B customers. Customers who experience clear results early on are more likely to stay invested.
For instance, a SaaS company might highlight how a client reduced reporting time from two days to two hours using their platform. These milestones build credibility and justify the investment.
3. Adoption Expansion
This stage often involves encouraging teams to expand product usage, explore advanced features, integrate the platform more deeply, and unlock additional capabilities.
Businesses can spot accounts leaning into advanced usage and identify high-potential expansion opportunities by leveraging account intelligence tools for customer success.
4. Renewal Preparation
Companies that conduct quarterly business reviews, provide continuous ROI reporting, and hold strategic check-ins position themselves as true partners rather than mere vendors.
This approach lowers churn risk and shifts end-of-contract discussions towards scaling opportunities instead of justifying value.
5. Upsell and Cross-Sell
This step involves upgrading to premium plans, adding more user licenses, or adopting complementary solutions. However, successful upselling isn’t about pushing more—it’s about aligning offers with customer goals.
6. Advocacy Development
The final stage is customer advocacy, which involves customers speaking on your behalf in testimonials, case studies, peer groups, and industry forums.
Advocacy is the most powerful driver of organic growth as referrals from existing customers often help convert prospects faster.
💡Also read: 5 stages of the customer journey
Building a Post-Sale Customer Journey Framework
Why bother with a framework? Because without one, your post-sale customer journey is basically a random mess of check-ins, tickets, and “oops, did we forget about them again?” A framework gives you a map, a plan, and a little structure —so every touchpoint isn’t just another shot in the dark, but a deliberate move to keep customers happy and engaged.
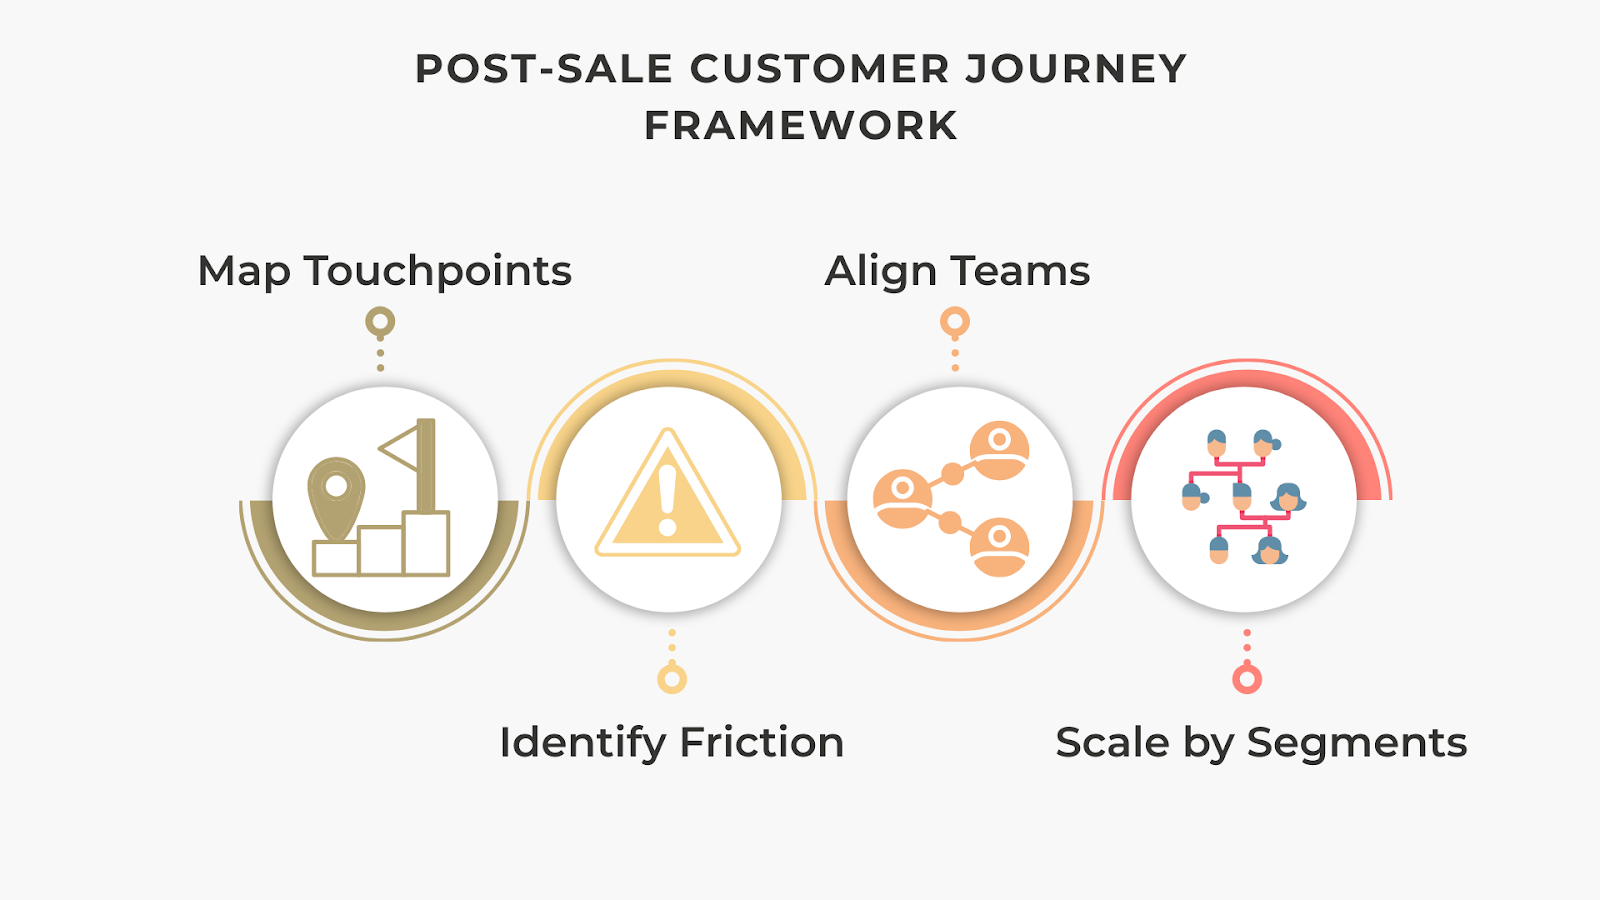
1. Map Every Touchpoint
Create a visual journey map covering interactions across sales, onboarding, customer success, marketing, and support.
2. Identify Friction Points
Examples:
- Long onboarding cycles → introduce guided automation.
- Weak product adoption → deploy contextual learning and training.
- Renewal hesitation → provide ROI dashboards.
3. Ensure Cross-Functional Alignment
- Sales → Sets clear expectations.
- Marketing → Reinforces with education and resources.
- Customer Success → Delivers on promises.
4. Scale by Segments
Adopt a tiered engagement model:
- High-touch: Enterprise clients with dedicated success managers.
- Tech-touch: SMBs supported via automation and digital touchpoints.
It works! A Forrester study found that companies with structured customer success frameworks pull in 107% ROI within three years—and that translates directly into better renewals, upsells, and long-term growth. Investing in customer success isn’t optional. It literally pays for itself… and then some.
💡 Learn more about CRM Workflow Automation and how to boost efficiency & customer engagement
Measuring the Success of Post-Sale Customer Engagement
You can line up all the right plays—map behavior, track intent, automate workflows—but if you’re not measuring properly, you’re basically a coach pacing the sidelines, wondering if your game plan is even working.
Retention and churn? That’ll tell you the basics. NPS? Think of it as your fan chants—are they cheering your name or booing you off the field? CLV? That’s the season ticket revenue; it puts a dollar sign on loyalty, the real long game. And health scores? They’re your halftime stats, warning you where the defense is cracking before the other team runs away with it. Skip these, and you’re basically hoping for a win without checking the score. But let’s be real—hope is not a strategy.
| Stage | Metric |
|---|---|
| Onboarding | Time-to-value, activation rates |
| Value Realization | Feature adoption, depth of usage |
| Adoption Expansion | Growth in active users, engagement breadth |
| Renewals | Retention rate, churn rate |
| Growth | Upsell/cross-sell revenue, Net Revenue Retention (NRR) |
| Advocacy | Net Promoter Score (NPS), referral volume, case study participation |
Keep these formulas handy to measure your strategic success:
- Customer Health Scoring
Composite customer health scores are increasingly popular, combining data and signals from various touchpoints along with customer sentiment or feedback. Weighted appropriately, they provide predictive insights into churn risk or potential to expand horizontally and vertically.
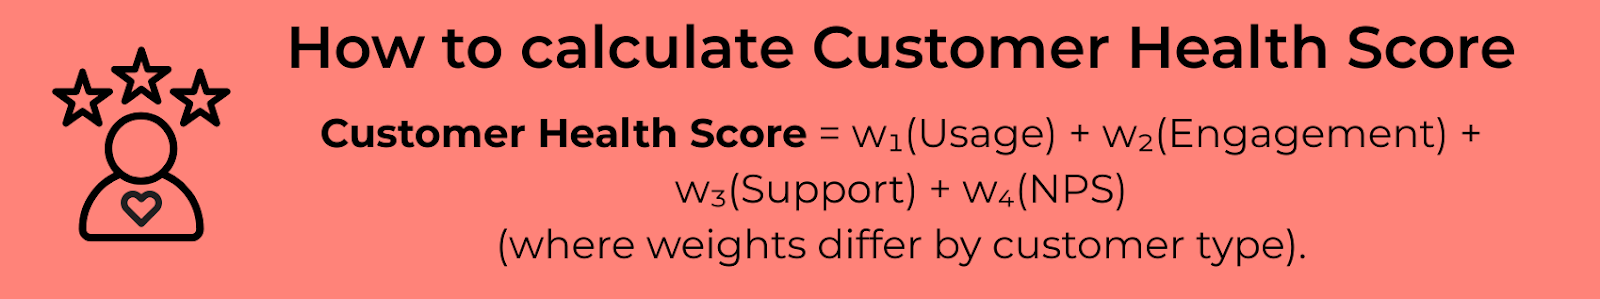
- ROI of Post-Sale Programs
Calculating ROI ensures you know whether your investment in post-sale processes is paying off.

Optimizing Post-Sale Customer Experience with Factors
A good carpenter knows his tools, but even a pro can’t fix a squeaky post-sale customer journey without the right strategy. It's about timing, insight, and making life easier for both your teams and your customers. That’s exactly where Factors steps in: intent capture, account intelligence, and workflow automation stitched together to turn customers into loyal advocates instead of one-time wins.
Intent Capture is where it starts. Every click, download, or product login? Factors pulls those digital signals into a single, clear view. Suddenly, you know who’s actually engaged and what they care about—so customer success teams and marketers stop guessing and start engaging with precision.
Account Intelligence takes it up a notch. By layering firmographic data, campaign activity, and usage trends, Factors gives you a 360° snapshot of which accounts are ready to renew, upgrade, or expand. Translation: less wasted energy, more focus on accounts that will actually move the needle.
Workflow Automation is the final piece of the puzzle. Instead of chasing leads with endless manual follow-ups, Factors automates the tedious tasks for you—renewals, adoption nudges, and health checks—so your teams can focus on the conversations that truly matter. Plus, analytics run in the background to show you what’s working and what’s not.
Put it all together, and you’re not just managing the post-sale customer experience, you’re upgrading it. With Factors, businesses move from firefighting churn to building seamless, sticky, long-term customer relationships that drive serious lifetime value.
To sum it up
Look, we get it. Long blogs might seem like period dramas, you start strong, but by paragraph three, your attention span clocks out. So if you scrolled straight here (hi, lazy reader 👋), here’s the deal: the post-sale customer journey isn’t rocket science. With Factors, it boils down to four steps:
Step 1: Audit the customer experience and spot the gaps.
Step 2: Use Factors to pull siloed data into one clean, usable view.
Step 3: Layer in Factors’ intent signals and account intelligence so you know which customers need what—before they even say it.
Step 4: Automate the gruntwork with Factors’ workflows so your teams spend less time firefighting and more time actually helping customers.
The result? Customers feel understood, stick around longer, and deliver way more value.
FAQs
Q. What is the post-sale customer journey?
A. The post-sale customer journey captures the full spectrum of interactions after purchase, influencing customer satisfaction, retention, and growth. It guides customers from onboarding to adoption, helps them realize value, prepares them for renewal, opens doors to upsell opportunities, and builds lasting relationships.
Q. Why is the post-sale customer journey critical for B2B businesses?
A. For B2B organizations, the customer success journey after purchase is where long-term value is created. Even a 5% increase in retention can yield 25–95% profit growth. Effective B2B customer retention strategies, like seamless engagement and personalized support, turn first-time buyers into long-term partners.
Q. What are the main stages of the post-sale customer journey?
A. The post-sale customer journey stages typically include:
- Onboarding and implementation
- Initial value realization
- Adoption expansion
- Renewal preparation
- Growth through upsell and cross-sell
- Advocacy development
Mapping these stages through customer success journey mapping helps organizations optimize each touchpoint.
Q. How does AI enhance the post-sale customer experience management?
A. AI and automation transform post-sale customer experience management by predicting churn risks, automating personalized engagement, and surfacing upsell opportunities. Tools like account intelligence for customer success analyze intent signals and usage patterns to guide customer success teams.
Q. What metrics define success?
A. Key post-sale engagement metrics include churn rate, Net Promoter Score (NPS), customer health scores, renewal rate, Net Revenue Retention (NRR), and customer lifetime value. Tracking these ensures businesses can identify risks early and scale what works best.
Q. How do account intelligence platforms help?
A. Platforms like Factors help unify intent and engagement signals into one view, allowing intelligent, data-driven customer success strategies.
Pixel vs Account-Based LinkedIn Retargeting
This blog explores the limitations of Pixel-based retargeting and why Account-based retargeting is an effective alternative.
B2B marketing teams invest significantly across campaigns and content to drive qualified website traffic. However, benchmarks find that only about 2% of this traffic actually converts, with the majority of visitors simply bouncing off or browsing anonymously on the website.
Retargeting the remaining 98% of visitors via LinkedIn has proved to be an effective strategy to recapture interest from anonymous website traffic. While we won’t cover the specific benefits of LinkedIn retargeting here, this case study summarizes how Sage successfully leveraged LI retargeting to:
- Generate 700,000 impressions in 6 weeks
- Improve lead generation by 4x
- And reduce cost-per-lead (CPL) by 80%
Simply put, LinkedIn retargeting works.
LinkedIn retargeting relies on the LinkedIn Insight tag (aka LinkedIn Pixel) to match website visitors with LinkedIn audiences.
The LinkedIn insight tag is a simple piece of code placed on a website to help optimize campaigns. While the LinkedIn Pixel serves many functions, including conversion tracking and demographic insights, it’s challenged by shortcomings around website retargeting.
While LinkedIn Pixel works to some extent, we have found an alternate approach that can take your retargeting campaigns to the next level, also known as account-based retargeting. Account-based retargeting works by identifying, qualifying, and targeting anonymous accounts, as opposed to individual users visiting a website. Using a combination of identifiers, account-based retargeting has been shown to deliver:
- Larger, account-level audiences
- Improved match rate accuracy
- Better segmentation and targeting
And the results? Well, they speak for themselves:

While the LinkedIn Pixel is a must-have solution given its wider functionality, we explore the limitations of Pixel-based retargeting and why Account-based retargeting is an effective alternative ⬇️
Limitation #1 - Match rates
The LinkedIn Pixel works by placing a cookie in visitors’ browsers, so when a LinkedIn user lands on your website, they may be identified and retargeted on LinkedIn. Note that this cookie-based identification takes place at a device and browser level for individual users. This means that, for the Pixel to match a website visitor to a LinkedIn user, the visitor must meet all 4 of the following criteria:
- Be an active member of LinkedIn
- Explicitly accept cookies on the website
- Use the same device (phone/laptop/tablet) to visit the website and LinkedIn
- Use the same browser (chrome/firefox/safari) to visit the website and LinkedIn
While a few visitors will probably fit this criteria, audience match rates via the Pixel are limited by the fact that the majority of traffic either doesn’t use LinkedIn, rejects cookies, or, most commonly, uses different devices/browsers for product research and LinkedIn browsing.
In fact, only about 42% of B2B product research involves mobile touch points — with the majority of B2B buyers choosing to conduct their research on desktops. On the other hand, a whopping 80% of LinkedIn engagement is via mobile. This is not surprising, given that LinkedIn is primarily a social networking app.
And so, despite the fact that LinkedIn Pixel works as designed, its match rates tend to be relatively poor, given the practical realities of B2B user behavior.
The limitation: Low match rates as a result of limited, cookie-based matching mechanisms by the LinkedIn Pixel.
How Account-based Retargeting helps
The LinkedIn Pixel relies exclusively on cookie-based tracking to create its matched audiences. Factors, on the other hand, leverages a combination of three identifiers — IP address, advertising ID, and cookies, to triangulate a data connection and match anonymous traffic to a company.
Factors connects with over 4.2B+ IP addresses and 65M+ company profiles (in addition to cookies and ad IDs) to accurately identify which accounts are visiting your website. Note that this is regardless of whether the visitor in question is a member of LinkedIn, uses different browsers, etc.
In fact, Factors can also identify remote companies by initially cookie-ing people using their corporate IP address to then re-identify them when they work remotely. To further explain how Factors achieves industry-leading match rates, here’s Viral from 6sense, one of our data partners:
“As a person moves around, their IP address changes. The platform adjusts for these changes by pulling in several additional markers to help match signals to an account. Now, with more variations in IP address data as remote working spreads across industries, our Graph deploys available secondary marker information, like cookies and mobile advertising IDs, to triangulate data connections. The Graph uses additional markers to sift through the noise so that confidence in the match rate remains consistent. Given the amount of signals we track, we don’t map every signal all the time, but we have observed accuracy over 85%.”
- CTO Viral Bajaria, 6sense, Data Partners
💡Build Better LinkedIn Retargeting Audiences with Factors
Limitation #2 - User-level targeting
B2B buying decisions are rarely made by a single person. The typical buying committee comprises almost a dozen people from multiple departments and time zones. Selling a SaaS product today might involve gaining buy-in from multiple C-suite executives, individual stakeholders from operations to sales to marketing, and a chief revenue officer – along with legal and implementation teams.

Source: Challenger
Given that the Pixel focuses on individual, single users visiting your website, it fails to capture the wider buying group from each account those users are from. This shrinks your total matched audience size considerably, but more importantly, it inhibits your marketing efforts from reaching key stakeholders and decision-makers who may not have been the ones visiting your site.
For example, if a junior marketer visits Factors.ai and is retargeted by the LinkedIn Pixel, the junior marketer alone will receive ads — with other stakeholders from the target account being ignored. As a result, this approach relies on the junior marketer being independently influential enough to convince the rest of the team to move forward with the deal. Definitely a tough sell.
The limitation: User-level targeting, as opposed to account-level targeting, results in fewer stakeholders targeted per account and smaller audience sizes.
How Account-based Retargeting Helps
While LinkedIn is best for targeting buying groups, it’s important to remember that there is no initial intent to buy on a social media platform. You need to layer in intent signals from multiple sources, such as your website and review sites like G2, to understand how you can best retarget relevant accounts.
Factors identifies intent signals and re-targets anonymous website traffic at an account level. This means that multiple decision-makers and stakeholders from the same company will be targeted on LinkedIn, regardless of which user actually visits the website. This bodes well for multiple reasons:
- Increases audience size without compromising on the quality of accounts
- Creates brand awareness at a company level rather than at an individual level
- Improves odds of targeting the right decision-makers within each account
Even assuming that account-based targeting finds the same 100 accounts as Pixel-based targeting, the former would generate an audience size of 300-500 users (3-5 people from each account), while Pixel-based targeting would only target 100 users (1 from each account). More importantly, a larger audience will improve the odds of targeting decision-makers, ultimately resulting in more leads and conversions. Accordingly, account-based retargeting solves for the practical limitation of LinkedIn campaigns struggling to scale due to poor audience size.
Limitation #3 - Audience segmentation
The previous two points discussed the LinkedIn Pixel’s limitations in terms of audience quantity. This third limitation highlights why the Pixel tends to fall short in terms of audience quality. In reality, a significant portion of your website traffic wouldn’t make a good fit for your business. Even within the subset of ICP accounts visiting your website, only a fraction would be “sales-ready” at any given moment (with the remaining accounts having to be nurtured until they’re prepared to buy).

As important as having a large audience is, the quality of this audience plays a key role in determining conversions and RoAS as well. In an ideal scenario, marketing teams should only retarget this subset of sales-ready “3000-pound marlin” accounts.

The LinkedIn Pixel limits audience segmentation based on intent and engagement. With the Pixel, website traffic can only be segmented based on page views. While this is definitely a good starting point, it lacks granularity.

With Pixel, filtering out accounts that don’t match your target geographies, industries, sizes, or engagement levels can be challenging. This also translates to limited personalization options, as you can only segment campaigns by page views rather than by account and engagement properties.
The limitation: Limited segmenting & filtering options resulting in subpar audience quality and limited scope for personalization.
How Account-based Retargeting helps
Account-based retargeting with Factors supports granular segmentation based on a wide range of firmographics and engagement criteria. For example, with Factors, you can identify and retarget a list of accounts that meet the following rules:
“US-based Software companies with 100-500 employees visiting our pricing page & G2 profile for at least 10 seconds with a scroll-depth of 20% or more”

Here are a few ways in which Factors helps segment traffic data (in addition to regular old page views):
- Country
- City
- Industry
- Size
- Revenue range
- Time spent on page
- Scroll-depth
- Button clicks
- And a combination of all of the above
This level of filtering results in a list of precisely targeted ICP accounts that would make a great fit for your business. Additionally, by integrating your CRM, you may also include/exclude specific accounts, such as existing customers and competitors.
And guess what? We found the solution to fix your list-building problems once and for all!
Factors has launched Audience Builder, which allows marketers to automatically segment based on their preferred criteria, push these segmented audience lists to LinkedIn, and activate personalized, targeted advertising.
For example, you may choose to show accounts that visit high-intent pages such as factors.ai/pricing an ad creative offering a free trial. On the other hand, you can show accounts reading your competitor comparison blogs a “comparative” ad creative. The possibilities are endless.

{{INLINE_BOFU}}
Real-life comparison: Pixel vs Account-based retargeting
We’ve talked the talk - now we’ve got the numbers to back it up. Here’s how two campaigns, one that’s Pixel-based and another that’s Account-based, compare to each other. Note that all else (duration, budgets, creatives, copies) has remained the same through the course of this experiment.
Over the same period, we find that CTR is higher under Pixel-based retargeting, likely because this approach targets exact users visiting the website. That being said, Account-based remarketing significantly outperforms Pixel-based retargeting in every other key metric, including leads generated.
And there you have it.
Solve your ad targeting woes with AdPilot
If you want to maximise ROI for your LinkedIn ads, look no further than our latest offering: LinkedIn AdPilot! We offer a wide range of features that allow you to segment audiences based on intent data, implement exposure control for your campaigns and determine the true ROI for your ads.
Speak to our team today to understand how you can use AdPilot to improve your LinkedIn retargeting efforts.
LinkedIn's Pixel-based retargeting and account-based retargeting differ in their targeting approach and benefits. The LinkedIn Pixel, a code snippet placed on websites, tracks visitor interactions using browser cookies to retarget individuals. However, its effectiveness can be limited by users not accepting cookies, using different devices, or being logged out of LinkedIn. On the other hand, account-based retargeting targets entire organizations, identifying anonymous accounts visiting your site, which allows for better audience segmentation and higher match accuracy. While the Pixel is useful for general retargeting, account-based retargeting is more effective in B2B contexts, offering precise targeting and engaging multiple stakeholders in decision-making processes.
.avif)
Best 9 Performance Marketing Hacks you Need to Know in 2026
Discover the best 9 performance marketing hacks to supercharge your strategy in 2026. Learn actionable tips and stay ahead of the competition.

Are you a B2B SaaS marketer struggling to tackle the challenges of performance marketing for your brand?
Are you finding it difficult to identify anonymous companies visiting your website, analyze your buyer journey, and measure ROI across campaigns, content, and sales touchpoints?
If so, then this guide will help you.
In today's competitive business landscape, B2B SaaS marketers face numerous obstacles when it comes to performance marketing.
One of the biggest challenges is analyzing the data from their ads, website, social media & campaigns.
Without this crucial information, they would be missing out on valuable opportunities to engage with potential customers and drive conversions. Additionally, analyzing their buyer journey and measuring ROI across various marketing channels and touchpoints can be a daunting task, leaving unsure of which strategies are truly effective.
Let's delve into the blog to gain further insights and expand our knowledge on the subject.
What is Performance Marketing?
Performance marketing is a data-driven marketing strategy that focuses on driving specific actions or outcomes, such as conversions, leads, or sales.
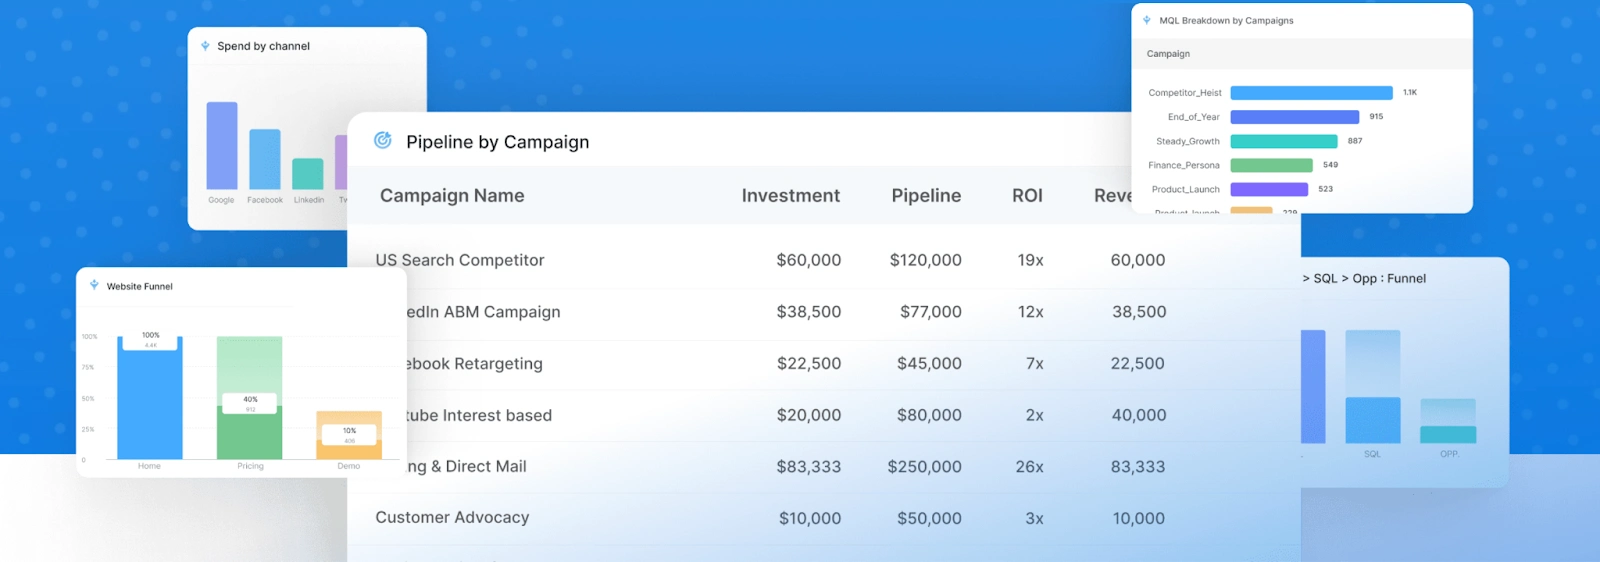
Unlike traditional marketing methods that rely on broad reach and brand awareness, performance marketing is highly targeted and measurable, allowing marketers to track the effectiveness and ROI of their campaigns with precision.
In performance marketing, marketers set clear objectives and pay for marketing activities based on the desired performance metrics achieved. This could include pay-per-click (PPC) advertising, affiliate marketing, email marketing, content marketing, and other forms of digital advertising.
The success of performance marketing campaigns is determined by how well they achieve the intended outcomes and deliver a positive return on investment.
For B2B SaaS marketers, performance marketing is particularly relevant as it allows them to optimize their marketing efforts and allocate resources more effectively. By focusing on measurable actions and outcomes, B2B SaaS marketers can identify which strategies and channels are driving the best results, allowing them to refine their campaigns and generate higher-quality leads and conversions.
5 Reasons to Know Why Performance Marketing is Important?
Performance marketing is a crucial skill for every marketer to master. Here are five reasons why it is essential and relevant to your marketing success:
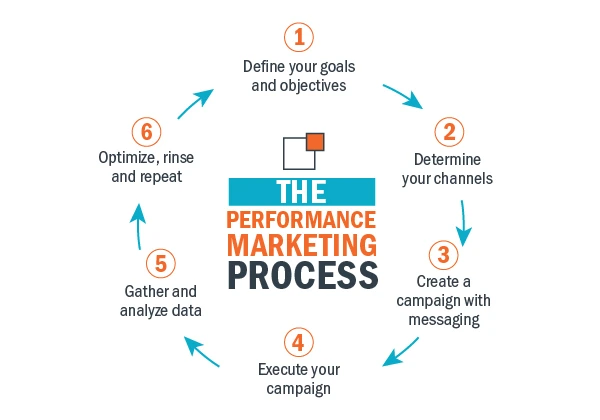
Measurable Results
Performance marketing allows you to track and measure the effectiveness of your marketing campaigns. By analyzing key metrics such as conversions, leads, and sales, you can gain insights into what strategies are working and make data-driven decisions to optimize your marketing efforts.
Cost Efficiency
With performance marketing, you only pay for the desired outcomes achieved, such as clicks or conversions. This cost-efficient approach ensures that your marketing budget is allocated to the strategies that deliver tangible results, maximizing your return on investment.
Targeted Audience Reach
Performance marketing enables you to precisely target your ideal audience based on demographics, interests, and online behavior. By reaching the right people at the right time, you can increase the chances of generating high-quality leads and conversions.
Scalability and Flexibility
Performance marketing allows you to scale your campaigns based on your business needs. You can easily adjust your budgets, test different strategies, and optimize your campaigns in real-time, ensuring that your marketing efforts align with your goals and adapt to changing market conditions.
Continuous Improvement
One of the key advantages of performance marketing is the ability to gather data and insights throughout the entire customer journey. This data-driven approach enables you to identify areas of improvement, refine your messaging, and enhance your customer experience, resulting in higher engagement and better overall performance.
You can hire an experienced marketing automation consultant to your team to unlock the full potential of marketing campaigns, understand customer journey, drive meaningful results, and stay ahead in the competitive B2B SaaS landscape.
9 Performance Marketing Hacks in 2026
Are you ready to revolutionize your performance marketing strategy in 2026?
My unique process brings you nine powerful performance marketing hacks designed to elevate your campaigns and drive exceptional results. From leveraging user-generated content to optimizing for voice search, these hacks are based on the latest industry insights and innovative techniques. Get ready to take your marketing efforts to new heights and outperform your competition.
Here are the nine performance marketing hacks for 2026:
1. Hack the Micro-Moments
In today's digital landscape, capturing your audience's attention in specific micro-moments along their customer journey is crucial. Micro-moments are instances where individuals are actively seeking information, making decisions, or looking for solutions. By identifying these micro-moments and tailoring your marketing messages to address their needs, you can effectively engage your audience and drive conversions.
Example: Suppose you are a B2B company specializing in project management software. One micro-moment could be when a potential customer searches for "how to streamline project workflows."
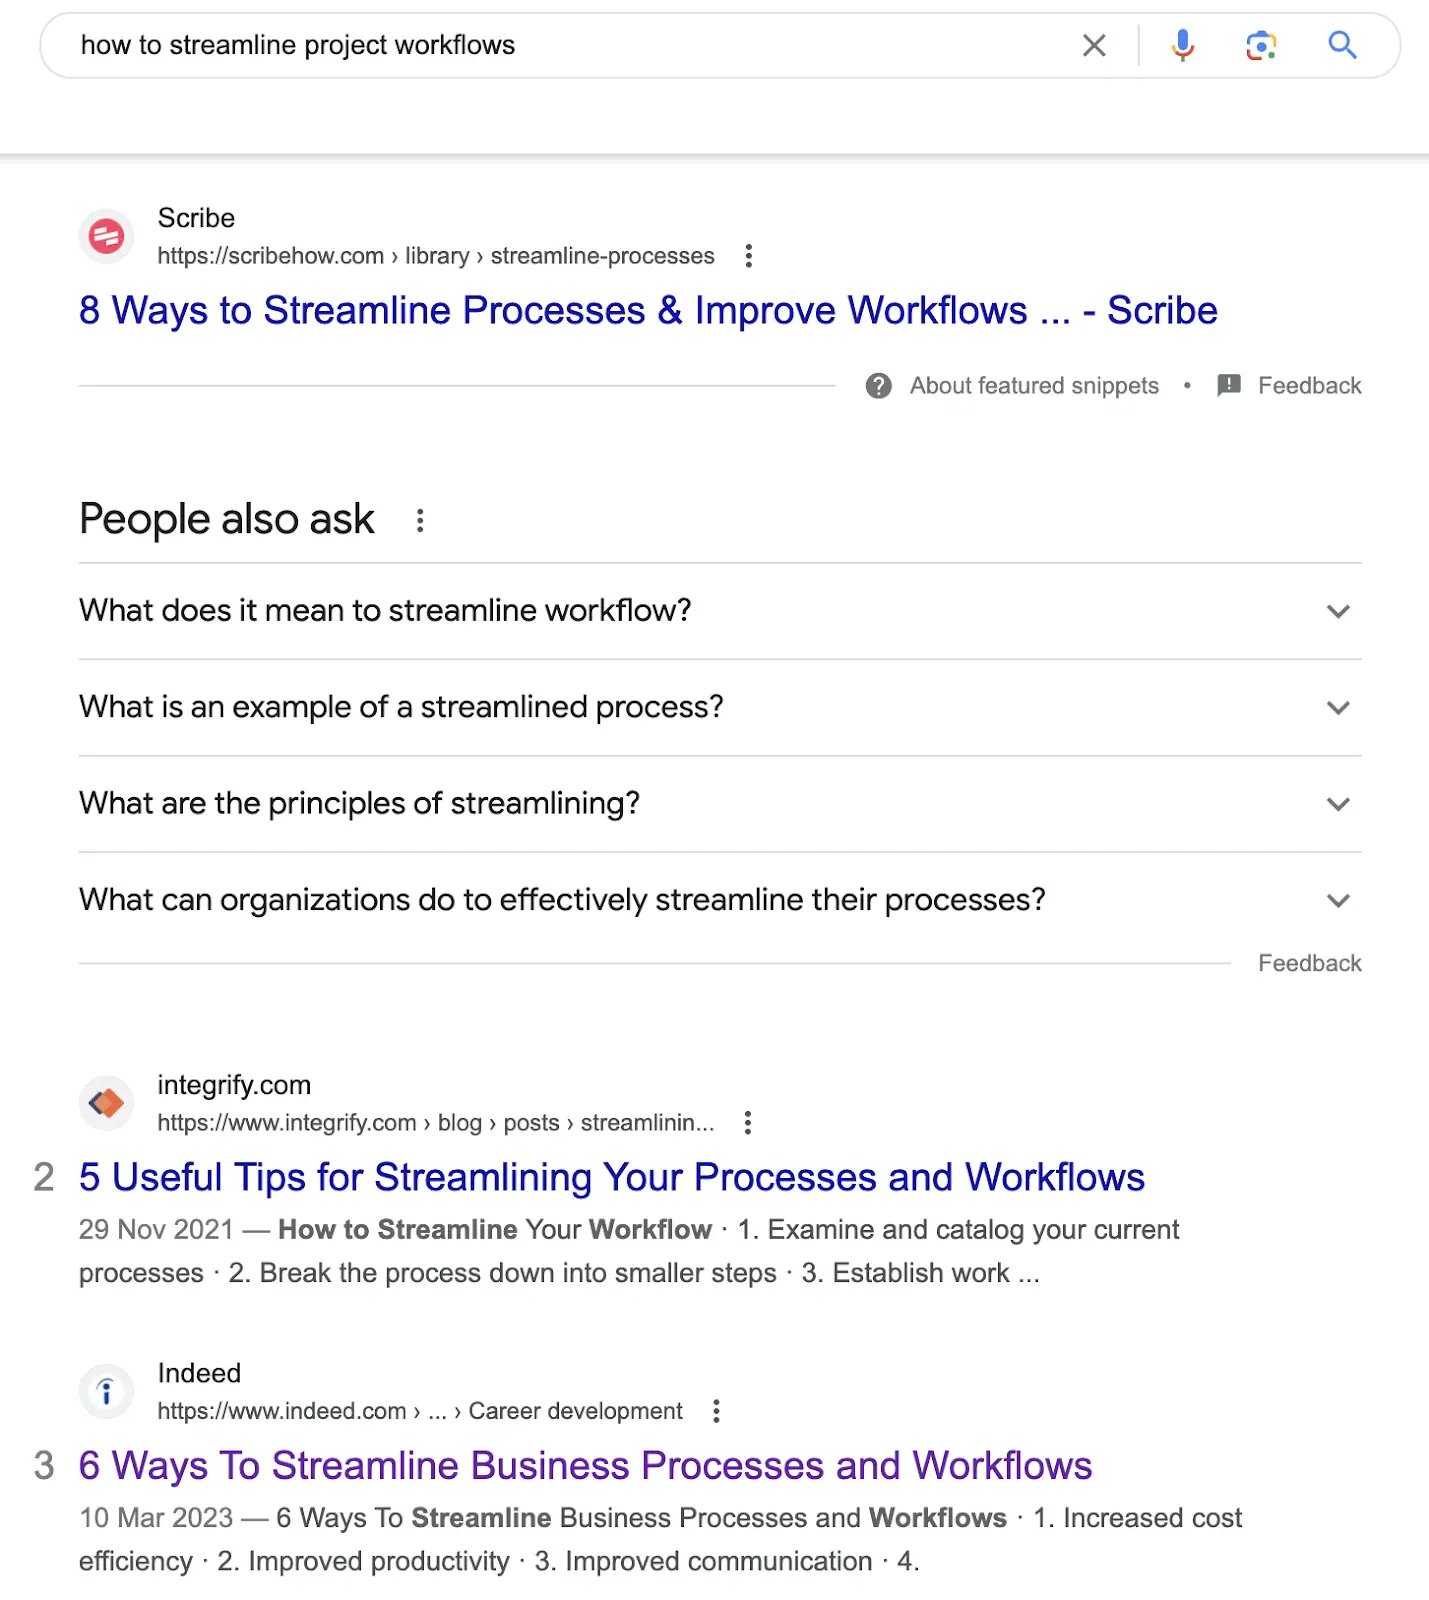
In response, you create content that addresses this pain point, such as a blog post titled "5 Proven Strategies to Streamline Your Project Workflows."
Pro Tip
- Conduct thorough audience research to identify micro-moments relevant to your target market.
- Utilize keyword research tools to discover common search queries associated with these micro-moments.
- Develop content that aligns with these moments and provides valuable solutions.
- Incorporate targeted keywords in your contents ensuring to rank in search results.
2. Optimize for Voice Search
In the era of voice assistants and smart devices, optimizing your content for voice search is essential to ensure your brand remains visible and accessible to your target audience. Voice search queries tend to differ from traditional text-based searches, as they are more conversational and often phrased as questions. By adapting your content strategy to accommodate these voice-based queries, you can improve your chances of appearing in voice search results and capturing valuable organic traffic.
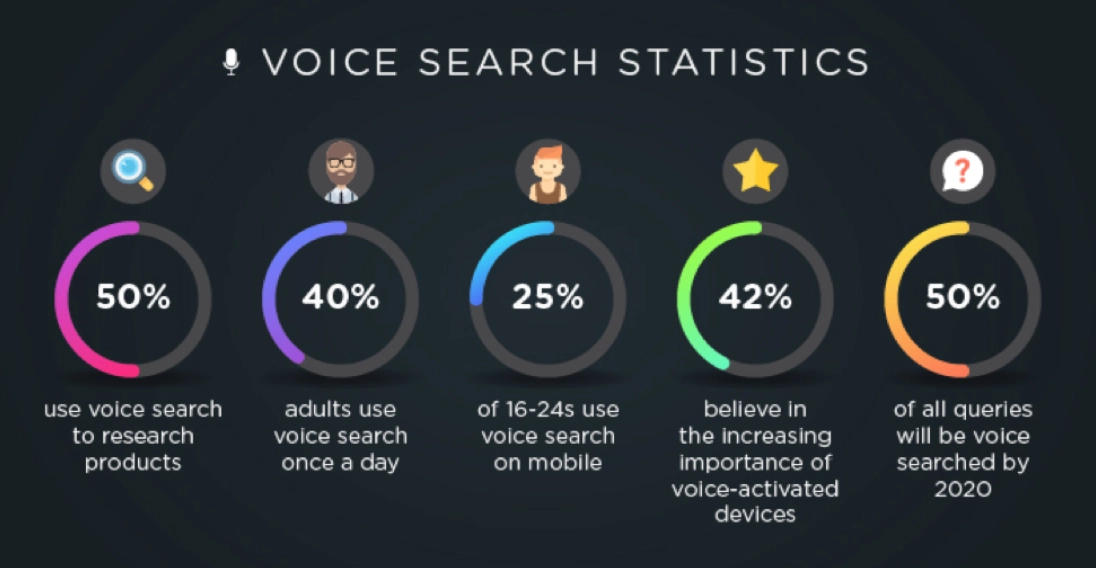
Example: Let's say you run a B2B company that offers customer relationship management (CRM) solutions. Instead of solely focusing on traditional keyword phrases like "CRM software," optimize for voice search queries such as "What are the best CRM software options for small businesses?" or "How can CRM software improve sales productivity?"
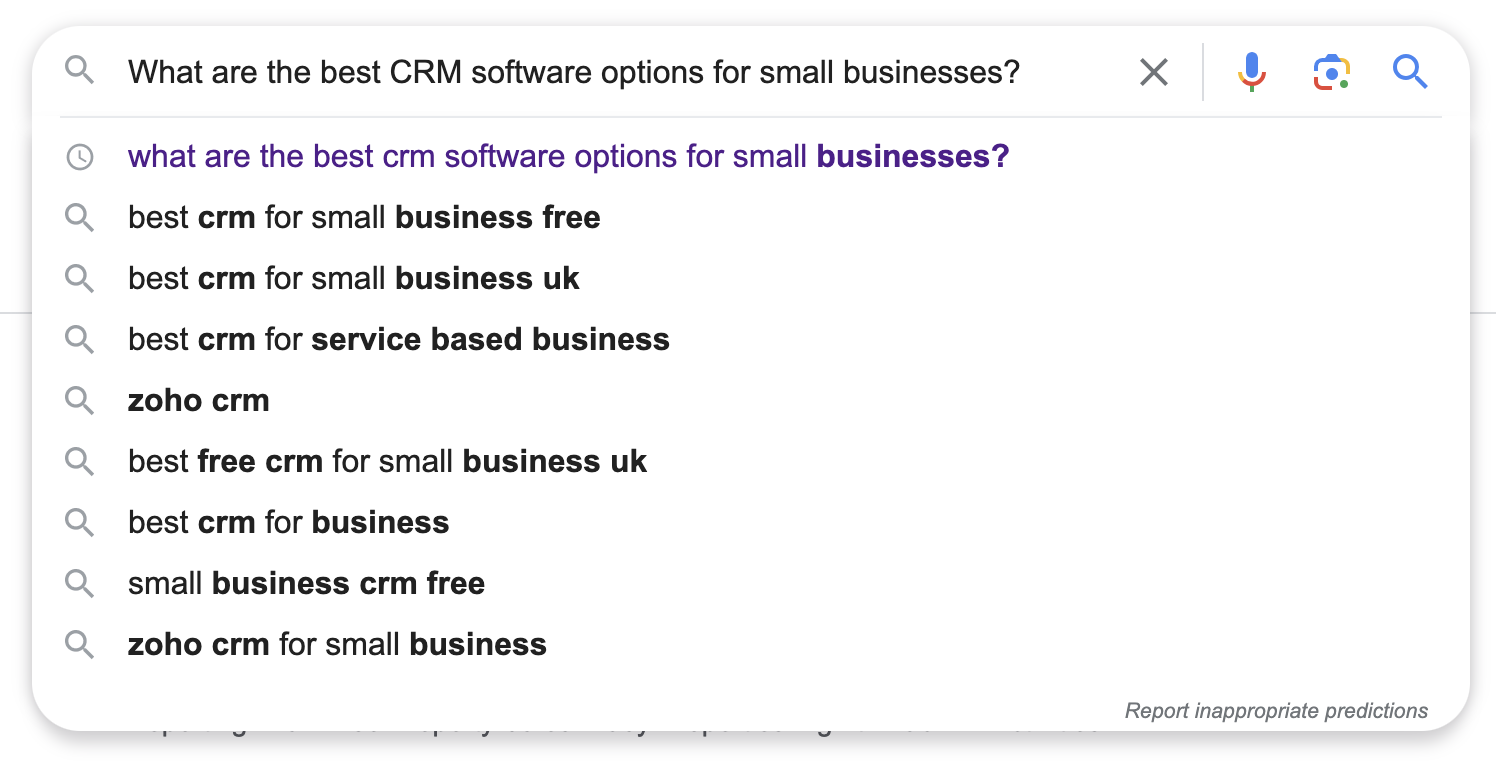
Pro Tip:
- Incorporate long-tail keywords and conversational language into your content.
- Consider creating FAQ pages or blog posts that directly address common questions related to your industry or product.
- Leverage structured data markup (such as schema.org) to provide search engines with clear information about your content, making it easier for them to understand and present in voice search results.
3. Leverage User-Generated Content
User-generated content (UGC) is a powerful tool that allows your customers to become advocates for your brand. It involves encouraging and showcasing content created by your users, such as reviews, testimonials, social media posts, or case studies. Leveraging UGC can build trust, increase engagement, and enhance your brand's credibility in the eyes of your target audience.
Example: Let's say you operate a B2B company that provides call tracking software for small scale businesses. You can encourage your customers to share their success stories, positive experiences, or case studies using your software.
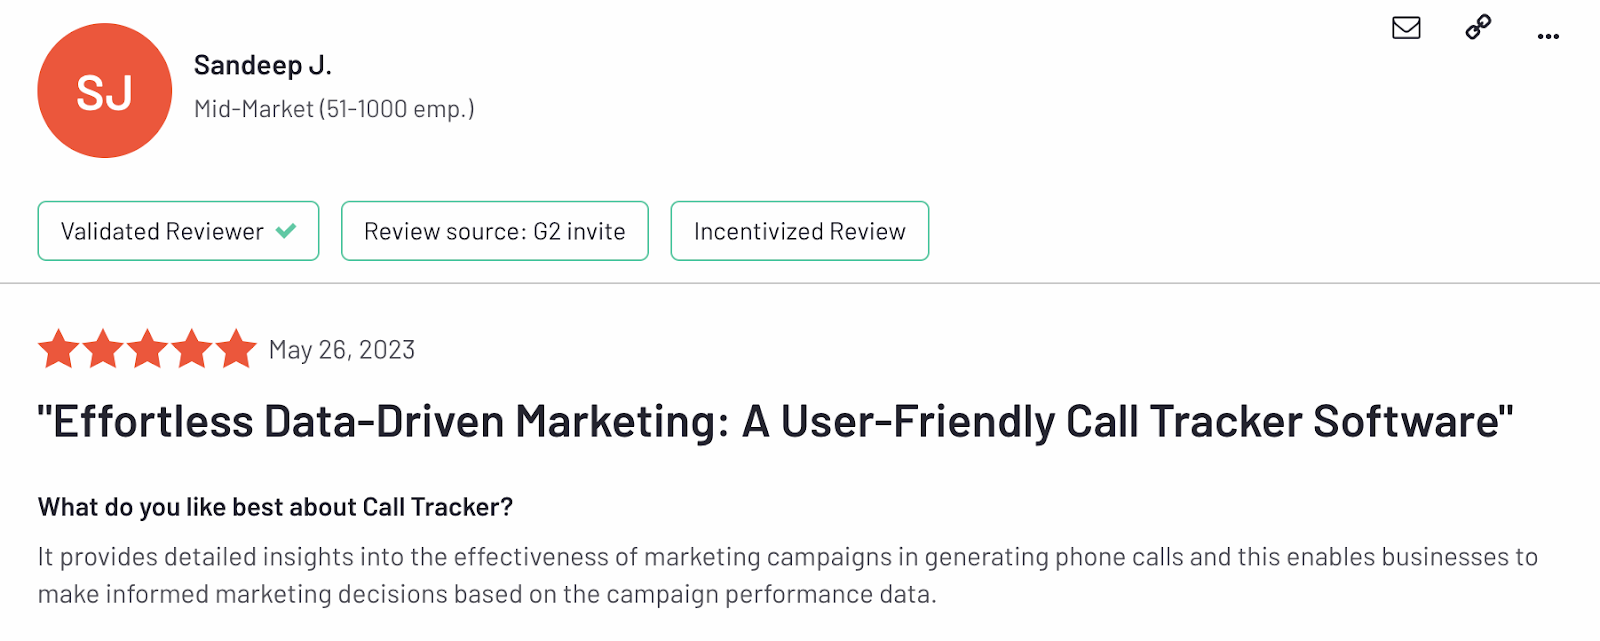
Highlight these stories on your website, social media channels, or even in your email newsletters to demonstrate the value and benefits of your product through authentic and relatable experiences.
Pro Tip
- Create dedicated spaces on your website or social media platforms where users can submit their content.
- Offer rewards, discounts, or recognition to those who contribute valuable UGC.
- Monitor your social media channels, online reviews, and other platforms where customers may leave feedback.
4. Embrace Personalization
Personalization has become a crucial aspect of effective marketing including tailoring your marketing messages, offers, and recommendations based on individual customer preferences and behaviors. By delivering personalized experiences, you can enhance engagement, build stronger connections with your audience, and ultimately drive higher conversion rates.
Example: Suppose you are a B2B company that offers email marketing software. Instead of sending generic email campaigns to your entire subscriber list, segment your audience based on their interests, past interactions, or purchase history. Then, personalize your email content, subject lines, and product recommendations to cater to each segment's specific needs. For example, you can send targeted emails about advanced email automation features to customers who have shown interest in automation tools.

Pro Tip:
- Utilize marketing automation workflows to segment audience based on the data generated.
- Craft personalized messages that resonate with each segment, addressing their pain points and highlighting the benefits of your solution.
- Consider using dynamic content that adapts to each recipient's preferences in real-time.
5. Harness the Power of Influencer Marketing
Influencer marketing has emerged as a highly effective strategy to expand your brand's reach, build credibility, and drive engagement. By collaborating with influencers who align with your brand values and have a dedicated following, you can leverage their influence and tap into their established trust to promote your B2B SaaS solution.
Example: Suppose you offer project management software for creative agencies. Identify influencers in the creative industry, such as renowned designers or project management experts, who have a strong online presence and a relevant audience. Partner with them to create sponsored content, co-host webinars, or conduct interviews to showcase how your software solves common pain points for creative agencies.
Pro Tip:
- Look for influencers whose values align with your brand and who have an engaged and relevant audience.
- Establish clear goals and expectations when partnering with influencers to ensure a successful and mutually beneficial partnership.
- Develop a partnership strategy that aligns with your marketing goals and leverage the influence of these trusted individuals to expand your brand's reach and drive meaningful engagement.
6. Implement Video Marketing Strategies
Video marketing has become increasingly dominant in the digital industry, offering a powerful medium to engage your audience, deliver compelling messages, and increase brand recall. By implementing effective video marketing strategies, you can captivate your audience and drive higher levels of engagement and conversion.

Example: Suppose you are a B2B company providing customer support software. Create tutorial videos using an online video editor that showcase how to maximize the features of your software, address common pain points, or provide tips for efficient customer support. You can also feature customer success stories through video testimonials, where clients share their positive experiences using your software.
Pro Tip:
- Optimize your videos for different platforms and devices. Keep them concise, attention-grabbing, and focused on delivering value within the first few seconds.
- Use storytelling techniques to engage your audience and showcase real-life scenarios or case studies.
- Include a strong call-to-action at the end of each video to encourage viewers to take the desired action, such as visiting your website, signing up for a trial, or contacting your sales team.
- Invest in quality production, including clear audio, engaging visuals, and professional editing.
7. Optimize for Mobile-First Experiences
In today's mobile-driven world, optimizing your website and marketing efforts for mobile devices is essential. With the majority of internet users accessing content from mobile devices, delivering seamless mobile experiences is crucial for engaging your audience and driving conversions. By prioritizing mobile-first experiences, you can ensure that your brand remains accessible and user-friendly on smartphones and tablets.
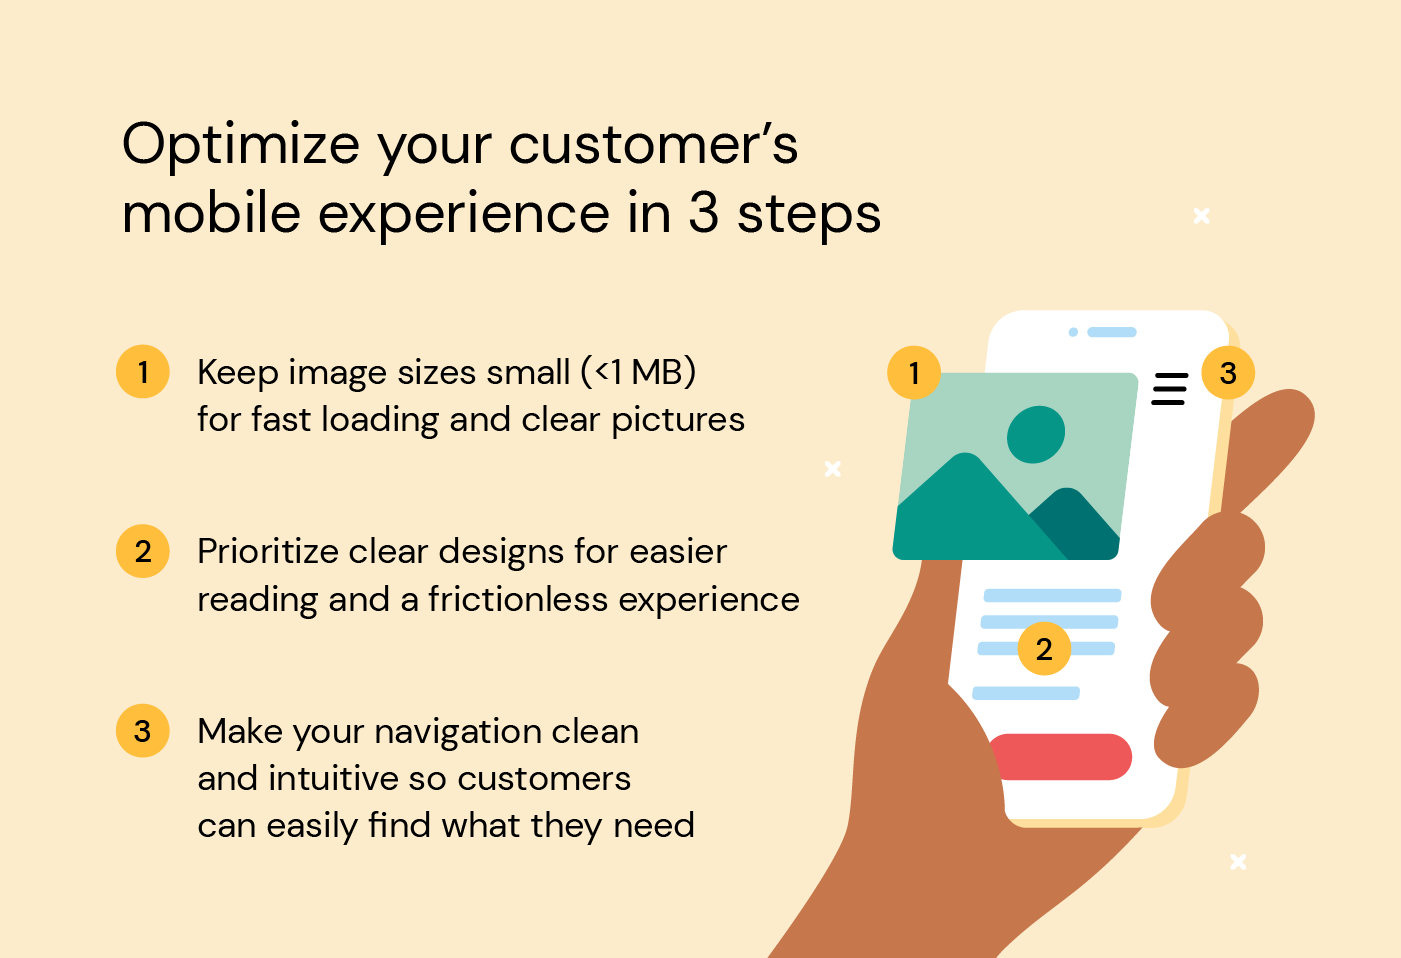
Example: Suppose you offer a B2B SaaS solution for project collaboration. Optimize your website by implementing responsive design, which automatically adjusts the layout and content based on the user's device screen size. Ensure that your website loads quickly, provides intuitive navigation, and presents key information clearly, even on smaller screens. Simplify forms and optimize them for touch input to streamline the user experience on mobile devices.
Pro Tip:
- Test your website's mobile-friendliness using tools like Google's Mobile-Friendly Test.
- Optimize your website's loading speed by compressing images, enabling browser caching, and minimizing unnecessary code.
- Prioritize the most important content and call-to-action buttons to ensure they are easily accessible and visible without excessive scrolling.
- Continuously test your website across different devices and screen sizes to ensure a seamless experience.
8. Utilize AI-Powered Automation
Incorporating AI-powered automation into your performance marketing strategy can greatly streamline your processes, save time, and increase efficiency. By leveraging automation tools, you can automate repetitive tasks, personalize communication, and deliver targeted content at scale, ultimately enhancing the effectiveness of your campaigns.
Example: Suppose you run a B2B company that offers marketing automation software. Utilize an AI-powered email marketing automation tool to automatically segment your audience based on their behavior and preferences. Set up automated email workflows that nurture leads, send personalized recommendations, and follow up with relevant content based on specific triggers or actions taken by the recipients.
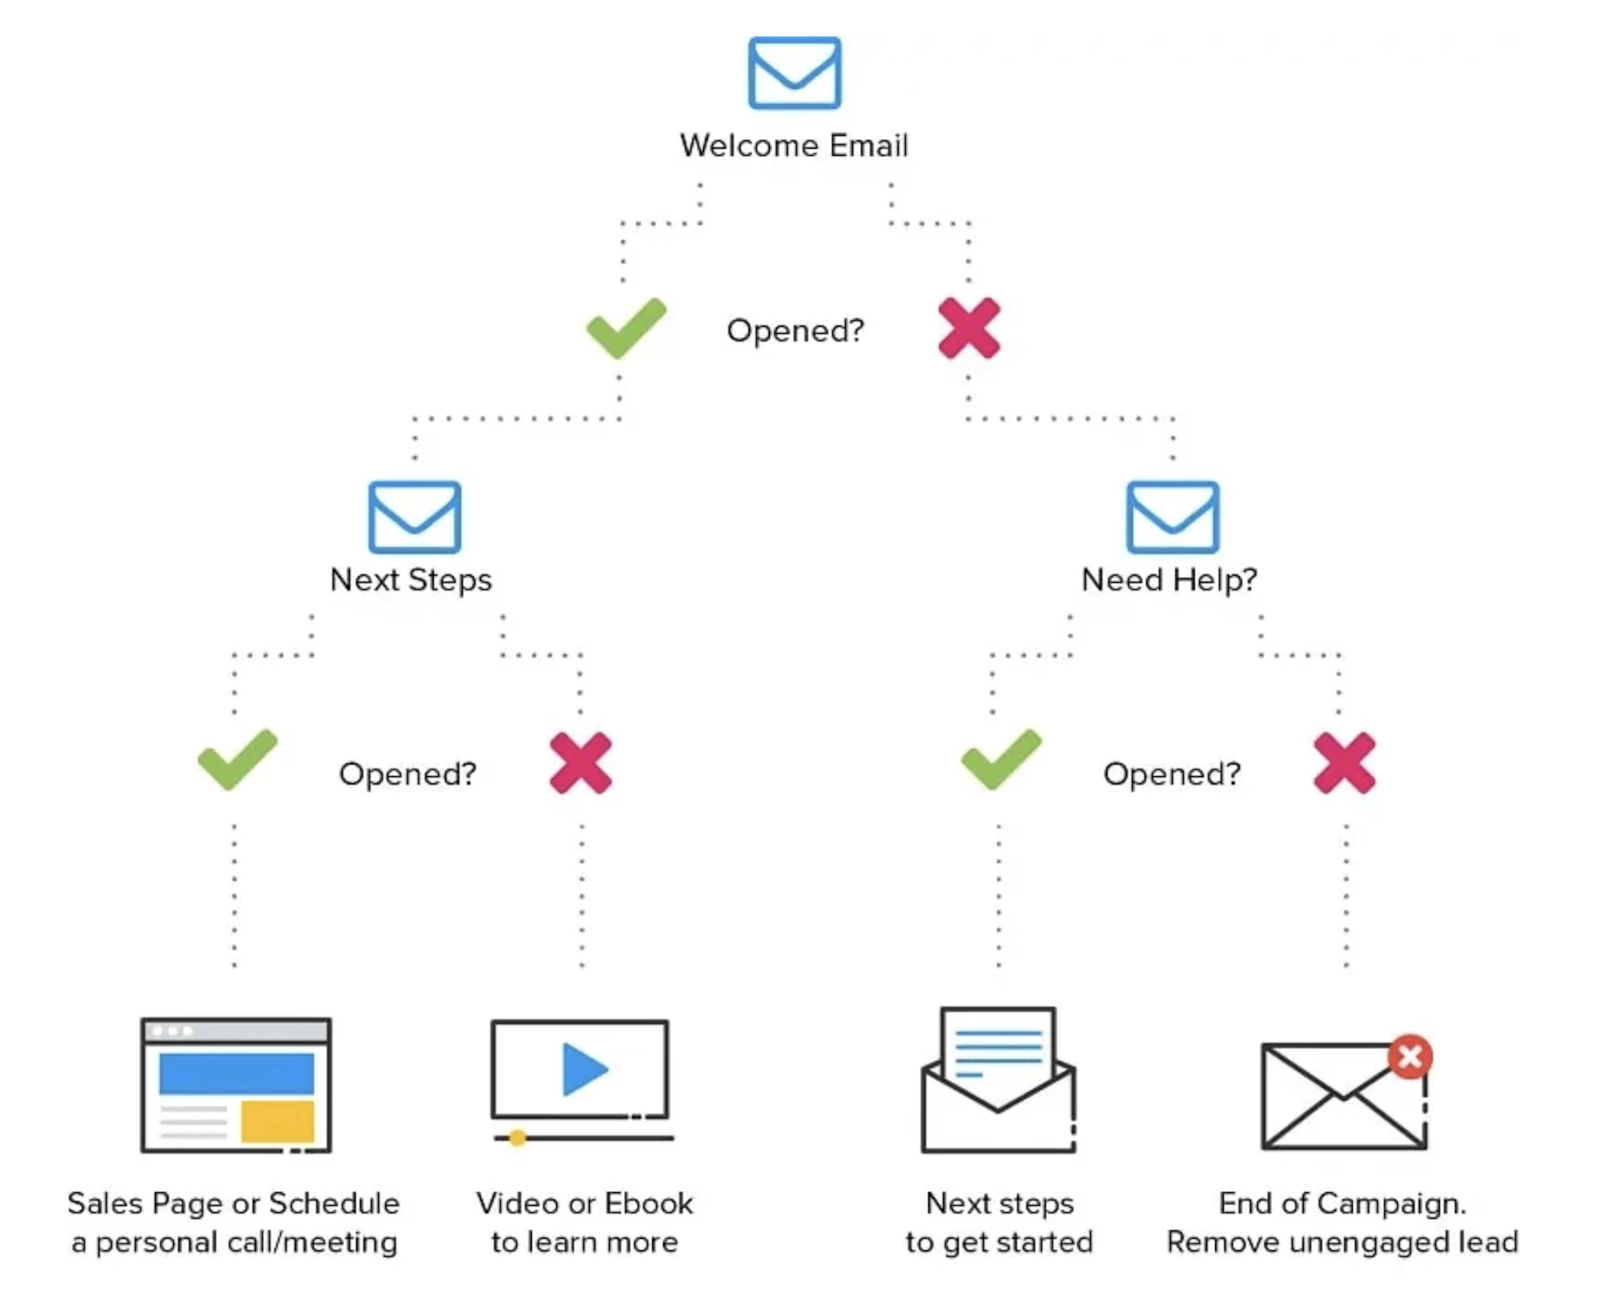
Pro Tip:
- Begin by identifying repetitive tasks that can be automated, such as email scheduling, social media posting, or lead scoring.
- Integrate your automation tools with your customer relationship management (CRM) system to sync data and ensure a seamless flow of information.
- Regularly analyze and optimize your automation workflows to ensure they align with your business goals and provide a personalized experience for your audience.
- Map out your customer journey and identify opportunities where automation can enhance your marketing efforts.
9. Experiment with Emerging Technologies
Staying ahead in the fast-paced digital landscape requires embracing emerging technologies and exploring innovative ways to engage your audience. By experimenting with technologies like augmented reality (AR), virtual reality (VR), or interactive content, you can differentiate your brand, create memorable experiences, and leave a lasting impression on your target audience.
Example: Suppose you offer a solution for architectural design. Develop an AR mobile app that allows users to visualize how their designs would look in real-world environments. Users can use their smartphones or tablets to overlay virtual 3D models onto physical spaces, enabling them to experience and interact with architectural designs in an immersive way.
Pro Tip:
- Start by researching emerging technologies that align with your industry and target audience.
- Collaborate with technology partners or experts to bring your ideas to life.
- Prioritize providing value and enhancing the user experience when incorporating emerging technologies into your campaigns.
{{CTA_BANNER}}
Key Considerations For Implementing Performance Marketing
Implementing performance marketing requires careful consideration of several key factors to ensure success. Here are some additional insights to keep in mind:
Data-driven Decision Making
Performance marketing thrives on data and analytics. It's crucial to establish a robust data infrastructure, including proper tracking, measurement, and analysis of key performance indicators (KPIs). Leverage tools like Google Analytics, Factors.AI, or other marketing analytics platforms to gather actionable insights that inform your marketing strategies and optimizations.
Continuous Testing and Optimization
Performance marketing is an iterative process. Embrace a culture of continuous testing and optimization to refine your campaigns and improve their effectiveness. Conduct A/B tests, experiment with different ad creatives, landing page designs, and messaging variations to identify what resonates best with your audience. Tools like Optimizely, Google Optimize, or Factors.AI's experimentation features can assist in running controlled experiments and optimizing your campaigns based on data-driven insights.
Integration and Alignment
Ensure seamless integration and alignment between your marketing, sales, and customer success teams. Collaboration and communication are essential to create a cohesive customer journey and provide a unified experience. Implement marketing automation tools like Factors.AI to streamline lead management, nurture customer relationships, and foster a data-driven approach across departments.
By considering these insights and incorporating them into your marketing automation strategy, you can maximize the impact of your campaigns, drive conversions, and achieve your business goals.
{{INLINE_TOFU}}
How to Choose the Best Performance Marketing Tool?
To further enhance your performance marketing efforts, selecting the right performance marketing tool is crucial. Here are a few considerations to help you choose the best tool for your needs:
Assess Your Goals and Requirements
Start by clearly defining your goals and requirements. Identify the specific functionalities you need in a performance marketing tool, such as campaign management, analytics, automation, or integrations with other platforms. Consider factors like scalability, ease of use, and pricing models that align with your budget.
Research and Compare Options
Conduct thorough research on different performance marketing tools available in the market. Compare their features, user reviews, customer support, and reputation in the industry. Factors.ai offers a comprehensive suite of performance marketing features designed to optimize campaigns, enhance targeting capabilities, streamline data analysis, and maximize ROI.
Request Demos and Trial Periods
Once you have shortlisted a few tools, request demos or trial periods to evaluate their functionality and user experience firsthand. This will help you assess how intuitive the tool is, how well it aligns with your workflow, and whether it provides the necessary insights and functionalities to meet your performance marketing objectives.
Remember, the best performance marketing tool for your business will depend on your unique requirements, objectives, and budget. Take the time to thoroughly evaluate and compare different options to ensure you choose a tool that empowers you to optimize your campaigns, drive results, and achieve your performance marketing goals.
To enhance performance marketing, businesses can implement nine innovative strategies:
1. Hack the Micro-Moments: Engage users when they are making quick decisions, typically on mobile devices.
2. Optimize for Voice Search: As voice-activated devices become more common, optimizing for conversational queries is essential for staying ahead.
3. Leverage User-Generated Content: Customer-created content, such as reviews or social media posts, can increase trust and drive engagement.
4. Implement AI-Powered Chatbots: Use chatbots to provide real-time customer support, increasing customer satisfaction and conversion rates.
5. Utilize Predictive Analytics: By analyzing data, businesses can anticipate future customer behavior, allowing for more personalized and targeted marketing efforts.
6. Focus on Mobile Optimization: Ensure that mobile users have a seamless experience, as mobile traffic continues to rise.
7. Employ Retargeting Strategies: Re-engage visitors who didn’t convert on the first visit with tailored ads to increase conversion rates.
8. Personalize Email Campaigns: Customize emails based on user behavior and preferences to increase open rates and engagement.
9. Analyze and Iterate: Constantly evaluate the performance of marketing strategies and make data-driven adjustments.
By leveraging these strategies, businesses can significantly improve their marketing ROI and customer engagement.
Wrapping Up and My Experience With Performance Marketing
In conclusion, as we wrap up this tutorial on performance marketing hacks in 2025, I want to congratulate you on completing this insightful journey. I hope that you've found these strategies and insights to be valuable assets for your performance marketing endeavors.
With over 10 years of hands-on experience in the field, I have witnessed firsthand the transformative power of these hacks. Collaborating with diverse clients across industries, I have had the privilege of optimizing campaigns, driving conversions, and helping businesses achieve their goals.
As you apply these strategies and leverage the insights provided, you can position yourself to drive exceptional performance and stay ahead of the competition in the dynamic world of performance marketing. Embrace these powerful tools and techniques, and propel your marketing efforts to new heights of success.


We don’t just write about demand gen. We deliver it.
Our AI Agents help you uncover high-intent accounts, run campaigns that actually convert, and keep your GTM motion in sync.
1000+ GTM teams have already scaled their pipeline with Factors.
*Includes built-in peace of mind. And fewer late-night funnel audits.

.svg)


.png)