Good Reads
Fix pipeline pains. Solve GTM puzzles. Read strategic brain dump.
Written for marketers who want real solutions to a leaking pipeline (and their dark circles).
Want to read more from us?


I’m looking for…
![Dreamdata vs. Hockeystack [2026]: Features, Pricing, Reviews & More](https://cdn.prod.website-files.com/6898fdb2a8e6d57199082db3/698c58225ed710c98ab5fdfb_63fc6752c3a6b98068b7594f_Dreamdata%2520vs%2520HockeyStack.avif)
Dreamdata vs. Hockeystack [2026]: Features, Pricing, Reviews & More
Compare Dreamdata vs HockeyStack by features, pricing, reviews, and more. Find the best B2B marketing attribution tool for you

It’s no secret that the B2B SaaS funnel involves several touchpoints across campaigns, website, offline events, and CRM. Given that customer journeys are complex and nonlinear, measuring and optimizing marketing’s impact on revenue may seem like a daunting task. To solve for this, there’s been an influx of plug and play B2B marketing attribution and analytics tools in recent years.
While there’s no shortage of marketing attribution tools out there, each solution has its own unique set of features, strengths, and limitations. This blog compares two popular B2B marketing attribution tools — Dreamdata and Hockeystack — to help readers decide which solution may be better suited to their needs.
Note that this blog won’t cover the basics of what marketing attribution is. Instead, you can find a wide range of resources on marketing attribution here:
- A Comprehensive Guide To Marketing Attribution
- B2B Marketing Attribution
- Challenges With B2B Attribution (And How To Get Over Them)
About Dreamdata
Dreamdata is a Denmark-based B2B revenue attribution platform that works to connect and crunch revenue related data across the customer journey. At a high level, much like any other competent marketing analytics tool, Dreamdata helps teams identify what GTM effort drives revenue, where to cut costs, and how to scale the right campaigns.
As following sections highlight, Dreamdata provides a robust analytics suite, a wide-range of integrations, and a strong customer success experience. That being said, the platform seems to fall short when it comes to implementation, custom reporting and dashboarding, and ease of use. Each of these features and limitations are covered in detail below.
About HockeyStack
HockeyStack is a B2B analytics and attribution platform that helps teams track data across campaigns, website, and CRM to measure marketing ROI, view account-based intent signals, and improve budget allocation.
HockeyStack claims a rapid implementation process and customizable dashboards. That being said, HockeyStack offers fewer integrations and limited granularity when it comes to reporting. Again, each of these features and shortcomings are highlighted in detail below.
Dreamdata vs. HockeyStack: Key Features
Both Dreamdata and HockeyStack are effective marketing attribution tools in their own right — but no product is perfect. The next couple of sections examine key features, strengths and limitations of each solution. Naturally, there’s bound to be significant overlap; but the devil is in the details. After covering a few key common features, we explore where each platform outperforms the other.
#1 Tracking & Analytics:
As most analytics solutions do, both Dreamdata and Hockeystack unify marketing and revenue data under one roof. Both tools also provide a wide range of analytics capabilities to help teams make well-informed decisions across campaigns, website, content, and more.
Both solutions employ javascript codes that are added to a website to track visitor interactions and engagement. They can measure standard website performance metrics like pageviews, scroll depth, clicks, form submissions, and more at an account and user level. In turn, teams can gauge customer behavior and learn how different content and webpages influence pipeline by cohort.
Dreamdata and HockeyStack also integrate with ad platforms, marketing automation platforms, and CRMs to consolidate campaign metrics, offline events, and revenue metrics. This helps marketing teams monitor their efforts and understand what’s helping or hurting bottom line conversions. Note that Dreamdata currently provides a wider range of integrations than HockeyStack — more on this later.
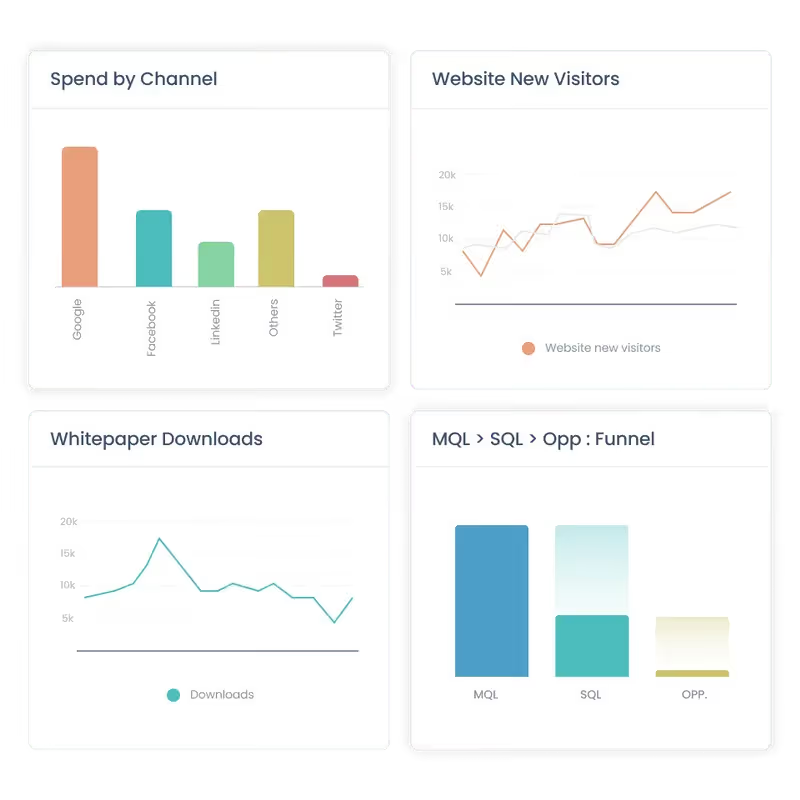
#2 Multi-touch attribution
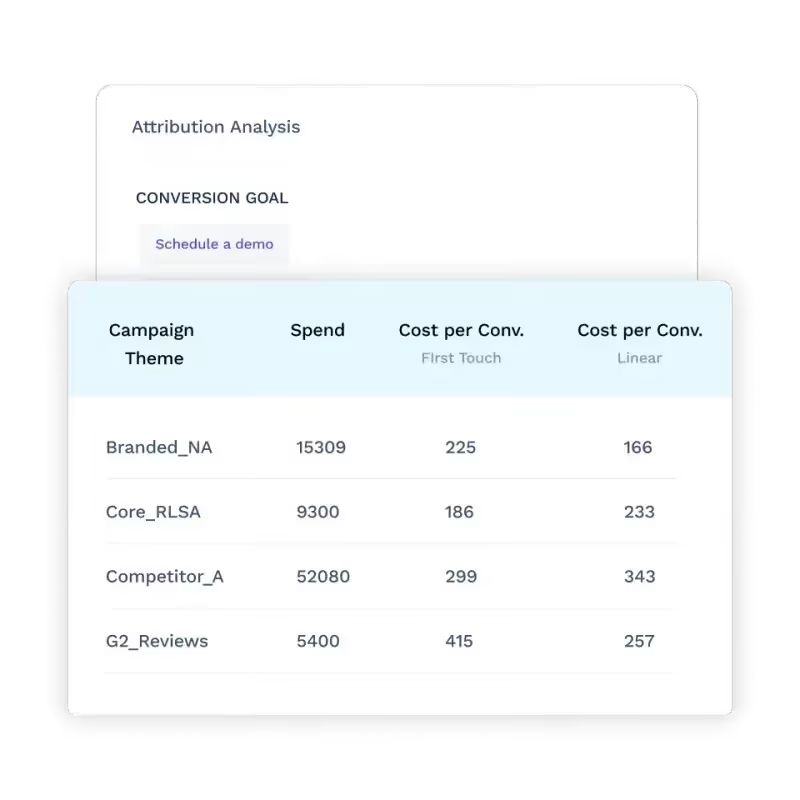
Attribution analysis is at the core of Dreamdata and Hockeystack. Unsurprisingly, both solutions do a good job of measuring performance across marketing activities and attributing each touchpoint back to revenue.
They can stitch and credit measurable touchpoints across channels, campaigns, website, and offline events (from CRM) based on their influence on pipeline. Using a range of multi-touch attribution models, marketing teams can quantify their impact on revenue from first-touch to deal won at an account level. Here are a few use-cases multi-touch attribution on Dreamdata and Hockeystack can solve for:
- Measuring ROAS across ad campaigns
- Attributing revenue back to marketing channels
- Tracking the impact of organic social and SEO efforts
- Learning which content and channels drive bottom-line metrics
#3 Journeys
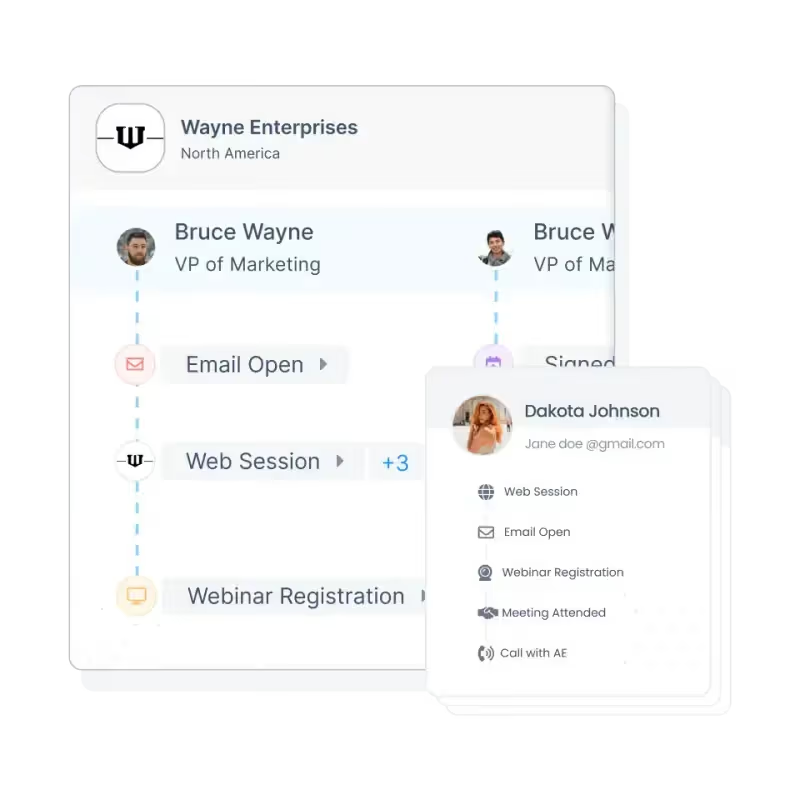
Journeys analytics is a relatively recent feature that’s not as common amongst other marketing analytics and attribution tools. That being said, both Dreamdata and HockeyStack offer variants of journey analytics.
In short, journey analytics helps teams visualize complex, non-linear customer journeys by mapping each stakeholder’s touch-points at an account level. Why is this helpful? It provides an intuitive timeline of profiles, behavior, and intent across each account within the pipeline. This information may in turn be used to personalize further marketing efforts, optimize retargeting campaigns, customize sales pitches, and identify buying patterns.
HockeyStack and Dreamdata work well for all three features covered above. Still, both tools have their own strengths and limitations. The following section highlights stand-out reasons why users may prefer one over the other.
What Dreamdata Does Better
1. Out-of-the-box Integrations
Dreamdata offers a wider range of out-of-the-box integrations as compared to HockeyStack. While both solutions provide integrations with the most popular ad platforms, CRMs, MAPs, and CDPs, Dreamdata goes the extra mile to cater to relatively niche platforms and data warehouses as well.
Key integrations supported by Dreamdata and HockeyStack*: HubSpot, SalesForce, Google Ads, Facebook Ads, Linkedin Ads, Marketo, Pardot, Intercom, Segment
Key integrations supported by Dreamdata but not HockeyStack*: Zoho, G2, Zapier, Outreach, AdRoll, Google Data Studio, BigQuery
*based on HockeyStack website
Pro Tip: Note that in case Dreamdata and HockeyStack doesn’t support an integration for a specific platform, both tools offer custom integrations as per demand.
2. Detailed & Granular Reporting
Although this isn’t necessarily a drawback with HockeyStack, users have complained about its lack of granularity. Reviews compare HockeyStack’s reporting capabilities to that of Google Analytics (GA4) — decent, but not detailed enough. Given that Dreamdata is a relatively mature product, their reporting capabilities provide deeper insights across conversion rates, customer lifetime value, and revenue attribution, and more.

3. Customer Success
B2B analytics and attributions platforms are complex. While tools are becoming increasingly intuitive, it’s important for non-technical users to have easy access to timely, effective CSM. Fortunately, Dreamdata seems to support robust customer success servicing. This is especially valuable since Dreamdata’s implementation is reportedly an involved process.

4. Templatized Reporting + UI
This is a double edged sword. Dreamdata delivers a structured, non-customizable dashboard and event framework that offers little room for flexibility. Dashboards are broadly grouped into the following categories: Engagement, Content, Performance, Journeys and Revenue.
On one hand, this may be beneficial to smaller SaaS teams with limited technical resources as it’s likely to cater to most of their analytics and reporting needs.
However, as the business starts to scale, its requirements may include custom dashboards and events that are company-specific. At this point, Dreamdata’s templatized reporting may be a drawback.
Although reviews suggest that Dreamdata involves a steep learning curve, it’s fair to assume that its UI is a step ahead of HockeyStack. HockeyStack is a relatively younger product and users tend to find the platform a little rough around the edges. That being said, reviews also suggest that they’re showing quick improvement. It’s likely only a matter of time before both platforms are on par with each other.

What HockeyStack Does Better
1. Implementation
HockeyStack makes strong claims about its rapid implementation process, suggesting that users can onboard and get started in a matter of minutes. This is in stark contrast to Dreamdata, which, as a more sophisticated tool, requires an involved, drawn-out implementation process. HockeyStack’s intuitive onboarding is a big advantage to smaller teams that don’t have the resources for dedicated onboarding or maintenance support.

2. Custom Dashboards
Dreamdata’s platform focuses on solving the most common SaaS use-cases. As a result, the platform tends to be relatively less flexible. HockeyStack, on the other hand, promotes far more customizations across events, reports, dashboards, and visualizations. HockeyStack provides the option of preconfigured templates, but lets users build reports from scratch as well. While granularity may be lacking when compared to Dreamdata, this ability for flexible dashboarding may be helpful for teams looking for tailor-made, high-level reports.

3. Funnels, Surveys & Impression Tracking
Along with the key analytics and attribution features discussed, HockeyStack provides a few features that Dreamdata doesn't.
The most valuable of these features is probably Funnels. Funnels is a powerful analytics technique that helps users graphically visualize different stages of the sales cycle. These stages can be configured by users to, for example, see how website visitors are progressing from the home page, to the pricing page, and to a blog before scheduling a demo.
Surveys is another feature that, as the name suggests, allows users to create surveys for self attribution. Finally, Linkedin Impression Tracking is another nifty feature that enables users to identify companies viewing Linkedin campaigns.
Dreamdata vs. HockeyStack: Pricing
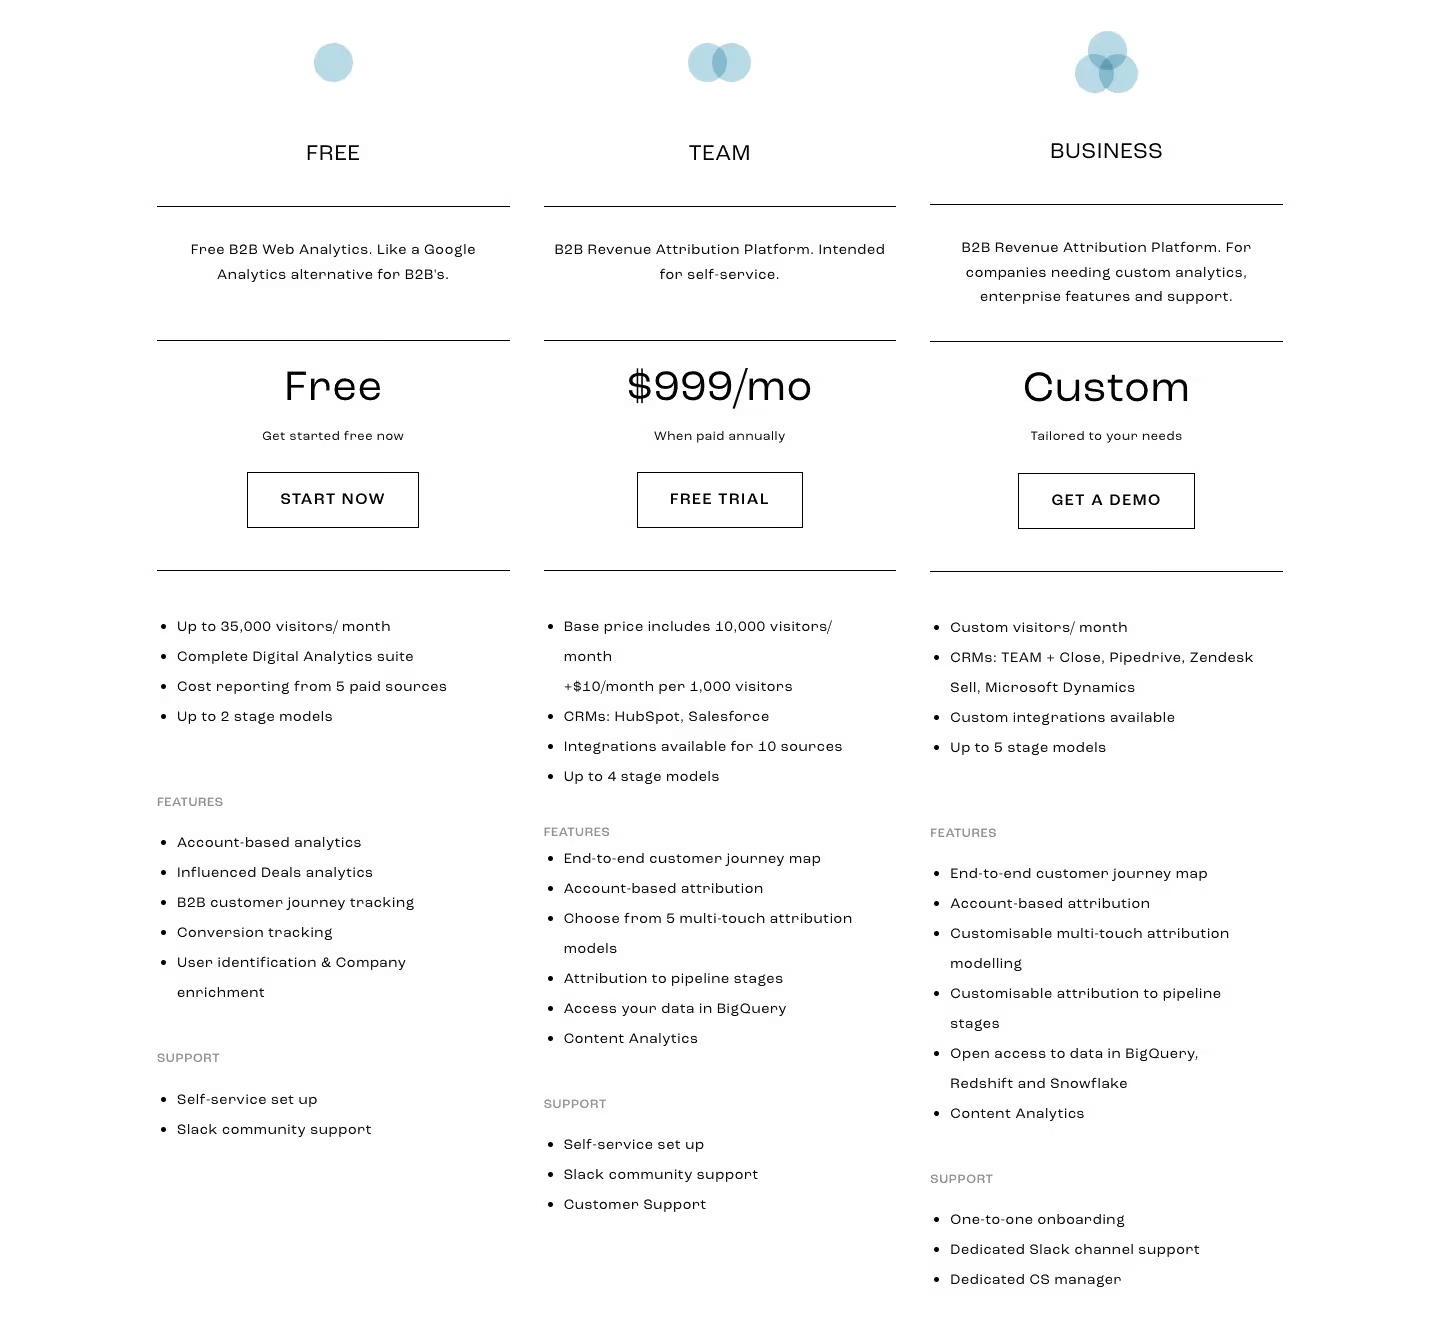
[December 2023 Update]: Both HockeyStack and Dreamdata have revised pricing since this article was published. While HockeyStack have increased their starting price, Dreamdata have decreased theirs. Here's an updated rundown of pricing:
- Dreamdata pricing now starts at $599/mo for up to 30,000 MTUs
- HockeyStack pricing now starts at $1399/mo for up to 10,000 monthly visitors


[Pricing as of February 2023]
- Dreamdata’s paid plans start at $999/month for 10 seats and up to 10,000 MTUs
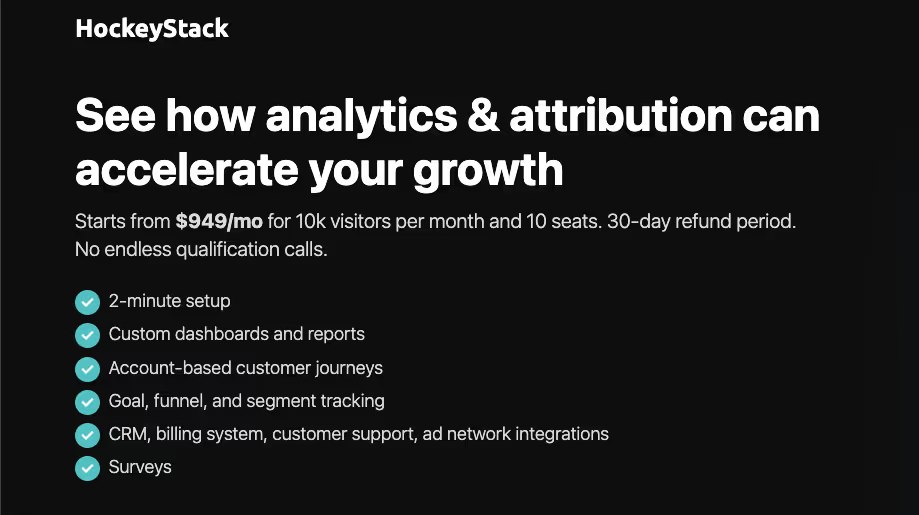
- HockeyStack’s paid plans start at $949/month for 10 seats and up to 10,000 monthly visitors
- HockeyStack offers a 14-day free trial
- Dreamdata offers a free web analytics tool as an alternative to Google Analytics
Still On The Fence About What B2B Attribution Tool To Go With?
And there you have it. A breakdown of Dreamdata and HockeyStack, and the reasons why one could be a better fit for you over the other. Still On The Fence About What B2B Attribution Tool To Go With? Here are a few reasons why you might want to consider Factors as well:
- Rapid, no-code integrations across ad platforms, CRM, MAP, and more
- Granular, end-to-end analytics, attribution, and journeys across ad campaigns, website content, offline events, organic content, and more
- Fully customizable events, properties, dimensions, and dashboard
- Dedicated customer success management
- Funnels, path analysis and website tracking
And…
- Website visitor identification
- AI-fueled conversion insights
- Real-time Slack alerts
- Cost-effective analytics pricing plans starting at $399/month
Dreamdata vs. HockeyStack – both are powerful B2B marketing attribution platforms, but they cater to different needs:
- Dreamdata is known for its advanced multi-touch attribution and deep third-party integrations, making it ideal for larger teams navigating long, complex sales cycles. However, it comes with a steeper learning curve, longer setup time, and limited dashboard customization.
- HockeyStack, on the other hand, is built for speed and flexibility. It offers quick implementation, highly customizable dashboards, funnel visualization, and even cookieless tracking, making it perfect for agile marketing teams needing fast, actionable insights.
Pricing Snapshot:
- Dreamdata: Starts at $999/month.
- HockeyStack: Offers a free tier, with paid plans starting at $99/month.
Enter Factors.ai – a game-changing platform that merges the best of both worlds. It combines multi-touch attribution, account intelligence, and workflow automation into a seamless experience. With Factors.ai, marketing teams can gain comprehensive insights, streamline operations, and drive revenue-focused decision-making with ease.
.avif)
Leverage Engagement Scoring To Drive B2B Marketing Performance
Traditional metrics like sourcing and influence have limits, leaving a gap in understanding marketing performance. Engagement scoring is a game changer
.avif)
Traditional metrics such as sourcing and influence metrics, while valuable, have their limitations, often leaving a gap in understanding accurate marketing performance.
This is where engagement scoring emerges as a game changer.
Engagement Scoring Unveiled
Engagement scoring is the systematic process of assessing and quantifying customer interactions with your brand. Engagement scoring goes beyond merely counting clicks or page views; it delves deep into the quality, timing, and relevance of these actions. These interactions encompass a broad spectrum, from ad views, web sessions, content downloads, email engagement, social media activity, event attendance, and more.
The Growing Significance of Engagement
The days of bombarding potential customers with generic messaging are long gone. In an era where buyers have a plethora of options and information at their fingertips, understanding their preferences, intent, and fitment is indispensable. Engagement scoring becomes the compass that guides you through this complex landscape.
Filling in the Gaps Left by Sourcing and Influence Metrics
Sourcing metrics primarily focus on quantifying the revenue that marketing has directly sourced. For example, sourcing metrics, such as win rates, deal sizes, and revenue lift, do not tell you anything about the lead's level of interest or intent.
Influence metrics, on the other hand, aim to measure the impact of marketing on the decision-making process of potential clients. Influence metrics, such as social media following and website traffic, can give you some indication of a lead's influence, but they do not tell you how engaged they are with your product or service.
These traditional metrics are often rooted in a binary understanding sourced or not sourced, influenced or not influenced.
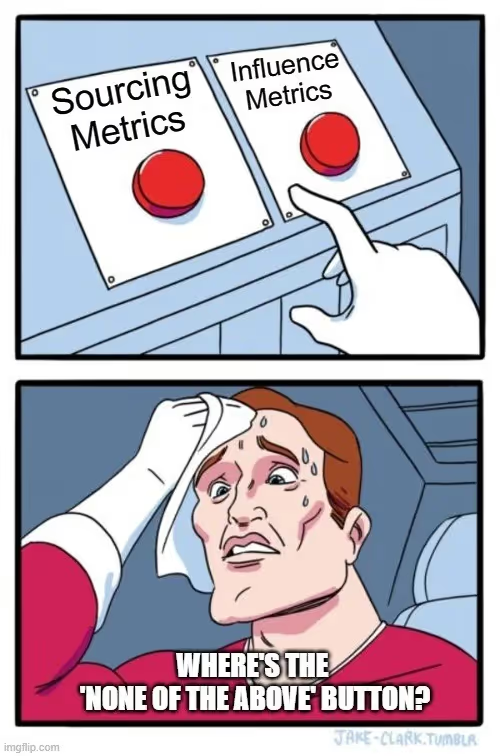
Engagement scoring steps in to offer a more nuanced perspective. It recognizes that the buyer's journey is not linear but a complex web of interactions and engagements. Every click, download, or event attendance provides a piece of the puzzle. Instead of classifying potential clients into rigid categories, engagement scoring paints a dynamic picture that captures their level of interest, the stage in their decision-making process, and their responsiveness to marketing efforts. Moreover, engagement scoring can enhance your ability to focus marketing efforts on prospects who are most likely to convert, ultimately boosting conversion rates and ROI.
The Significance of Engagement in B2B Marketing
Picture the modern-day B2B business as a bustling marketplace. The traditional approach to B2B marketing can be likened to standing in this marketplace, megaphone in hand, and shouting generic messages to anyone who will listen. In the past, such an approach might have yielded some results, but the dynamics of B2B marketing have undergone a profound transformation.
Engagement scoring is the need of the hour, especially because it places buyers at the forefront of the strategy.
The Evolution of Buyer Behavior
Buyer behavior is no longer a linear journey. Gone are the days when prospects would embark on a clear, predictable path from awareness to consideration and finally, decision. Instead, today's B2B buyers navigate a labyrinth of choices, resources, and options. It's akin to a journey through a maze, where every turn presents new choices, challenges, and opportunities.

Buyers in the B2B space research extensively, gathering information from various sources, and often remain anonymous for longer periods. They interact with your brand, your competitors, and a lot of content across different platforms. In this convoluted landscape, their level of engagement with your brand becomes insightful.
The Power of Engagement in Driving Revenue Growth
By now, we understand that engagement isn't just a buzzword; it's an important strategy that determines marketing success. Engaged prospects and customers are those who have shown genuine interest in your offerings, interacted with your content, and actively participated in your marketing initiatives. They are the ones who click through your emails, download your resources, attend your webinars, and seek out your solutions.
But why does this matter?
Engaged prospects are more than just passive observers; they are active participants in their buying journey. They have moved beyond the initial stages of awareness and consideration and are now evaluating their options, inching closer to the decision phase. This readiness to engage signifies their receptiveness to your brand's messaging and an increased likelihood of conversion.
The Basics of Engagement Scoring
Now that we've established the role of engagement in B2B marketing, let’s dive into the mechanics of engagement scoring. This fundamental concept acts as the compass guiding your efforts in nurturing prospects and driving revenue growth.
At its core, engagement scoring is a method of assigning values to various interactions prospects and customers have with your brand. These values reflect the depth and significance of each engagement. By systematically calculating these scores, you gain insight into where a prospect stands in their journey and how to tailor your marketing strategies accordingly.
The Components of Engagement Scoring
- Interaction Tracking
Every action a prospect takes, from opening an email to downloading a resource, attending a webinar, or visiting your website, is considered an interaction. Each interaction carries its weight in the scoring system, with some being more indicative of intent and engagement than others.
- Scoring Rules
Your engagement scoring system is governed by a set of predefined rules. These rules dictate how many points are assigned to each type of interaction. For instance, opening an email might earn a prospect a few points, while attending a live product demonstration could carry a much higher score.
- Engagement Tiers
Engagement scoring often employs a tiered structure. Prospects start in the lower tiers, and as they accumulate more points, they progress upward. Each tier corresponds to a certain level of engagement and readiness to make a purchase.

Types of Engagement Metrics in Scoring
- Explicit Engagement Metrics
These metrics are based on direct actions taken by prospects. Examples include downloading a whitepaper, signing up for a newsletter, or requesting a demo. These actions indicate a clear interest in your offerings and are typically assigned higher scores.
- Implicit Engagement Metrics
These metrics gauge engagement without prospects taking direct actions. Metrics like email open rates, website visits, or social media interactions are implicit signals that suggest prospects are interested in your content and brand.
- Behavior-Based Metrics
Behavior-based metrics are more advanced and analyze the patterns and sequences of interactions. For example, if a prospect follows a specific sequence of webinars and downloads, it can signal a deeper level of engagement and intent.
Setting Up an Effective Engagement Scoring System
To harness the potential of engagement scoring, consider these best practices
1. Alignment with Buyer Journey
Tailor your engagement scoring system to align with your buyer's journey. Assign higher scores to interactions that typically indicate prospects are advancing through the stages of awareness, consideration, and decision-making.
2. Regular Review and Adjustment
Your scoring system isn't set in stone. Regularly review the rules and criteria. As prospect behavior evolves, ensure your scoring system evolves with it.
3. Collaboration Across Teams
Collaboration between your marketing and sales teams is crucial. Your sales team's insights can help fine-tune your scoring system to ensure it accurately reflects the prospects' readiness for a sales conversation.
4. Scoring Automation
Implement automation tools to streamline the scoring process. Many marketing automation platforms offer built-in engagement scoring capabilities that can simplify the task.
5. Progressive Profiling
Use progressive profiling to gather additional information about prospects as they engage more deeply. This enables more accurate scoring and customization of your nurturing strategies.
6. Data Privacy and Compliance
Be mindful of data privacy regulations when collecting and using prospect data for scoring. Ensure compliance with relevant laws and regulations.

Understanding the basics of engagement scoring is the first step in unlocking its potential. In the next part of this series, we'll explore advanced strategies and real-life examples of how engagement scoring can be a game changer in B2B marketing.
Let’s Understand with a Case Study Uni
Uni is a B2B SaaS company that provides a platform for businesses to manage their sales and collections pipeline. They were facing a challenge in identifying and prioritizing high-intent leads. They were using a traditional lead scoring model based on demographic data and website visits, but this was not giving them accurate results.
Uni decided to implement an engagement scoring model. They used a variety of data points to calculate their engagement score, including
- Number of page views
- Time spent on the website
- Number of downloads
- Free trial signups
- Email opens and clicks
- Product usage
Uni then used its engagement score to segment its leads and prioritize its sales efforts. They focused on reaching out to high-engagement leads first, and they offered them personalized outreach based on their interests and stage in the sales funnel.
As a result of implementing engagement scoring, Uni saw a 4X increase in customers and a significant increase in sales efficiency.
The Game-Changing Potential of Engagement Scoring
In the previous sections, we’ve understood the transformative power of engagement scoring in B2B marketing, we've covered the importance of engagement, its significance, and the core components of scoring. Now, let's explore how engagement scoring can truly revolutionize your marketing strategies and elevate your campaigns to new heights.
A Shift from Traditional Metrics
Engagement scoring represents a paradigm shift in the way we measure the effectiveness of marketing efforts. Traditional metrics like click-through rates, open rates, or the number of leads generated provide limited insights into prospect intent and readiness for a sales conversation. Engagement scoring, on the other hand, allows you to delve deeper into each prospect's journey and quantify their level of interest.
Benefits of Lead Prioritization
One of the game-changing aspects of engagement scoring is its ability to prioritize leads effectively. No longer will your sales team waste time chasing cold leads or prospects who are not yet ready to make a purchasing decision. With a well-structured scoring system, your sales team can focus their efforts on prospects who have demonstrated high levels of engagement and are more likely to convert.
Segmentation for Personalization
Effective engagement scoring enables advanced segmentation. By categorizing your prospects based on their scores, you can tailor your content and message to each group. For instance, highly engaged prospects can receive content that delves into the finer details of your offerings, while those in the early stages of engagement might receive introductory material. This level of personalization enhances the overall customer experience and drives better results.
Enhanced Content Targeting
Engagement scoring also amplifies your content-targeting efforts. You can precisely target prospects based on their scores, ensuring that they receive content that resonates with their level of interest and position in the buyer's journey. As prospects move up the engagement tiers, they receive increasingly relevant content, nurturing them towards a buying decision.
Conversion Rate Optimization
Scoring allows for more accurate lead nurturing and follow-up strategies. You can determine the most appropriate moment to transition a prospect from marketing to sales. By doing so, you increase the chances of converting high-scoring leads into paying customers, ultimately optimizing your conversion rates.
Real-Life Benefits of Engagement Scoring
To illustrate the real-life benefits of engagement scoring, consider the example of Company X, a B2B software provider. Company X implemented an engagement scoring system that factored in various interactions, from email opens to webinar attendance and document downloads. By prioritizing highly engaged leads, the sales team saw a significant increase in conversion rates. They were now speaking to prospects who were not only aware of the product but had also shown genuine interest. The result? A boost in revenue and shortened sales cycles.
In this age of data-driven marketing, engagement scoring stands out as a game changer, offering unparalleled insights into prospect behavior and intent. As we continue our exploration of engagement scoring in the next part of this series, we'll delve into advanced strategies for implementation and share more success stories from the B2B marketing landscape. Stay tuned for more insights on how engagement scoring can redefine your marketing efforts.
Implementing Engagement Scoring A Strategic Approach
Now that we've established the potential of engagement scoring to revolutionize your B2B marketing, it's time to roll up our sleeves and discuss how you can successfully implement this game-changing tool. In this section, we'll provide you with actionable strategies, recommendations, and tips for a smooth integration of engagement scoring into your marketing strategy.
1. Define Your Objectives and Goals
The first step in implementing engagement scoring is to clearly define your objectives. What do you aim to achieve with this system? Are you primarily looking to prioritize leads for the sales team, or do you want to improve personalization and content targeting? By setting specific goals, you can tailor your engagement scoring system to meet your unique needs effectively.
2. Choose the Right Engagement Metrics
Selecting the right engagement metrics is a critical step in implementing scoring effectively. While the choice of metrics depends on your specific business and goals, some metrics commonly used in engagement scoring include
- Email Interactions
Metrics as email opens, click-through rates, and response rates provide insights into a prospect's interest and responsiveness to your messages.
- Web Behavior
Monitor website visits, page views, and time spent on your site. Analyze which pages or content attract the most attention.
- Content Engagement
Track the consumption of your content, such as whitepapers, ebooks, and case studies. Determine which assets resonate most with your audience.
- Social Media Engagement
Evaluate interactions on your social media profiles, such as likes, shares, and comments. These actions indicate engagement with your brand.
- Event Participation
Measure engagement with webinars, seminars, and events. Attendance and participation reflect a prospect's willingness to invest time in your offerings.
3. Define Scoring Criteria
Once you've identified your goals and metrics, it's time to create a scoring system. Establish clear criteria for assigning scores to various interactions. Define how points will be awarded for each action and determine the threshold at which a lead is considered highly engaged. This step requires collaboration between your marketing and sales teams to ensure alignment on lead qualification.
4. Leverage Automation Tools
Effective engagement scoring often involves the processing of a large volume of data. To manage this efficiently, leverage marketing automation and customer relationship management (CRM) tools. These technologies can automate the tracking of prospect interactions and calculate scores in real time. Automation tools such as those we have at Factors, also allow for seamless integration with your sales team's workflow.
5. Monitor and Adjust
Engagement scoring is not a one-and-done process. It requires continuous monitoring and adjustment. Regularly review your scoring criteria and metrics to ensure they remain aligned with your goals and reflect the changing behavior of your prospects. The flexibility to make real-time adjustments is one of the advantages of an automated scoring system.
Overcoming Common Challenges
As with any new strategy, engagement scoring may present challenges. Here's how to address some common ones
- Data Accuracy
Ensure data accuracy by regularly cleaning your contact database. Implement data validation tools to minimize errors.
- Scalability
As your marketing efforts grow, you'll need to scale your engagement scoring system. Regularly review and update your scoring model to accommodate new metrics and actions.
- Sales Alignment
Collaboration between marketing and sales is crucial. Hold regular meetings to align strategies and ensure a smooth lead handover process.
- Data Privacy Compliance
Be aware of data privacy regulations like GDPR or CCPA. Ensure that your engagement scoring practices are compliant.
- Scoring Model Complexity
Keep your scoring model simple and easy to understand. Complex models may confuse teams and hinder adoption.
Implementing engagement scoring successfully requires a well-defined strategy, the right metrics, and a commitment to overcoming challenges. By aligning your efforts with your business objectives and prospect behaviors, you can harness the full game-changing potential of engagement scoring in B2B marketing.
Unlocking Business Potential with Engagement Scoring
Prioritization and Personalization
One of the central benefits of engagement scoring is its role in lead prioritization. No longer do you need to guess which leads are most likely to convert; the data guides your decision-making process. This results in more effective lead nurturing and a streamlined handover to the sales team. Additionally, engagement scoring enables the personalization of content and messaging, enhancing the prospect's experience and boosting your chances of success.
Embracing the Change
Now, more than ever, marketing professionals, CMOs, and CXOs need to adapt and innovate. The dynamic B2B marketing landscape demands a shift towards more data-driven, personalized, and effective strategies. Engagement scoring is not just a tool; it's a mindset that can set your marketing efforts apart.
Explore and Implement
All in all, the future of B2B marketing is about understanding your audience on a deeper level, using data to drive strategies, and elevating your marketing game. Engagement scoring is your key to unlocking this potential. By doing so, you'll not only stay ahead of the competition but also lead the way in this ever-evolving marketing landscape. It's time to redefine your marketing playbook and harness the game-changing power of engagement scoring.
Onward to a brighter, more engaging future!
Engagement Scoring: Measuring Interest & Intent
Engagement scoring quantifies customer interactions to assess their interest and intent, going beyond traditional sourcing and influence metrics.
Why Engagement Scoring Matters
- Identifies High-Intent Prospects: Prioritizes leads based on meaningful interactions.
- Enhances Personalization: Tailors marketing strategies to audience behavior.
- Boosts Conversions: Focuses efforts on engaged prospects for better results.
Key Engagement Indicators
- Ad Views & Web Sessions: Tracks initial brand interest.
- Content Downloads: Measures deeper engagement.
- Email Interaction: Assesses communication effectiveness.
- Event Attendance: Signals strong brand interest.
By leveraging engagement scoring, businesses can optimize marketing performance, allocate resources efficiently, and drive higher ROI.
Dummies Guide to Google Ads Management In 2026
Learn Google Ads management with our comprehensive guide for beginners. From setting up campaigns to optimizing ads for maximum ROI, this tutorial simplifies Google Ads for everyone.
Whether you are a seasoned marketer or a small business owner dipping your toes into digital advertising, understanding how to utilize Google Ads Management effectively can transform your marketing efforts and drive substantial growth.
This guide aims to provide a thorough understanding of Google Ads, from the basics to advanced strategies, ensuring you have the knowledge to create, manage, and optimize your campaigns effectively.
Did you know?
In 2020, Alphabet generated almost $183 billion in revenue. Of that, $147 billion — over 80% — came from Google's ads business, according to the company's 2020 annual report.
What are Google Ads?
Google Ads, formerly known as Google AdWords, is Google's online advertising platform that allows businesses to create ads that appear on Google's search engine and other Google properties. It operates on a pay-per-click (PPC) model, meaning you pay each time someone clicks on your ad. This model ensures you only pay for site visits, making it a cost-effective way to drive traffic.

Source: https://en.wikipedia.org/wiki/Google_Ads
Here’s how Google Ads Management works
Google Ads Management works through an auction system where advertisers bid on keywords. These keywords trigger their ads to appear in Google's search results or on Google's network sites. The ads' positions are determined by the bid amount and the ad's quality score based on the ad's relevance, the expected click-through rate (CTR), and the landing page experience. This system ensures that users see relevant ads, and advertisers get a fair chance to reach their audience.
Types of Google Ads
Google Ads Management has several types of ad campaigns, each designed to meet specific marketing goals:
- Search Ads:
Text ads appear on Google's search engine results pages (SERPs) when users search for specific keywords.
- Display Ads:
Visual ads appear on websites within Google's Display Network, which includes millions of websites and apps.
- Video Ads:
Ads that appear on YouTube and across Google's video partner sites.
- Shopping Ads:
Ads that showcase products and appear in Google Shopping and search results.
- App Ads:
Ads promoting app installs and engagement appear across Google Search, Play Store, YouTube, and the Display Network.
Setting Up Your Google Ads Management Account
- Creating a Google Ads ManagementAccount
To get started with Google Ads, you need to create an account. Visit the Google Ads homepage and sign up using your Google account. You will be guided through a step-by-step process to set up your account, including selecting your advertising goals, such as driving website traffic, increasing sales, or generating leads.
- Setting Up Billing Information
After creating your account, you need to set up your billing information. Google Ads offers several payment options, including credit/debit cards, bank transfers, and PayPal. Choose the method that suits your business, and ensure your billing details are accurate to avoid any disruptions in your campaigns.
- Navigating the Google Ads Management Dashboard
The Google Ads Management dashboard is your central hub for managing your campaigns. It can be overwhelming initially, but familiarizing yourself with the key sections will help. The dashboard includes tabs for campaigns, ad groups, ads, keywords, and more. You can customize the dashboard to display the metrics and reports that are most relevant to your goals.
Keyword Research
Keywords are the foundation of any successful Google Ads Management campaign. Conducting thorough keyword research helps you understand what terms your potential customers are searching for and allows you to target those searches with your ads. Effective keyword research ensures that your ads reach the right audience, improving the likelihood of conversions.
Several tools can assist with keyword research:
- Google Keyword Planner: This free tool from Google provides insights into keyword search volume, competition, and potential cost per click.
- SEMrush: A comprehensive SEO tool that offers in-depth keyword analysis, competitor research, and more.
- Ahrefs: Known for its robust backlink analysis, Ahrefs also provides powerful keyword research tools.
When selecting keywords, consider relevance, search volume, and competition. Focus on long-tail keywords, which are more specific and less competitive, making it easier to achieve higher rankings. Additionally, use negative keywords to exclude terms that are irrelevant to your business, ensuring that your ads are shown only to your target audience.
Creating Your First Campaign
Types of Campaigns
The first thing to do is understand the various campaigns that are there. Google Ads Management offers various campaign types to suit different marketing objectives:
- Search Campaigns: Ideal for businesses looking to capture intent-driven traffic from users actively searching for their products or services.
- Display Campaigns: Perfect for building brand awareness by displaying visual ads across Google's vast network.
- Video Campaigns: Effective for engaging users with compelling video content on YouTube and partner sites.
- Shopping Campaigns: Designed for e-commerce businesses to showcase products directly in the search results.
- App Campaigns: Tailored to promote mobile apps across multiple platforms.
Setting Campaign Goals
Before creating your campaign, define clear objectives. Are you aiming to drive website traffic, generate leads, increase sales, or boost brand awareness? Your campaign goals will guide your strategy, budget allocation, and performance metrics.
Budgeting and Bidding Strategies
Determine your budget based on your overall marketing strategy and financial capacity. Google Ads Management allows you to set daily budgets and adjust them as needed. Choose a bidding strategy that aligns with your goals:
- Manual CPC (Cost-Per-Click): You set the maximum amount you will pay per click.
- Automated Bidding: Google adjusts your bids to achieve the best results based on your goals (e.g., maximizing clicks, conversions, or impression share).
Writing Effective Ad Copy
Elements of a Good Ad
A successful ad comprises several key elements:
- Headline: Catchy and relevant, capturing the user's attention.
- Description: Clear and concise, highlighting the benefits and features of your product or service.
- URL: Display a user-friendly URL that indicates where the user will land.
Tips for Writing Compelling Ad Copy
Crafting compelling ad copy requires understanding your audience's needs and pain points. Use action-oriented language, incorporate keywords naturally, and emphasize unique selling propositions (USPs). Ensure your ad copy is aligned with your landing page content to maintain consistency and relevance.
A/B Testing Your Ads
A/B testing involves creating multiple versions of your ads to see which performs better. Test different headlines, descriptions, and calls-to-action (CTAs). Analyze the results and refine your ad copy based on performance metrics to continually optimize your campaigns.
Setting Up Ad Extensions
What Are Ad Extensions?
Ad extensions are additional information that expand your ad, providing more value to users. They can improve your ad's visibility, CTR, and overall performance.
Types of Ad Extensions
Google Ads Management offers various ad extensions, including:
- Sitelink Extensions: Links to specific pages on your website.
- Callout Extensions: Highlight additional features or offers.
- Structured Snippets: Provide specific information about your products or services.
- Call Extensions: Include a phone number for direct contact.
- Location Extensions: Show your business address and link to Google Maps.
How to Implement Ad Extensions in Your Campaigns
To add ad extensions, navigate to the "Ads & extensions" tab in your Google Ads Management dashboard and select "Extensions." Choose the type of extension you want to add and fill in the required details. Ad extensions are a simple way to enhance your ads and provide more information to potential customers.
Targeting Your Audience
Importance of Audience Targeting
Precise audience targeting ensures that your ads reach the right people at the right time, maximizing the effectiveness of your campaigns. It helps you focus your budget on users more likely to convert, improving your return on investment (ROI).
Types of Audience Targeting
Google Ads Management offers several targeting options:
- Demographic Targeting: Target users based on age, gender, parental status, and household income.
- Geographic Targeting: Focus on specific locations, such as countries, cities, or a radius around a particular area.
- Device Targeting: Target users based on their device (desktop, mobile, tablet).
Setting Up Audience Targeting in Google Ads
To set up audience targeting, go to the "Audiences" section on your Google Ads Management Dashboard. Select the campaign you want to edit and choose the relevant targeting options. You can create custom audiences or use Google's predefined audience segments based on interests, behaviors, and past interactions.
Monitoring and Optimizing Your Campaigns
Tracking Performance Metrics
Monitoring your campaign performance is crucial for identifying areas of improvement and ensuring your ads are achieving your goals. Key metrics to track include:
- Click-Through Rate (CTR): The percentage of users who clicked on your ad after seeing it.
- Cost-Per-Click (CPC): The average cost you pay for each click on your ad.
- Conversion Rate: The percentage of users who completed a desired action (e.g., purchase, sign-up) after clicking on your ad.
Using Google Analytics with Google Ads
Integrating Google Analytics with Google Ads Management provides deeper insights into user behavior on your website. Link your Google Ads Management account to Google Analytics to track conversions, analyze user paths, and measure the effectiveness of your campaigns. This integration helps you make data-driven decisions to optimize your ads and improve performance. On average, businesses make $2 in revenue for every $1 they spend on Google Ads, showcasing the platform's effectiveness in generating returns on investment.
Tips for Optimizing Your Campaigns
To maximize your campaign's success, consider the following optimization strategies:
- Regularly Review and Adjust Bids: Monitor your bidding strategies and adjust bids based on performance.
- Refine Keywords and Ad Copy: Continuously update and test your keywords and ad copy to ensure they remain relevant and practical.
- Optimize Landing Pages: Ensure your landing pages are aligned with your ads and provide a seamless user experience.
- Use Negative Keywords: Regularly update your negative keyword list to filter out irrelevant traffic.
- Test Different Ad Formats: Experiment with various ad formats and extensions to see which performs best.
- Leverage Ad Scheduling: Schedule your ads to show during peak times when your target audience is most active.
- Focus on Quality Score: Improve your ad relevance, CTR, and landing page experience to boost your quality score and lower your CPC.
Advanced Google Ads Management Strategies
Remarketing Campaigns
Remarketing involves targeting users who have previously interacted with your website or app. By showing tailored ads to these users, you can increase the chances of conversion as they are already familiar with your brand.
- Setting Up Remarketing: Create remarketing lists in Google Ads Management or Google Analytics, segmenting users based on their behavior (e.g., visited a product page, abandoned cart).
- Creating Remarketing Ads: Design personalized ads that address your remarketing lists' specific interests and behaviors.
- Monitoring and Optimizing: Track the performance of your remarketing campaigns and adjust your strategies based on the results.
Using Google Ads Management Scripts for Automation
Google Ads Management scripts allow you to automate various tasks, saving time and improving efficiency. Scripts can help with bid adjustments, reporting, and making changes across multiple accounts.
- Getting Started with Scripts: Access your Google Ads Management account's "Bulk Actions" section and choose "Scripts." You can use pre-built scripts or create custom ones based on your needs.
- Common Scripts: Utilize scripts for tasks such as pausing low-performing ads, adjusting bids based on performance, and generating custom reports.
- Testing and Implementing: Test your scripts in a sandbox environment before implementing them in your live campaigns to ensure they work correctly.
Leveraging Google Ads’ AI and Machine Learning Features
Google Ads Management offers several AI and machine learning features designed to enhance campaign performance:
- Smart Bidding: Automated bidding strategies that use machine learning to optimize for conversions or conversion value in every auction.
- Responsive Search Ads: Ads that dynamically adjust their headlines and descriptions based on user queries and performance data.
- Dynamic Search Ads: Ads that automatically generate ad headlines and landing pages based on the content of your website.
Common Mistakes to Avoid
Overlooking Negative Keywords
Negative keywords prevent your ads from showing for irrelevant searches, saving your budget for more valuable clicks. Regularly review and update your negative keyword list to exclude terms unrelated to your business.
Ignoring Mobile Optimization
With an increasing number of users accessing the internet via mobile devices, it's crucial to ensure your ads and landing pages are mobile-friendly. Optimize your ad formats, bidding strategies, and website design to provide a seamless mobile experience.
Poor Ad Copy and Landing Page Mismatch
Consistency between your ad copy and landing page content is essential for user satisfaction and high conversion rates. Ensure your ads deliver on their promises by directing users to relevant, high-quality landing pages.
Google Ads is a powerful platform for businesses to reach potential customers through targeted advertising.
1. Understanding Google Ads: Operates on a pay-per-click (PPC) model with ad placement based on bid amount and ad quality score.
2. Types of Ads: Includes Search Ads, Display Ads, Video Ads, Shopping Ads, and App Ads for varied campaign objectives.
3. Setting Up an Account: Create an account, set up billing, and navigate the dashboard to manage campaigns.
4. Campaign Creation: Define goals, select keywords, craft ad copy, and set budgets to launch campaigns.
5. Optimization: Monitor performance, adjust bids, refine keywords, and improve ad quality for better ROI.
Tools like Factors.ai can optimize efforts by providing insights into campaign performance and audience engagement.
In a nutshell
Google Ads Management is a versatile and powerful tool for businesses looking to enhance their online presence and drive targeted traffic. By understanding the platform's intricacies, from setting up your account to creating and optimizing campaigns, you can maximize your advertising efforts and achieve your marketing goals.
Continually experiment with different strategies, test new features, and refine your approach based on data and performance insights. Staying adaptable and innovative will help you stay ahead of the competition and achieve sustained success with Google Ads.

Factors.ai X Snitcher Partnership
Discover how the Snitcher and Factors.ai integration helps B2B teams identify up to 65% of anonymous website visitors, enrich firmographic data, and drive smarter sales and marketing decisions.
B2B teams invest heavily in driving website traffic, yet a large portion of that traffic remains anonymous, making it difficult to convert interest into pipeline. To help solve this, Factors.ai has partnered with Snitcher, a leading website visitor identification platform.
The result? A seamless, privacy-first integration that uncovers up to 65% of previously anonymous visitors, enabling more targeted outreach, sharper ABM, and measurable revenue impact.
By combining Snitcher’s real-time IP-based identification with Factors.ai’s advanced analytics and GTM activation capabilities, users can now go beyond just tracking traffic, they can understand and act on it.
Why Snitcher?
Snitcher stands out among website visitor identification solutions for several reasons:
- Higher match rates: Snitcher provides superior IP-to-company mapping accuracy with rich firmographic data.
- Minimal setup: No complicated implementation. Everything works out of the box within Factors.ai.
- Proven performance: One of the top-rated tools in its category on G2.
Factors integrates with Snitcher in two ways. First, through a built-in connection that lets you access Snitcher data directly within Factors, no separate Snitcher subscription needed. Second, if you already have a Snitcher account, you can connect it via API to bring your data into Factors seamlessly.
How It Works
Snitcher identifies companies visiting your website using IP intelligence, and Factors.ai enriches that data with behavioral analytics, attribution insights, and automation features. Together, they unlock several key capabilities:
1. Identify High-Intent Accounts
With Snitcher integrated, Factors.ai can now identify up to 65% of anonymous website traffic, far more than what traditional lead forms capture. This allows sales and marketing teams to understand which companies are showing interest, what pages they’re engaging with, and where they are in the buyer journey.
2. Access Rich Firmographic Data
Each identified account comes with detailed company-level attributes such as industry, employee count, and geography. Factors.ai overlays this with behavioral data, like time spent on pricing pages, engagement with content, or navigation patterns, making it easier to prioritize outreach and tailor messaging. You can also set up Slack or email alerts to notify your team when high-value accounts visit key sections of your site.
3. Track Complete Customer Journeys
Once a visitor is identified, Factors.ai generates a timeline of their journey, connecting web activity, campaign touchpoints, and CRM interactions. This provides a clear view of how accounts progress through the funnel, informing both marketing strategy and sales conversations.
Privacy-First by Design
It’s important to note: Factors.ai does not identify individual users, emails, or phone numbers. The integration is fully GDPR-compliant and only provides company-level data unless a visitor explicitly submits personal information through a form.
Use Cases Across Teams
Demand Generation
Demand gen teams often struggle to identify warm accounts without relying on gated content. With Snitcher’s identification layered into Factors.ai’s analytics, you can finally see which companies are engaging and retarget them effectively. This helps you shift from broad, generic campaigns to focused efforts with higher ROI.
Content Marketing
Understanding who consumes your content is critical to improving it. This integration reveals which accounts are reading your blogs, watching videos, or exploring case studies, enabling you to map content engagement to funnel progression and tie content performance to pipeline impact.
Product Marketing
Product marketers can see how different accounts interact with key pages like pricing, features, and integrations. By segmenting engagement by company size or industry, you can fine-tune messaging, improve positioning, and build use-case-driven narratives that resonate with target segments.
Sales Enablement
Sales teams benefit from real-time visibility into which companies are visiting demo or case study pages. This allows them to focus outreach on already-interested prospects with contextual firmographic and behavioral insights that make conversations timely and relevant.
Unlocking a New Layer of Account Intelligence
The Snitcher x Factors.ai integration offers a powerful way for B2B companies to turn anonymous visits into revenue-generating insights. Whether you’re optimizing marketing campaigns, sharpening sales outreach, or aligning your GTM motion, this partnership enables smarter decisions at every step of the funnel.
To see how this integration can enhance your ABM strategy, get in touch with our team today.
Frequently Asked Questions (FAQs)
Do I need a separate Snitcher account?
No. All capabilities are embedded directly within Factors.ai. Existing Snitcher users can integrate their account via API.
Can I use this with any Factors.ai plan?
Yes. The integration is available with Basic, Growth, and Enterprise plans.
Where can I get help enabling this integration?
Reach out to our team and we’ll walk you through the setup, no need for an additional Snitcher license.
%2520(2).avif)
Top 5 Demandbase Alternatives and Competitors to Boost ABM in 2026
Discover the best Demandbase alternatives to supercharge your marketing efforts in 2026

When you think of an ABM platform, Demandbase naturally comes to mind. Demandbase (also known as Demandbase One) has been around since 2007 and has served 10,000+ customers after its launch.
But is it the right fit for your business? Get your answer as you scroll through our article and learn about the 5 Demandbase alternatives currently in the market ⬇️
Why look for a Demandbase alternative?
Demandbase offers a range of features such as:
- Account Identification: Identify high-potential accounts visiting your website or showing buying intent signals online.
- Account Targeting: Tailor marketing campaigns to specific accounts based on firmographics, technographics, and buying behaviors. (e.g., industry, technology used, website activity)
- Multiple Journeys: Create and manage personalized marketing journeys for different account segments based on product lines, business units, or other factors.
- Campaign Influence Metrics: Track and measure the impact of marketing campaigns on account progression within the sales funnel.
However, according to reviews across sites like G2, Capterra, and TrustRadius, users have stated that the setup process is tricky and the UI is outdated:


If you’re an SMB looking for an ABM platform, let’s examine what you must consider when making the purchase.
{{INLINE_CTA_A}}
4 Factors to consider when looking for a Demandbase alternative
Cost-effective: Users have found that Demandbase's pricing is steep compared to other products that offer similar features. Find a tool that provides the best bang for your buck.
Easy to use: Choose a tool with an intuitive user interface that doesn’t have a deep learning curve. This will save you time and help you make the most of the tool.
Intent signals from relevant sources: Remember, there is such a thing as “too many signals.” make sure you have the right data from channels that most contribute to revenue impact.
LinkedIn ads ROI: If you’re running LinkedIn ads, you must ensure you’re making the most of your ad budget.
Top 5 Demandbase alternatives
Want to find the right tool and boost your marketing ROI? We’ve done the heavy lifting and compiled a list of the six best Demandbase alternatives you can consider:
- Factors.ai

Factors.ai is an ABM and marketing attribution platform that helps marketers streamline their GTM efforts and optimize their marketing spend. We offer multiple features like:
- Factors can pull intent signals from LinkedIn and G2, which gives greater visibility into high-intent accounts considering your solution. Plus, you can unify all your account-level data from multiple sources.
- Our account and engagement scoring features allow you to assign a value to every interaction an ICP account has with your website. You can now prioritize accounts with high scores to close deals faster.
- Our segment insights feature lets you understand how different user segments resonate with your product.
- Factors can also help you personalize your cold outreach based on intent data, thereby taking your sales strategy to the next level.
- Use Factors to create custom workflow automations to simplify your business processes across multiple CRMs
- Our new AdPilot feature can improve the way you run LinkedIn ads and help you get 2x ROI from your ad campaigns
Why Factors is a good alternative to Demandbase
- Demandbase doesn’t have many features that showcase the impact of paid marketing compared to Factors.
- Our IP database includes 4.6 billion companies, whereas Demandbase has 3.6 billion.
- You cannot conduct segment-wise analysis on Demandbase
- LinkedIn AdPilot gives a complete overview of how LinkedIn plays a role in generating revenue, a feature currently missing in Demandbase
Limitations
- Factors doesn’t offer deanonymization at a contact level
Pricing

💡Learn more about our pricing here
{{INLINE_CTA_A}}
- Albacross

Albacross is a well-established B2B marketing data platform that leverages advanced intent data to identify and capitalize on hidden opportunities from website traffic.
- Website Visitors: Turn website traffic into companies and capture accounts in the buying window
- IP Enrich API: Apply real-time buyer intelligence across your technology stack
- Account-Based Marketing: Target key accounts with customized ads on 90% of ad space globally
- Buying Signals: You can combine Bombora’s powerful intent signals with Albacross to uncover the buyer journey
Why Albacross is a good alternative to Demandbase
Albacross has contact enrichment within the same platform, so there would be no requirement to integrate with multiple enrichment tools
💡Also read: Top 10 Albacross Alternatives
Limitations
- Albacross doesn't allow custom engagement scoring
- The platform doesn’t include LinkedIn view-through attribution
Pricing

- Rollworks

RollWorks is an Account-Based Platform with ABM and advertising solutions that allow marketers to deeply understand their buyers and attribute revenue to marketing initiatives such as display ads, social ads, and triggered emails.
Why Rollworks is a good alternative to Demandbase
Users have reported that it is a far more feasible solution than Demandbase, with a cost of $975 per month.
Limitations
Customers have mentioned that running LinkedIn ad campaigns with Rollworks can get tedious, and they face issues when showing ads to the right accounts

Pricing
Rollworks doesn’t mention its pricing on its website. They have separate plans for Account-based marketing and Account-based advertising.
{{INLINE_CTA_A}}
- Recotap
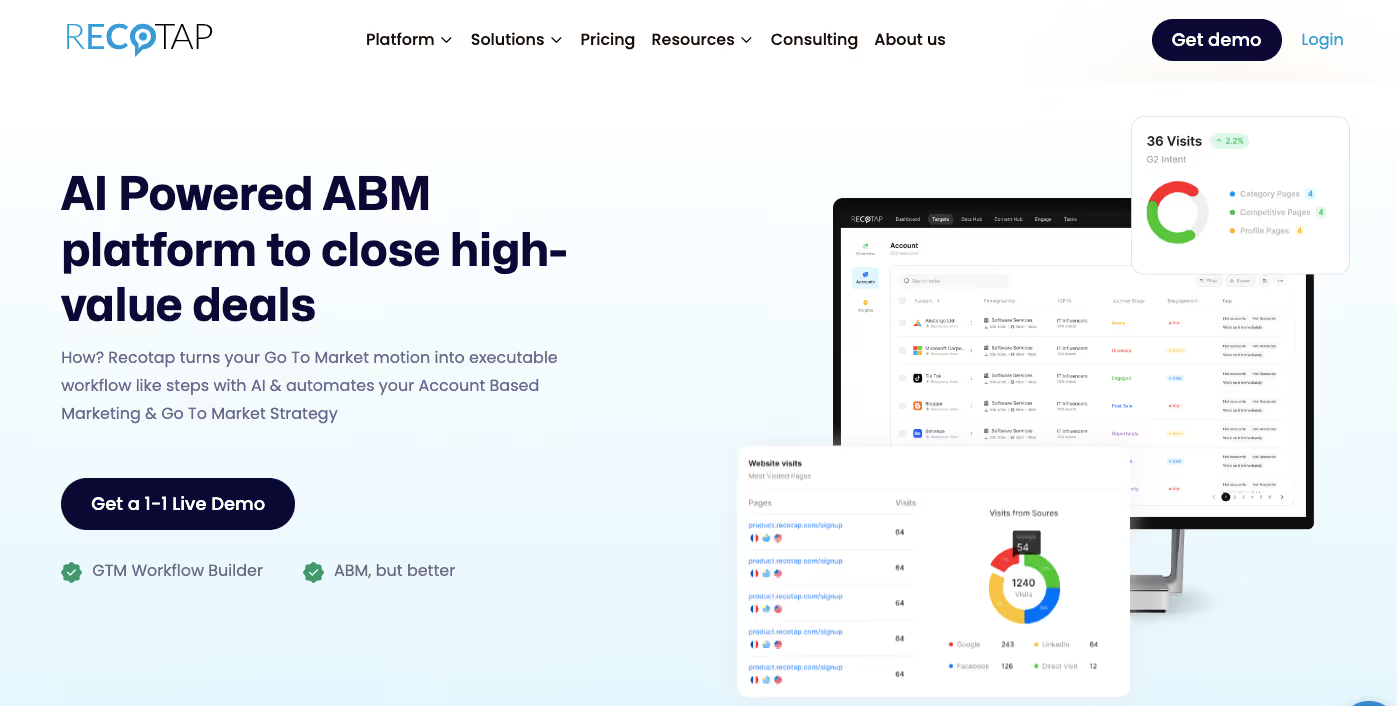
Recotap is an AI-driven Account-Based Marketing (ABM) platform that helps B2B Marketers run targeted ABM campaigns at scale. They break their offering into 3 categories:
- Data Hub: Account level, Contact level, Technographics, or Intent data. You'll find it all here
- Engagement Hub: Engage your accounts across multiple channels with personalized content
- Insights Hub: Let our AI crunch data from ads, emails, CRM, website visits & more to provide the right insights
Why Recotap is a good alternative to Demandbase
- Recotap is a better platform for brands aiming to leverage LinkedIn for ABM
- It is a cost-effective solution
Limitations
- Limited reporting options
- It doesn’t integrate with G2

Pricing
Recotap doesn’t have its pricing on its website, but they offer 3 pricing tiers (Starter, Growth, Enterprise)
- Common Room

Why Common Room is a good alternative to Demandbase
- Common Room focuses heavily on community management and engagement, a feature currently unavailable in Demandbase
- If you prioritize a seamless and intuitive user experience, Common Room might offer a more straightforward approach compared to Demandbase
- Common Room offers flexible pricing plans that might be more suitable for smaller businesses or startups compared to Demandbase
Limitations
- Common Room cannot derive intent signals from G2
- It’s a relatively newer product, so many features are still under development
- Engagement scoring feature isn’t as advanced as other tools on this list
Pricing

Choose the best Demandbase alternative
Streamlining sales and marketing alignment is a cakewalk when you have the right ABM platform. You must invest in a solution that helps you make the most of your marketing effort without burning a hole in your pockets.Sign up for a free trial today to understand how Factors allows you to leverage intent signals and accurately measure the impact of your marketing campaigns.
{{INLINE_CTA_A}}
Top 5 ABM Alternatives
Account-Based Marketing (ABM) platforms help businesses target high-value accounts with precision and personalized strategies, enhancing efficiency and ROI.
1. Top Platforms: Factors.ai, 6sense, Terminus, RollWorks, and Albacross.
2. Key Features:
- Factors.ai: Intent signal capture from platforms like LinkedIn and G2, multi-platform account-level data integration.
- 6sense: AI-driven predictive analytics, buyer intent insights, personalized marketing campaigns.
- Terminus: Multi-channel engagement (digital ads, email, web personalization), robust analytics.
- RollWorks: Salesforce integration, data synchronization, key account identification.
- Albacross: Website visitor insights, tailored marketing efforts, lead generation.
3. Strategic Benefits:
- Identify high-intent accounts and prioritize them for outreach.
- Enhance marketing efforts through personalized, data-driven strategies.
- Leverage integrated platforms for seamless campaign execution and performance optimization.
Implementing these ABM tools helps streamline targeting, optimize marketing spend, and drive conversions effectively for long-term business

Demoboost + Factors.ai: Capturing Intent From Product Demos
Who’s visiting your ungated interactive product demos? What’re they engaging with most? Learn to leverage Demoboost & Factors.ai to capture intent signals from your demos.
B2B SaaS buying journeys are complex. Between independent research, ad campaigns, web sessions, events, sales outreach, social media, customer reviews, product demos, and more — buying journeys involve countless non-linear touchpoints across multiple channels and stakeholders.

While this may seem daunting at first, each of these touchpoints reflect unique buying intentions that may be leveraged to improve the customer experience and drive bottom of the funnel conversions. In some cases, the buying intent is obvious: if a customer submits their email ID to download an eBook, we know who they are and what they’re looking for. This challenge is further exacerbated by the fact that buyers are increasingly cautious about submitting their true email addresses. Professionals are educated to keep data safe and share contact details only if they’re absolutely sure of the need. Buying intent is generally the sum of incremental steps taken along the buying journey before reaching this inflection point. Recognizing these hidden intent signals — and the buyers behind those signals — is easier said than done…well, until now.
This article explores interactive product demos as a high-intent touchpoint in B2B SaaS buying journeys. Specifically, we highlight how tools such as Factors.ai may be used in tandem with Demoboost to identify otherwise hidden intent from a ubiquitous element in SaaS today: the product demo.
Interactive Product Demos: Scale, Distribute & Analyze
Product demos have been at the cornerstone of SaaS buying journeys forever. They’re an effective way to showcase your software’s features, functionalities, and benefits all while addressing key use-cases and pain-points. Although live product demos continue to take place over real conversations with sales reps, businesses are increasingly adopting product demo softwares to support pre-sales efforts. This may be a result of B2C buying behaviors bleeding into B2B deals: Rather than submitting a demo form, finding a convenient time, and then speaking with sales reps, buyers today expect instant access to the info they need. Only after they educate themselves do they engage directly with sales reps. Businesses have adapted accordingly.
Product demo softwares help businesses build automated interactive product demos that are available to prospects on-demand. Interactive product demos are async product walkthroughs that users can access and navigate themselves without the involvement of sales reps or support personnel. Automated product demos are typically designed to be user-friendly, allowing potential customers to explore the product at their own pace. Among several other benefits, automated demos are scalable, easy to distribute, and provide helpful usage analytics. They may be embedded on websites, outbound emails, brand awareness campaigns, and more, so interested buyers have on-demand access.

So far so good…but you may be asking yourself: “but wait, who’s actually engaging with these demos?”
This would be a valid question. In the case of live demos, we know exactly who we’re showcasing our product to — they’re right there in front of us! But unless we gate an automated product demo (more on this later), how can we identify and analyze companies engaging with this touchpoint? In other words, what’s the full extent of intent signals from interactive product demos and how can we capture them?
Intent signals from product demos include information about who is engaging with the demos and what they're interested in. This helps marketers and salespeople know which companies are interested in their products and what parts of the demo they find most engaging.
Until recently, capturing this intent was a challenge. Intelligence and analytics tools could do their job on most web pages, but their functionality was limited within interactive product demos.
Demoboost solves for this by uniquely supporting third-party tags (SDKs) inside its interactive demos. The following sections highlights how this ability may be leveraged by tools such as Factors.ai to:
- Identify and enrich anonymous companies engaging with interactive product demos
- Capture valuable intent signals beyond page views and clicks from demo engagement
- Qualify, score, segment, and activate accounts based on demo engagement
But first, let’s establish why capturing intent signals from interactive product demos is so important.
The Importance Of Intent Signals From Product Demo
There’s no doubt that the interactive product demo is a crucial touchpoint along the buying journey. Gartner’s analysis of buyer interactions finds that a supplier’s interactive tool (35%) is only behind the website (37%) and social media (36%) in terms of buyer engagement. Given that interactive product demos typically sit within the website, we can confidently claim its significance in the purchase process.

But even beyond the data, B2B marketers and sales folk would certainly be interested to capture intent signals from companies engaging with high-intent touch points such as pricing pages, paid landing pages, and in this case, interactive product demos. These intent signals help identify sales-ready accounts, determine winning touchpoints, and prove go-to-market’s wider influence and ROI.
In a way, intent from product demos acts as a wonderful replacement for lead gen forms. Of course, marketing teams would love to place a lead gen form within the product demo as the resulting sign-ups wouldn’t need external intent data — we'd already know a lot about them via the form! However, given that buyers are increasingly growing to appreciate friction-free buying flows, capturing intent from ungated assets such as interactive product demos ensures the best of both worlds. This is where the Demoboost x Factors.ai integration comes in.
Demoboost + Factors.ai: Intent Signals From Product Demos
How it works
Factors.ai is an account intelligence and analytics software that uses industry-leading IP-lookup technology to identify, qualify, and activate anonymous companies engaging with websites and more. Tools like Factors work by placing a small piece of code (Javascript SDK) on the header of a website to de-anonymize website traffic, track account activity, and tie the dots between channels, website & CRM. Demoboost is a product demo software that offers all-in-one demo automation and demo-building functionality to reduce CAC, shorten sales cycles and increase win rates. Factors.ai now integrated with Demoboost to deliver the following use-cases:
As previously mentioned, such analytics tools have had the ability to track who clicked or landed on a product demo page. From there, however, users wouldn’t have visibility into what visitors are exactly engaging with inside the product demo. To solve for this, Demoboost’s open platform allows users to embed third-party javascripts within the product tour to capture account-level intent & engagement. This means that users can identify companies engaging with their demos as well as capture the extent of engagement — especially upon integrating Microsoft Clarity or Hotjar as well — at an account level.
Demand capture to demand generation: The implications of this are significant. Typically, interactive demos have served the functions of evaluating product pre-sign ups and improving lead quality. Now, in addition to this, interactive demos may also be used to identify and retarget high-intent accounts based on demo engagement.
Use-cases
Integrating Factors.ai and Demoboost results in a wide range of use-cases. Here are a few of them:
1. Identify & enrich engaged accounts
A fundamental use-case of integrating Demoboost with Factors is the ability to identify and enrich otherwise anonymous companies engaging with your interactive product demos. Along with analyzing demo engagement with Demoboost, you’ll also know the accounts behind the engagement via Factors.

2. Score & prioritize accounts
Given that several companies are likely engaging with your product demos, you may use demo usage insights from Demoboost in tandem with cross-channel engagement scoring across LinkedIn, G2, web sessions, and sales touchpoints to holistically score, qualify and prioritize high-intent accounts.

3. Relevant ABM campaigns
Once you identify and qualify high-intent accounts engaging with your product demos, you may then leverage this list of accounts for relevant account-based marketing. Rather than casting a wide net, you may initiate personalized ABM campaigns based on companies interacting with your product demos, website, LinkedIn ads, G2 review, sales touchpoints, etc to drive more conversions from existing efforts.

4. Personalized email & LinkedIn campaigns
Outreach and targeting is the next logical step after building your target accounts list. But rather than targeting every account with the same messaging — or tediously, manually orchestrating personalized campaigns, you may instead automate tailor-made campaigns based on engagement captured from Demoboost and other touchpoints. Configure your automation rules within Factors and every time an ICP company, say, completes more than half the interactive product demo, they’ll be pushed into a bottom of the funnel LinkedIn retargeting campaign or mail sequence to seal the deal.
B2B buyer journeys involve a wide range of fragmented touchpoints across several channels. Factors.ai’s Demoboost integration empowers GTM teams to capture another source of intent data from interactive product demos to complement Factors.ai’s larger range of first-party intent signals across website, LinkedIn, G2 and more. As it stands, interactive demos are a mainstay amongst SaaS websites — and with this integration, marketers & sales folks have an opportunity to make the most of the data generated via these valuable touchpoints.
.avif)
12 Demand Generation Metrics for Sales Funnel & Aligning for business
Want to measure your demand generation campaigns? These demand-generation metrics and KPIs will help you maximize the business impact with minimal effort.

Need help seeing results from your marketing campaigns? You need to begin tracking the right demand generation metrics. They help you know what's working at each marketing stage—from initial brand awareness to customer retention.
While there are numerous metrics that you can track, let's explore the 12 most important demand generation metrics you must consider tracking. From website traffic to content engagement and beyond—we'll cover the key performance indicators (KPIs) that allow you to:
- Identify bottlenecks in your marketing processes
- Prioritize high-impact campaign strategies
- Continuously optimize based on actionable data
- Prove and improve marketing's impact on revenue
Let's get started.
Top 12 Demand Generation Metrics
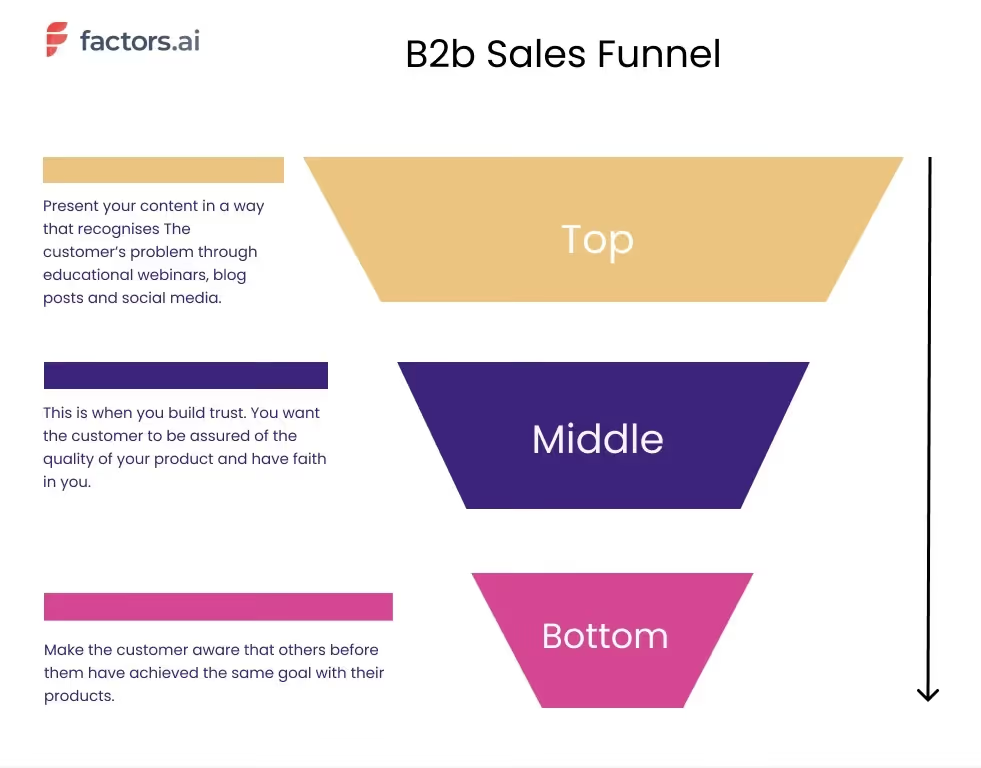
Rather than tracking every metric under the sun, it pays to focus on a targeted set that will give you true insight into your marketing efforts. We'll split them into sections of the B2B sales funnel—top of the funnel, middle of the funnel, bottom of the funnel, and post-conversion metrics for simplicity.
Here are the top 12 metrics you must track for better demand-gen marketing.
Top-of-the-funnel metrics
The top of the funnel is all about driving awareness and interest in your brand. To measure effectiveness at this stage, focus on these key metrics:
Website Traffic and Unique Visitors
Your website traffic shows the total number of sessions or pageviews on your site over time. The unique visitors metric represents the number of new people who have come to your website within a designated time frame.
When both metrics are tracked together, it gives insight into how well your campaigns expose your brand to fresh audiences and drive engagement.

For example, if you drive 5,000 visits and 4,000 unique visitors in a month, it tells you your traffic sources are introducing 1,000 repeat visitors along with 4,000 new people to your site.
This analysis helps you identify which channels excel at attracting relevant new visitors vs. repeat traffic. You can then focus efforts on high-performing channels for new visitor growth while phasing out ones only to drive repeat traffic.
Landing Page Conversion Rate
Your landing page conversion rate is the percentage of visitors completing your desired goal action on your landing page, like downloading content or signing up for a demo. For instance, if you get 300 downloads from 1,000 visitors, your conversion rate is 30%.

Landing Page Conversion Rate: (Total conversions / Total visitors to the landing page) x 100
You can test different elements on your landing pages, like copy, visuals, and calls to action, to refine them for higher conversion rates over time. With an analytics tool like Factors, you get the insights necessary for optimizing your funnel for better conversions.
Click-Through Rate (CTR)
Click-through rate is the ratio of users who click on your ad or content compared to the number who saw it. For example, if your ad gets 300 clicks after being seen 1,000 times, your CTR is 30%.
.avif)
CTR: (Total clicks / Total impressions) x 100
CTR indicates how well your ads perform. If more people click on your ad, it reaches the right people and resonates with them. So, it makes sense to monitor CTR by campaign, ad group, and keyword to identify high-performing content.
Middle-of-Funnel Metrics
Once you've attracted visitors and converted them into leads, it's time to begin nurturing and qualifying them and determining their sales-readiness—that's the middle of the funnel. These key metrics help you assess pipeline health at this stage.
Lead Generation Rate

Your lead generation rate shows how many new leads are produced over a specific period, typically monthly. For example, if your marketing efforts on one channel generate 400 leads over two months, you have a monthly lead gen rate of 200. The higher this number, the better it is—indicating better marketing.
Lead-to-MQL Conversion Rate
Once you have collected the leads, it's time to convert them into MQLs and take them further along the funnel. This metric looks at the percentage of new leads that turn into marketing qualified leads (MQLs)—these are deemed ready for sales follow-up. For instance, if you generate 400 leads monthly and 100 qualify as MQLs, your conversion rate is 25%.
Lead-to-MQL Conversion Rate: (Total MQLs / Total new leads) x 100
This helps you understand how effectively your lead nurturing process moves prospects down the funnel to sales-readiness. A higher conversion rate shows better lead scoring, nurturing, and qualification processes.
Cost Per Lead (CPL)
Your cost per lead represents the average spend required to acquire a new marketing lead. It's calculated by total marketing costs divided by the number of new leads.
For instance, $4,000 in marketing was spent to generate 400 leads. The CPL is $10.
Cost Per Lead: Total marketing costs / Total new leads
We want the cost to be as low as possible to acquire the same number of leads. So, in this case, lower CPL is better for your marketing campaigns. Once you've nurtured your leads, it's time to track and analyze the leads that move to the final stage of purchase—the bottom of the funnel.
Bottom-of-the-Funnel Metrics
As leads move to the final sales stages, these metrics indicate how effectively your processes close and retain business:
Opportunity-to-Win Ratio
This metric evaluates the percentage of sales opportunities that successfully convert to won deals. For example, if your team successfully closes 50 out of 100 closed opportunities, your opportunity-to-win ratio is 50%.
Opportunity-to-Win Ratio: (Total won opportunities / Total closed opportunities) x 100

The higher this percentage, the better your sales team performs. The average sales win rate hovers around 47%. If your sales team can close a higher percentage of leads, it means the sales team better understands your audience's needs. But along with that, it also signifies your lead filtering is done well.
Customer Acquisition Cost (CAC)
Your CAC is the average cost to convert a new customer. It's calculated by dividing total sales and marketing costs by the number of new customers won.
For instance, $40,000 in marketing and sales to gain 100 new customers means a CAC of $400.
.avif)
Compare CAC to factors like customer lifetime value and retention rates to ensure your acquisition costs align with potential revenue and longevity from each customer gained. Use CAC benchmarks by industry to optimize your spend.
Sales Cycle Length
The sales cycle length tracks the average days from initial contact to deal close. In the B2B space, the average sales cycle length can be over two months. However, it's best to aim for a lower average here.
You can try account-based selling—a technique where you look at leads as accounts or companies to target instead of individual users.
This allows you to gain a holistic perspective of the pain points a particular account is trying to solve and target individual accounts with messaging that checks the right boxes.
Determining an individual lead's account can become easier using account intelligence tools like Factors.
Post-Conversion Metrics
Once a customer is acquired, you must also ensure they stay with your company. This involves customer success, customer support, and customer experience throughout their journey. Let's look at some metrics that help you determine the actual value of your products or services.
Customer Lifetime Value (CLTV)
Your customer lifetime value metric represents the average revenue generated from a customer over the entire relationship. It's calculated using average purchase value, frequency, and customer lifespan.
For instance, if a customer pays you $200 a month, and the average relationship is 14 months, your customer lifetime value is $2800.
This metric is valuable for two reasons—one, it tells you the average revenue each customer generates, and two, it tells you how much money you can spend to acquire each customer. Continuing the above example, you're running profitable marketing campaigns if you spend $350 to acquire a new customer.
As you acquire more customers, keep an eye out for this number. Suppose you optimize this through better customer experience, improving features based on feedback, and providing more and more value every month. In that case, you can create a sustainable business in the long term.
Churn Rate
Your churn rate shows the percentage of customers you lose in a given timeframe. For example, if you lose 50 of your 500 customers annually, your churn rate is 10%.
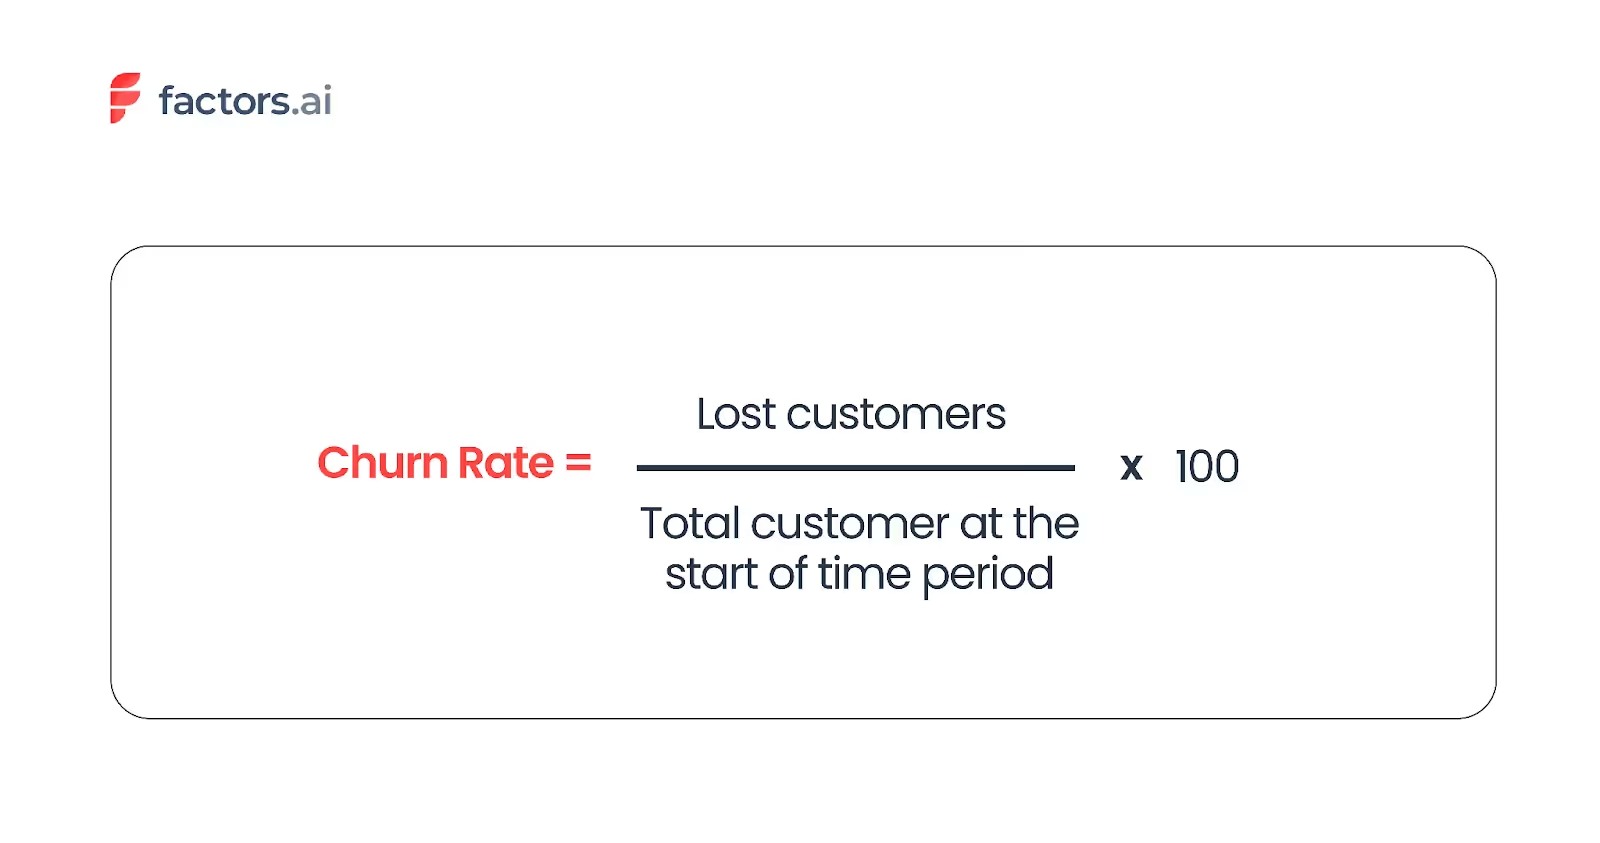
The average annual churn rate in SaaS is 32-50%. This means 50-68% of the users continue using the same product for over a year. While the churn rate cannot be zero, the lower you keep this, the better it is for your business.
Higher churn signals a problem—the product or service isn't delivering enough value to the customers. It also hurts marketing since they now have to work with smaller budgets to acquire more customers while working with the high churn—and it's a vicious cycle you'd best keep at bay.
The best way is to track this metric closely and take action to reduce the churn rate whenever it is going in the wrong direction.
Customer Satisfaction and Net Promoter Score (NPS)
Customer satisfaction metrics like NPS measure customers' happiness and loyalty via direct feedback. NPS asks customers their likelihood to recommend your product or service on a 0-10 scale.
Net Promoter Score: % Promoters (9-10 score) - % Detractors (0-6 score)
This metric relates to the two metrics we discussed above. If your customers are happy, they will stay with the business longer, with less churn.
With technology aiding customer support, begin taking advantage of chatbots trained on your product documentation to answer customer questions instantly—and leave the complex queries for your lean support team.
Aligning the Chosen Metrics for Your Demand Generation Goals
While you can pick a few metrics from the above list and start tracking, you must ensure that the chosen metrics align with your demand generation goals. Let's look at what to consider to do this effectively.
Connect Metrics to Overall Goals
Consider your main company goals, like revenue growth, customer acquisition, or market expansion. Determine which critical metrics at each funnel stage help track progress toward those goals.
For example, track lead volume and velocity through the pipeline and retention rate for a revenue growth goal. To expand market reach, monitor website traffic sources and visitor engagement—this will tell you the story of how far and wide your marketing reaches.
The idea is to have a standardized set of primary metrics you and your marketing team will watch at each stage that map back to high-level goals. With this, you automatically align teams to work towards the same set of targets instead of creating an organizational drift.
Customize Metrics for Your Business
While standard metrics provide a strong starting point, you may want to customize based on your business model, goals, and audience.
Research benchmarks specific to your industry to set targets to gauge performance. Websites like Statista can help you understand the average range for your metrics. For instance, B2B businesses have higher CAC than DTC businesses. And that will help you set expectations when it comes to marketing costs. However, remember that the averages only help you set the goals initially. Once your marketing team has run campaigns over a few months, there will be enough data to create your own goals and metrics that work just right for your business.
Optimize Processes to Move Metrics
We must set metrics and remember them. Monitor how team hand-offs influence your metrics and identify friction points. Based on the data you gather, refine roles and information transitions across sales, marketing, product, and service to align activities that impact your numbers.
For instance, long lead follow-up times could slow velocity and conversion rates. However, refining the process to improve marketing-to-sales hand-offs can be a low-hanging fruit that maximizes lead nurturing effectiveness and increases sales readiness.
Don’t forget to take the time and understand how your teams work collaboratively and identify ways to accelerate progress on the metrics tied to company objectives—calibrate efforts across the funnel for maximum business impact.
Take the Steps To Achieve Your Business Goals with Data-Backed Marketing
Tracking every vanity metric gives us an illusion of understanding marketing performance. But drowning in numbers only muddies the picture. You want the numbers to tell a story about how marketing is progressing toward your business goals.
You want metrics to help you zero in on the KPIs and offer visibility into campaign health and opportunities—enabling strategic decisions to drive growth. And for that, you need to track the most important ones.
This guide will give you a headstart in creating tracking dashboards with the 12 most crucial demand generation metrics. But consider this as the beginning. Start pooling in data from multiple sources and aligning metrics with your business goals to extract the most valuable insights and tell the story right.
Try Factors when you need an analytics tool to help you achieve that quickly.
Factors helps you cut through the noise and clearly understand your marketing performance and revenue opportunities. It also takes advantage of visitor data to identify the business and industry a visitor is associated with—extremely valuable for account-based marketing campaigns.
Stop tracking your campaigns in the dark. The metrics are right here for you to make the most of them. Book a demo with Factors and see how we can make extracting insights easier.
Effective demand generation metrics optimize the B2B sales funnel, ensuring marketing efforts lead to meaningful business outcomes.
1. Website Traffic: Reflects brand awareness efforts by tracking visitor volume.
2. Landing Page Conversion Rate: Measures how well landing pages convert visitors into leads.
3. Lead Volume: Tracks the number of leads generated, assessing marketing reach.
4. Cost Per Lead (CPL): Evaluates the cost-effectiveness of lead generation activities.
5. Sales Cycle Length: Assesses the efficiency of the sales process from lead acquisition to conversion.
6. Win Rate: Measures the percentage of leads that convert into customers.
7. Churn Rate: Tracks customer retention by measuring the rate at which customers leave.
8. Customer Lifetime Value (CLV): Estimates the total revenue a customer will generate during their relationship.
Tools like Factors.ai enhance tracking and analysis, providing insights into segmentation, user journey mapping, and performance measurement to optimize demand generation strategies.
FAQs
How is demand generation measured?
Demand generation is measured through a combination of website traffic, landing page conversion rate, lead volume, cost per lead, sales cycle length, win rate, churn rate, and customer lifetime value. Tracking these KPIs provides visibility into a campaign’s effectiveness at driving new prospects into the funnel and successfully converting them to customers.
What is lead scoring in demand generation?
Lead scoring helps prioritize, which leads to focus on nurturing and advancing down the funnel. It assigns points to leads based on attributes like demographics, behaviors like page views, or interactions like downloading content. The resulting lead score represents a lead's sales readiness. Analyzing metrics by lead score helps focus efforts on higher-scoring segments for better conversion.
How do you measure the ROI of demand generation?
To measure ROI, first calculate campaign costs like advertising spend, human resources, and content creation. Then, quantify revenue driven by new customers acquired through demand gen efforts. Subtract expenses from income to determine net profit, then divide by costs to calculate ROI as a percentage. Tracking attribution helps accurately assign revenue to suitable campaigns and channels.
.avif)
10 Key Customer Engagement Metrics Explained
Dive deep into the essential customer engagement metrics. Learn how to calculate and act on these metrics to drive business growth and brand loyalty.

TL;DR
- Customer engagement metrics reveal how customers interact with your brand and drive loyalty and revenue.
- Key metrics include NPS, CSAT, churn rate, CLTV, session duration, and bounce rate.
- Tracking these data points helps businesses improve customer experiences and reduce churn.
- Unified platforms simplify data analysis and uncover actionable insights for growth.
Customer engagement is crucial for business growth and profitability. Highly engaged customers buy more, promote your brand to others, and stick with you for the long haul.
But how do you know if your customers are engaged?
This is where customer engagement metrics come in. When tracked consistently over time, these metrics reveal objective insights into how customers interact with your brand.
In this article, we'll cover the top 10 customer engagement metrics every business should track in 2023 and beyond. We'll define each metric, explain how to calculate it, and discuss its importance.
Let's dive in!
What is Customer Engagement?
Customer engagement is the process of building a long-term relationship with your customers. It measures how often customers connect with your brand, the different channels they use to connect, and how many of them return to make a purchase.
Simply put, customer engagement refers to how customers think, feel, and act toward your business and brand over time.
It goes far beyond a simple transactional exchange. Rather, engagement measures the depth of a customer's relationship and emotional connection with your brand.
Some examples of highly engaged customers:
- Visit your website frequently and spend time reading content
- Get social with your brand by liking and commenting on posts
- Open and click on emails and marketing campaigns
- Provide feedback and reviews on their experience
- Participate in surveys, contests, or online communities
- Respond to special offers or actively refer friends
- Increase their purchase frequency and order sizes over time
On the flip side, disengaged customers only interact on a superficial level. They don't open your emails, ignore social media, rarely visit your site, and overall have negligible connection to the brand, increasing the risk of customer churn.
These customers are at high risk of churning and switching to a competitor.
For example, an early-stage startup using a SaaS platform may be highly engaged—frequently using product features, staying updated through newsletters, engaging on social media, participating in user research, and even recommending the platform to peers.
An enterprise client may be relatively unengaged—using only basic features, providing limited feedback, and feeling indifferent towards the SaaS provider brand.
When you monitor customer engagement through various metrics, you can identify disengaged accounts proactively so you can reactivate them before it's too late.
What are customer engagement metrics?
Customer engagement metrics are data points that help companies understand how customers interact with their brand and product. Tracking customer engagement metrics serves several important purposes:
- Achieve a better understanding of target audience: For our startup example, metrics may show the product resonates well with early-stage teams looking for agile collaboration tools.
- Pinpoint strengths and weaknesses in sales funnel: Customer engagement metrics may reveal messaging is not working to convert enterprise prospects at the top of the funnel.
- Know what to prioritize & refine the customer journey: Since enterprise clients have larger deal sizes, it may make sense to refine messaging and sales collateral to better appeal to their needs.
- Improve customer experience and retention: Analyzing usage metrics can reveal where customers struggle or lose interest, highlighting areas to improve CX and retention.
Continuing our engaged vs unengaged customers example, for the early-stage startup, vital engagement metrics may validate their current targeting and product-market fit.
For the enterprise prospect, weak metrics signal a need to adjust strategy to better appeal to and support those customers.
Tracking these metrics gives your sales and marketing teams visibility into customer behavior that can then be used to tailor messaging, visuals, and even product features over the long run.
10 Customer Engagement Metrics You Should Track
So, what metrics should you track? Let’s look at the ten key customer engagement metrics that you should consider.
1. Bounce Rate
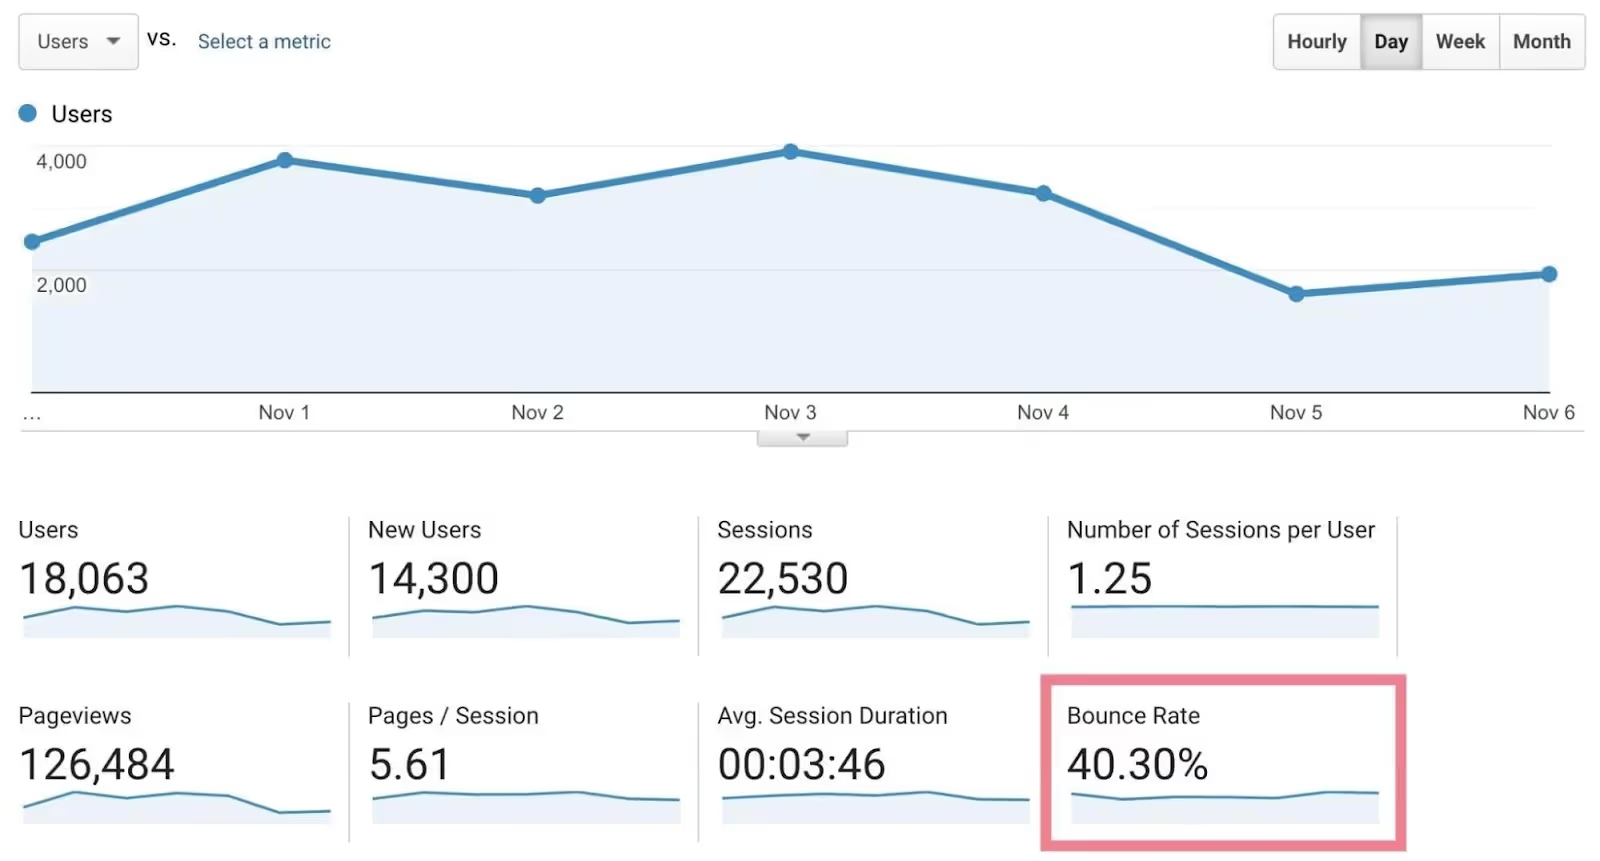
The bounce rate measures the percentage of visitors who enter your site and then leave ("bounce") after viewing only one page.
High bounce rates indicate your content may not be resonating with users or properly targeted.
Bounce Rate = (Bounces / Total Site Visits) x 100
For example, if you had 5,000 bounces out of 25,000 visits, your bounce rate would be:
5,000 / 25,000 x 100 = 20%
Across 150 million page views taken as a survey by Animalz, the median bounce rate for SaaS blogs in 202 was 80.33%.
But the general rule of thumb is—lower is better.
A high bounce rate means visitors aren't finding what they need on your site quickly enough. As a result, engagement is superficial.
For example, an ecommerce site had 25,000 entrances last month and 15,000 bounces. The bounce rate would be (15,000 / 25,000) x 100 = 60%. You could try to get this below the 50-65% ecommerce average benchmark by trying one of the following:
- simplify navigation so the user can find what they came looking for
- improve page load speed
- highlight your phone number prominently on the contact page
- add pricing breakdown
- Add visual elements like images or videos.
This article by SEJournal can be a great starting point to reduce bounce rates and increase the time a user stays on your page—a.k.a. Average session duration.
2. Average Session Duration
Average Session Duration measures how long users are actively engaged on your website during a visit. It's calculated by totaling all session durations across your site and dividing by the number of sessions.
Longer average session durations signal you provide valuable, relevant content that engages visitors. Short durations may indicate the content isn't resonating with users or site navigation needs improvement.
The average session duration across SaaS websites participating in the survey is 77.61 or 1 minute 17 seconds.
Formula:
Total Session Duration / Number of Sessions
For example, an ecommerce site has 5,000 sessions in a month for 15,000 minutes. The average session duration would be 15,000 / 5,000 = 3 minutes.
An analytics tool like Google Analytics or Factors will automatically calculate and display this data on your website tracking screen.
This aligns with general benchmarks. If the duration was lower, the site owner could look to improve content quality or navigation to drive up engagement.
3. Scroll Depth
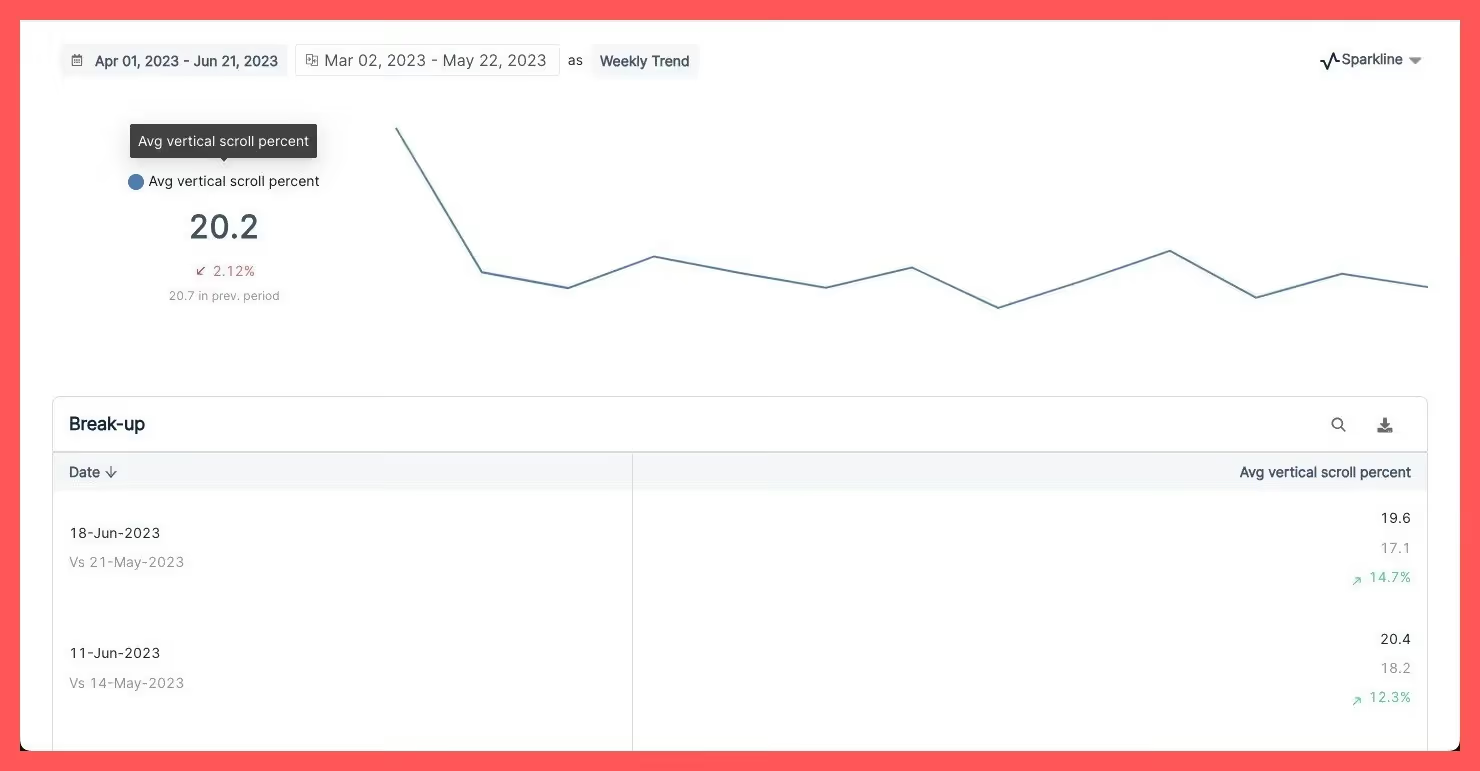
Scroll depth measures how far down a page visitors scroll before leaving. Higher scroll depth indicates engaging content.
Typically, a scroll depth of 50% or more means that your content is resonating with visitors. And anything lower should be a cue that you need to spend time optimizing that piece of content.
For example, your latest blog post sees an average scroll depth of 25%, meaning most visitors bail out after reading just the first 1/4 of the content.
In response, you shorten the intro paragraph, add subheads, break content into shorter paragraphs, and include visuals after every few sentences—these changes drive scroll depth to 65%, helping your users engage further.
4. Social Media Engagement
Social media engagement rate measures the amount of engagement (likes, shares, comments) a post gets compared to reach. Higher rates indicate content resonates.

Powerful analytics tools like Factors can help you bring together data from across different social media platforms into a single place—giving you a single source of truth (SSOT) dashboard.
How to calculate social media engagement:
(Likes + Shares + Comments) / Followers x 100 = Engagement Rate
For example, if you had 30 total likes, shares, and comments over 1,000 Facebook page followers last month, your engagement rate would be:
30 / 1,000 x 100 = 3%
Average engagement rates vary widely by platform. Here are the average social media engagement rates for Technology businesses.
- Instagram: 1.48%
- Facebook: 0.96%
- X (Twitter): 1.26%
- LinkedIn: 1.53%
- TikTok: 1.20%
The key is not to compare your engagement rate to others in your niche. Rather, track it over time to see if your rate increases or decreases month-to-month.
5. Customer Satisfaction (CSAT) Score
The CSAT score measures customer satisfaction with service interactions, often via surveys. Higher CSAT correlates with better engagement and loyalty.
Typical survey questions ask customers to rate their experience on a 1-5 or 1-10 scale, from very unsatisfied to very satisfied. The percentage of positive responses becomes the CSAT score.
The numbers below can range from 0% to 100%. For example, a score of 75% means that 75% of the users who answered the survey are satisfied with the product/service.
According to Fullview, CSAT benchmarks by industry are:
- Software - 78%
- Retail - 80%
- Internet providers - 64%
For example, an ecommerce company surveys customers and finds:
- Fifty customers responded 9 or 10 for "very satisfied."
- Twenty responded 7 or 8 for "satisfied."
- Ten responded six or below for "unsatisfied."
The CSAT score is 50 very satisfied / (50 very + 20 satisfied) = 71%
6. Net Promoter Score
The NPS survey measures customer loyalty and likelihood to recommend on a 0-10 scale. Higher NPS indicates growth potential through referrals.
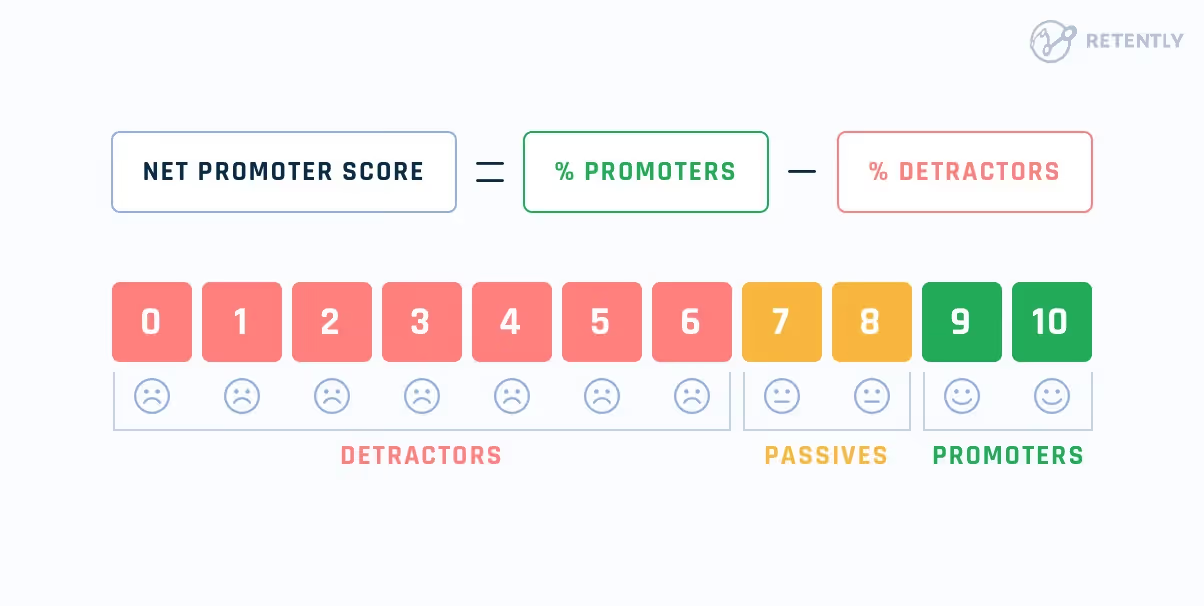
NPS is calculated by finding the percentage of customers who are:
- Promoters (9-10 score): loyal enthusiasts who will promote your brand
- Passives (7-8): satisfied but unenthusiastic
- Detractors (0-6): unhappy customers who can damage your brand image
Subtracting the percentage of Detractors from Promoters yields the NPS.
Retently ran NPS benchmarks for different industries. Here are two industries relevant to us:
- Software - 64+
- Consulting - 67+
For example, a SaaS business surveys customers and finds:
- Promoters: 70%
- Passives: 10%
- Detractors: 20%
Their NPS is 70% - 20% = 50%. This is on the lower end for software businesses, revealing opportunities to improve loyalty and satisfaction.
Track your NPS over time to see if it's improving or declining. If it is declining, try to talk to your detractors and understand if there’s a fixable problem that’s causing customers to rate you lower.
When you find something, start by fixing it and announcing that you’re taking steps in the right direction. This will help your customers know that you aren’t simply collecting surveys but also working on them.
7. Net Dollar Retention (NDR)
The NDR compares recurring revenue from existing customers period-over-period. Rising NDR indicates expanded purchases from engaged customers.
Formula:
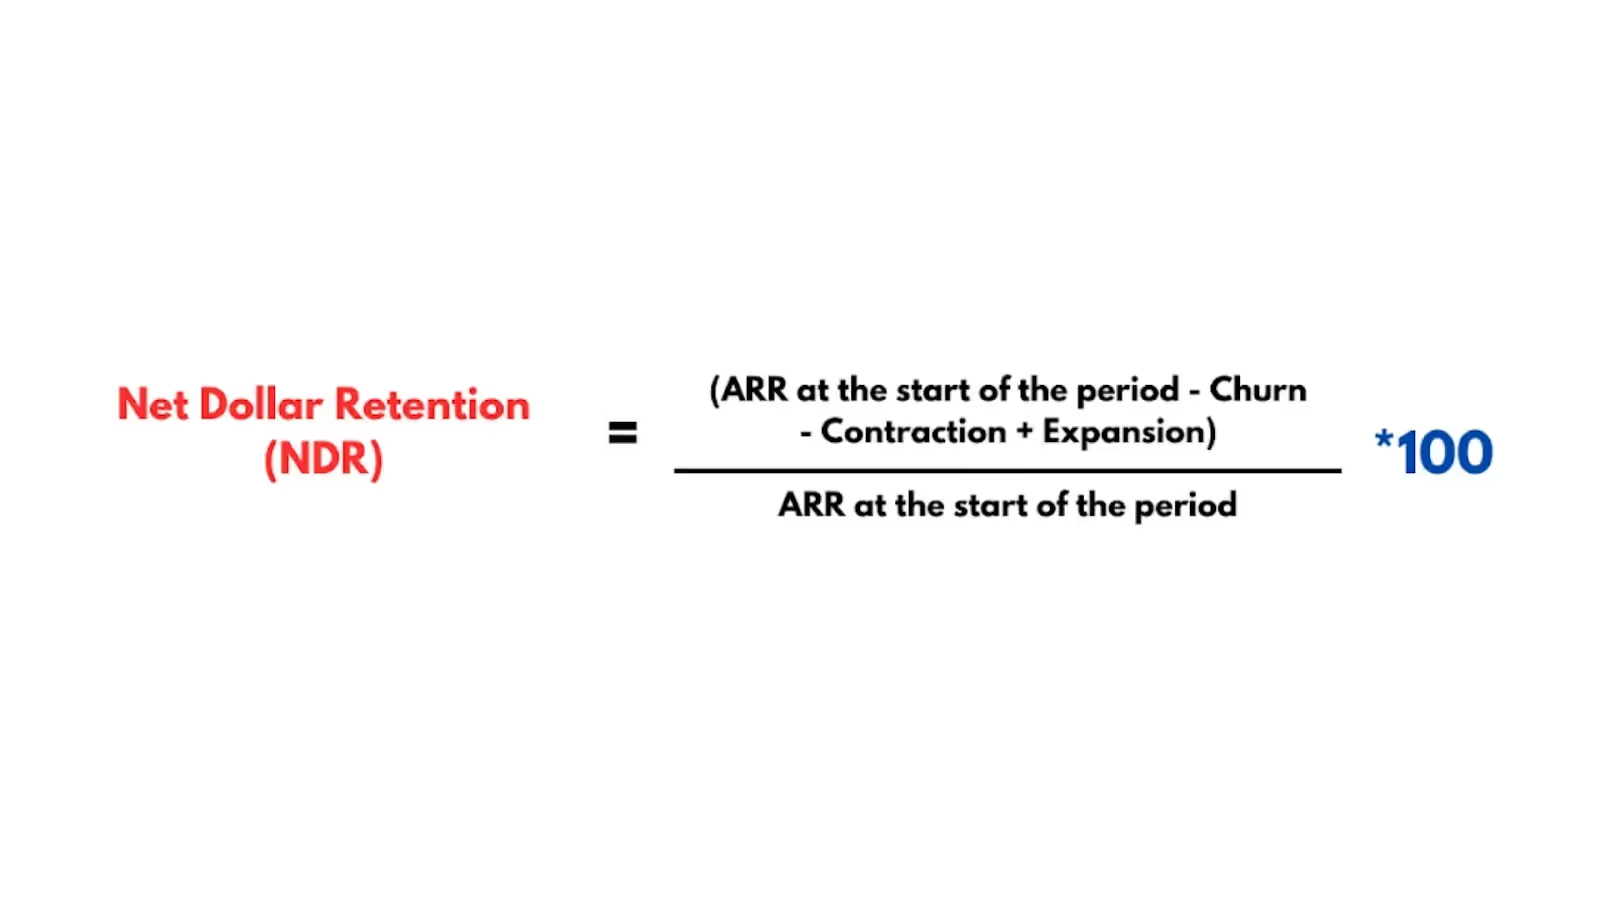
A report by Benchmarkit (formerly RevOps Squared) reveals that the median net dollar retention is 105%, where a 100% NDR falls in the 75th percentile.
For example, a SaaS had $1M in revenue from existing customers last quarter. This quarter's revenue was $1.1M, with $100K from upsells but $50K lost from churn. Their NDR is:
(($1.1M + $100K - $50K) / $1M) x 100 = 115%
This exceeds the 105% median, demonstrating solid expansion and engagement from the existing customer base. That brings us to customer churn, a measure of how many customers leave after signing up.
8. Customer Churn Rate
The churn rate measures the percentage of customers lost in a period. Lower churn signifies higher satisfaction and engagement.
Here’s the formula to calculate churn:
(Customers Lost / Starting Total Customers) x 100
CustomerGauge released an NPS and retention report in the B2B industry. The median churn rate for IT services is 12%, and that for the software industry is 14%.
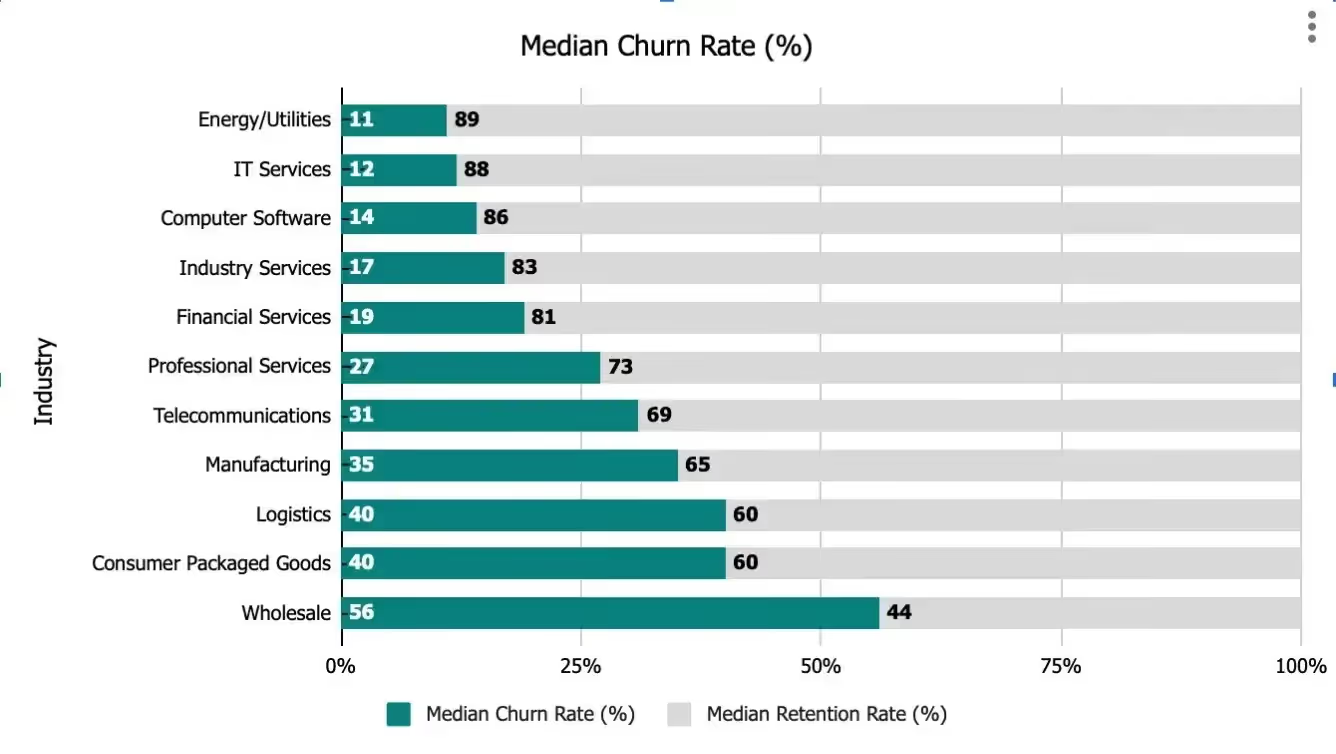
To benchmark your churn rates, check this example out. As a SaaS, suppose you had 1,000 customers last quarter and lost 75 of them. The churn rate will be calculated as below:
(75 / 1,000) x 100 = 7.5%
This is well below the 14% median churn for software businesses. However, that does not mean you should ignore it and move on. Reducing churn helps boost revenue growth so you can improve the onboarding process, account management, customer experience, and even retention promotions.
The lower your churn, the better. High churn signals poor customer engagement and satisfaction. Dig into why customers leave and address weak points across marketing, product, service, and other areas driving attrition.
9. Customer Lifetime Value (CLTV)
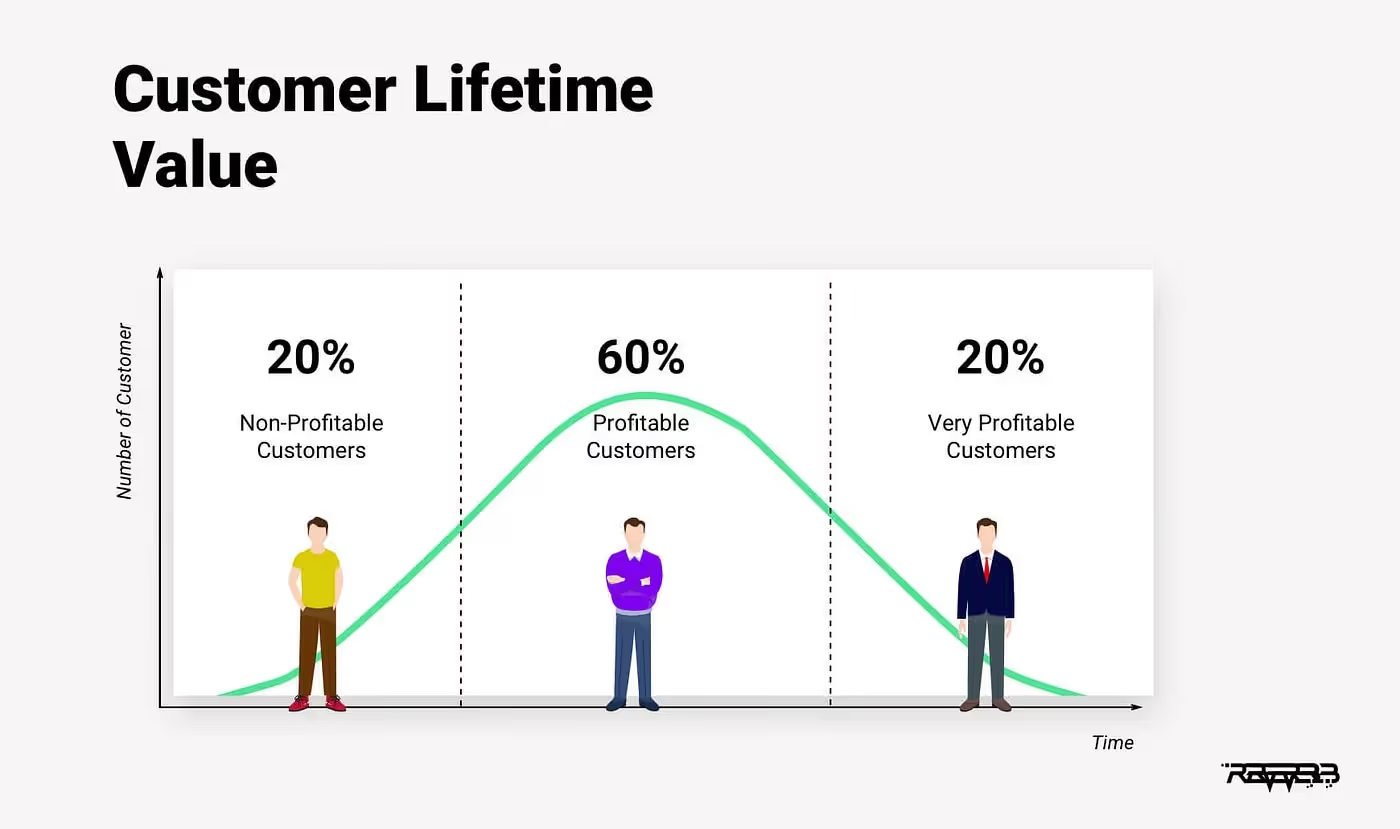
CLTV estimates future revenue a customer generates over their lifetime relationship with the company. Higher CLTV indicates greater engagement and business value.
Formula:
Average Order Value x Purchase Frequency x Average Customer Lifetime
According to CustomerGauge’s reports, the software industry has a CLTV of US$ 240,000, while a business consultancy has an average CLTV of $385,000.
However, this may not represent the indie startups or smaller SaaS businesses with 1-10 employees.
How can you determine your CLTV? Let’s look at it through an example.
A SaaS customer subscribes to a monthly plan costing $500. They remain active for four years. Their CLTV is:
$500 x 12 x 4 = $24,000
As you can see through this formula, boosting retention length, increasing the subscription prices, asking users to upgrade to better plans, and improving CX can help boost your customer lifetime value.
10. Daily/Monthly Active Users (DAU/MAU)
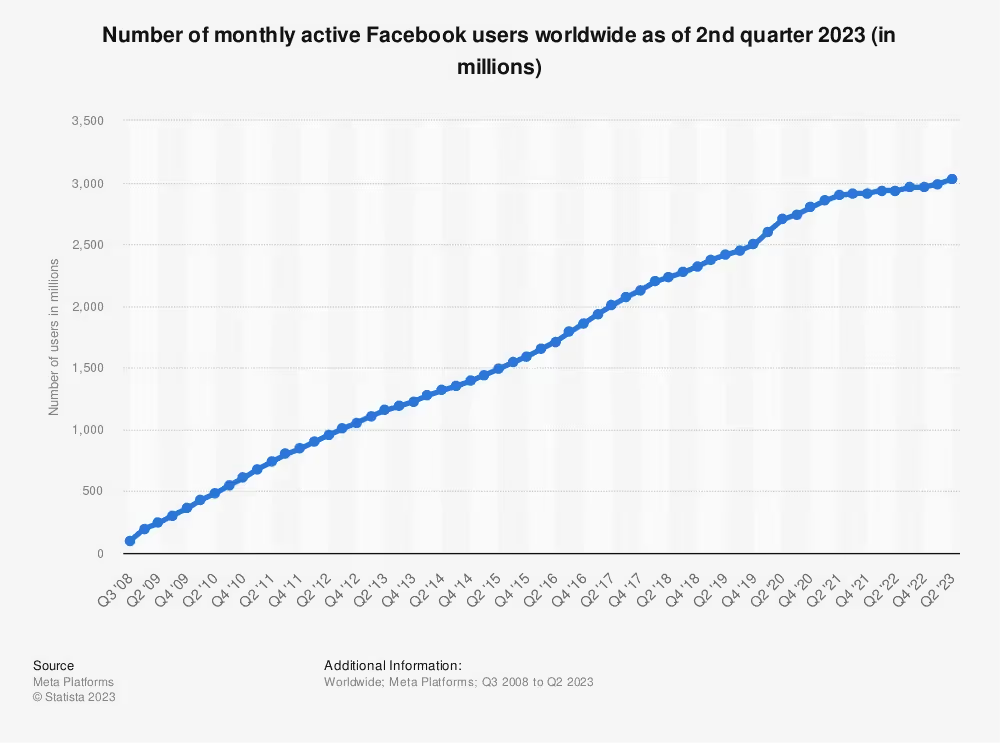
DAU/MAU measures daily and monthly active usage of apps and software. Higher ratios signify strong engagement and retention.
Sequoia tweeted that the average number of DAU/MAU for most businesses is lower than 20%. Very rarely does a business cross the 50% threshold. Whereas, with WhatsApp, the DAU/MAU hits 73% on average and is one of the highest recorded numbers.
To determine the DAU/MAU for your business, check your analytics for the total monthly active users. Then, check the daily active users.
For instance, if your daily active users are 1000 and your monthly active users are 5000, your DAU/MAU will be—1000/5000 * 100 = 20%
A lower percentage signals an opportunity to improve retention and engagement through changes to the user experience, onboarding, notifications, and loyalty programs.
Mistakes to Avoid When Measuring Engagement
While it's critical to track customer engagement KPIs, it's just as important to avoid these analysis and reporting mistakes:
- Using arbitrary targets without research—Don't randomly choose target metrics without researching realistic industry benchmarks and averages. Basing goals on competitive data provides an objective comparison point for whether your engagement levels are truly high, low, or average.
- Over-reliance on quantitative data—Hard metrics only reveal part of the engagement story. Supplement with qualitative data through post-transaction surveys, customer interviews, focus groups, and monitoring reviews. This provides context into the "why" behind metrics.
- Data silos across teams—Break down silos between marketing, sales, support, and product groups. Share insights cross-department to improve engagement holistically across the customer journey.
- Obsessing over vanity metrics—Don't fixate on vanity metrics like website visitors, email subscribers, or social followers. These don't measure true engagement or business impact. Focus on metrics tied to outcomes.
- Forgetting ongoing analysis—Don't just report metrics—actually act on what they tell you! Research why engagement levels change over time and continue optimizing based on insights.
How a Platform Like Factors Can Help
Trying to measure customer engagement across your business can get messy fast. You've got data in all these different places—your website, email stats, support tickets, social media, etc.
And those sources almost never talk to each other. So you're stuck manually pulling reports from individual tools and then trying to make sense of fragmented data to see the big picture. Not fun.
That's where Factors comes in.
It's an analytics platform that brings all your customer data together in one place. Finally—a single source of truth!
1. Unified Data and Reporting
Factors connects your data from sources like your website, CRM, marketing campaigns, customer support channels, and more. This provides a complete view of engagement across touchpoints on one centralized dashboard.
You can instantly analyze metrics by various segments like channel, campaign, cookie ID, account, geo, device, and more without tedious exports or merges between tools. Trend reporting over time is also streamlined.
2. Flexible Goal Tracking
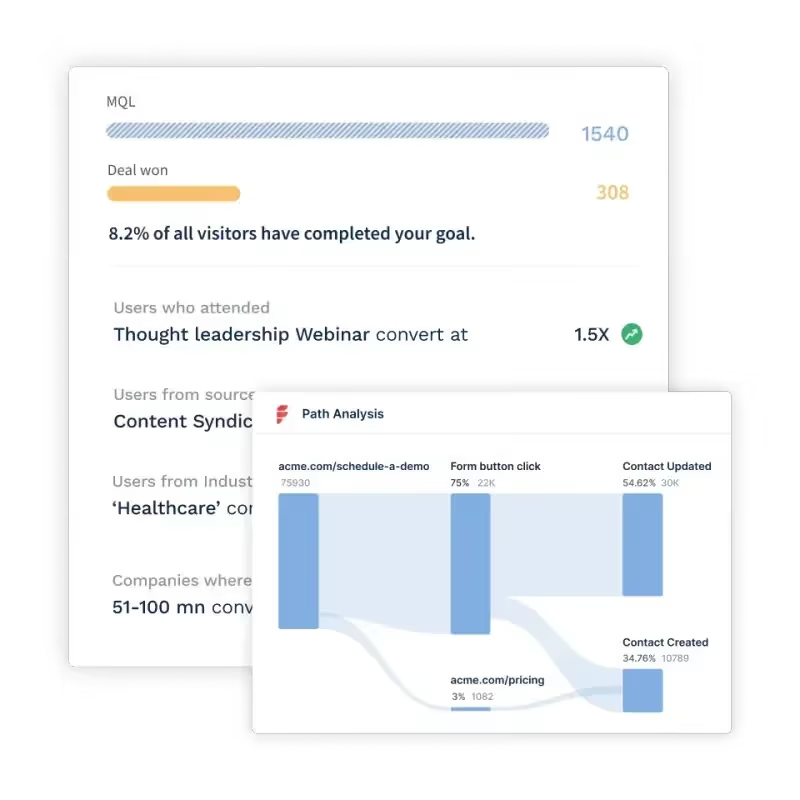
Factors gives you the flexibility to define and track engagement KPIs tailored to your specific business needs. For example, you may track CES for support and email campaign CTR. Determine the metrics most aligned with your goals, then track performance over time.
3. Account Identification and Scoring
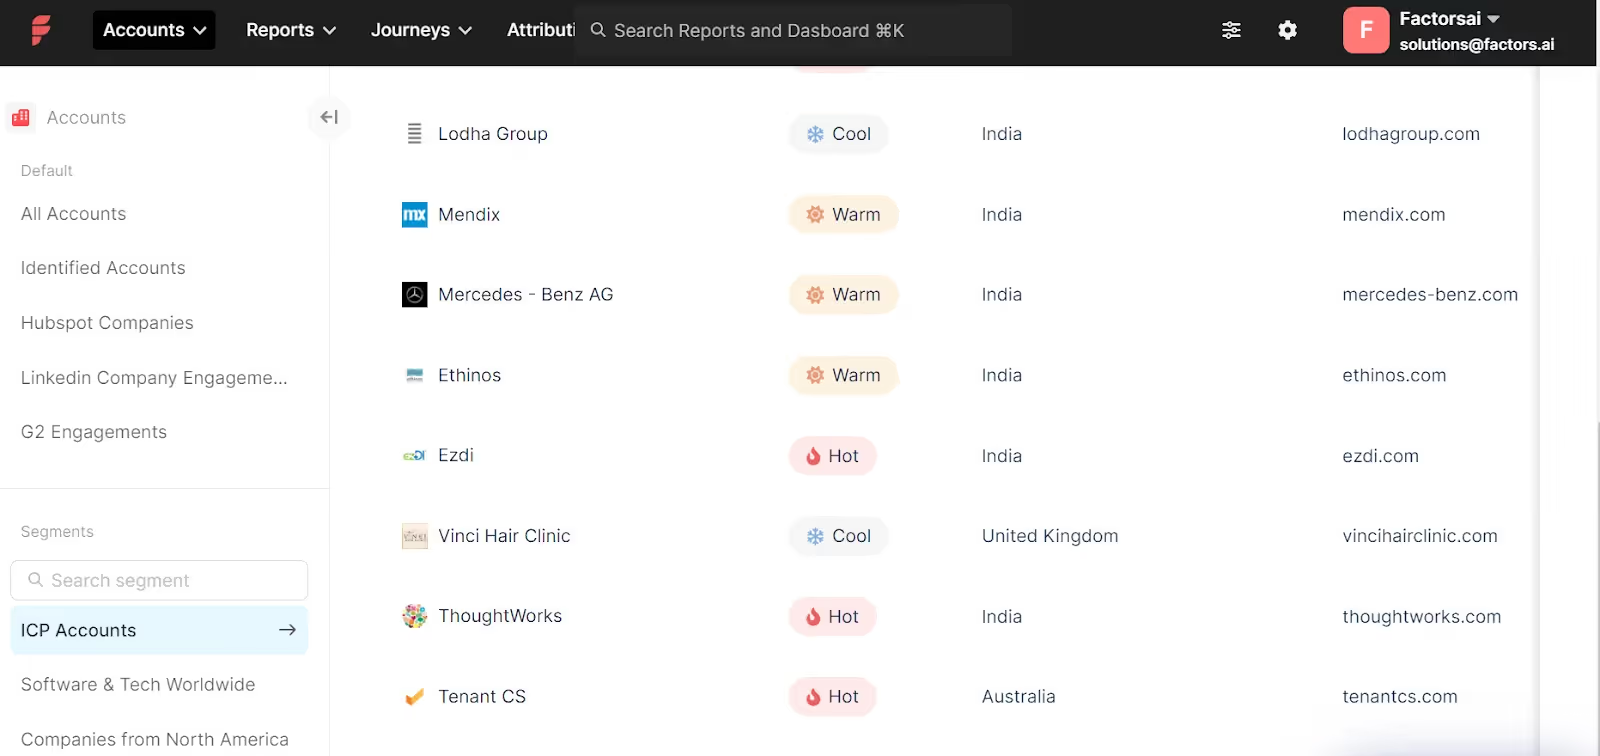
A challenge with engagement data is connecting metrics across anonymous and known users. Factors uses proprietary IP resolution to identify anonymous traffic at an account level.
From there, you can easily segment and filter accounts based on attributes like industry, tech stack, and more. Apply scoring models to tag accounts from highly engaged to at-risk based on your criteria.
The major benefit of Factors is its unified approach. Since it connects data from ad campaigns, websites, G2 pages, and more together, it can help you score leads considering customer engagements across all these platforms instead of basing decisions on single-platform engagements.
4. Customizable Dashboards and Reporting

Factors enables customizable reporting segmented by channel, campaign, account, and other attributes. Easily create leaderboards and reports for key metrics and trends visible to stakeholders company-wide.
You can also build customized dashboards with charts and breakdowns for different teams like marketing, support, and sales. And along with that, it’s enhanced automated reporting ensures insights are readily accessible whenever you need them.
5. AI-Driven Recommendations
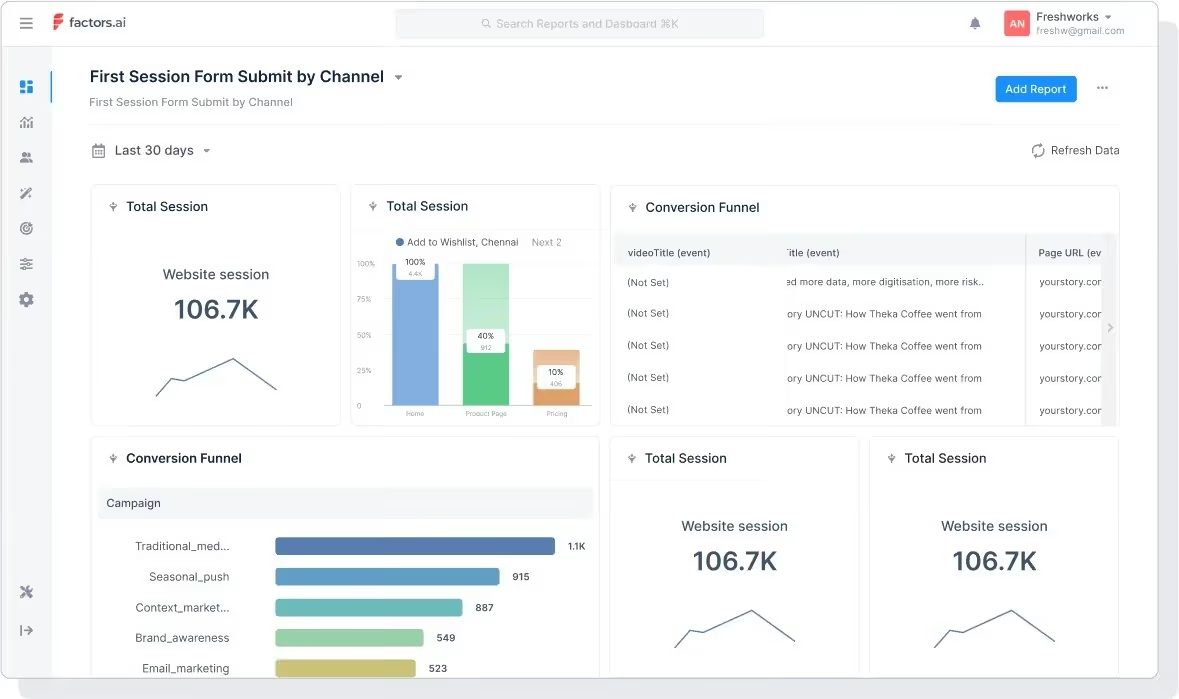
Factors takes insights further by providing AI-powered recommendations to improve engagement. The system analyzes changes in metrics and suggests actions to boost performance.
For example, if you type in something like “how do I improve my demo submissions”, Factors will run AI-fuelled algorithms in real-time and offer a list of touchpoints that are already working and can be optimized to achieve the desired result.
This centralization of engagement data helps you uncover insights instantly with Factors—helping you make smarter decisions and optimize experiences faster.
Start Using Customer Engagement Metrics And Build Customer-Focused Strategies
Tracking engagement gives you priceless insights into the customer experience. With the right data, you can spot friction points, find your best segments, and unlock growth opportunities.
But collecting all this data sounds easier than it is. Website stats live in your analytics platform. Email reports need downloading. Support tickets sit in a separate system. Stitching it together feels like a puzzle.
That's why Factors comes in handy.
It automatically brings data together from your website, ads, email, support, and more. Now you have a single view of engagement across touchpoints.
Factors also lets you define the metrics most important to your goals.
Want to track demo requests and trial signups? No problem—you can monitor the KPIs for your unique business needs.
The platform identifies known accounts from anonymous traffic so you can filter and segment at the account level. With Factors, you can build custom dashboards to share key metric trends and insights across your teams.
Its AI-powered recommendations analyze changes in your data and suggest ways to optimize engagement.
Measuring Customer Engagement
Customer engagement drives business growth, loyalty, and long-term profitability. Engaged customers buy more, advocate for your brand, and are less likely to churn. However, measuring engagement requires more than surface-level metrics like social media likes or email open rates. Businesses need data-driven insights into how customers interact across various touchpoints.
Customer engagement metrics reveal how customers connect with your brand over time. These include bounce rate, session duration, scroll depth, social engagement, Net Promoter Score (NPS), customer satisfaction (CSAT), churn rate, and customer lifetime value (CLTV). Tracking these metrics helps businesses optimize the customer experience, reduce churn, and uncover opportunities for growth.
For startups and B2B teams, connecting engagement data across platforms can be challenging. Tools that unify data from websites, CRM systems, support platforms, and ad campaigns simplify tracking and analysis. Real-time dashboards, account-level insights, and AI-powered recommendations enable teams to proactively identify disengaged customers and refine their marketing and sales strategies.
Focusing on meaningful engagement metrics allows businesses to shift from vanity performance indicators to data-backed strategies that drive revenue and customer retention.
Want to learn how Factors can help enhance your customer engagement and experience? Book a demo today!

A 3-Step Demand Generation Framework to Drive More Revenue
Learn how to ace your demand gen game and drive revenue with the 3-step framework by George Coudounaris, founder of The B2B Playbook.

George Coudounaris is the founder of The B2B Playbook and host of their top-rated B2B marketing podcast. Here’s his 3-step Demand Generation Framework to help marketers drive up to 80% more pipeline for their organization.
Demand Generation is often vaguely described and confused with brand marketing, lead generation, and performance marketing. It has become a buzzword that leads to tactics that rarely drive consistent results.
Demand Generation is a go-to-market strategy that builds an intense desire in a prospect to buy from you. It should do two things:
- Make your Dream Customer prioritize their problems in the way you solve it
- Lead them to the logical conclusion that you’re the perfect company to solve the problem for them
We show you how to do this with our 3-step Demand Generation Framework. It has taken companies from being largely sales-led to marketing, driving up to 80% of their pipeline.

Step 1 - BE Ready: Deeply understand your customers
Every organization is limited by budget, resources, and time. If we are going to go deep into a market, get them to trust us, and convince them to buy from us - we need to go deep into a segment of a market. If we go wide and shallow across the whole market, we won’t have enough touchpoints to build that trust and get them to buy. This is backed by data from Dreamdata, which shows that the average B2B customer journey has 62.4 touches across 3.6 channels and involves 6.3 contacts over 192 days.
That’s why step 1 of our Demand Generation framework starts with defining who your Ideal Customers are (your ICP). We recommend conducting an 80/20 analysis to identify who they are.
Ask yourself, who are the 20% of customers driving 80% of our revenue or profit? Which ones are the best fit for our business?
Identify their firmographics and demographics, with the goal of being able to find common traits. Once you identify who these best companies are, you should conduct customer interviews with them to understand:
- What great pains do you help solve for them
- How does it help with their jobs to be done (JTBD)
- What does their buying journey look like
- Who is the buying committee made up of
- What sources of information do they trust
- Where do they hang out online and offline
From here, you should have the information you need to identify your best customers, why they chose you over the competition, what you had to say to them to make them a customer, and where more customers (just like them) are hanging out.
Once you’ve done this, make sure that you document your ICP and the buying committee, and have noted what the typical buying journey looks like. This is your roadmap for winning new customers in the same segment as your ‘best’ customers.
Your next steps should then be to reposition your brand to make it obvious that you’re the ‘perfect fit’ for your future prospects in the segment that you’ve targeted. Then, of course, update your messaging across all your assets to reflect this (your website, LinkedIn, case studies, sales enablement content, etc.).
The comprehensive list of steps in stage 1: BE Ready are:
- Conduct 80/20 analysis
- Interview Dream Customers
- Document Ideal Customer Profiles (ICP)
- Update your Positioning and Messaging
- Map the Buying Journey
- Create your Dream 100 sources of influence
Step 2 - BE Helpful: Build relationships with helpful content
Once you’ve completed Stage 1 of our Demand Generation framework, you’ll have a deep understanding of the segment you’re targeting. You should also have gathered the information you need to build their trust and convert them from prospects to potential buyers.
Stage 2 is where we build the content that guides them through the buying journey. Our favorite framework for this is called ‘The 5 Stages of Awareness’. It takes a prospect from being ‘unaware’ that they even need your product or service to being led to the logical conclusion that you’re the perfect fit for them.

Your job is to create content that hits every stage of awareness. This should answer questions that they have at each stage and help them to progress to the next in their buying journey.
The 5 Stages of Awareness are:
Unaware: At this stage, potential customers are not even aware that they have a problem or a need that your product or service can address.
Problem Aware: Here, customers realize they have a problem but may not know the solutions available.
Solution Aware: Customers are aware of various solutions to their problem but may not be familiar with your specific product or service.
Product Aware: In this stage, customers know about your product or service but are still comparing it with other options in the market.
Most Aware: Finally, customers are fully aware of your product, including its benefits and how it compares to competitors. They are on the brink of making a purchase decision.
We highly recommend that you create this content in partnership with Subject Matter Experts. This will ensure that the content you create is of far higher quality than if you hired a freelancer with no industry or technical expertise to write it.
The complete list of steps in Stage 2 - ‘BE Helpful’ is:
- Understand how to help your ICP
- Create helpful content that educates and entertains
- Map your content to the 5 Stages of Awareness Framework
- Use Subject Matter Experts to create pillar content with on a regular schedule
- Repurpose this content to multiple channels for ease of consumption for your ICP
- Distribute your helpful content wherever it is your ICP is present
- Scale your content production
- Improve with quantitative and qualitative data
The process of repurposing content is important to help scale this content production engine. It allows you to create a high volume of extremely useful and relevant content while using as few resources as possible.
In my experience, most businesses don’t execute ‘Be Helpful’ properly because they miss one or several of these above key steps.
Many marketers also have their demand generation programs canceled because they don’t understand how to measure the leading and lagging indicators of success. It is going to take some time before your Demand Generation Engine is driving consistent pipeline, so you need to know how to prove to leadership that you’re on the right track and should not give up.
💡We give you our demand generation metrics to measure here.
Step 3 - BE Seen: Accelerate demand with paid media & ABM
I get very excited for marketers and teams when they have done the hard work in stages 1 and 2 and then reach Stage 3 - BE Seen. That’s because ‘BE Seen’ is all about distributing your content in front of your prospects that you’re targeting. You should have a great idea of who they are (i.e., the buying committee) and where they’re hanging both online and offline based on the research you’ve done.
There are 3 key ways that you can communicate with your future prospects:
- 1:Many (paid ads, organic social, YouTube, forums, etc.)
- 1:Few (conferences, round-tables, webinars, events, associations)
- 1:One (email, call, text)
The way I see it, marketing is typically equipped to handle 1:Many and 1:Few really well. Sales are normally best at 1:One. The content and messaging that you use across these, though, should largely be the same. You can just tailor the conversation further when you’re dealing with fewer people.
At this stage, you can also accelerate demand with Account Based Marketing (ABM). This is about identifying companies that are expressing interest in your product but haven’t actively raised their hand for a demo. By placing them into an ABM sequence, you have a series of orchestrated actions between sales and marketing to try to accelerate their demand and turn them into paying customers.
You can identify these companies based on their engagement in all of your different channels. We love using Factors.ai to help us get this information and then place these companies in an ABM motion.
The complete list of steps in stage 3 are:
- Use paid media to target the buying committee of key accounts
- Push educational content mapped to 5 Stages of Awareness
- Push product education content highlighting key benefits and features
- Focus on target accounts with low budget, high touch Account Based Marketing (ABM) pilot program
A word of advice
This Demand Generation Framework forces you to do the ‘hard work’ that so many skip. Demand is not generated by testing a bunch of different tactics and hoping something works. It’s built by deeply understanding your segment and helping your Dream Customers get to where they need to go.
This can be distilled into a plan to generate demand and a series of actions that the marketer must complete every week and commit to if they’re going to see results.
If you’d like the in-depth strategy, templates, and tools to execute our Demand Gen Framework in your business, check out our 12-week demand generation course.
![Datorama Pricing, Features, Limitations & More [Updated 2026]](https://cdn.prod.website-files.com/6898fdb2a8e6d57199082db3/698c581c52c239eda6a1401b_65e83257e2eab3bf442b4f3e_datorama%2520overview.avif)
Datorama Pricing, Features, Limitations & More [Updated 2026]
Datorama is a popular choice among marketing teams. Growing businesses are tempted to jump on the bandwagon. But before you do, here’s a detailed overview.

Datorama is a marketing cloud intelligence software developed by Salesforce. Given the immense popularity of Salesforce, Datorama has parallelly gained popularity amongst the B2B marketing community.
This blog will explore Datorama, its features, and pricing to see if it is best suited for your business.
What is Datorama?
Datorama is a marketing intelligence and analytics software that helps B2B teams integrate marketing data across different sources.
Today, customers connect with brands through multiple channels like social media and websites, prompting a marketing paradigm shift. Tools like Datorama use advanced data integration and analytics to address this. With over 4200 users, Datorama streamlines data management and empowers stakeholders across the organization with valuable insights.
By furnishing clear, comprehensive analytics reports, Datorama enables marketers to communicate their value proposition effectively, fostering trust and credibility with clients and partners alike.
At its core, Datorama aims to facilitate collaborative decision-making and drive collective efforts toward optimizing marketing performance.
Datorama Features
Here are Datorama’s salient features and offerings that make it a great marketing intelligence tool:
I. Data Capture
Datorama boasts over 300 API connectors that seamlessly integrate diverse data types from your API native library into any preferred format. This versatile platform facilitates the ingestion of structured and unstructured data from sources like social media, email, Google Analytics, CRM data, etc. You can refine their datasets with precise filtering options, tailoring the analysis to their specific requirements.
It has two different API connectors that help achieve this goal:
1. TotalConnect
It augments this functionality by enabling users to supplement data obtained from API connectors with additional datasets. For instance, if there are pertinent custom data extracts from platforms like Salesforce Marketing Cloud that lack API integration, TotalConnect serves as the remedy. It facilitates the transformation and cleansing of this supplementary data, rendering it suitable for reporting and visualization purposes within the Datorama platform.
2. Liteconnect
For non-marketing data sources such as weather forecasts, geographical information, or sales data. Although these datasets may not directly align with the Datorama data model, LiteConnect allows users to incorporate essential details into their reports effortlessly. By simply dragging and dropping data files into the platform, users can instantly visualize and analyze the information, enhancing the depth and richness of their insights.
2. Data Model
Datorama streamlines the data modeling process by furnishing marketers with 19 adaptable templates tailored to various data source categories, including online advertising, eCommerce, social listening, and web analytics. Beyond the initial data importation phase, the platform empowers users to further refine their data modeling efforts. This includes the ability to reconfigure, enhance, align, and categorize data according to specific requirements, ensuring flexibility and precision throughout the modeling process.
3. Reporting
You can export data from Salesforce Datorama to various destinations with no additional charges- whether it's your database or third-party data visualization or analytics platforms.
Datorama's Query API facilitates scalable data exports in diverse formats such as .csv, .pdf, and more. This makes it easy to create reports and share your findings and progress with all internal and external stakeholders.
4. Dashboards
Datorama's tool InstaBrand empowers users to create custom branded designs for their reports and dashboards. With its visualization section, users can generate impactful dashboards featuring graphs for various key performance indicators (KPIs) with just a single click. Alternatively, users can opt for preconfigured dashboards available in the standard version, simply specifying the campaigns and timeframes for the desired data.
The best thing about InstaBrand is the high level of personalization. Users have the flexibility to incorporate company logos, apply corporate colors, and integrate customizable widgets, tailored to their specific branding requirements.
Pivot Tables:
Pivot tables help visualize data and enable users to analyze information from various perspectives. They facilitate the filtering, sorting, and grouping of extensive datasets based on specific metrics or dimensions, enhancing the granularity of data analysis. Furthermore, pivot tables play a crucial role in generating personalized reports that succinctly summarize data insights without necessitating complex queries.
Datorama Use Cases
Datorama helps marketing teams address the following problems in their everyday functions:
1. Unify Data
Unified data integration through Datorama eliminates the inefficiencies associated with manual data processing tasks. Marketers with marketing intelligence tools like Datorama do not need to spend valuable time and effort on redundant activities such as manually filtering or entering data from disparate sources. With Datorama's numerous APIs, you can easily integrate data from various sources, regardless of format. This allows teams to redirect their focus toward revenue-generating tasks, prioritize strategic initiatives, and aim to engage potential customers more effectively.
2. Data Insights and Visualization
Datorama's robust data insights and visualization tools provide marketers with a powerful means of communicating with key stakeholders, including C-suite executives and cross-functional teams. The platform's easy-to-understand dashboards and visualization features enable marketers to present complex data clearly and compellingly. This not only simplifies reporting processes but also enhances internal communication and accountability. By leveraging Datorama's visualization capabilities, marketers can effectively demonstrate the value of their campaigns and initiatives, fostering greater transparency and alignment across the organization.
3. Analytics/Intelligence
Datorama's analytics and intelligence capabilities empower marketers to gain deep insights into their marketing efforts without the need for extensive manual analysis. Datorama enables marketers to quickly identify trends, patterns, and opportunities for optimization. This comprehensive understanding of marketing performance allows marketers to make data-driven decisions with confidence, optimizing their strategies to maximize results. It enables agile decision-making and continuous improvement without sacrificing focus on core tasks such as customer acquisition and engagement.
Datorama Limitations
1. Steep Learning Curve
Users have reported that Datorama's extensive customizability, tailored to cater to diverse industries, results in a steep learning curve. While the platform offers an umbrella solution for various needs, this high level of customizability can be overwhelming for teams tasked with setting up their own SaaS ecosystem. Particularly for smaller organizations lacking robust tech support or with limited resources, navigating Datorama's complexities may prove challenging.

2. Expensive Tool
Online reviews suggest that Datorama's pricing is relatively high compared to other solutions in this domain. This places Datorama firmly in the realm of enterprise solutions rather than catering to small and medium-sized businesses (SMBs). The elevated price point of Datorama may deter SMBs from considering it as a viable option for their marketing intelligence needs.

3. Limited Number of Seats
Another limitation is Datorama's restricted number of seats, which poses challenges to fostering sales-marketing alignment and cross-functional collaboration. Marketing intelligence tools should ideally accommodate more seats to facilitate seamless collaboration between departments. However, Datorama's seat limitations hinder the ability of teams to leverage the platform for cross-functional initiatives effectively. Given that growing businesses rely heavily on cross-functional teams, Datorama might not prove to be the best choice for rapidly evolving companies.
Datorama Pricing
Datorama offers three types of plans for users: Starter, Growth, and Plus.
- Starter plan: $3000 per month per organization (billed annually)
- Growth plan: $10,000 per month per organization (billed annually)
- Plus plan: Available on request

To summarize, Datorama is a great tool that helps marketers with three avenues- data unification, visualization, and data analysis. It is designed to serve various industries and has numerous integrations through APIs and built-in customizations for different needs. This is a great solution for enterprises that have tech-support teams, can invest time to tackle steep learning curves and pay a significantly higher price for the freedom of choice and robust features that Datorama provides. However, for solopreneurs and growing businesses, there are alternative solutions that can get the job done for a significantly lower cost.
Salesforce Marketing Cloud Intelligence (Datorama)
A marketing analytics platform that integrates and visualizes data from multiple sources to enhance campaign performance.
- Key Features: 300+ API connectors, customizable dashboards, AI-driven insights, and real-time reporting.
- Challenges: Steep learning curve due to extensive customizability and difficulties in handling large datasets.
- Pricing Model: Per-user pricing starts at $1,000 annually, varying based on organizational needs.
Salesforce Marketing Cloud Intelligence helps marketers centralize data, gain actionable insights, and optimize decision-making for improved marketing efficiency.

Data Correlation in B2B Marketing Analytics
Learn the importance of data correlation in B2B marketing analytics and how it can enhance your marketing strategies. Key insights & best practices inside.

Correlation vs. Causation
Correlation occurs when no cause and effect can be established between two variables that have a relationship. For example, the level of education of parents is positively correlated with the salary levels of their children. In other words, higher levels of education of parents has been observed in higher salary levels of their children. However, this does not mean that a direct causation can be established. If that were the case, to increase your salary level, you would simply have to get your parents in schools and universities. Another such example of correlations exists between heights and weights. Your height is not causing your weight but taller people tend to be heavier than shorter people.
Causation means that there exists a cause and effect relationship between two variables. In the education example, a direct relationship may exist between education level of a child and the average salary he earns. Someone who just completed an undergrad and someone who just finished an MBA might get different salaries even at the same experience level regardless of their parent’s education levels.
Correlation ≠ Causation
It is important to be able to distinguish between causations and correlations. The best way to differentiate the two is to consider all other factors that are involved in the outcome. For example, there exists a strong correlation between the data for ice cream consumption and murders. This correlation is a complete coincidence. But if you were to apply causation, it becomes worse because then it implies that ice cream consumption leads to murder.

Applying causation in less subtly absurd correlations can be even more harmful, especially if budgeting decisions are based on cause and effect relationships between touch-points. Ideally, most data analysts avoid establishing causations. First, because its hard and correlations are easier to establish. Second, direct causations are very rare.
Correlations in B2B Marketing Analytics
Establishing correlations and causations is fundamental to any and all data analysis. Marketing analytics is no exception to this. Correlation insights help marketers make sense of their data points. In turn, this contributes to optimizing marketing efforts and determining the impact of marketing on KPIs and revenue.
In other words, correlation analytics identifies valuable patterns within the story, your marketing data is trying to tell you. Here’s how:
1. Understand the impact of your SEO/PPC
2. Test campaign decisions during implementation
3. Determine the revenue impact of customer touchpoints
There can be several pitfalls to correlations data, particularly in cases where coincidences can be mistaken for statistically significant relationships. Some can be very obvious, others are not so much. For example, there exists a strong correlation between the number of pool drownings and films that Nicholas cage has appeared in through the years. Another perfect correlation is between total revenue generated by arcades and CS doctorates awarded in the US. But as is plain, these events have nothing to do with each other.

Let’s take a marketing example. Say a company decides to mail catalogs of their retail products to their target audience in Karnataka. Soon after, they Ef a stark rise in orders placed from Odisha. Intuitively, the right move would be to send more catalogs to Odisha to support the growing demand for your product. However, as a result of the strong relationship between the two touch-points, correlation analytics would suggest shipping catalogs to Karnataka instead.
Best Practices for Correlation and Causation in Marketing Analytics.
Avoid confirmation bias
Confirmation bias in correlations data occurs when your data inaccurately confirms a bias. Say, a preferred channel is performing better than another and a correlation that confirms your belief, you are likely to assign causation that isn’t there.
Anish is the marketing head of Company X. He recently had a celebrity promote X’s product. He worked hard on getting them on board and was sure that it will drive sales. Soon after, he noticed a spike in the number of website redirects from Facebook and immediately assigned the causation for this increased traffic to the celebrity’s campaign. Expecting similar results, he invests further resources and runs another ad with the celebrity. However, there is no change in performance. There is something amiss in the marketing head’s correlation analytics. Instead of checking for causation, he let your subjective assumptions take over. This is confirmation bias in play.
To assign definitive causation, it is necessary to check for coincidences. In this example, tracking performance data for the campaign across channels is a good way to assign cause to the campaign. Simply put, if the celebrity is affecting more people to click on this ad, then there should be a percentage increase in clicks in all channels that carried the ad with the celebrity. So Anish should’ve tried to corroborate the results, keeping all other things (like the intent of the target audience) constant across all platforms (Google, Facebook, Instagram, etc). On running such an analysis, he notices that only Facebook had a spike in traffic after the first ad, which wasn’t replicated across other platforms or even on Facebook itself when the second ad was shared. On further research, he learns that the platform had made changes to its algorithm around the same time, which seems to have impacted all ads on Facebook, including X’s.
Using quantitative data from all channels can help avoid making decisions or causations around subjective assumptions.
You can use a marketing analytics tool like Factors can help you check how a touchpoint is helping or hurting pre-determined conversion goals. The funnel feature allows you to customise your queries to check for specific correlations. Funnels can be created for website redirects, and in this example, the celebrity ad could be compared across channels in a few clicks and Anish could check whether to attribute the change to the celebrity ad or if there’s something else at play.
A/B testing
One of the best ways to establish effective correlation is A/B testing. Let’s say you’re revamping your website homepage and want to test the impact on traffic and conversions. A/B testing involves testing a variable (for example, the position of a “schedule demo” button). This change is tested across two-time frames — pre-change and post-change.
Let’s change the previous example and assume that the spike in Facebook redirects did not happen immediately after running the ads but happened a few weeks later. In the absence of a proper pre and post analysis, it is human nature for Anish to attribute it to the ad campaign. But if he did a pre-and post-analysis of the impact of ad campaign on redirects, he might find that the cause for the change is something else.
You can use tools like Factors.AI to record changes like new ads when they occur and use data from the various channels like Facebook as well as your website or conversions to A/B test campaigns. The funnel feature allows you to use campaign naming conventions to get data pre-change and post-change.
Analyse the impact of correlations across channels.
Looking out for correlations and establishing possible causations can help understand how a specific touchpoint is affecting pre-determined conversion goals. If you want to check impact on goals like say, web event sign-ups, white paper downloads or even deals won, you can use correlation and causation analytics to figure out what touchpoints are saying, helping you schedule demos, what touchpoints on your website is driving down form fills, etc.
Factors allow you to compare metrics on a week on week basis to catch changes in any of the metrics. The explain feature allows you to check for what URLs or web pages your users have visited before submitting a form. Apart from identifying URLs that have influenced the users to convert, you can also see which webpages aren’t performing well. Weekly sessions data can help see short term changes, apart from A/B testing. Correlations can also be checked at a segment level, like demographics, industries, business model types, etc.
Choose the right graphs for correlation analysis/reporting
Data collection is only the first step to understanding correlations. The second step is to read the data and share the insights. After getting the insights, you act upon the data as well as build data-driven strategies. To understand how a touchpoint is interacting with each other and the impact of a change on your conversion metrics and revenue, you can use graphs.
There are several kinds of graphs that can be used for correlation analysis.
Time-series graphs:
These reports compare metrics over time periods. They are most appropriate for trends or changes in metrics post a change in a touchpoint or campaign strategy etc.

Distribution Graphs:
These graphs can easily show when there is a correlation. They show changes in distribution against a mean.
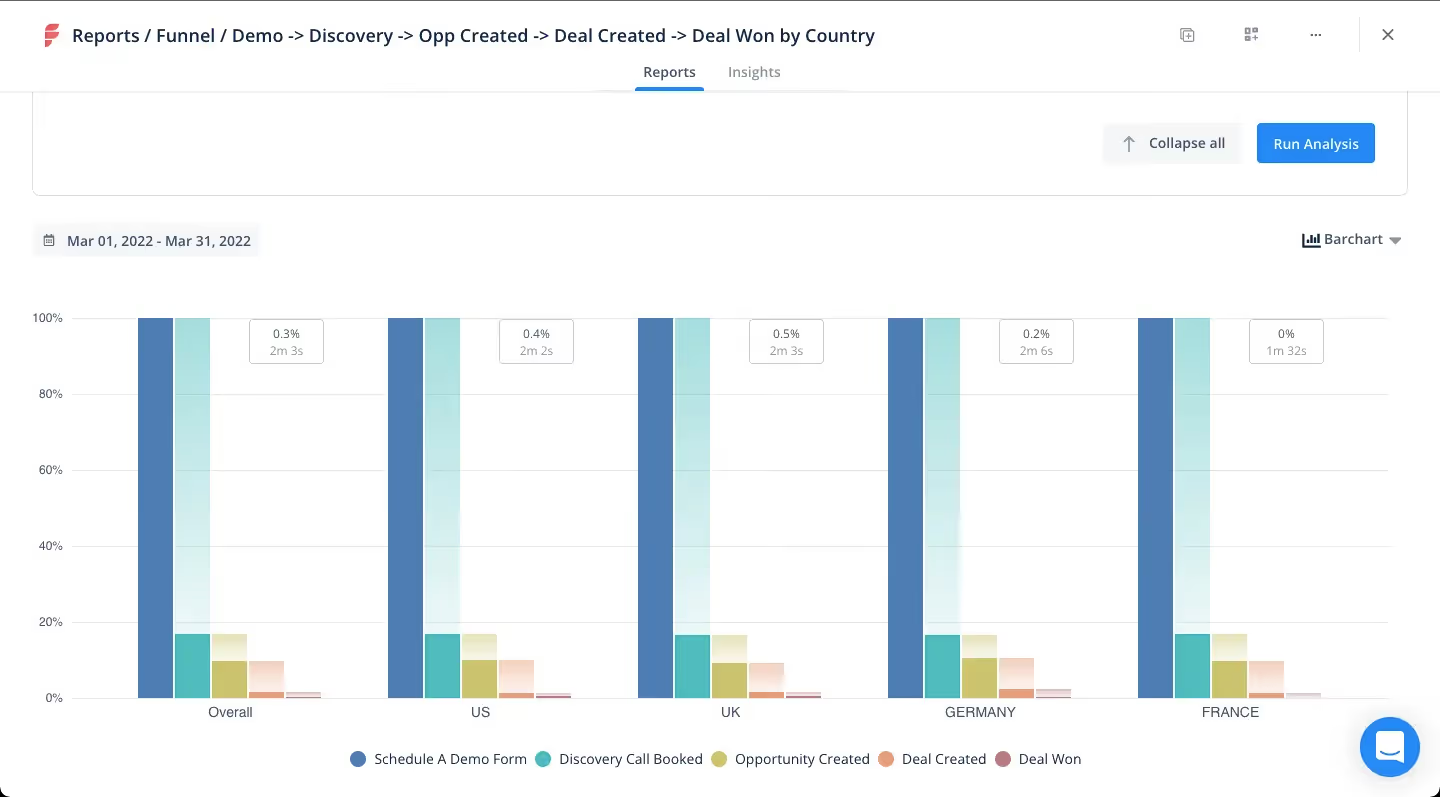
Funnel comparison graphs:
These graphs can be used to see a side by side comparison of funnel queries. Say you want to see how ad 1 and ad 2 have impacted the conversions, you can see a side by side strategy comparison of the two. You can also compare the same funnel before and after a specific time period.
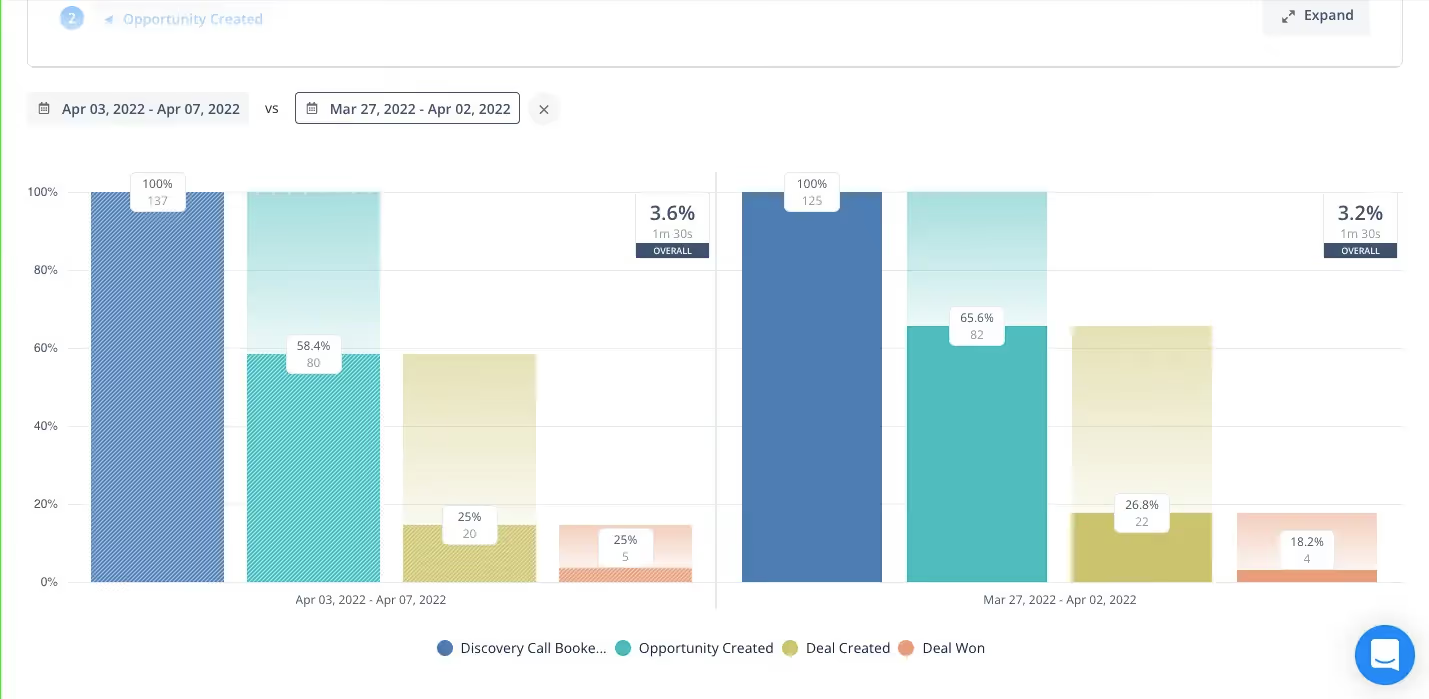
There are also other graphs like relationship graphs that help see the relationship (positive, negative or nil) between two or more metrics.
B2B SaaS marketers struggle with revenue attribution for a reason. The journey is long. The data is scattered. And the models do not always tell the full story. Factors.ai breaks this down into eight mistakes that show up again and again.
Many teams start without a clear attribution strategy. They depend on single touch models like first click or last click even when the buyer journey has ten touchpoints in between. Sales and marketing data do not line up, so the picture stays blurry.
Some teams miss offline or multi device interactions. Others use old or siloed data that cannot keep up with how buyers behave today. Mid funnel touchpoints like content and nurtures are ignored. And attribution models stay generic instead of being shaped for the business.
The final mistake is not testing and optimizing. Attribution is not a one time setup. It needs validation and iteration.
Factors.ai solves this with AI driven attribution designed for B2B SaaS. It pulls data together. It reads the full journey. And it gives teams the clarity they need to spend smarter and market better.
In closing...
In the age of data-driven marketing, it is important to know how to treat your data. Every customer journey and every touchpoint weaves a larger story where the channels are connected and touchpoints impact each other to influence each potential customer to convert. Correlations can help bring forth these insights that are invisible to the naked eye and can help you craft a winning marketing strategy for your organisation.

The Complete Guide To Customer Journey Mapping
A detailed guide on B2B Customer Journey Mapping for Effective Customer Engagement and how Factors helps with with Customer Journey Mapping
Customers are complex. What drives them? What bothers them? What encourages them? And what convinces them to choose you over your competitors? Without a clear framework in place, answers to these questions remain nuanced and theoretical.
Here’s where customer journey mapping can help.
A customer journey map visualizes the entire customer experience with your company — from awareness to deal won, and sheds light onto why your customers behave the way they do at every stage of the sales cycle.
As we will see, customer journey mapping proves to be beneficial in acquiring more customers, faster — and retaining them for longer durations of time.
Here’s what this guide to customer journey mapping covers:
- What is customer journey mapping?
- How does customer journey mapping work?
- Why do B2B companies need to map out their customer journeys?
- What should you include in your customer journey map?
- Steps to create a customer journey map
- Customer journey map vs user experience map: what’s the difference?
- How does Factors.ai help with customer journey maps?
What is customer journey mapping?
Especially in B2B deals, customers rarely make purchase decisions on an impulse. Instead, they spend significant time identifying pain-points, researching solutions, comparing alternatives, and freeing up budgets before finally becoming paying customers.

Customer journey mapping can be defined as the visualization of interactions that a buyer has with a company across the entire sales cycle — from awareness to deal won to retention. Customer journey mapping provides valuable insights to refine the overall customer experience, drive conversions, and improve customer retention rates.
In short, the customer journey map encapsulates this buyer experience. This journey can be broadly divided into: pre-conversion, onboarding, and post-conversion.
Each of these segments can be further broken down into granular customer touchpoints that the marketing, sales, customer success, and product team are responsible for.
How does customer journey mapping work?
There’s no one right way to go about customer journey mapping. But at its core, customer journey mapping works by consolidating and visualizing an otherwise complex, non-linear sales cycle.
With this framework, go-to-market teams can identify how customers behave, what their preferences are at each stage of the sales cycle, and what helps or hurts conversions.
As you might have guessed, plotting this customer journey map involves compiling data from a wide range of touch points across the sales cycle.
Without the right tools and techniques, tracking these touch-points across channels, campaigns, offline events, website, CRM and more can be a daunting task. More on how Factors.ai can ease this process later.
What should you include in your customer journey map?
While every business involves its own unique customer journey, a few key elements remain constant across the board. Here’s a breakdown of what you should look to include in your customer journey map.
1. Sales Cycle
Firstly, connect the dots between relevant data sources across campaigns, website, MAPs and CRM. This is to understand where your customers are coming from and how they’re engaging with your brand across the sales cycle.
The average B2B sales cycle can be broken down into the following stages:
- Awareness (ToFu marketing, branding, etc)
- Consideration (BoFu marketing, sales discovery, trials, etc)
- Decision (Effective sales and customer success)
2. Customer Behavior
Based on the data collected from the previous point, gauge how customers behave at different stages of the sales cycle.
Let’s say that the data suggests that during the awareness stage, buyers look to learn more about the problem they’re facing. At this stage, educational material such as ebooks or webinars may be more relevant to customers as compared to bottom of the funnel material such as comparison articles or case-studies.
3. Sentiment
B2B deals tend to be perceived as unemotional, objective transactions. However, at the end of the day, B2B businesses still sell to people — buyers and users — within a business. Accordingly, it’s important to consider the sentiment of leads and buyers during every stage of the customer journey.
For instance, the problem-awareness stage may involve frustration or confusion that we should look to minimize with useful content and personalized outreach. The solution-decision stage may involve feelings of relief or happiness which should be maximized with reliable customer support and relevant documentation.
4. Problems
Carrying on from the previous point: For any negative sentiment, there’s probably a pain-point or problem behind it. Identifying these pain-points at various stages of the customer journey will help create pointed, relevant customer experiences that look to solve user problems.
5. Solutions
As previously mentioned, we can look to solve challenges and paint-points along the customer journey to reduce or eliminate any points of friction. This will ensure smooth sales conversions.
Why do B2B companies need to map out their customer journeys?
Creating a customer journey map, especially without the right tools, can be an unintuitive and daunting task. Why then should businesses care to go through all this effort?
The overarching reason for B2B teams to create customer journey maps is because of its positive impact on customer experience, conversion, and retention. Breaking down the customer journey into broad stages with individual objectives simplifies, and ultimately improves, an otherwise convoluted customer journey.
Here are a few specific ways in which customer journey mapping benefits the customer experience, which in turn benefits your businesses’ bottom line metrics.
1. Identify what resonates with your audience
Customer journey mapping helps identify how different messaging, content, topics and themes resonate with your target audience. While marketers tend to have a hunch about this, qualifying a hypothesis with data helps scale efforts confidently.
2. Refine personas and improve targeting
Targeting a broad audience isn’t effective or scalable in the long run. Customer journey mapping sheds light onto which customers are actually interested in the value of your product. This helps refine the characteristics of ideal customer profiles and allows marketing teams to go after targeted, high-intent audiences.
3. Improve customer retention rate
The customer journey map charts a course all the way into the product and its end-users. This provides valuable insights into who the product is helping most, and how it’s helping them.
With this end-to-end view of the customer journey, it’s clear to see where to improve the customer experience, even within the product. This is invaluable information given that a third of Americans consider switching to an alternative after a single poor experience.
Ultimately, improving the customer experience means improving customer retention. Which in turn lends itself to stronger pipeline and up-selling opportunities.
Steps to Create a Customer Journey Map
Here’s a step-by-step breakdown of creating a customer journey map from scratch.
1. Define customer journey objectives
The first step is to determine why you’re constructing a customer journey map. What’s the objective? Whose customer experience are you looking to improve? Based on this information, define 1-3 hypothetical buyer personas that represent your ideal customer profile.
Buyer personas should be based on a combination of firmographic features like industry, revenue, and headcount as well as user-specific characteristics like role, department, tech-stack, etc.
2. Survey prospects and customers
After defining your hypothetical “perfect customer”, it’s time to survey your actual prospects and buyers. This is mainly to close the gap, if any, between how you believe your customers think and how they actually think.
Here are a few questions to ask prospects and customers:
- How did you hear about us?
- What are you looking to solve for? What’s your biggest pain-point?
- How would you rate our onboarding process on a scale from 1-10?
- How do you think we can improve our website content?
3. Track customer journey touchpoints
While asking customers where they found us and how they like our product is all well and good — it’s rarely sufficient. For one, B2B sales cycles last several weeks, if not months. It’s hardly fair to expect customers to remember the exact social media post that drove them to your website.
For another, subjective interviews are often riddled with bias and leading questions. To avoid inaccuracies in data, it's crucial to independently track touch-points across campaigns, websites, MAPs, CRM, and other relevant sources for objective analytics. With this, we can find answers to questions like:
- Which channel is driving the most traffic to my website?
- Which blog topics lead to the most conversions?
- What percentage of the pricing page are visitors scrolling through?
- How are customers progressing from an ad campaign, to website, to demo, to deal won?
Consider the sentiment, pain-points, and solutions that are associated with every customer action in order to understand motivations and tailor marketing efforts efficiently.
For example, if a page on “Identifying website visitors” seems to be driving a lot of conversions, this may be a pressing pain-point or use-case to your audience. In this case, tailoring outbound efforts and organic social with more content on visitor identification may be fruitful.
4. Allocate resources across the customer journey
So far, we’ve defined who we want to sell to, identified what current customers are thinking, and tracked how these customers are interacting with our brand.
Based on this goldmine of information, we receive a rough idea as to how we can better allocate resources. For instance, maybe mapping out this data reveals that webinars seem to perform disproportionately better than paid social at driving high-intent visitors.
Alternatively, this customer mapping exercise may also reveal a dearth in specific tools that could help accelerate sales velocity – email automation, customer service management, etc.
The reallocation of resources that follows these insights will ultimately result in the first iteration of the customer journey map. A design that encapsulates who your ideal buyers are and the ideal path they’ll take to become paying customers.
5. Analyze the customer journey
At this stage, we’ve crunched a whole lot of customer data and allocated resources to optimize the customer journey. But this is just one half of the puzzle. Analyzing and iterating based on real-life results is crucial to the success of a customer journey map.
Look to answer questions like:
- Where are customers dropping off disproportionately?
- Which touch-points are driving higher-than-average conversions?
- How does the quality of leads differ from one channel to another?
This is where the customer journey map graduates from theory to practice.
6. Iterate. Iterate. Iterate.
Using learnings from the analyses of the customer journey, run a wide range of experiments to test specific hypotheses at every stage of the sales cycle.
Perhaps reworking ad copies, repositioning CTAs on the website, investing in a customer service tool, updating the onboarding flow result in improved customer experience and conversions.
Rather than relying on intuition or guesswork, use the customer journey map to identify and iterate on strengths and limitations with data-driven insights.
Ideally, the customer journey map should be revised every month or quarter to stay aligned with every-changing customer behavior.
Customer Journey map vs User Experience map: What’s the difference?
In short, a customer journey map considers every measurable interaction that a customer has with your business from awareness to consumption. A user experience map, on the other hand, only considers how customers use the actual end product.
It’s important to distinguish between the two because, especially in B2B deals, the buyer is often different from the end-user. While there’s generally significant overlap between the two concepts, user experience is a subset of customer experience.
For example, a CMO reads a blog and attends a demo through a website before purchasing your software for her content marketing team. While the CMO might be thoroughly impressed with the material she’s interacted with, the content marketing team may actually be disappointed with the software.
While a customer journey map will consider this case end-to-end, a user experience map will only highlight the limited usage of the software by this content marketing team.
How does Factors.ai help with customer journey mapping?
Here are four ways in which Factors.ai can help map out your customer journey:
1. Account and User timelines
Factors unifies customer journey data across campaigns, website, and CRM to present an interactive timeline of touchpoints at a user and account level. This is an especially powerful tool for account-based marketing teams to track how users from their target accounts are progressing through the sales cycle.
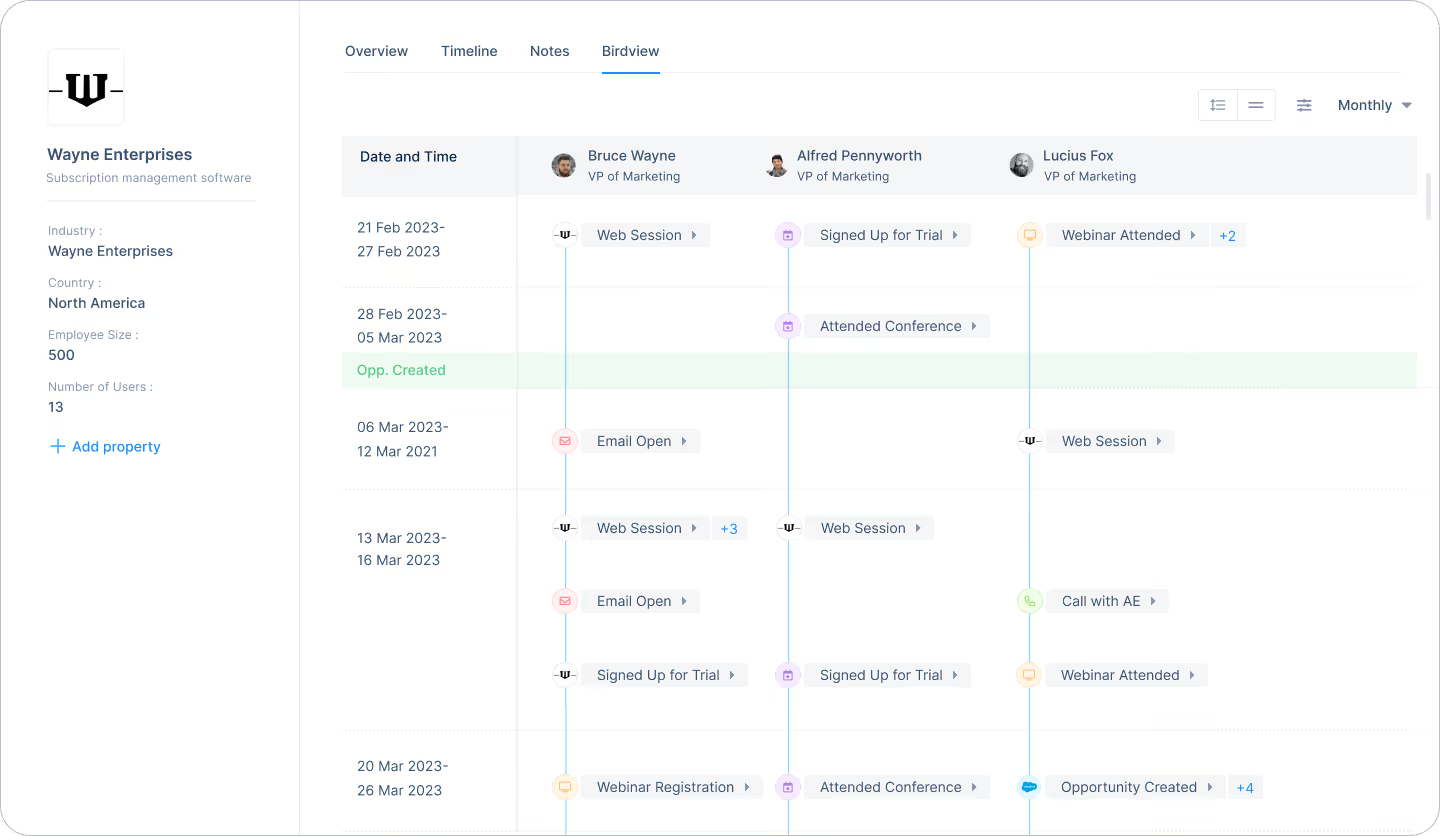
2. Account Identification
Factors uses industry-leading IP-look up technology to identify up to 64% of anonymous website traffic.. This provides valuable insights into which accounts are visiting your website and how they’re interacting with pages and content.

This firmographic and intent-data helps shape the buyer personas for your customer journey map as it sheds lights onto how different types of companies interact differently with your brand.
3. Attribution
As previously mentioned, measuring the right touchpoints and tying it back to revenue manually is, to say the least, a chore. Multi-touch attribution on Factors helps connect the dots between conversions and pre-conversion touchpoints. Compare a range of attribution models based on the nature of your business to quantify the impact of marketing effort on pipeline and revenue.
4. Path analysis
Path analysis is similar to timelines in that it provides an intuitive visualization of various accounts and users traveling through different paths along the customer journey. The difference is that path analysis reflects aggregated user behavior rather than a specific account’s journey.
This is helpful when testing hypotheses, running experiments, or gauging customer behavior on a larger scale.
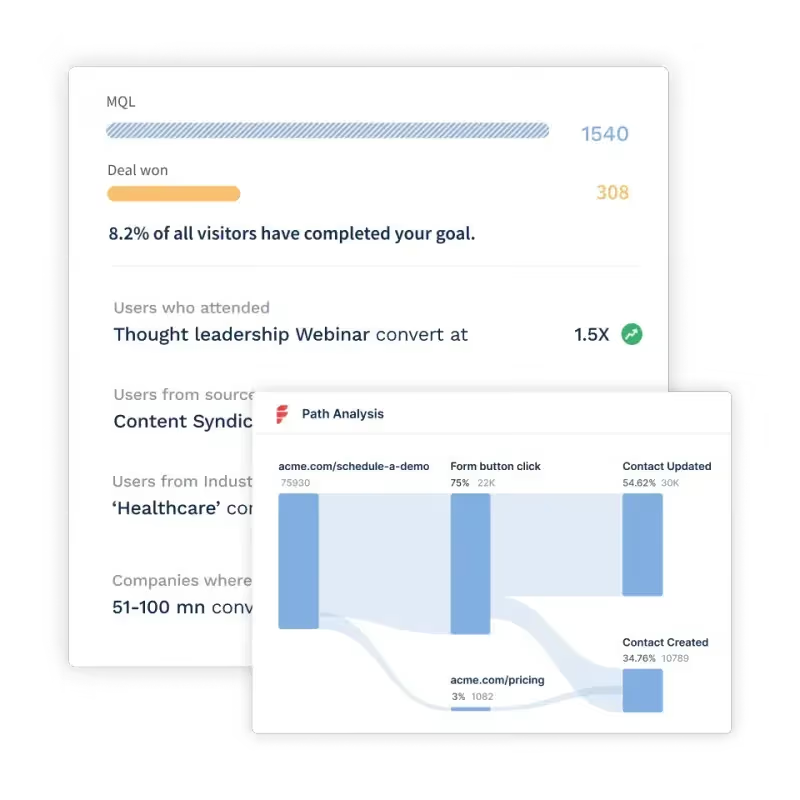
And there you have it! A complete guide to customer journey mapping — and how Factors.ai can help construct your customer journey map.
This guide emphasizes the importance of understanding the customer journey for effective marketing. It explains how to visualize and analyze buyer interactions from awareness to post-purchase. By mapping these touchpoints, businesses can pinpoint areas for improvement, enhance customer experiences, and boost retention rates.
.avif)
Customer Acquisition Funnel - The Complete Guide For 2026
Map your customer acquisition funnel, Find out how to analyze performance, identify bottlenecks, and optimize conversion rates at each stage.
TL;DR
- The customer acquisition funnel includes five core stages: Awareness, Interest, Consideration, Decision, and Customer, each requiring tailored marketing strategies.
- Mapping your funnel helps identify roadblocks, improve conversion rates, allocate resources more effectively, and support accurate growth projections.
- Using tools like Factors helps track and analyze customer interactions, making it easier to optimize strategies and improve customer acquisition over time.
- A well-built funnel requires ongoing testing and optimization, ensuring that marketing efforts are always aligned with customer needs and market changes.
The average website conversion rate across B2B is just about 2%. This means businesses miss out on most (~98%) brand-aware accounts already visiting their website. A deep understanding of your customer journeys and the ability to identify hidden opportunities becomes essential to make the most of this potential pipeline.
This is where a customer acquisition funnel comes in.
The customer acquisition funnel helps track how prospective customers flow through defined stages of the buyer journey to become loyal buyers. The funnel starts broad, capturing initial awareness and interest before narrowing down to hot leads, evaluating solutions, and finally making the purchase.
This guide covers everything you need to know about building, analyzing, and optimizing the customer acquisition funnels, including:
- Mapping the stages of the modern customer journey
- Tracking key funnel performance metrics
- Diagnosing and addressing bottlenecks stunting conversion
- Leveraging tools to unlock data-driven funnel insights
- Applying proven best practices to optimize acquisition
By the end, you’ll understand how a well-oiled customer acquisition funnel can drive sustainable business growth with minimal effort. Let's dive in!
What is a customer acquisition funnel?
The customer acquisition funnel is a structured path a potential customer follows from initial awareness of a product to ultimately becoming a paying customer. It consists of clearly defined stages that segment the customer journey into measurable phases.
Here is a simple example depicting the critical stages in a typical customer acquisition funnel:
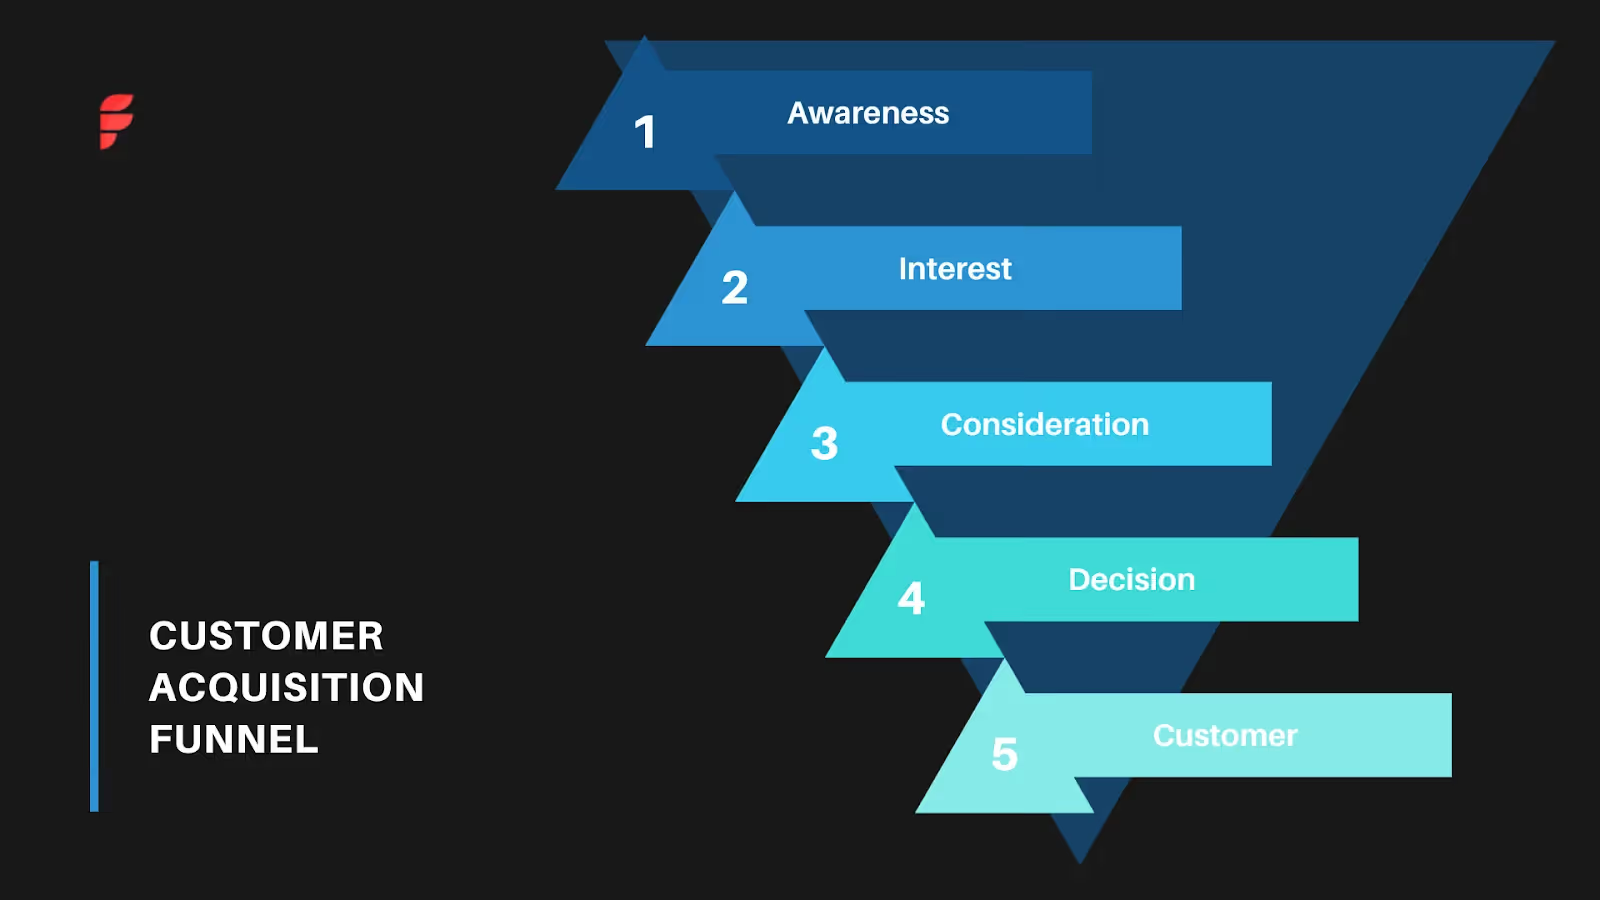
As you can see:
- The funnel is broad at the initial awareness stage, where many prospects learn about your offerings.
- It narrows as prospects display increased levels of engagement. This represents fewer prospects remaining actively engaged as the funnel progresses toward a purchase decision.
- At the end of the funnel, the smallest number of highly qualified prospects convert into paying customers.
The overarching goal of mapping the customer acquisition funnel is to establish a data-driven view of how prospective customers move through defined stages on their path to conversion.
It provides actionable insights to optimize marketing and sales processes across the entire customer lifecycle—maximize conversion rates, decrease acquisition costs, and improve retention over time.
Actively optimizing a customer acquisition funnel offers significant benefits, including:
- Identifying roadblocks within the customer journey to conversion.
- Determining the effectiveness of current acquisition strategies.
- Enabling more efficient allocation of marketing and sales resources.
- Supporting more accurate forecasting of future conversions and revenue.
- Fostering customer-centric thinking across the organization.
All of which helps you fix funnel leaks and continually improve your conversion ratio. With that clear, let's explore why the customer acquisition funnel is a high-return investment for any growth-oriented business.
Why is the customer acquisition funnel Important?
There are several compelling reasons why taking the time to thoughtfully map out and optimize your customer acquisition funnel is worthwhile:

1. It Aligns Teams and Strategies to Common Business Goals
The mapped customer journey gives every department—marketing, sales, product, customer service, etc.—a shared understanding of customers' complete experience. And a unified perspective enables better coordination of strategies across teams to optimize the journey.
For example, marketing can pass warm leads to sales quickly. Product can identify and fix usability issues that could lead to drop-offs, and the service can follow up with customers post-purchase to improve retention.
Without this alignment, teams can end up working in silos and creating a fragmented, inconsistent customer experience.
2. It Highlights Optimization Opportunities
Along with aligning teams, acquisition funnels help analyze conversion rates and drop-off points at each customer journey stage.
It also highlights areas where customers are struggling or abandoning the process. These issues represent tangible opportunities to optimize specific steps in the journey to make it easier and more seamless for customers.
For instance, a drop in conversions from free trial signup to paid signup may indicate friction in the onboarding flow or payments. If you have a system that identifies the issues, you can address them by reducing the steps for onboarding or changing your payment gateways.
3. It Informs More Impactful Resource Allocation
The mapped customer journey visually shows which parts of the process work well vs. underperforming. The data can make prioritizing budgets, staffing, technology solutions, and other resources easier. More funds can be allocated to the journey's branches needing improvement. Meanwhile, resources focused on high-performing portions may be redirected or minimized.
4. It Allows More Accurate Growth Projections
With historical data on customer volume and conversion rates mapped to each phase, you can better predict future acquisition and growth trends. Forecasting models can extrapolate forecasted customer volumes and associated revenue expansion over time.
This provides vital input for broader financial planning activities like budgeting, growth strategy, hiring plans, etc. Accurate projections set realistic goals versus arbitrary targets.
5. It Creates a Customer-First Mindset
Walking step-by-step through the customer experience encourages team members to view things from the customer's perspective. This naturally promotes greater empathy for and understanding of customer needs across the organization.
For example, seeing a high drop-off during an onboarding flow could prompt an engineer to simplify the process for faster time to value. This customer-centric mindset powered by the journey map establishes a critical foundation for customer-obsessed cultures.
Now that we've covered why mapping the customer journey is so valuable let's understand the critical stages of a typical acquisition funnel.
The Stages of the Customer Acquisition Funnel

The customer acquisition funnel is generally broken down into five core stages:
1. Awareness
This first stage is when potential customers become aware that a company and its products exist.
For example, someone may see an ad for a SaaS company offering project management software. The goal here is to build broad awareness and "get on the radar" of prospects.
Typical marketing activities within the awareness stage include:
- Digital advertising campaigns - search, display, social media, etc.
- Traditional advertising - television, radio, print, out-of-home
- Public relations and earned media outreach
- Content marketing - blogs, videos, guides, case studies
- Search engine optimization and website enhancements
2. Interest
At this stage, aware prospects start developing a genuine interest in the company. For example, someone who saw the project management software ad may now go to the website and download an ebook on productivity tips for managers. Marketing now provides targeted information and materials to nurture leads, convey relevance, and prompt engagement.
Common tactics used in the interest stage include:
- Promotional content - ebooks, whitepapers, email nurturing campaigns
- Targeted search and display advertisements
- Social media engagement - likes, shares, follows, clicks
- Customer testimonials and reviews
3. Consideration
In the consideration stage, interested prospects actively evaluate whether the solution fits their needs. For example, the lead may sign up for a free software trial to test it out. Marketing in this stage focuses on differentiation and incentives to drive trials and consultations.
Typical consideration stage activities include:
- Free trials of your product
- Live product demonstrations and consultations
- Multi-touch email campaigns
- Retargeting advertisements
- Sales representative calls and meetings
4. Decision
Here, prospects have narrowed options and are nearing a purchase decision. For example, the lead may be at a stage where they’re now comparing the project management tool against 1-2 competitors.
Marketing provides final convincing arguments to close the sale.
Some of the common tactics used in the decision stage involve:
- Special promotional pricing or discounts
- Highly targeted and personalized advertisements
- Aggressive sales follow-ups and closes
- Frictionless point-of-sale or checkout experiences
5. Customer
This is the final stage, where prospects complete a purchase to become customers. Marketing aims to drive loyalty, retention, referrals, and repeat sales. For example, the new customer is onboarded to the software and offered additional training and resources to improve the experience with your product.
Post-purchase activities include:
- New customer onboarding and implementation
- Satisfaction surveys and user feedback collection
- Loyalty or VIP programs
- Customer retention and win-back campaigns
- Referral programs
- Remarketing and cross-selling campaigns
Note this is only a framework to get you started. As companies implementing acquisition funnels mature, they develop custom funnels that work best for them. So, feel free to modify the stages as you see fit.
How to Build Your Customer Acquisition Funnel
With the understanding of what a good customer acquisition funnel can do and the stages involved, how can you implement one for your business? Here are a few simple steps you can follow:
Step 1: Conduct Customer Research to Map Buying Journeys
Start by truly understanding your target customers through qualitative and quantitative research. Learn what motivates them, their pain points, and the detailed buying process.
Analyze any existing sales and marketing funnels—conduct focus groups, surveys, interviews, and advisory boards to uncover the fundamental stages prospects go through to become buyers.
For example, after going through multiple transcripts, an enterprise software company may determine these high-level funnel stages:
- Awareness - Learn about the product from YouTube or communities
- Interest - Book a demo or register for a trial
- Consideration - Book demos and trials with other vendors for a detailed comparison
- Decision - Select finalist and negotiate contracts
- Customer - Onboard and train employees
This process is primarily manual. However, running your meeting transcripts through ChatGPT can help you gain insights quickly without reading transcripts or rewatching the meetings.
Step 2: Catalog Omnichannel Touchpoints and Interactions
Next, catalog every existing and potential marketing, sales, support, and product touchpoint you have with prospects. Do this across all marketing channels, from the first touchpoint to the sale.
Spend time brainstorming different ways your existing buyers interacted with your brand. For instance, an enterprise CRM company may identify these example touchpoints:
- Awareness - Tradeshow booth, 3rd party reviews
- Interest - Targeted social media ads, analyst content offers
- Consideration - Free trial signup, sales consultation
- Decision - Contract negotiations, training previews
- Customer - Onboarding calls, support portal, feedback surveys
List all possible touchpoints, including community mentions, YouTube videos, newsletters, and other channels, even if you don’t actively pursue them.
Step 3: Implement Analytics Tracking
Put in place tracking across your website, ads, email, and other digital channels. The list of touchpoints from Step 2 will guide where to add analytics tracking.
You also want a unified tracking platform that combines data for a holistic view. While most analytics are channel-specific, a platform like Factors compiles cross-channel data.
This gives a complete picture of how customers interact from initial contact to sale. You can see touch points across devices, channels, and time to understand the full path to conversion.
Step 4: Set Clear Conversion Rate and Revenue Benchmarks
With unified tracking implemented, closely analyze the performance of each marketing channel and touchpoint. Assess critical metrics like:
- Cost per lead for ads and campaigns
- Lead to customer conversion rates by channel
- Average sales cycle length after first contact
- Average deal size by lead source

This analysis identifies your highest and lowest-performing acquisition sources. See which parts of your funnel have the most friction or gaps.
For example, you may find newsletter leads convert at 2X the rate of cold calls. Or that leads coming from an event have larger deal sizes than web leads. This insight shows where optimization can make the most significant impact.
Step 5: Continuously Test and Optimize
While you can theoretically call an acquisition funnel “complete,” it never really is. You need to optimize it through A/B and multivariate testing continuously. This allows you to experiment with multiple versions to find the messaging systematically, offers, and flows that maximize conversion rates and prospect velocity.
For example, if your cold email outreach has a high volume but needs to improve on conversions, start testing.

Similarly, create a priority list for other channels based on opportunity areas revealed in the channel analysis.
You can run these tests to optimize content, calls-to-action, page layouts, forms, and more at each funnel stage. The goal is to move prospects seamlessly toward conversion.
Step 6: Keep Testing New Marketing Channels
You’ll often hear, “Stick to what works.” The advice is spot on. You must commit to your proven marketing strategies long enough to see accurate results. But clinging onto a dying marketing channel is a disaster waiting to happen.

For instance, when TikTok emerged, short videos became “the thing” that made many brands like NoGood exceptionally popular for their niche. But if you choose not to experiment with new channels when they’re still nascent, you will miss the benefits of being an early adopter. Stay ahead of the curve through ongoing assessments.
How Factors Helps Track & Improve the Customer Acquisition Funnel
For most businesses, tracking your acquisition funnel takes a lot of work. Customer data lives across many systems—your website, ads, email, CRM, etc.
And connecting all this data to analyze the customer journey manually is tedious and error-prone. It takes a lot of work to get a complete picture.
This is where Factors comes in.

Factors automatically brings together customer data from all your systems in one place. This provides a unified view of each customer's entire journey in your acquisition funnel.
With Factors, you quickly see how customers flow through your funnel by visualizing engagement across your ads, website, email campaigns, sales reps interactions, and more.

For example, you can see that a prospect first clicked on a Google ad, visited specific landing pages on your site, downloaded an ebook from your blog, was contacted by a sales rep, and ultimately converted by purchasing your product.
Factors stitches these events together into an interactive visual timeline for each customer account. You can instantly analyze the key steps and paths that drive conversions.

You can also break down funnel performance by critical segments like geography, product line, or customer type. If your funnel is working better for small businesses versus enterprises, Factors makes this clear.
Beyond just reporting, Factors provides powerful analytics to optimize your funnel:
- Identify which marketing channels drive awareness and interest most effectively.
- See where prospects fall out of your funnel and diagnose why.
- Calculate conversion rates and sales velocity at each funnel stage.
- Uncover friction points in the customer journey on your website.
- Determine which sales reps convert leads most efficiently.
- Predict which prospects will likely convert next using machine learning.
With Factors, you get the complete picture of your acquisition funnel in one place. This enables you to continuously optimize marketing, product, sales, and other processes to acquire more valuable customers cost-effectively.
Customer Acquisition Funnel Template
Customer Acquisition Funnel Template
Objective: Track and optimize the customer journey from awareness to conversion to enhance business growth and streamline marketing and sales efforts.
1. Funnel Stages
The customer acquisition funnel consists of five core stages that reflect the buyer's journey:
1.1 Awareness
Objective: Introduce your brand to potential customers.
Activities:
- Digital advertising (search, display, social media)
- Traditional advertising (TV, radio, print)
- Public relations, earned media
- Content marketing (blogs, videos, case studies)
- SEO and website optimization
Metrics to Track:
- Website traffic
- Ad impressions
- Content engagement (clicks, views, shares)
2. Interest
Objective: Nurture initial curiosity and convert awareness into engagement.
Activities:
- Downloadable resources (ebooks, whitepapers)
- Social media engagement
- Email nurturing campaigns
- Customer testimonials and reviews
Metrics to Track:
- Leads generated
- Content downloads
- Engagement (social media interactions, email open rates)
3. Consideration
Objective: Help prospects evaluate your solution and build trust.
Activities:
- Free trials or demos
- Sales consultations or webinars
- Retargeting ads
- Multi-touch email campaigns
Metrics to Track:
- Trial signups
- Consultation bookings
- Click-through rates (CTR) on retargeting ads
4. Decision
Objective: Close the sale by overcoming objections and offering final incentives.
Activities:
- Special discounts or promotions
- Personalized follow-ups and calls
- Frictionless checkout or point-of-sale experiences
Metrics to Track:
- Conversion rate
- Sales cycle length
- Revenue generated from promotions
5. Customer
Objective: Onboard and retain customers to foster loyalty and advocacy.
Activities:
- Onboarding calls and product training
- Customer satisfaction surveys
- Loyalty programs or referral incentives
- Retargeting and cross-selling
Metrics to Track:
- Customer retention rate
- Net Promoter Score (NPS)
- Referral program participation
2. Funnel Optimization Strategies
Identify Bottlenecks
Track drop-offs at each stage to identify where prospects are losing interest or getting stuck.
Resource Allocation
Direct more resources (budget, personnel, tools) toward areas with the highest conversion potential.
A/B Testing
Continuously experiment with different strategies at each stage, such as email subject lines, landing page designs, or ad copy.
Cross-Channel Analytics
Ensure data from all touchpoints (website, ads, email, social, sales reps) is tracked in one unified system.
3. Key Performance Indicators (KPIs)
Conversion Rate by Stage
Measure how effectively prospects move from one stage to the next.
Cost per Lead (CPL)
Track the cost of acquiring leads through various channels.
Lead to Customer Conversion Rate
Calculate how many leads convert to paying customers.
Sales Velocity
Measure how quickly prospects move through the funnel from initial contact to conversion.
4. Continuous Improvement
Monitor Funnel Performance
Use analytics platforms to track engagement and optimize the funnel in real time.
Test New Marketing Channels
Stay ahead of emerging channels and test their impact on your funnel.
Optimize for Customer Experience
Ensure that each touchpoint offers value and aligns with customer expectations to minimize friction.
5. Tools & Resources
Factors Analytics
Use analytics tools (e.g., Factors) to visualize your funnel performance, track interactions, and uncover insights for optimization.
CRM Systems
Keep detailed records of customer interactions to improve lead nurturing.
Marketing Automation
Automate emails, retargeting ads, and other communications to streamline funnel management.
Customer Acquisition Funnel Review
Review your customer acquisition funnel regularly to ensure that it’s aligned with your business goals, customer needs, and the evolving market landscape. Adjust your strategies as needed to increase efficiency and conversions.
Give Your Conversion Rates a Boost with Customer Acquisition Funnels
Constructing, tracking, and optimizing a customer acquisition funnel provides tremendous benefits for businesses striving for sustainable scalability and revenue growth. It offers an adjustable data-driven framework for:
- Holistically visualizing the customer journey within your company.
- Pinpointing problems impacting conversions and sales velocity.
- Continuously improving marketing and sales processes.
- Cost-effectively acquiring more high-value customers.
The bottom line—taking the time to build and leverage the customer acquisition funnel outlined in this guide is a vital, high-ROI activity for any growth-oriented business.
To recap, with a well-designed and optimized customer acquisition funnel, you can:
- Map the unique stages customers move through on their journey to purchase.
- Identify your most effective acquisition strategies and channels.
- Uncover conversion bottlenecks stunting growth.
- Optimize resource allocation and activities.
- Predict future customer acquisition and revenue performance.
{{CTA_BANNER}}
The customer acquisition funnel is indispensable for sustainably scaling up conversions and sales in highly competitive markets. So, use the available tools to make the most of your traffic effortlessly!
Want to know how Factors can help you on this journey? Book a demo with Factors and let our analytics and attribution experts guide you.
FAQs on Customer Acquisition Funnel
1. What is a customer acquisition funnel?
A customer acquisition funnel is a structured path potential customers follow from first becoming aware of a product to ultimately making a purchase. It consists of stages that segment the customer journey, helping businesses understand and optimize each step to drive higher conversions.
2. Why is optimizing a customer acquisition funnel important?
Optimizing a customer acquisition funnel helps businesses identify roadblocks, improve conversion rates, allocate resources efficiently, and make more accurate growth projections. It also fosters a customer-first mindset, enhancing the overall customer experience and increasing long-term retention.
3. What are the key stages of the customer acquisition funnel?
The key stages are:
- Awareness: Building broad awareness of the product.
- Interest: Engaging prospects with relevant content.
- Consideration: Encouraging leads to evaluate the solution.
- Decision: Finalizing the purchase decision.
- Customer: Onboarding, retention, and loyalty-building.
4. How can tools like Factors help optimize the acquisition funnel?
Factors aggregates customer data across multiple channels, providing a unified view of the entire customer journey. It helps businesses track funnel performance, diagnose issues, and identify the most effective marketing and sales strategies, enabling continuous funnel optimization and improved conversions.

What is a Customer Profile? How to Build Them and Use Them
Learn how to build, analyze & use a customer profile with examples, segmentation, tools & best practices.
TL;DR
- Customer profile meansA detailed, data-driven picture of the people or companies most likely to buy from you and stay loyal over time.
- It matters because it’s the foundation for better targeting, higher ROI, stronger retention, and aligned sales and marketing strategies.
- The key elements of a customer profile areemographics, psychographics, behavioral patterns, geographic, and technographic data, all of which combine to form a complete view.
- Use demographic, psychographic, behavioral, geographic, and value-based methods to group customers meaningfully.
- How to build one: Gather and clean data, identify patterns, enrich with external sources, build structured profiles, and refine continuously to build a customer profile.
- CRMs, data enrichment platforms, analytics software, and segmentation engines make customer profiling faster and more accurate.
Most teams think they know their customer.
They have dashboards, CRMs full of contacts, a few personas sitting in a dusty Notion doc, and a vague sense of “this is who usually buys from us.” And yet, campaigns underperform, sales team chases the wrong leads, and retention feels harder than it should.
I’ve been there.
Early on, I assumed knowing your customer meant knowing their job title, company size, and maybe the industry they belonged to. That worked… until it didn’t. Because knowing who someone is on paper doesn’t tell you why they buy, how they decide, or what makes them stay.
That’s where customer profiling actually starts to matter.
A customer profile isn’t a theoretical exercise or a marketing buzzword. It’s a practical, data-backed way to answer a very real question every team asks at some point:
“Who should we actually be spending our time, money, and energy on?”
When done right, customer profiling brings clarity. It sharpens targeting. It aligns sales and marketing. It helps you stop guessing and start making decisions based on patterns you can see and validate.
In this guide, I’m breaking customer profiles down from the ground up. We’ll answer questions like ‘what are customer profiles?’ ‘How are customer profiles different from personas?’, ‘How to build one step-by-step’, and ‘how to actually use it once you have it’.
No jargon, and definitely no theory-for-the-sake-of-theory. Just a clear, practical walkthrough for anyone encountering customer profiling for the first time, or realizing they’ve been doing it a little too loosely.
What is a customer profile?
Every business that grows consistently understands one thing really well: who their customers actually are.
Not just job titles or locations, but what they care about, how they make decisions, and what keeps them coming back.
That’s what a customer profile gives you.
A customer profile is a clear, data-backed picture of the people or companies most likely to buy from you and stay with you. It brings together insights from marketing, sales conversations, product usage, and real customer behavior, and turns all of that into something teams can actually act on.
I think of it as an internal shortcut.
When a new lead shows up, a strong customer profile helps your team answer one simple question quickly: “Is this someone we should be spending time on?”
When teams share a clear customer profile, everything works better. Marketing messages feel more relevant. Sales focuses on leads that convert. Product decisions feel intentional. Leadership plans growth with more confidence because everyone is aligned on who the customer really is.
And once you know who you’re speaking to, the rest gets easier. Targeting sharpens. Conversations improve. Instead of trying to appeal to everyone, you start building for the people who matter most.
Also read: What is an ICP
Customer Profile vs Consumer Profile vs Buyer Persona
This is where a lot of teams quietly get confused.
The terms customer profile, consumer profile, and buyer persona often get used interchangeably in meetings, docs, and strategy decks. On the surface, they sound similar. In practice, they serve different purposes, and mixing them up can lead to fuzzy targeting and mismatched messaging.
Let’s break this down clearly.
A customer profile is grounded in real data. It describes the types of people or companies that consistently become good customers, based on patterns you see in your CRM, analytics, sales conversations, and product usage. It helps you decide who to focus on.
A consumer profile is very similar, but the term is more commonly used in B2C contexts. Instead of companies, the focus is on individual consumers. You’re looking at traits like age, location, lifestyle, preferences, and buying behavior to understand how different customer groups behave.
A buyer persona works a little differently. It’s a fictional representation of a typical buyer, created to help teams empathize and communicate more effectively. Personas are often named, given a role, goals, and challenges, and used to guide messaging and creative direction.
Related read: ICP vs Buyer persona
Here’s how I usually explain the difference internally:
- Customer profiles help you decide who to target
- Consumer profiles help you understand how individuals behave
- Buyer personas help you figure out what to say and how to say it
The table below summarizes this distinction clearly:
In B2B, customer profiles are the foundation. They help sales and marketing align on which accounts are worth pursuing in the first place. Buyer personas then sit on top of that foundation and guide how you speak to different roles within those accounts.
But in B2C, consumer profiles play a bigger role because buying decisions are made by individuals, not committees. But even there, personas are often layered in to bring those profiles to life.
The key takeaway is this: profiles drive decisions, personas drive communication. When teams treat them as the same thing, strategy becomes messy. When they’re used together, each for what it’s meant to do, everything starts to click.
Up next, we’ll look at why customer profiling matters so much for business growth and what actually changes when teams get it right.
Why customer profiling matters: Benefits for business growth
Customer profiling takes effort. There’s no way around that. You need data, time, and cross-team input. But when it’s done properly, the impact shows up everywhere, from marketing efficiency to sales velocity to long-term retention.
Here’s why customer profiling deserves a central place in your growth strategy.
1. Sharper targeting
When you have a clear customer profile, you stop trying to appeal to everyone.
Instead of spreading your budget across broad audiences and hoping something sticks, you focus on the people and companies most likely to care about what you’re offering. Ads reach the right audience. Outreach feels more relevant. Content speaks directly to real needs.
This usually means fewer leads, but better ones. And that’s almost always a good trade-off.
2. Better ROI across the funnel
Accurate customer profiles improve performance at every stage of the funnel.
Marketing campaigns convert better because they’re built around real customer behavior, not assumptions. Sales conversations move faster because prospects already fit the profile and understand the value. Retention improves because expectations are aligned from the start.
When teams stop chasing poor-fit leads, effort shifts toward opportunities that actually have a chance of turning into revenue.
3. Deeper customer loyalty
People stay loyal to brands that understand them.
When your customer profile captures motivations, pain points, and priorities, you can design experiences that feel relevant rather than generic. Messaging lands better. Products solve the right problems. Support feels more empathetic.
That sense of being understood is what builds trust, and trust is what keeps customers coming back.
4. Reduced churn and stronger retention
Customer profiling isn’t only about acquisition. It’s just as valuable after the sale.
Strong profiles help you recognize which behaviors signal long-term value and which signal risk. You can spot at-risk segments earlier, understand what causes drop-off, and design retention strategies that actually address those issues.
Over time, this leads to healthier customer relationships and more predictable growth.
5. Better alignment across teams
One of the biggest benefits of customer profiling is internal alignment.
When marketing, sales, product, and support teams all work from the same definition of an ideal customer, decisions become easier. Messaging stays consistent. Sales qualification improves. Product roadmaps reflect real customer needs.
Instead of debating opinions, teams refer back to shared insights.
And the impact isn’t just theoretical. Businesses that invest in data-driven profiling and segmentation consistently see stronger returns. Industry research shows that companies using data-driven strategies often achieve 5 to 8 times higher ROI, with some reporting up to a 20% uplift in sales.
The common thread is clarity. When everyone knows who the customer is, growth stops feeling chaotic and starts feeling intentional.
Next, we’ll break down the core elements of building a strong customer profile and which information actually matters.
Key elements of a customer profile
Once you understand why customer profiling matters, the next question is practical: what actually goes into a good customer profile?
A strong profile isn’t a list of CRM fields. It’s a set of signals that help your team decide who to target, how to communicate, and where to focus effort.
Think of these elements as inputs. Individually, they add context. Together, they explain customer behavior.
1. Demographic data
Demographics form the baseline of a customer profile. They help create broad, sensible segments and quickly rule out poor-fit audiences.
This typically includes:
- Age
- Gender
- Income range
- Education level
- Location
Demographics don’t explain buying decisions on their own, but they prevent obvious mismatches early. If most customers cluster around a specific region or company size, that insight immediately sharpens targeting and qualification.
In a SaaS context, this typically appears as firmographic data. For example, knowing that your strongest customers are B2B SaaS companies with 100–500 employees, based in North America, and led by in-house marketing teams, helps sales prioritize better-fit accounts and marketing tailor messaging to that stage of growth.
2. Psychographic insights
Psychographics add meaning to the profile.
This layer captures attitudes, values, motivations, and priorities, the factors that influence why someone buys, not just who they are.
Common inputs include:
- Professional interests and priorities
- Lifestyle or workstyle preferences
- Core values and beliefs
- Decision-making style
This is where messaging starts to feel natural. When you understand what your audience values, speed, predictability, efficiency, or long-term ROI, your positioning aligns more intuitively with what matters to them.
3. Behavioral patterns
Behavioral data shows how customers actually interact with your brand over time.
This is often the most revealing part of a customer profile because it’s based on actions rather than assumptions.
Key behavioral signals include:
- Purchase or renewal frequency
- Product usage habits
- Engagement with content or campaigns
- Loyalty indicators
In a SaaS setup, this might include how often users log in, which features they use each week, whether they invite teammates, and how they respond to in-app prompts and lifecycle emails. Accounts that activate key features early and show consistent usage patterns are far more likely to convert, renew, and expand.
Behavior shows what customers do when no one is guiding them.
4. Geographic and technographic data
Depending on your business model, these dimensions add important context.
Geographic data covers where customers are located, city, region, country, or market type, and often influences pricing sensitivity, messaging tone, and compliance needs.
Technographic data focuses on the tools and platforms customers already use. In B2B, this matters because integrations, workflows, and existing systems often shape buying decisions.
If your product integrates with specific software, knowing whether your audience already uses those tools can shape targeting, partnerships, and sales conversations.
5. Bringing it together
A complete customer profile combines these inputs into a clear, usable picture of your audience.
When done well, it helps every team answer the same question consistently:
Does this customer fit who we’re trying to serve?
That clarity is what turns raw data into strategy and allows customer profiling to drive real outcomes.
Types of customer profiling & segmentation models
Once you have the right inputs, the next step is deciding how to group customers in ways that support real decisions.
This is where segmentation comes in.
Segmentation doesn’t add new data. It organizes existing customer profile elements into patterns that help teams act. Different models answer different questions, which is why there’s no single “best” approach.
Below are the most common customer profiling and segmentation models, and when each one is useful.
1. Demographic segmentation
Customers are grouped by shared demographic or firmographic traits such as age, income, company size, or industry.
This model works well for broad targeting, market sizing, and early-stage filtering before applying more nuanced segmentation layers.
2. Psychographic segmentation
Groups customers based on shared values, motivations, and priorities.
This approach is particularly useful for positioning and messaging. Brands with strong narratives often rely on psychographic segmentation to communicate relevance more clearly.
3. Behavioral segmentation
Here, customers are grouped based on actions and engagement patterns.
This model is especially powerful for SaaS, subscription, and e-commerce businesses where behavior changes over time. It’s commonly used for lifecycle marketing, retention, and expansion strategies.
4. Geographic segmentation
They’re grouped by location or market.
Geography often influences pricing expectations, regulatory needs, seasonality, and preferred channels, making this model valuable for regional GTM strategies.
5. Value-based (RFM) segmentation
Grouping is done based on business value using:
- Recency: How recently they purchased
- Frequency: How often they buy
- Monetary value: How much they spend
RFM segmentation is commonly used to identify high-value customers, prioritize retention efforts, and design loyalty or upsell programs.
Here’s a quick comparison to visualize how these segmentation approaches show up in SaaS:
Using a mix of these models provides a more comprehensive view of your audience. A SaaS company, for instance, might combine demographic data with behavioral signals to create customer profiles that guide both product design and personalized offers.
How these models work together
In practice, most strong customer profiles use a combination of these models.
For example, a retail brand might use demographic data to define its core audience, behavioral data to identify loyal customers, and value-based segmentation to prioritize retention efforts.
The goal isn’t to over-segment. It’s to create meaningful groups that help your team make better decisions without adding unnecessary complexity.
Next, we’ll walk through a step-by-step process for building a customer profile from scratch, using these models in a practical manner.
Step-by-step: How to create a customer profile
Building a customer profile doesn’t require complex models or perfect data. What it does require is a structured approach and a willingness to refine as you learn more.
Here’s a step-by-step way to create a customer profile that your team can actually use.
Step 1: Gather existing data
Start with what you already have.
Your CRM, website analytics, email campaigns, product usage data, and purchase history all hold valuable information. Even support tickets and sales call notes can reveal patterns around pain points and decision-making.
At this stage, the goal isn’t depth. It’s visibility. You’re collecting inputs that will form the foundation of your profile.
Step 2: Clean and organize the data
Data quality matters more than data volume.
Before analyzing anything, remove duplicates, fix inconsistencies, and standardize fields. Outdated or messy data can easily distort insights and lead to incorrect conclusions.
This step feels operational, but it’s one of the most important. Clean inputs lead to clearer profiles.
Step 3: Identify patterns and clusters
Once your data is organized, look for common traits among your best customers.
Do high-retention customers share similar behaviors? Are there clear differences between one-time buyers and repeat buyers? Are certain segments more responsive to specific campaigns?
This is where customer profiling and segmentation really begin. Patterns start to emerge when you look at customers as groups rather than individuals.
Step 4: Enrich with external data
Your internal data rarely tells the whole story.
Market research, public reports, and third-party data sources can help fill in gaps. External enrichment is especially useful for adding context such as industry trends, company growth signals, or emerging customer needs.
The goal here is accuracy, not excess. Add only what improves understanding.
Step 5: Build the profile
Now bring everything together into a structured customer profile.
Keep it clear and practical. A good profile should help your team quickly assess whether a new prospect or customer fits the type of audience you want to serve.
At a minimum, it should answer:
- Who is this customer?
- What do they care about?
- How do they behave?
- Why are they a good fit?
Step 6: Validate and refine regularly
A customer profile is never finished.
Test your assumptions against real outcomes. Talk to customers. Get feedback from sales and support teams. Update profiles as behaviors and markets change.
The strongest profiles evolve alongside your business, staying relevant as your audience grows and shifts.
Once your profile is in place, it becomes a shared reference point for marketing, sales, and product decisions.
Next, we’ll look at the research and analysis methods that help make customer profiles more accurate and actionable.
Here’s a quick example of how a B2B customer profile might look once it’s complete:
That’s the power of a well-structured customer profile: it gives your team a shared reference point that informs every decision, from messaging and targeting to product development.
For a more detailed walkthrough of building an ICP from scratch, see this step-by-step guide to creating an ideal customer profile.
Customer profile analysis & research methods
Creating a customer profile is one part of the process. Making sure it reflects reality is another. That’s where customer profile analysis and research come in.
This stage is about validating assumptions and uncovering insights you can’t get from surface-level data alone. The goal is simple: understand not just who your customers are, but why they behave the way they do.
Here are the most effective methods businesses use to research and analyze customer profiles.
1. Surveys and questionnaires
Surveys are one of the easiest ways to gather direct input from customers.
The key is asking questions that go beyond basic demographics. Instead of focusing only on age or role, include questions that reveal motivations, preferences, and challenges.
For example, asking what prompted someone to try your product often reveals more than asking how they found you.
2. Customer interviews
Speaking directly with customers adds depth that numbers alone can’t provide.
Even a small number of interviews can surface recurring themes around decision-making, objections, and expectations. These conversations often uncover insights that don’t show up in analytics dashboards.
They’re especially useful for understanding why customers choose you over alternatives.
3. Analytics and behavioral tracking
Behavioral data helps you see how customers interact with your brand in real time.
Website analytics, CRM activity, product usage data, and email engagement all reveal patterns worth paying attention to. For instance, if customers consistently drop off at the same point in a funnel, that behavior is a signal, not an accident.
This kind of analysis helps refine segmentation and identify opportunities for improvement.
📑Also read: Which channels are driving your form submissions?
4. Focus groups
Focus groups allow you to observe how customers discuss your product, compare options, and make decisions.
While more time-intensive, they can be valuable for testing new ideas, understanding perception, and exploring how different segments respond to messaging or features.
Focus groups are particularly useful during major product launches or repositioning efforts.
5. Third-party data enrichment
Third-party tools can strengthen your profiles by filling in gaps you can’t cover with first-party data alone.
Demographic, firmographic, and behavioral enrichment help create a more complete picture of your audience. These inputs are especially helpful in B2B environments where buying signals are spread across multiple systems.
Once you’ve collected this information, analysis becomes the focus.
Segmentation tools, clustering techniques, and visualization platforms help group customers based on shared traits and behaviors. These tools make patterns easier to spot and insights easier to act on.
Strong customer profiling isn’t about collecting more data. It’s about asking better questions and using the right mix of qualitative and quantitative inputs.
Next, we’ll look at how customer profiling works in retail specifically, with examples of common consumer profiles and use cases.
Although more resource-intensive, focus groups allow for deeper qualitative insights. Observing how people discuss your product, their decision-making process, and how they compare you to competitors can shape your customer profiling and segmentation strategy.
Customer profiling tools & software: What to use and why
Customer profiling can be done manually when your customer base is small. But as your data grows, spreadsheets and intuition stop scaling. That’s when tools become essential.
Customer profiling tools help collect data, keep profiles updated, and surface patterns that are hard to spot manually. They don’t replace strategy, but they make execution faster and more reliable.
What to look for in customer profiling tools
Before choosing any tool, it helps to know what actually matters.
- Data integration: The ability to pull information from multiple sources, such as CRMs, analytics platforms, email tools, and ad systems.
- Real-time updates: Customer profiles should evolve as behavior changes, not stay frozen in time.
- Segmentation capabilities: Automated grouping based on defined rules or patterns saves significant manual effort.
- Analytics and reporting: Clear dashboards that highlight trends, not just raw numbers.
The best tools make insights easier to act on, not harder to interpret.
Common types of customer profiling software
Different tools serve different parts of the profiling process. Most teams use a combination rather than relying on a single platform.
Each of these plays a role in turning raw data into usable profiles.
Quick check
Even the best tools won’t build meaningful customer profiles on their own.
They help automate data collection and analysis, but human judgment is still needed to interpret insights and decide how to act. Without clarity on who you’re trying to serve, tools simply make you faster at analyzing the wrong audience.
When paired with a clear strategy, though, customer profiling tools can transform how teams approach targeting, personalization, and growth.
Next, we’ll look at how to use customer profiles in practice for targeting and personalization across marketing and sales.
📑Also Read: Guide on ICP marketing
Using customer profiles for targeting & personalization
A customer profile on its own doesn’t create impact. The value comes from how you use it.
Once profiles are in place, they should guide decisions across marketing, sales, and customer experience. When applied well, they make every interaction feel more relevant and intentional.
Here’s how teams typically put customer profiles to work.
1. Sharpening marketing campaigns
Customer profiles allow you to move beyond broad messaging.
Instead of running one campaign for everyone, you can segment audiences and tailor campaigns to specific needs. High-value repeat customers might see early access or premium messaging, while price-sensitive segments receive offers aligned with what motivates them.
This approach improves engagement because people feel like the message speaks to them, not at them.
2. Personalizing product recommendations
Profiles help predict what customers are likely to want next.
Subscription businesses use it to highlight features based on usage patterns. The more accurate the profile, the more natural these recommendations feel.
Personalization works best when it feels helpful, not forced.
3. Improving email and content strategy
Customer profiling makes segmentation more meaningful.
Instead of sending the same email to your entire list, you can personalize subject lines, content, and timing based on customer behavior and preferences. This often leads to higher open rates, stronger engagement, and fewer unsubscribes.
When content aligns with what a segment actually cares about, performance improves without extra volume.
4. Enhancing sales conversations
Sales teams benefit enormously from clear customer profiles.
When a prospect closely matches your ideal customer profile, sales can tailor conversations around the right pain points from the first interaction. Qualification becomes faster, follow-ups feel more relevant, and conversations shift from selling to problem-solving.
This shortens sales cycles and improves win rates.
5. Creating cross-sell and upsell opportunities
Understanding what different customer segments value makes it easier to introduce additional products or upgrades.
Profiles help identify when a customer is ready for a premium offering or complementary service. Instead of pushing offers randomly, teams can time them based on behavior and engagement signals.
Used thoughtfully, customer profiles turn one-time buyers into long-term customers.
When profiles guide targeting and personalization, marketing becomes more efficient, sales become more focused, and the overall customer experience feels cohesive.
Next, we’ll look at common mistakes teams make when building customer profiles and the best practices that help avoid them.
Common mistakes & best practices in customer profiling
Customer profiling is powerful, but only when it’s done thoughtfully. Many teams invest time and tools into profiling, yet still don’t see results (thanks to a few avoidable mistakes).
Let’s look at what commonly goes wrong and how to fix it.
Common mistakes to watch out for
- Static profiles:
Customer behavior changes. Markets shift. Products evolve. Profiles that aren’t updated regularly become outdated quickly. When teams rely on static profiles, decisions are based on who the customer used to be, not who they are now. - Poor data quality:
Incomplete, duplicated, or inaccurate data leads to misleading profiles. A smaller set of clean, reliable insights is far more valuable than a large volume of noisy data. Bad inputs almost always result in bad decisions. - Over-segmentation:
It’s tempting to keep slicing audiences into smaller and smaller groups. But too many micro-segments make campaigns harder to manage and dilute focus. Segmentation should simplify decisions, not complicate them. - Ignoring privacy and compliance:
Collecting customer data without respecting regulations like GDPR or CCPA can damage trust and create legal risk. Profiling should always be transparent, ethical, and compliant. - Relying on assumptions:
Profiles built on gut feel or internal opinions rarely hold up in reality. Without proper customer profile research, teams risk designing strategies for an audience that doesn’t actually exist.
Best practices to follow
- Update profiles regularly:
Review and refresh customer profiles every few months. Even small adjustments based on recent behavior can keep profiles relevant and useful. - Maintain clean data:
Put processes in place to validate, clean, and standardize data continuously. Good profiling depends on good hygiene. - Align across teams:
Marketing, sales, product, and support should all work from the same customer profiles. Shared definitions reduce friction and improve execution across the board. - Focus on actionability:
A strong customer profile directly informs decisions. If a profile doesn’t change how you target, message, or prioritize, it needs refinement. - Treat profiling as an ongoing process:
Customer profiling isn’t a one-time project. It’s a cycle of learning, testing, and refining as your business and audience evolve.
A helpful way to think about profiling is like maintaining a garden. Without regular attention, things grow in the wrong direction. With consistent care, small adjustments compound into stronger results over time.
Next, we’ll look at where customer profiling is heading and how emerging trends are shaping the future of how businesses understand their customers.
Future trends: Where customer profiling is heading
Customer profiling has always been about understanding buyers. What’s changing is how quickly and how accurately that understanding updates.
Over the next few years, three shifts are likely to redefine how businesses build and use customer profiles.
1. Real-time, continuously updated profiles
Static profiles updated once or twice a year are becoming less useful.
Modern platforms are moving toward profiles that update in real time as customer behavior changes. Website visits, product usage, content engagement, and intent signals are increasingly reflected immediately rather than weeks later.
This shift means teams won’t just know who their customers are, but where they are in their journey right now. That context makes targeting and personalization far more effective.
2. Predictive segmentation
Profiling is moving from reactive to predictive.
Instead of waiting for customers to act, predictive models analyze patterns to anticipate what they are likely to do next. This helps teams prioritize outreach, tailor messaging, and design experiences before a customer explicitly signals intent.
For example, identifying which segments are most likely to upgrade, churn, or re-engage enables businesses to act earlier and more effectively.
For an in-depth look at how account scoring and predictive segmentation work in practice, check out our blog on predictive account scoring.
3. Unified customer journeys
One of the biggest challenges today is fragmentation.
Customer signals live across CRMs, analytics tools, ad platforms, product data, and support systems. When these signals aren’t connected, teams only see pieces of the customer journey.
The future of customer profiling lies in unifying these signals into a single view. When behavior, intent, and engagement data come together, profiles become clearer and more actionable.
This is also where platforms like Factors.ai are evolving the space. By connecting signals across systems and layering intelligence on top, teams can move beyond identifying high-intent accounts to understand the full buyer journey, including the next action to take.
Looking ahead, customer profiling will still start with data. But its real value will come from context.
Understanding what customers care about right now and meeting them there is what will set high-performing teams apart. Businesses that adopt this mindset will see more relevant engagement, more efficient growth, and customer experiences that feel genuinely personal.
Why customer profiling is a long-term growth advantage
Customer profiling sits at the center of how modern businesses grow.
When you understand who your customers are, how they behave, and what they care about, decisions stop feeling reactive. Marketing becomes more focused. Sales conversations become more relevant. Product choices become more intentional.
What’s important to remember is that customer profiling isn’t a one-time exercise. Audiences evolve, markets shift, and priorities change. The most effective teams treat profiles as living references that adapt alongside the business.
Data and tools play a critical role, but profiling is ultimately about people. It’s about using insights to create experiences that feel thoughtful rather than generic. When customers feel understood, trust builds naturally, and long-term relationships follow.
The businesses that succeed over time are the ones that stay curious about their audience. They keep listening, keep refining, and keep adjusting how they engage. With that mindset, customer profiling stops being a task on a checklist and becomes a strategic advantage that compounds with every interaction.
FAQs for Customer Profile
Q. What is a consumer profile vs a customer profile?
A consumer profile typically refers to an individual buyer, while a customer profile can describe either individuals or businesses, depending on the context. The difference is mostly in usage: B2C companies talk about consumers, while B2B companies usually refer to customers. Both serve the same purpose: understanding who your ideal buyers are.
Q. How often should I update customer profiles?
At least once or twice a year, but ideally every quarter. Buyer behavior changes quickly as new tools, shifting priorities, or economic factors can all reshape how people make decisions. Frequent updates ensure your profiles stay accurate and useful.
Q. What size business can benefit from customer profiling?
Every size. Startups use profiling to find their first set of loyal customers. Growing businesses use it to scale marketing efficiently. Enterprises use it to personalize campaigns and refine segmentation. The approach changes, but the value remains consistent.
Q. Which customer profiling tools are best for beginners?
Start with your CRM. Platforms like HubSpot and Pipedrive already offer built-in profiling and segmentation tools. If you need deeper insights, add data enrichment tools like Clearbit or analytics platforms like Mixpanel. As you grow, more advanced solutions can automate clustering, analyze buyer journeys, and support predictive segmentation.
Q. Is retail customer profiling different from B2B profiling?
Yes. Retail profiling often focuses on individual purchase behavior, foot-traffic data, and omnichannel activity. B2B profiling, on the other hand, emphasizes firmographics, buying committees, and intent signals. Both rely on data, but the types of signals and how they’re used vary by model.
%2520(1).avif)
Understanding Customer Churn Prediction in 2026
Discover how you can reduce churn rate by employing a customer churn prediction strategy in 2026
Imagine working hard for months to close the deal with a prospect, only for them to churn in less than a year. There could be several reasons, such as:
- Poor customer service
- Choosing a competitor's solution
- Users not achieving their KPIs
Reducing customer churn is vital for businesses because it ensures customer satisfaction and boosts profitability. The best way to avoid high churn rates is to predetermine the customers at a churn risk.
In this article, we'll detail how customer churn prediction is the key to reducing churn and keeping the cash flowing in 💸
What is Customer Churn Prediction?
Customer churn prediction involves analyzing data to detect customers likely to cancel subscriptions. SaaS businesses use this analysis to identify at-risk customers, leading to cost savings and improved customer lifetime value.
Analyzing churn through data-driven insights can help your business understand patterns and provide a roadmap for improvement. For example, if your surveys reveal that your platform has a complicated onboarding process – you can direct users to your onboarding specialist to assist them.

Why is Customer Churn Prediction important?
Losing customers is always costly. However, the costs involved go beyond the revenue lost from the customers who leave. It also includes the marketing expenses required to find new customers to replace the old ones. In many cases, the amount spent on acquiring a new customer is not covered by the amount paid during their time with the company. This means that customer acquisition is usually more expensive than customer retention.
Plus, unhappy customers share their experiences with others, impacting the company's reputation and customer acquisition budget. Businesses must predict churn and take action beforehand to prevent customers from leaving.
Once you know a customer is going to churn, you can take actions such as:
- Providing more targeted re-engagement campaigns
- Launching incentives such as loyalty programs that encourage them to stay
- Creating educational material that is tailored toward their specific needs
- Ensuring accessible and improved customer support
How to Build a Customer Churn Prediction Model
Creating a churn prediction model can help businesses retain customers and sustain growth. Using data analytics and machine learning, companies can identify which customers are likely to leave and take action to prevent it.
Here are the key steps to develop an effective churn prediction model ⬇️
- Data collection and review
Ensure that the data is accurate by handling missing values, removing duplicates, and converting it into a suitable format for analysis. Before moving on to calculations, reviewing the data for accuracy and validity is crucial. Every piece of customer info is valuable in the upcoming churn calculations, so it's worth ensuring accuracy.
- Model selection
Select an appropriate machine learning algorithm for churn prediction, such as logistic regression, decision trees, random forests, or gradient boosting machines. Split the data into training and testing sets, train the model, and tune hyperparameters to optimize performance. Evaluate the model using testing data and cross-validation. Deploy the model into production to make real-time predictions and prevent churn.
- Use an automated predictive model
Do people with lower NPS scores tend to leave more? Are they evaluating competitor solutions? You can predict who might leave by spotting these signs in the data. You must use machine learning with a dataset containing all the information you have about customers who stayed and those who left. The algorithm learns from this historical data to understand how different factors relate to churn. Then, it can predict if future customers with similar behaviors might leave or stay.
💡Factors can help you identify customers evaluating competitor solutions by helping you track when they visit their G2 pages.
- Establish retention strategy
Optimize your retention strategy by prioritizing actions based on the probability of customer churn. When customers first sign up, use checklists and personalized help to ensure they understand and use the product. As they keep using it, watch out for signs they might leave. For instance, if they're not using a feature they need, you can send them helpful tips to get them back on track.
- Track results regularly
Continuously monitor the churn prediction model's performance and update it with new data periodically to ensure it remains effective as customer behavior evolves. Before introducing any further changes to your plan, collect enough data to measure the real impact of your efforts.
Your churn model will provide probabilities for various customer segments. It's essential to keep testing new strategies and recording the impact on these segments. While creating a mathematical model of churn requires time and resources from your team, each test can help you create a better model for the future.
6 Customer churn prediction best practices
Now that you know how to build a churn prediction model, here are a few handy tips you must remember to prevent customer churn:
1. Segment Customers
After obtaining your data, it's time to shift your focus towards the users and begin segmenting them. Since users have distinct needs and usage patterns, they don't churn for the same reason. Hence, it's essential to categorize them into separate segments. You can segment them based on their:
- Demographics, such as location, region, company size, and the year they signed up for your company.
- Behavior and usage, such as how often they log in, whether they use a particular feature more or less, or whether they have completed the onboarding process.
- Contract terms include pricing plans and whether customers signed up for a monthly, quarterly, or yearly deal.
You can design retention strategies and marketing campaigns tailored to specific customer segments by segmenting customers based on their churn likelihood and characteristics. Domain knowledge or clustering techniques can help you define meaningful segments.
2. Monitor product usage data of existing customers
Product usage data captures how and when customers use your software. Important data points include feature usage, customer behavior, clicks, and other metrics such as time-to-value and product stickiness.
To build an effective model, it's important to consider some key product usage data points such as:
- Monitor feature usage data to show users' engagement with your product's features, indicating popularity and relevance.
- Observe users’ actions within your product, like when they use it, how long they use it, which features they engage with, and how they progress through it.
- Track the number of times a user clicks or interacts with a UI element, such as a button, checkbox, text area, or menu.
- Track other product usage data such as time-to-value, product stickiness, interactions, and more.
3. Keep an eye on customer success metrics
Understanding your users' success with your product is crucial in determining if they will continue using it. Surveys such as NPS and CSAT can be used to measure customer success. An NPS score of less than 7 or 8 means you may need a win-back campaign or value incentive to change their attitude towards your product. NPS measures loyalty and willingness to recommend, while CSAT measures customer satisfaction. Conduct these surveys periodically to track customer success and satisfaction.
4. Gather customer feedback regularly
Apart from gathering feedback through conventional ways, you can use various other forms of customer feedback to gain insights into their experience with your product or service. For example, in-app surveys can provide you with contextual input from users. You can use them to find out about your customer's overall satisfaction with your product, their experience with a particular feature, any issues they may have faced, or even the features they would like you to add or implement. This can be very helpful in understanding the general sentiment of users and identifying areas of improvement or strengths.
To promptly address issues and demonstrate responsiveness to user input, incorporate real-time feedback loops within your product. Acknowledge the feedback received through in-app surveys and communicate any actions taken to address user concerns.
5. Enhance customer experience
You can streamline the customer experience using automated onboarding, self-service options, and personalized support. Furthermore, you should use customer feedback to identify areas of improvement and proactively address any customer dissatisfaction rather than reacting after the fact.
6. Improve customer service
Respond promptly to inquiries and complaints, offer helpful advice, and measure performance using metrics like support tickets, call center response times, and social media interactions. Monitor these metrics to gain insights into customer service trends and effectiveness.
Customer Churn Prediction: Key Steps & Benefits
Predicting customer churn helps businesses retain clients and reduce acquisition costs through data-driven strategies.
1. Key Steps in Churn Prediction: Data collection, feature selection, model selection (Logistic Regression, Decision Trees, Random Forests, Gradient Boosting), model training, and real-time monitoring.
2. Essential Features: Customer tenure, usage frequency, service interactions, and engagement metrics.
3. Strategic Benefits: Identify at-risk customers, implement targeted retention efforts, and enhance profitability.
Leveraging churn prediction models enables businesses to proactively improve customer retention and long-term growth.
Wrapping up
Reducing customer churn is crucial for businesses as it directly impacts long-term revenue, customer loyalty, and overall business stability. However, understanding why customers leave requires analyzing data and tracking various metrics over time. Effective churn analysis involves monitoring overall customer turnover rates and identifying factors contributing to attrition.
Businesses can use advanced analytics and machine learning techniques to identify potential churners and implement targeted retention strategies.
![Customer Acquisition Cost (CAC): Formula, Benchmarks & Tips [2026]](https://cdn.prod.website-files.com/6898fdb2a8e6d57199082db3/698c5819e1b2a78832ea254e_6502f2598c59c9ddcbd87d25_Customer%2520Acquisition%2520Cost%2520(CAC)%2520%2520Formula%252C%2520Benchmarks%2520%2526%2520More%2520(1).avif)
Customer Acquisition Cost (CAC): Formula, Benchmarks & Tips [2026]
CAC, or Customer Acquisition Cost is the value of Total Sales & Marketing Costs ÷ New Customers. Learn how to calculate CAC, get industry benchmarks, CLV:CAC ratios, and find 6 proven ways to reduce your CAC.
TL;DR
- Customer acquisition cost (CAC) is the total amount spent on sales and marketing to acquire a new customer.
- CAC Formula: CAC = (Total Sales + Marketing Costs) ÷ Number of New Customers Acquired.
- A good CLV:CAC ratio is at least 3:1 — meaning you earn $3 for every $1 spent acquiring a customer.
- SaaS CAC benchmarks: CAC ranges widely — from $50–$200 for self-serve PLG to $600–$1,200+ for mid-market B2B SaaS. Enterprise deals can exceed $5,000. Target a payback period of 12–18 months.
- To reduce CAC, focus on improving conversion rates, investing in content marketing, leveraging referrals, and optimizing channel-level spend.
Customer acquisition cost (CAC) is the total amount a business spends on sales and marketing to acquire one new paying customer. The standard formula is: CAC = (Total Sales + Marketing Costs) ÷ Number of New Customers Acquired.
CAC plays a critical role in determining the sustainability and scalability of SaaS businesses — it's the lens through which teams evaluate whether their go-to-market strategy is profitable.
This guide covers the CAC formula, real-world examples, industry benchmarks, the CLV:CAC ratio, and proven strategies to reduce your acquisition cost.
What is Customer Acquisition Cost (CAC) in SaaS?
Customer Acquisition Cost (CAC) is a business metric that measures the average total cost of acquiring one new paying customer, including all sales and marketing expenses over a given period.
The formula to calculate CAC is:
CAC = (Total Sales Costs + Total Marketing Costs) ÷ Number of New Customers Acquired
For example, if a company spends $50,000 on sales and marketing in a quarter and acquires 100 new customers, the CAC is $500.

Here, sales expenditures include employee salaries, sales tools and tech, and the like etc. Marketing expenditures include ad spend, content production costs, event expenses, etc.
Note that CAC excludes repeat customers. It only accounts for new customers, not new orders from existing accounts.
A lower CAC indicates that a company is acquiring customers more cost-effectively. This generally implies solid product-market fit and successful marketing and sales efforts. A higher CAC, however, suggests that the company might need to re-evaluate its GTM strategy.
CAC vs CPA: What's the Difference?
CAC and CPA are often used interchangeably, but they measure different things:
In short: every CAC includes CPAs, but not every CPA is a CAC. A CPA might measure the cost of getting a demo request ($50), while the CAC accounts for everything it takes to convert that demo into a paying customer ($500).
Why is Customer Acquisition Cost Important In SaaS?
Here are some ways CAC is a powerful barometer for profitability, product-market fit, and overall strategic direction.
1. Gauge Profitability
CAC helps SaaS companies assess the balance between acquisition costs and revenue generated. A low (or lowering) CAC-to-CLV ratio helps galvanize the brand by signaling efficient, sustainable growth.
2. Evaluate Product-market Fit
A high CAC often indicates misaligned PMF or inefficient GTM efforts. This signal can then prompt course-correcting adjustments. Say a company with a tiered pricing structure spends $1000 to acquire a new customer. However, 90% of its customers end up subscribing to the most basic plan, which is priced at only $150 per annum. At this rate, the company will need more than 6 years to recover the acquisition cost.
In this instance, it may help to re-evaluate the product offerings and customer requirements and make adjustments that make the company more profitable.
3. Optimize Resource Allocation
Insights from measuring CAC can help inform efficient resource allocation. By analyzing how each channel contributes to customer acquisition, teams can optimize marketing and sales budgets to maximize return on investment.
Say a company uses the following channels for customer acquisition:
In this case, although events bring in the maximum number of acquisitions, content marketing provides the lowest acquisition costs. Hence, the company may want to consider investing more in content marketing efforts going forward.
Should you view CAC in isolation?
You should not view CAC in isolation. SaaS businesses need to strike a balance between CAC, Customer Lifetime Value (CLV), and the CAC payback period.
You can justify a high CAC with a high CLV or a short payback period.
Say a company spends $5000 to acquire a new customer. If the lifetime value of this customer is $18,000, or it takes only about a month to recover the $5,000 through subscription or in-app purchases, the CAC is justified compared to a company that spends $100 to acquire a customer but has an average CLV of $50.
In other words, a company experiencing higher churn rates is bound to rely on low customer acquisition costs to become profitable.
Additionally, CAC also varies widely based on industry standards, such as:
- Purchase Frequency
- Purchase Value
- Customer Lifespan
- Company Maturity
- Length of Sales Cycle
- Research and development
How Customer Retention Impacts CAC
Retention and acquisition are two sides of the same coin. Here's how improving retention directly lowers your effective CAC:
- Higher CLV offsets higher CAC: When customers stay longer, they generate more revenue, making it easier to justify (and recover) higher acquisition costs.
- Referral flywheel: Satisfied, long-term customers are more likely to refer others — creating a low-cost acquisition channel.
- Reduced replacement pressure: High churn forces you to constantly acquire new customers just to maintain revenue. A 5% improvement in retention can reduce the number of new customers you need to acquire by 20–30%.
- Better unit economics: When retention improves, your CAC payback period shortens because you're not losing customers before they've paid back the acquisition cost.
Step-by-Step Guide to Calculating CAC for SaaS
Calculating CAC can be a nuanced task. Here is a step-by-step guide to help you through the process:
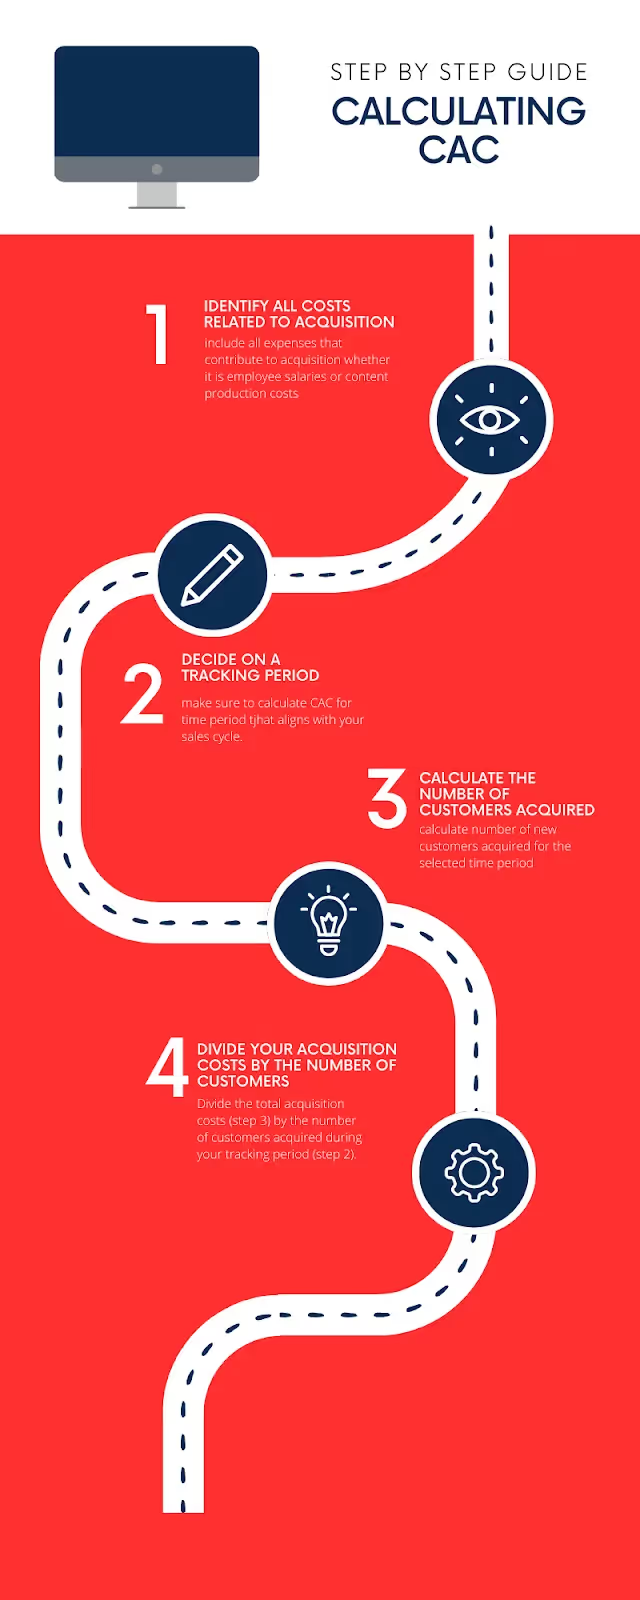
1. Identify all costs related to customer acquisition
Make sure only to include expenses that directly contribute to customer acquisition.
Advertising Expenses: This includes the total ad spend across search ads, paid social, sponsored events, etc.
Technological Investments: Technological costs include spend on marketing and sales technology that supports go-to-market initiatives. This consists of automation platforms, intelligence solutions, outreach tools, etc.
You should also consider infrastructure costs, such as those for data storage platforms like SingleStore, Google Cloud, Azure, etc. The CAC is relatively higher than the costs for other SaaS platforms.
Note: This category should not include software or technology that does not directly affect the sales funnel, such as your internal collaboration or task management tools, such as Slack, Asana, Notion, etc.
Employee Salaries: If you have a dedicated sales team working on outreach, their salaries should be considered when calculating CAC.
💡TIP: Most companies exclude the salaries of the entire marketing team when calculating CAC. This is not the right approach, as marketing costs can add up quickly. The right approach is to include the salaries of employees who come in direct contact with customers or directly impact sales. For example, a PPC or SEM expert should be factored into the calculations. Still, SEO experts or website developers who do not contact customers directly should not be included.
Content Marketing Costs
Content marketing costs encompass all expenses associated with creating new content assets across blogs, media, and more. For example, when producing a video, this includes the cost of purchasing equipment, setting up a studio, acquiring backdrops, obtaining editing software, and other related expenses. Remember: these costs should be considered even if you hire a third-party content producer.
Research and Development
PLG companies invest in R&D as part of their customer acquisition mix (free sidecar products, freemium, growth teams, self-service purchasing, etc.). Atlassian, for instance, spends $2.43 on R&D for every $1 on sales and marketing.
However, R&D investment is usually not factored into the CAC payback period calculation, blurring the picture of the growth model.
If you're investing in PLG, plan to stay below the "normal" CAC payback benchmarks.
2. Decide on a tracking period
The tracking period is the timeframe over which you'll calculate your CAC. It's essential to choose a period that aligns with your sales cycle. This could be monthly, quarterly, or annually for SaaS businesses, depending on how long it typically takes to convert a lead into a paying customer.
3. Calculate the number of customers acquired in your tracking period
Count the number of new customers you've acquired during the chosen tracking period. This should include all paying customers during that time frame.
Note: The more accurate way to analyze customer acquisition cost is to track the costs and acquisitions over the length of an industry's sales cycle. For example, if enterprise sales in the healthcare sector take about 10 months to close a deal and get a paying customer, then the CAC should be tracked for that period.
4. Divide your acquisition costs by the number of customers
Calculating CAC is straightforward: CAC = Total Acquisition Costs / Number of Customers Acquired. Plug in the numbers: Divide the total acquisition costs (step 3) by the number of customers acquired during the tracking period (step 2).
Here's an example to illustrate these steps:
Suppose a SaaS company spends $50,000 on marketing and sales efforts in a quarter. During the same quarter, they acquired 500 new customers.
CAC = $50,000 / 500 = $100 per customer.
Determine your total marketing and sales expenditure within a specific time frame. This time frame can be a month, quarter, year, or any other relevant period. Next, calculate the number of new customers acquired during that same time frame.
Utilize the customer acquisition cost formula to ascertain the average cost per customer. This will provide insight into your gross margin and how much you potentially earn per new customer.
New CAC vs Blended CAC
When calculating CAC, it's important to distinguish between two variations:
- New CAC measures only the cost of acquiring net-new customers — first-time buyers who have never purchased from you before. This is the standard CAC formula.
- Blended CAC includes the cost of acquiring both new customers and reactivating or converting returning leads. This gives a fuller picture of total acquisition spend but can mask how efficiently you're reaching new markets.
For most SaaS companies, New CAC is the more actionable metric — it tells you the true cost of growing your customer base. Blended CAC is useful for companies with significant reactivation or win-back campaigns.
Customer Acquisition Cost Examples
Let's walk through a few real-world CAC scenarios to illustrate how the formula works across different business types:
Example 1: B2B SaaS Company
A mid-market SaaS company spends $120,000 on marketing (content, paid ads, events) and $180,000 on sales (SDR/AE salaries, tools, outreach) in Q1. They close 60 new customers during the quarter.
CAC = ($120,000 + $180,000) ÷ 60 = $5,000 per customer
If their average contract value is $18,000/year with 3-year average retention, their CLV is $54,000 — giving a healthy CLV:CAC ratio of 10.8:1.
Example 2: E-commerce DTC Brand
An online skincare brand spends $25,000 on Instagram and Facebook ads and $5,000 on influencer partnerships in a month. They acquire 400 new customers.
CAC = ($25,000 + $5,000) ÷ 400 = $75 per customer
With an average order value of $45 and 2.5 average purchases per customer, their CLV is ~$112 — a CLV:CAC ratio of 1.5:1, suggesting they need to either reduce spend or increase repeat purchases.
Example 3: PLG SaaS Startup
A product-led growth company spends $15,000 on content marketing and SEO, and $10,000 on self-serve onboarding infrastructure monthly. They convert 200 free users to paid in that month.
CAC = ($15,000 + $10,000) ÷ 200 = $125 per customer
Note: PLG companies often have lower sales costs but higher R&D investment. If R&D is included, the effective CAC could be significantly higher.
CAC benchmark: "What's a good customer acquisition cost?"
There isn't a one-size-fits-all benchmark for CAC, as it can vary significantly depending on factors like your industry, target market, business model, and growth stage. That said, here are key benchmarks to use as reference:
General SaaS CAC ranges:
- Self-serve / PLG SaaS: $50 – $200 per customer
- SMB SaaS: $200 – $600 per customer
- Mid-market B2B SaaS: $600 – $1,200 per customer
- Enterprise SaaS: $1,200 – $5,000+ per customer
These ranges scale with deal complexity, sales cycle length, and the level of human touch required in the sales process.
CAC Payback Period
OpenView's report on SaaS Benchmarks shows CAC Payback periods based on company size or annual revenue, with a focus on different customer segments:

Source: SaaS benchmark report 2023 by Openview
As you can see, the payback period has gotten worse as companies grow in revenue. This holds especially true for companies that grow upward of $20M ARR. There could be 3 main mistakes here:
- Not focusing on Net Dollar Retention (NDR)
- Believing that sales and marketing are the sole costs of acquisition
- Looking at CAC payback on a revenue basis instead of a cash basis
Andrew Allsop, Senior Demand Gen Manager at Bryter put it best when he said that marketers must focus on new sources of acquisition instead of over-optimizing an existing channel:
"If you're able to acquire customers that fit within your financial model then do so until you can anymore, and then find other ways to do the same thing.
New sources of acquisition = greater growth potential than spending 100s of hours squeezing an extra few cents out of an existing channel."
CLV: CAC Ratio
The CLV: CAC ratio is a more reliable metric when at least 1-2 agreement renewal cycles have occurred to establish a more consistent churn rate across renewal periods. It helps gauge the return on investment regarding customer acquisition.
According to a report by Benchmarkit, over the last three years, the benchmark for the CLV: CAC ratio has varied between 2.1 and 6, regardless of the company's size, ARR, or any other revenue metrics.
The report implies that for every $1 spent on customer acquisition, the business should ideally generate revenue of $2.1 or $6.
NOTE: Both metrics should not be viewed in isolation. A company can have a high CLV: CAC ratio, but if the CAC payback period is much longer, say 24 months, the business does recover its initial cost of acquisition, but it takes them two years just to break even.
Average Customer Acquisition Cost by Industry
CAC varies significantly across industries. Here are typical ranges based on industry data:
Note: These ranges are directional estimates. Your actual CAC depends on deal size, sales cycle length, and go-to-market motion.
Challenges with calculating CAC
Calculating customer acquisition costs is simple in theory but can get complicated really quickly. There are several nuances to account for, and businesses typically face these challenges in calculating CAC:
1. Inconsistent tracking period
"Days to close" can significantly impact Customer Acquisition Cost (CAC). Typically, businesses opt to provide reports on a weekly and monthly basis. However, a challenge arises when attempting to make monthly reports, especially when the "days to close" metric stands at just 14 days. This situation implies that any new visitor acquired during the latter half of a month will only become a customer in the first half of the subsequent month.
In such a situation, you'll be incorporating the costs incurred in Month 1 and revenue generated in Month 2, which can throw you off track. The best way to tackle this situation is detailed user journey mapping. Tracking a customer's interactions from the very first touchpoint to the final is a great way to understand the sales cycle and determine the tracking period for CAC calculations.
2. Unreliable attribution
What campaigns and content actually contribute to conversions and pipeline? Without understanding the impact of marketing and sales touchpoints on bottom-line metrics, it's difficult to attribute CAC accurately.
The main challenge with revenue attribution is the nonlinear nature of customer journeys. When a visitor becomes a paying customer, it's rarely because of a single touchpoint. It's likely a result of many touchpoints: channels, campaigns, content, and people — working together to convince the buyer.
Without the right attribution tools, it's difficult to understand and appreciate how each channel contributes to revenue generation.
3. Fragmentary data and analytics
Another challenge when calculating CAC is siloed data across various sales and marketing channels. Manually monitoring KPIs and staying on top of channel-level performance is tedious and time-consuming. Again, without the right tools, the team's focus may be redirected towards operational tasks such as reporting and away from strategic decision-making.
4. Confusing CAC with CPL or CPA
A surprisingly common mistake is treating Cost Per Lead (CPL) as CAC. CPL only measures the cost of acquiring a lead — not the full cost of converting that lead into a paying customer. Your true CAC includes every touchpoint from first impression to closed deal, including sales salaries, tools, and nurturing costs.
5. Excluding salaries and overhead
Many teams calculate CAC using only ad spend and campaign costs, ignoring employee salaries, software subscriptions, and overhead. This results in an artificially low CAC that doesn't reflect reality. If your SDRs and AEs spend time converting leads, their compensation should be factored into the equation.
6. Not segmenting CAC by customer type
A single average CAC across all customer segments can be misleading. An enterprise customer that requires 6 months of sales engagement has a very different acquisition cost than an SMB customer that self-serves through a free trial. Segment your CAC by customer type, deal size, or channel to get actionable insights.
How to Reduce Customer Acquisition Cost
Lowering CAC is essential for sustainable growth. Here are proven strategies to bring down your acquisition costs:
1. Invest in Content Marketing and SEO
Content marketing consistently delivers one of the lowest CACs across channels. By creating high-value blog posts, guides, and videos that rank organically, you attract prospects without paying per click. Over time, this compounds — unlike paid ads, content continues generating leads long after it's published.
2. Improve Conversion Rates
You don't always need more traffic — you need better conversion rates. A/B test your landing pages, simplify sign-up flows, and optimize CTAs. Even a small improvement in conversion rate (say, from 2% to 3%) can reduce your CAC by 33% without increasing spend.
3. Leverage Referral Programs
Referred customers typically have a lower CAC and higher lifetime value. Build a referral program that incentivizes existing customers to bring in new ones. Dropbox famously reduced CAC by 60% through its referral program.
4. Optimize Channel-Level Spend
Not all channels deliver equal ROI. Break down CAC by channel (paid search, social ads, events, content, outbound) and reallocate budget from high-CAC channels to low-CAC ones. Use attribution tools to understand which channels actually drive conversions.
5. Shorten the Sales Cycle
The longer your sales cycle, the higher your CAC. Equip your sales team with better enablement materials, automate follow-ups, and use intent signals to prioritize high-fit prospects. Tools like Factors help identify accounts showing buying intent, so your team spends time on prospects most likely to convert.
6. Focus on Customer Retention
Retention indirectly reduces CAC. When customers stay longer, their lifetime value increases, improving your CLV:CAC ratio. Invest in onboarding, customer success, and product improvements to reduce churn — every retained customer is one fewer you need to acquire.
What Real Users Say About CAC
Beyond the formulas and benchmarks, here's what founders and operators actually experience with customer acquisition costs:
Early-stage startups often see wildly different CACs. On r/ycombinator, one founder reported a CAC of $46 with just 3 conversions — highlighting that early CAC numbers can be misleading with small sample sizes. The consensus: don't optimize CAC too early. Focus on finding product-market fit first.
Industry-specific CAC can be eye-opening. In the MSP (managed service provider) space, one operator shared that after 18 months, their average CAC was about $12,000 per customer — or roughly $900 per seat. This reinforces why benchmarking against your specific industry matters more than generic SaaS averages.
Blended vs. Channel CAC is a common challenge. Business owners on r/smallbusiness frequently struggle with calculating CAC when they use both physical and digital channels. The recommended approach: track Blended CAC (total spend ÷ total customers) alongside Channel CAC (channel spend ÷ channel customers) to understand which channels deliver the best ROI.
The biggest frustration? Lack of clear, industry-specific benchmarks — which is why we included the benchmarks table above.
Frequently Asked Questions About Customer Acquisition Cost
Q1. What is an example of a customer acquisition cost?
If a SaaS company spends $10,000 on Google Ads and $5,000 on sales salaries in a month, and acquires 30 new customers, the CAC is ($10,000 + $5,000) ÷ 30 = $500 per customer. Other examples include the cost of trade show booths, referral incentives, free trial infrastructure, and content production.
Q2. How is CPA different from CAC?
CPA (Cost Per Acquisition) typically refers to the cost of acquiring a conversion action — like a sign-up, download, or lead — and is often channel-specific. CAC (Customer Acquisition Cost) is broader: it measures the total cost of converting someone into a paying customer, including all sales and marketing expenses across the full funnel.
Q3. What is a good customer acquisition cost?
There's no universal "good" CAC — it depends on your industry, business model, and customer lifetime value. The key benchmark is the CLV:CAC ratio, which should ideally be 3:1 or higher. For SaaS companies, typical CAC ranges from $200 to $400, with CAC payback periods of 12–18 months.
Q4. Is CAC calculated monthly or yearly?
CAC can be calculated over any time period — monthly, quarterly, or annually. The best practice is to align your tracking period with your average sales cycle length. If your typical deal takes 3 months to close, quarterly CAC calculations will be most accurate.
Q5. Is customer acquisition cost a KPI?
Yes. CAC is one of the most important SaaS KPIs. It's tracked alongside metrics like CLV, churn rate, MRR, and CAC payback period to assess the efficiency and sustainability of your go-to-market strategy.
Q6. What is the 3:1 CLV to CAC ratio?
The 3:1 ratio means your average customer generates 3x the revenue compared to what you spent to acquire them. If your CAC is $500, your CLV should be at least $1,500. A ratio below 1:1 means you're losing money on every customer acquired.
Q7. What is a reasonable customer acquisition cost?
A "reasonable" CAC depends entirely on your industry, average deal size, and customer lifetime value. As a rule of thumb: your CLV should be at least 3x your CAC. For B2B SaaS, a CAC between $200 and $1,200 is typical. For e-commerce, $50–$150 is more common. The real test isn't the absolute number — it's whether your CAC payback period is under 12–18 months and your CLV:CAC ratio is 3:1 or higher.
Q8. What are common CAC mistakes?
The most common CAC mistakes include: (1) Only counting ad spend and ignoring salaries, tools, and overhead — which artificially deflates your CAC. (2) Treating Cost Per Lead (CPL) as CAC — CPL measures lead cost, not the full cost to close a paying customer. (3) Not segmenting CAC by channel or customer type — a single average hides which channels are efficient and which are burning cash. (4) Calculating CAC monthly when your sales cycle is 6+ months — this creates a timing mismatch between spend and conversions. (5) Viewing CAC in isolation without CLV or payback period context.
Q9. How do I figure out my customer acquisition cost?
To calculate your CAC: (1) Pick a time period (monthly, quarterly, or matching your sales cycle). (2) Add up all sales and marketing costs in that period — including ad spend, salaries, tools, content creation, and events. (3) Count the number of new paying customers acquired in that same period. (4) Divide total costs by new customers. For example, $50,000 in costs ÷ 100 new customers = $500 CAC. For more accurate results, align your tracking period with your average sales cycle length.
The Bottom Line on Customer Acquisition Cost
Customer acquisition cost (CAC) measures how much you spend to acquire each new paying customer. A healthy SaaS business targets a CLV:CAC ratio of at least 3:1, with a CAC payback period under 18 months. Typical B2B SaaS CAC ranges from $200 to $1,200 depending on deal size and sales cycle (source: Benchmarkit 2024 SaaS Benchmarks).
Here's what to remember:
- Don't view CAC in isolation. Always pair it with CLV, CAC payback period, and Net Dollar Retention for a complete picture.
- Segment your CAC by channel, customer type, and deal size to find actionable optimization opportunities.
- Focus on reducing CAC sustainably — through content marketing, referrals, better conversion rates, and retention — rather than just cutting spend.
- Benchmark against your industry, not generic averages. A $500 CAC is excellent for enterprise SaaS but unsustainable for a consumer app.
Looking to lower your CAC by identifying high-intent accounts before your competitors do? Factors helps B2B teams prioritize the right accounts using intent signals, so your sales and marketing spend goes further.

How GTM Engineering Improves CRM Data Hygiene and Reduces CAC
Learn how GTM Engineering improves CRM data hygiene, fixes HubSpot–Salesforce syncs, automates enrichment, and reduces CAC for modern B2B teams.

TL;DR
- Clean, unified data is the real driver of lower CAC because it powers accurate routing, scoring, and targeting.
- GTM Engineering fixes the root issues by standardizing fields, automating enrichment, and keeping HubSpot and Salesforce in sync.
- Automated intent, enrichment, and feedback loops help sales and marketing focus on real buyers instead of chasing insufficient data.
- Teams that build a structured GTM system outperform SDR-heavy models and turn their CRM into a true growth engine.
It’s Monday morning. You’re still feeling good about last week’s results. Pipeline looked healthy, routing behaved, and for a few sweet hours, it felt like the system finally got its life together.
Coffee in hand, you open Salesforce.
And that feeling fades fast.
The marketing team swears a campaign brought in 140 leads, but Salesforce says 92. HubSpot somehow assigned three different owners to the same account. A high-intent lead skipped enrichment, as if it were optional homework, and fell into the wrong bucket.
If you’ve been in RevOps or GTM services long enough, you know this exact punch in the gut. The day hasn’t even started, and the data is already giving attitude.
This is where CRM data hygiene for GTM becomes vital. Not just theoretical or “we’ll fix it later,” important. But, vital.
GTM data accuracy isn’t a low-key entry for the admin/IT staff. It’s the backbone of everything Go-to-Market teams do. Accuracy, completeness, freshness, structure, intent tagging, and account mapping. These little pieces decide how fast routing fires, how scoring works, who gets attention, and how much money you burn trying to hit your number.
What Happens When Your GTM Data Isn’t Clean and Consistent
GTM data does more heavy lifting than it gets credit for, because it decides what your team sees and how your system behaves. When a field is wrong, a workflow jumps too early. When data enrichment is missing, a strong account gets treated like a weak one. When HubSpot and Salesforce disagree on formatting, you get two versions of reality and a team stuck guessing which one to trust.
And the mess keeps growing because every new tool, channel, intent feed, and AI-generated activity adds its own fields and events - all of them just slightly different. A few tiny mismatches and suddenly handoffs slow down, prioritization slips, and CAC rises slowly (almost eerily) in the background.
That’s why CRM data hygiene matters. Clean, structured, enriched data gives your system a solid foundation so your team moves faster and your pipeline doesn’t absorb the hidden cost of messy data.
Why Poor CRM Data Hygiene Increases CAC for B2B Teams
You won’t see sudden jumps in CAC. Instead, it creeps in…
- When your CRM fills up with outdated data that doesn’t reflect buyers' behavior in real time.
- Old or incomplete data pushes your ads toward people who are least likely to convert, and you pay for every wasted click.
- Even small gaps can nudge CAC higher (as your targeting starts to drift) and lead to higher costs across your campaigns.
Your sales team feels the pressure, too. When a lead shows up without firmographics or incorrect contact details attached, your sales reps have no choice but to turn into part-time detectives.
Checking such minute details eats into sales productivity because reps spend more time fixing customer data than talking to real buyers. That’s why clean customer data becomes non-negotiable as your volume grows.
Let’s not forget about the sync issues. The HubSpot dashboard shows one thing, Salesforce shows another, and both are right from their POV. This disconnect is often caused by mismatched attribution and inefficient routing, and suddenly, your team is working with two different stories.
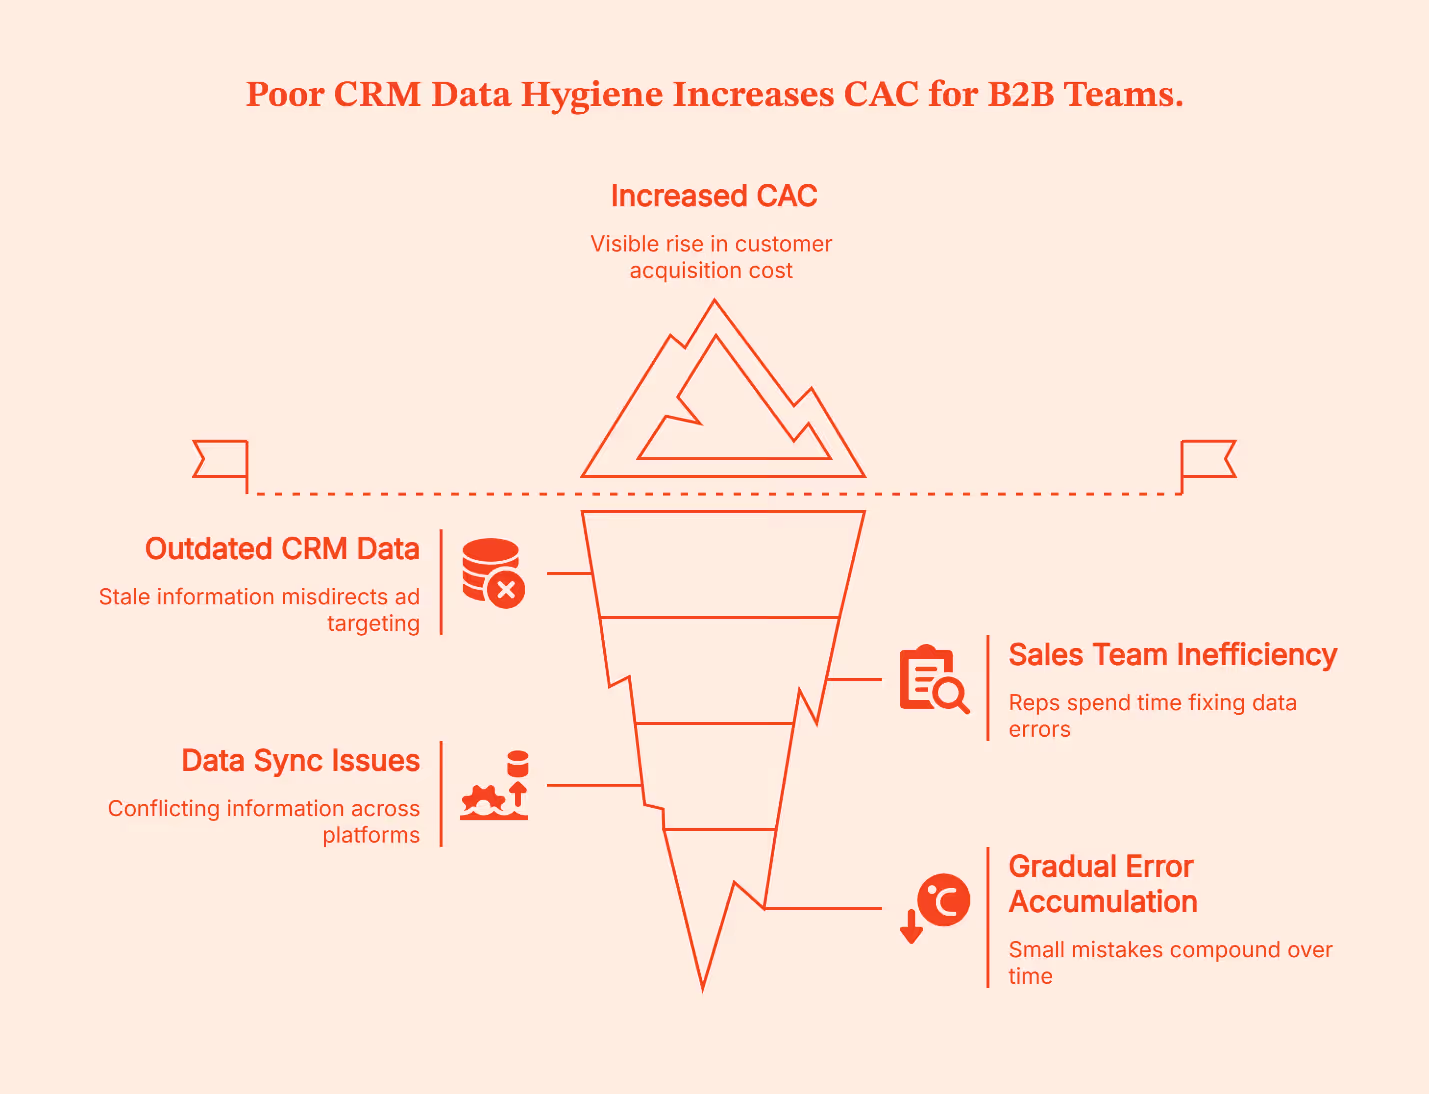
None of this happens overnight. It’s a slow climb powered by hundreds of tiny errors that compound every day.
GTM automation breaks this cycle. It designs workflows using clean, enriched, and validated data before it reaches routing or scoring, preventing errors from spreading. This way, your sales team gets better information, handoffs become smoother, and CAC stays steady.
How GTM Engineering Fixes HubSpot–Salesforce Sync Issues
Ever played Chinese whispers – the telephone game as a kid? Fixing data sync between HubSpot and Salesforce is pretty much the grown-up version. You start with a clear message. It goes through several steps. By the time it reaches the end, you’re looking at something that barely resembles the original.
These little distortions usually come from small, boring things:
- A field format that doesn’t match.
- A duplicate rule firing at the wrong time.
- A workflow sending an update to the other system, which refuses to read it.
While each issue is tiny, together, they make the sync feel unpredictable.
GTM Engineering steps in as the coordinator. It ensures both systems speak the same language by cleaning up field definitions, tightening object mappings, and removing legacy logic that creates loops or incorrect updates. AI checks catch insufficient customer data before it is synced.
But to get real consistency, both platforms need to rely on one shared record of what’s correct. That’s where Factors comes in. It gives both systems the same clean account-level details, so HubSpot and Salesforce finally stop contradicting each other.
💡 Check out how GTM engineering automates sales and marketing workflows in this guide
CRM Data Enrichment at Scale: A GTM Strategy for Revenue Teams
Data enrichment is the step that fills in the details your form never catches. Details like:
- Company size.
- Their tech stack.
- Intent signals.
- The buying stage.
These small details tell your team who the lead is and whether they’re worth chasing. They also enable personalized messaging because reps know who they’re talking to. Without these data fields, routing slows down and scoring becomes guesswork. And guessing is expensive.
Sure, your SDRS can do this manually. But manual data enrichment only works until the volume is low. The moment pipeline volume climbs, your setup falls behind. By the time someone updates a record, that record is already outdated.
GTM Engineering solves this with automation, rules, and API-based enrichment. The moment a new record enters the system, the gaps get filled, and data fields get standardized. This instant standardization improves data accuracy, which sharpens both routing and scoring.
In a growing setup, changes like this make a huge difference. Your CRM stops feeling like a messy shared notebook and starts acting like a dynamic Google Map that adjusts the route based on your position.
💡Learn how to build cleaner CRM workflows and reduce sync issues in this guide
Automating Data Hygiene With Go To Market Systems (and Where Factors Fits)
It’s impossible to manually monitor CRM updates to ensure data hygiene. There’s too much movement and not enough hands to manage it. An easier (and more efficient) way to do this is by automating data hygiene with GTM systems.
These systems design a setup where workflows, rules, AI agents, data enrichment layers, and AI-powered solutions fix issues before anyone even notices them. They also protect data integrity, so minor slips don’t escalate into larger routing or reporting issues. Once this system is in place, it gives your sales and marketing teams a clear, reliable view of who’s leaning in without the discrepancies. With accurate customer data, it becomes much easier to reduce CAC through GTM automation.
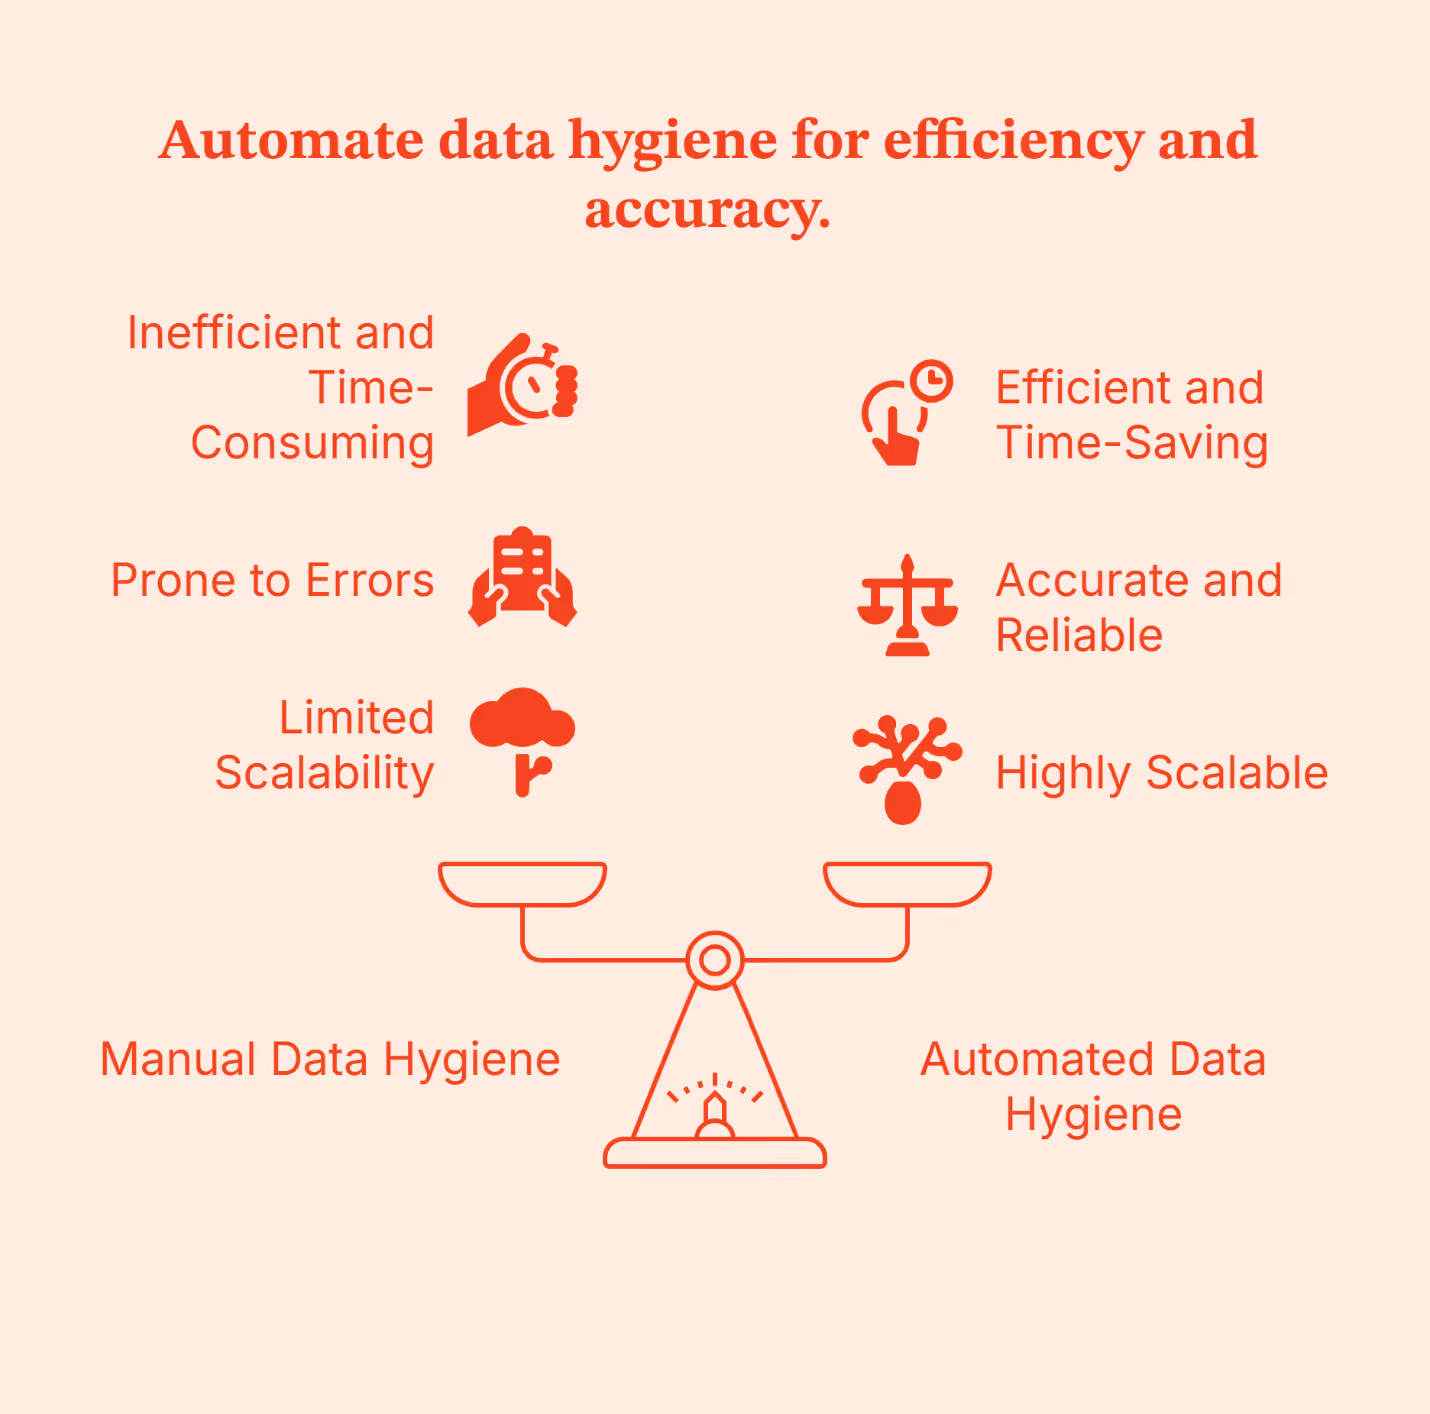
You can turn to Factors.ai to see this in action:
- Its company Intelligence keeps every account up to date with fresh firmographics and buying signals.
- LinkedIn CAPI sends clean, verified conversions back into your ad ecosystem, keeping targeting sharp.
- Attribution and Journey Mapping show what actually influenced a deal.
- Account-level scoring and intent recognition help your system understand who’s ready, who’s interested, and who needs more time.
All of these lead to fewer manual touchpoints, fewer messy records, and a clean CRM that gives you the most accurate view of your client journey. Factors.ai is your personal backstage crew, keeping things running while your team stays focused on revenue work.
Case Study: How Automated Enrichment Improves Sales Processes
All of this seems reasonable on paper (or in this case, a blog post). But if you are anything like me, you’d also be looking for actual proof (in real-world scenarios) about the effectiveness of automated GTM systems.
So, I headed to the Factors.ai customer stories to see whether GTM engineering truly helped reduce CAC through smarter automation. And I was not disappointed.
Rocketlane’s case study caught my attention immediately.
How to Connect Sales and Marketing Systems Into One GTM Motion
I believe if sales and marketing teams had to ask for one wish from a genie, it would be to work as one unit. And honestly, I can’t blame them. The systems meant to align them often pull them in different directions.
The good news is: you don’t need a genie (or magic) to bring the marketing and sales team on the same page. You just need to follow a set of practical steps to make this happen.
It starts with unifying signals. Website intent, ad clicks, form fills, demo views, pricing page visits, and CRM activity are all combined into a single profile. Instead of seeing random touchpoints, your system sees a timeline. This alone reduces leakage because high-intent accounts no longer get lost between tools.
GTM Engineering uses that timeline to trigger the real work:
- Unified routing means every account is assigned using the same rules, not one rule in HubSpot and another in Salesforce.
- Unified scoring means intent signals from your website and ads feed directly into the CRM, so scores update in real time.
- Unified reporting means the same definitions for leads, MQLs, meetings, and opportunities across every dashboard. That stops your teams from debating which numbers are “correct.”
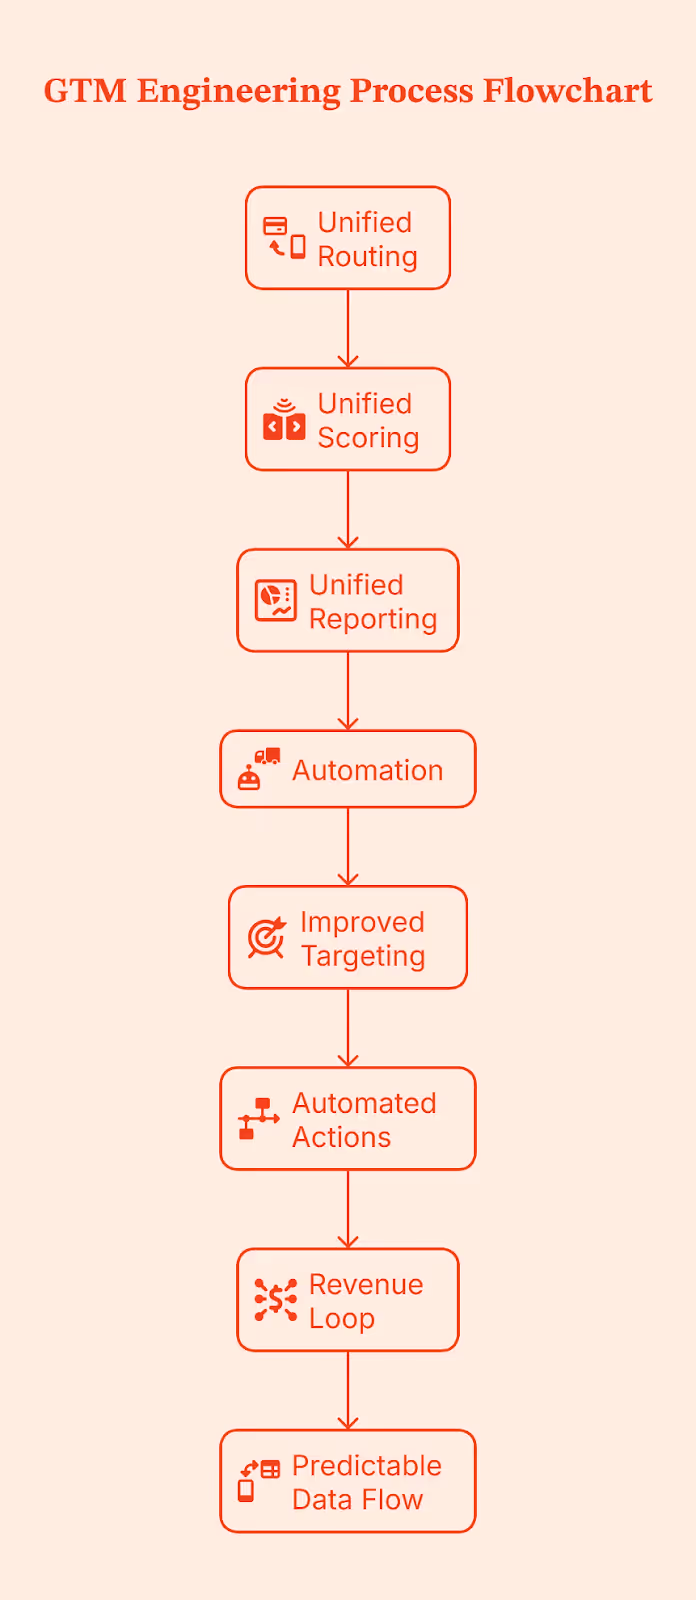
Then you add automation to close the loop. LinkedIn AdPilot and Google AdPilot push clean conversion data back into the CRM, so targeting improves on its own. When an account hits a scoring threshold, routing fires. When intent cools, nurture flows take over. The system becomes a revenue loop instead of a funnel that leaks at every stage.
With this unified setup, data flow between HubSpot and Salesforce becomes predictable rather than reactive.
The GTM Engineering Blueprint for Lower CAC
If you’ve made it this far, the pattern is already clear for you. If you want to lower your CAC, you will need a structured GTM system. GTM Engineering does this in a simple five-part blueprint:
- Data unification
All signals land in one place, so targeting stops drifting and spending stays focused.
- Automated enrichment
Missing firmographics and intent fields automatically fill in, resulting in cleaner routing and fewer wasted touches.
- Cross-platform sync governance
HubSpot and Salesforce follow the same rules, so your team no longer has to clean up mismatched fields and broken workflows. This alignment sets clear standards for how fields, owners, and lifecycle stages behave across both systems.
- Intent-layered routing and scoring
Accounts get routed and scored based on real behavior, helping reps reach high-intent buyers sooner, improving your win rate, and lowering cost per opportunity.
- Feedback loops back into the CRM
AdPilot and conversion signals feed back into your CRM, tightening targeting and keeping CAC from rising over time.
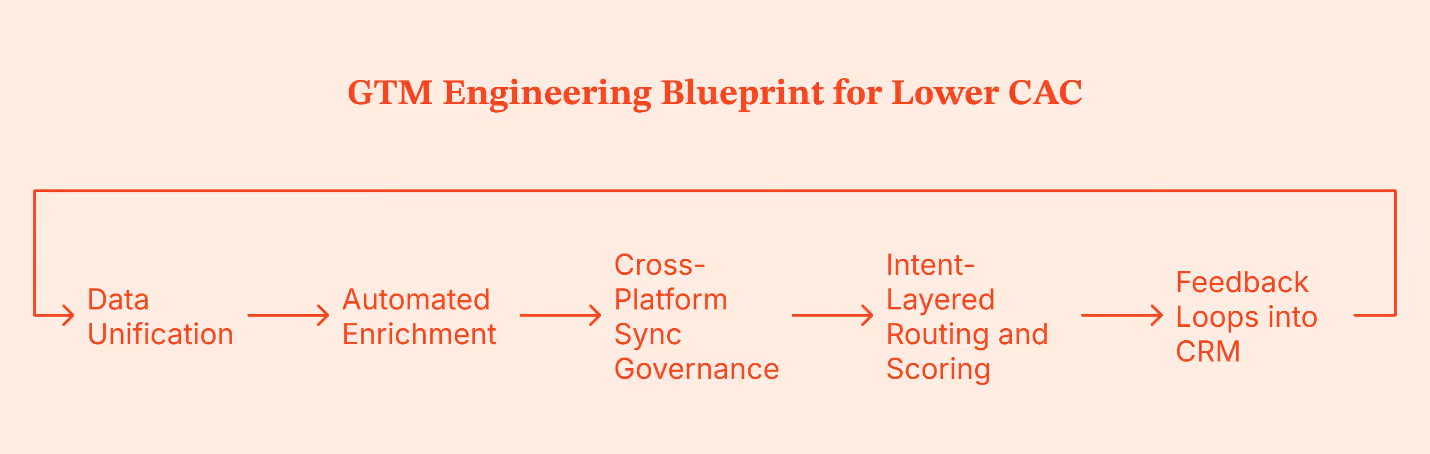
Metrics to Track: How to Measure Data Hygiene ROI
Now that you have your GTM system in place, the next step is to assess whether your data hygiene efforts are paying off. Pay attention to these details:
These signals indicate whether your GTM system is becoming cleaner, faster, and cheaper to run.
Final Recommendation: Why GTM Engineering Is a CAC Strategy
If there’s one takeaway from all of this, it’s this: CAC drops when your GTM system stops wasting resources. GTM Engineering does that by giving marketing and sales a shared layer of clean data, unified logic, and automated execution.
Teams that adopt this approach see fewer leads slipping through cracks and spend more time driving revenue instead of fixing avoidable issues because:
- Signals flow into one place.
- Routing speeds up because there's no mismatch in ownership rules.
- Scoring becomes predictable because it uses behavior and enrichment.
- Ad spend stops drifting because LinkedIn and Google push clean conversions back into the CRM.
Compare that to teams relying on people power. They compensate by adding more SDRs, manual data entry, checks, and handoffs, but they only mask the problem. Their data remains messy, routing remains slow, and CAC continues to climb.
GTM Engineering fixes these for you. If you want your CRM to feel dependable again, Factors.ai can help you set up the structure that makes it happen.
FAQs
Q. What is CRM data hygiene in GTM?
It refers to keeping CRM records accurate, enriched, unified, and actionable so GTM teams can route, target, and measure effectively.
Q. How does GTM Engineering improve CRM data quality?
Through automated enrichment, unified schemas, sync rules, AI-based routing, and system-to-system governance.
Q. What are the most common HubSpot↔Salesforce sync issues?
Most sync issues come from mismatched field formats, outdated object mappings, duplicate rules fighting each other, and workflows updating values that the other system can’t read.
Q. For data enrichment, what should I enrich and when should I do it?
Enrich firmographics, intent signals, titles, and tech stack the moment a record enters your system so routing, scoring, and targeting don’t rely on guesswork.
Q. How do I ‘fix data sync between HubSpot and Salesforce’?
You fix it by standardizing fields across both systems, cleaning up old logic, aligning lifecycle rules, and using automated checks that catch bad updates before they break the sync.
Q. Can better hygiene actually reduce CAC?
Yes. Clean, timely customer data keeps your targeting sharp, speeds up handoffs, and prevents wasted touches, all of which bring CAC down without increasing spend.

5 Mistakes To Avoid When Measuring Content Marketing ROI
It is difficult to get an ROI on your content marketing efforts. Here are some recommendations for analysing the effectiveness of your content marketing.
Did you know the content market industry is projected to reach an astounding $107 billion by 2026? With such high stakes, almost half of the marketers have planned to increase their content marketing budgets this year.
But here's the catch: while everyone wants to jump on the bandwagon, measuring content marketing ROI is where many marketers trip.
In this article, we'll discuss 5 of the most common mistakes marketers make when measuring content marketing ROI.
What is Content Marketing ROI?
Content marketing return on investment (ROI), is a metric that measures the revenue a business earns from its content marketing efforts compared to the cost of those efforts. It's a way to quantify the effectiveness of your content marketing strategy in terms of financial returns.
Calculating content marketing ROI might seem daunting, but it's quite straightforward. Here's a simple formula:

This formula gives you a percentage that represents your return on investment.
For example, if you spent $1000 on content marketing and earned $3000 in revenue, the profit is $2000. This means your ROI is 200%---you made $2 for every $1 spent.
Why is Measuring Content ROI Important?
Here are some of the major reasons why every marketer must measure the ROI from content marketing:
Streamline Budget and Resource Allocation
Content marketing is a broad field that includes various types of content—from blog posts and social media updates to podcasts and videos.
Each of these content types requires different resources and has a different impact on your audience. When you measure the ROI of each content type, you can understand which ones are delivering the best results and allocate higher budgets to that type of content.
Let's consider an example. Suppose you have a budget of $10,000 for content marketing. You decide to split it equally between blog posts and video content, spending $5000 on each.
A few months in, you find that:
- Your blog posts generated $10,000 in revenue, giving you an ROI of 100% (10,000 - 5,000) / 5,000 * 100
- Your videos generated $20,000 in revenue, giving you an ROI of 300% (20,000 - 5,000) / 5,000 * 100.
Along with revenue, your attribution model shows that while blog posts are often the first touchpoint, videos are the last touchpoint before a customer makes a purchase.
This data suggests this—blog posts are important for attracting customers and videos are more effective at converting them. As a result, you decide to allocate a higher budget to video production in the future.
This kind of data-driven decision-making can help you optimize your content marketing strategy and ensure that your resources are being used effectively.

Helps with Executive Buy-In
We've all heard of a CEO or CMO who redirected their marketing budget from organic to paid ads. Why does this happen? The answer—content marketing does not offer an immediate or direct conversion, unlike paid marketing.
However, a comprehensive tracking and analytics system like Factors makes attributing revenue and sales to content marketing easier. All the data is displayed in the form of a user timeline in chronological order. You see all the touchpoints all the way from the first one right up to the conversion, helping you set up attribution and get executive buy-in for increased budgets.

Can Reduce Churn
When tracking ROI, you tend to notice gaps within your existing content. This could be a lack of knowledge base, FAQs, video tutorials, or other content pieces.
If you notice that your customers interact and use your existing knowledge base a lot, you can double down on the content there to help them make the most out of your product or service.
As customers become more invested in your products through these efforts, sunk cost fallacy comes into play and your customers are less likely to switch.
Improve Collaboration Between Sales and Marketing
Measuring content ROI also requires collaboration between the sales and marketing teams. During sales calls, your sales team can identify which content a user viewed before booking the demo. They can then correlate the conversion rates with the type of content to identify what performs best.
For instance, if whitepapers or webinars are effective in moving leads further down the sales funnel, your marketing team can double down on these pieces. This can also help the sales team close more leads and bring in more revenue.
Mistakes to Avoid When Measuring Content Marketing ROI
When it comes to measuring the return on investment (ROI) of your content marketing efforts, there are several common mistakes that marketers often make. Avoiding these pitfalls can help you gain a more accurate understanding of your content's performance and its impact on your bottom line.
1. Not Understanding the True Cost of Content Production and Distribution
Most marketing teams do not track the true cost of content production and distribution.
This cost includes both
- direct costs: such as the cost of hiring writers or purchasing content
- indirect costs: such as the time spent by your team to manage, edit, and distribute the content.
According to a Forbes article, content is the gasoline that fuels the entire marketing engine. Just like gasoline, there are different grades of content and each grade comes at a different price. Knowing the collective costs of creating and distributing content is the best way to start identifying the ROI from your content marketing efforts.
2. Relying Exclusively on Vanity Metrics
Vanity metrics make you feel good about your marketing efforts. They include website page views, the number of subscribers on your newsletter list, the number of likes or followers on social media, and email open rates.
However, vanity metrics tell you nothing about your business performance.
For example, a million monthly page views might sound impressive. But if they do not translate into sales, they are not contributing to your bottom line. Similarly, having a large number of email subscribers is meaningless if they do not engage with your content and take the desired actions.
Instead, focus on actionable metrics like:
- website conversion rates
- click-through rates of email campaigns
- customer acquisition costs
- positive brand mentions on socials and other websites
These metrics help you better understand how your content is impacting your bottom line and make data-driven decisions to improve your content marketing ROI.
3. Ignoring Micro-Conversions
Micro-conversions are the smaller actions that website users take on the path to macro-conversions.
Micro conversions can include actions such as:
- signing up for a newsletter
- downloading a whitepaper
- brand mention on social media
While these actions may not directly lead to a sale, they are important indicators of user engagement and can provide valuable insights into the customer journey.
Ignoring these micro-conversions can lead to missed opportunities for optimization and improvement. But tracking and analyzing these small actions helps you better understand your customer's behavior and make impactful decisions for your content strategy.
4. Relying only on self-attribution
Self-attribution is the source of conversion as reported by the customers themselves. This could be through surveys, feedback forms, or other direct communication where the customer tells you how they found out about you or what influenced their decision to convert.
A study by Google mentions that customers have an average of 2.8 touchpoints before making a purchase. This means that if you're only attributing success to the last touchpoint, you're missing out on considering the impact of the other 1.8 touchpoints.
Consider a customer who discovered your brand through a blog post. They also engaged with your social media content before making a purchase through a promotional email. If you ask this customer what influenced their purchase, they may mention it was the promotional email. But that undervalues the role of other pieces of content within the buyer journey.
To avoid this mistake, complement self-attribution data with other methods of tracking customer interactions. This means, using analytics tools like Factors to track customer behavior on your website and across platforms, and implementing various attribution models to consider all touchpoints in the customer journey.
For example, a linear attribution model would give equal credit to all touchpoints, while a time-decay model would give more credit to the touchpoints closer to the conversion.
Let’s now look at how we can calculate the content marketing ROI with an example.
Calculating Content Marketing ROI With An Example
Let's take a look at an example to better understand how to measure the ROI of a content marketing campaign.
Suppose one of your blog posts started ranking on Google through SEO and was also promoted on social media and email campaigns.
By the end of the month, the blog got 800+ unique visitors – 500 through search engines and 300 through promotional efforts. Of these 800 visitors, 60 signed up for the product.
You earn around $5000 from these 60 customers
If the cost of producing and promoting the blog post was $1000—which includes the cost of writing and repurposing the content across platforms, what’s our ROI on this piece of content?
Using the content marketing ROI formula:
ROI = ($5000 - $1000) / $1000 * 100% = 400%

This means that for every $1 spent on the blog post, you earned $4 back.
And because SEO content keeps bringing in visitors, long after the work is done, you continue to reap the benefits from these efforts.
Measure your content efforts with Factors
Let’s get started with a practical setup of how you can leverage Factors for content marketing ROI measurement.
Step 1: Define Your Goals and Metrics
Before you start measuring your content performance, you need to determine what success means for content marketing.
For you, it could mean increasing website traffic, generating leads, improving conversion rates, or boosting customer engagement. Determining your metrics and key performance indicators (KPIs) will help you measure your progress toward these goals.
Factors provide Attribution tracking which helps you create reports that attribute your marketing efforts to specific goals and metrics.
Here's how you can build an event report in Factors.ai:
- Log in to Factors and click on Reports > Analyse

- Next, click Attribution Reports. These reports keep track of all the touchpoints through the platforms that Factors has connected with and UTM data to identify the source of conversion.

- Next, we need to identify the specific goals that signify a successful conversion.
Step 2: Set Up Tracking/Attribution
If you haven’t set up events, you can do so by clicking on the configure icon beside your profile picture and clicking Events.

- Factors also automatically track events across all the pages of your website. You can simply set a page as your conversion goal (for ex. Demo page). Let’s take this as an example and create an attribution report.
- The conversion goal is set to the /schedule-a-demo page.
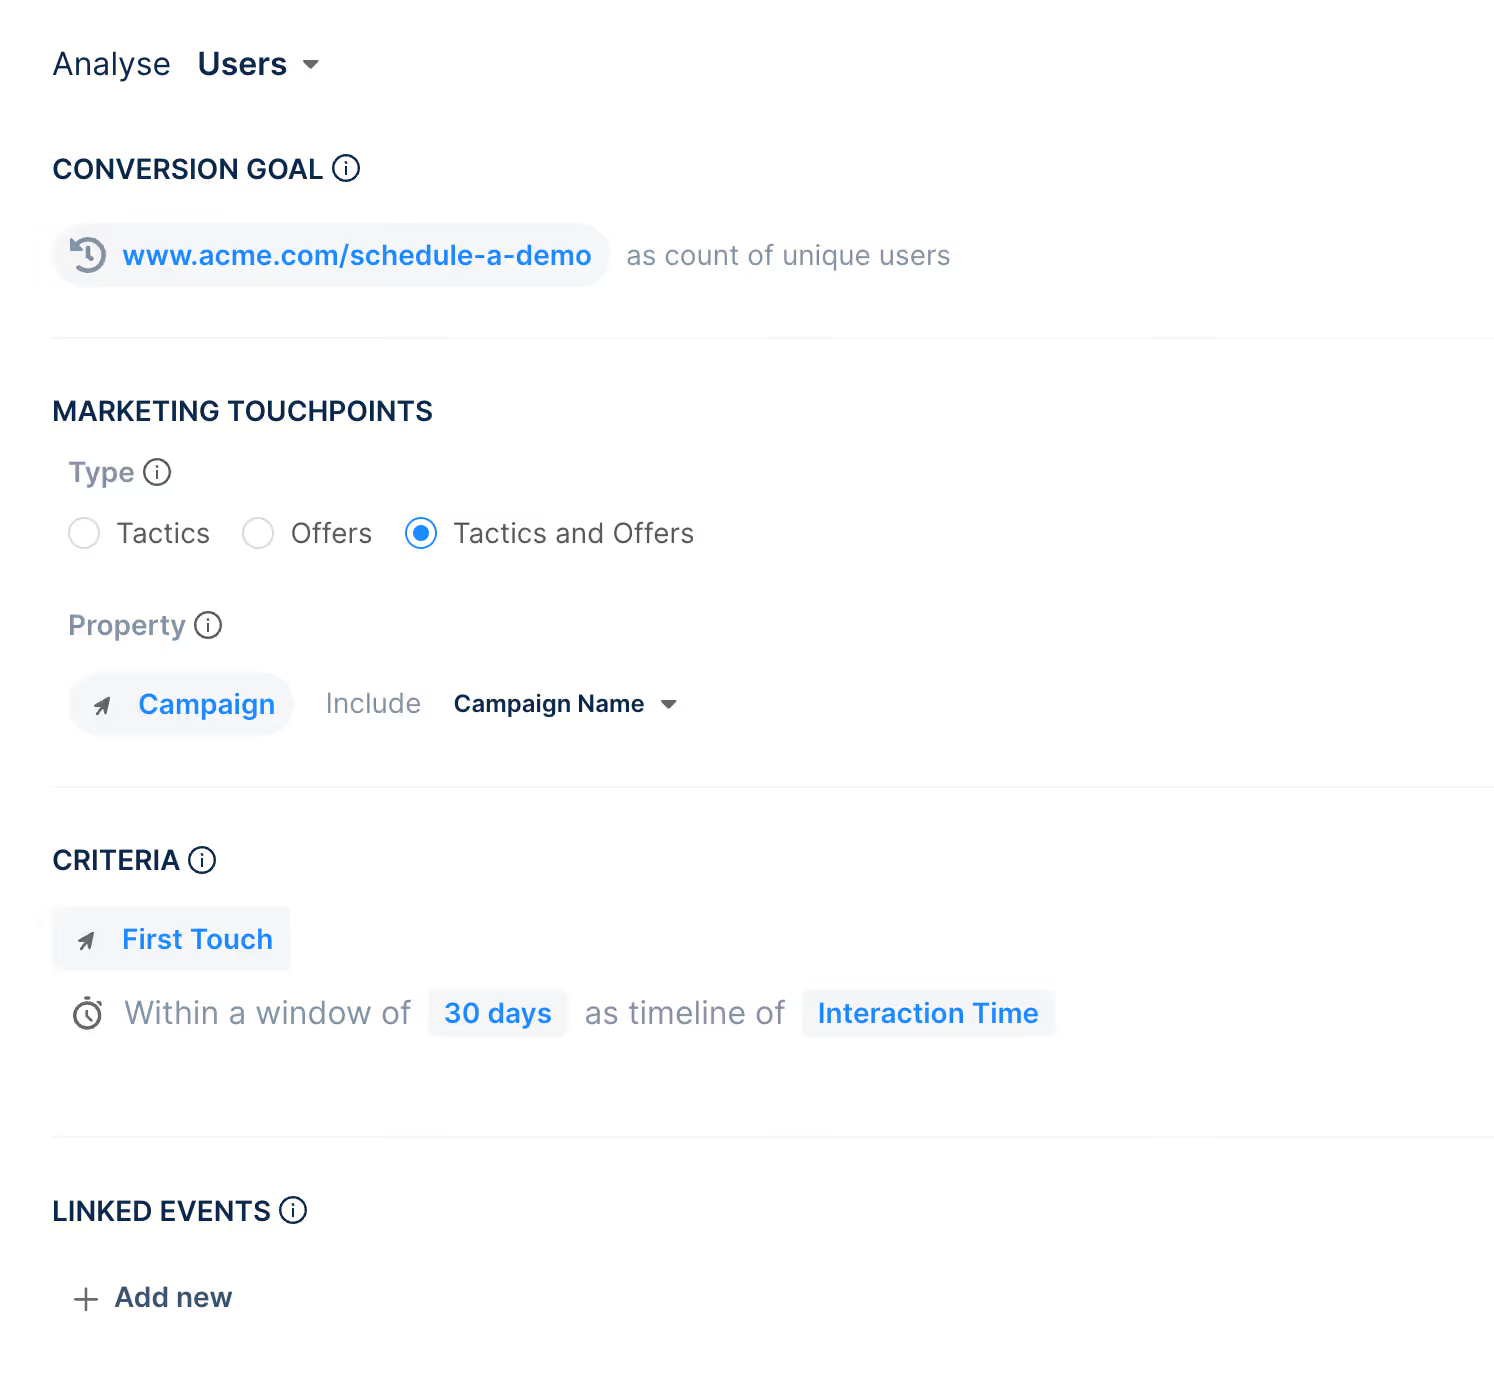
- Marketing touch points are the type of marketing campaigns that you want to track within these reports. Tactics are outbound marketing campaigns like Google ads. Offers are inbound marketing tactics like landing pages and content that you create to bring in visitors.
- We then pick the Property as a Campaign here so we can attribute the marketing efforts to specific campaigns. You can pick a source if you want to identify which of your channels is bringing in the most conversions.
- Then, we move to Criteria. This helps you configure how a conversion is attributed to a specific campaign. We’ll start by configuring it to the first touchpoint. This means all conversions are attributed to the first touchpoint.

We also set the time window to 30 days. This ensures that even if a visitor converts after 30 days, you can attribute it back to the first touchpoint.
- Once done, click Run analysis and you’ll have a complete visual report specifying exactly what campaigns bring in your leads.

Step 3: Understanding Campaign Costs and ROI
Scrolling down the report will give you a breakdown of individual campaigns that bring in leads.
- Factors can also bring in the ad spends for each campaign on a single dashboard. This means you can identify how much money was spent on a campaign vs. the return.

- Scroll below the chart to see the breakup. This breakup will give you insight into how your content marketing performs and the number of conversions it brings in.

With that, you have a fundamental understanding of how to attribute business success to your content marketing efforts and showcase the impact to the stakeholders.
However, it’s just the beginning. Factors integrates with 6signal by 6sense, Hubspot, Zapier, Ads platforms, Slack, and many other tools to bring data from across platforms under a single dashboard. This lets you create comprehensive reports and also gives you a holistic view of all your marketing campaigns, no matter the platform.
Leverage The Factors Advantage for Content Marketing ROI Optimization
With content marketing, you're juggling multiple tasks—creating content, tracking performance, and more importantly, measuring return on investment (ROI). But, measuring ROI isn’t straightforward. It involves setting clear goals, tracking the right metrics, understanding your costs, and connecting the dots to get a holistic view.
That’s a lot to handle. But Factors is here to simplify things for you.
It makes tracking and understanding your content marketing efforts a breeze. With its analytics and attribution tools, you can easily track user behavior, identify key touchpoints, and optimize your sales process. Plus, Factors’ customizable dashboards give you a real-time view of your key metrics, helping you make data-driven decisions on the fly.
So, are you ready to unlock the full potential of your content marketing? Then it's time to take the next step. Book a demo with Factors and start your journey towards content marketing success, today!
Understanding content marketing ROI is key to maximizing impact and aligning efforts with business goals.
1. Common Pitfalls: Relying on vanity metrics, poor attribution, and overlooking long-term value.
2. Effective Measurement: Align goals with business objectives and use holistic analytics tools.
3. Strategic Benefits: Improve content performance, justify spend, and refine strategies continuously.
Tracking meaningful metrics ensures smarter decisions, better resource allocation, and long-term content success.

We don’t just write about demand gen. We deliver it.
Our AI Agents help you uncover high-intent accounts, run campaigns that actually convert, and keep your GTM motion in sync.
1000+ GTM teams have already scaled their pipeline with Factors.
*Includes built-in peace of mind. And fewer late-night funnel audits.

.svg)