

Good Reads
Fix pipeline pains. Solve GTM puzzles. Read strategic brain dump.
Written for marketers who want real solutions to a leaking pipeline (and their dark circles).
Want to read more from us?


I’m looking for…
.avif)
Cookieless Multi-Touch Attribution: Track User Journeys Without Third-Party Cookies
Discover how to implement cookieless multi-touch attribution using first-party data, AI models, and privacy-safe tracking methods—no cookies required.

TL;DR
- Replace cookies with server-side tracking, first-party data, and anonymous event monitoring to stay compliant and insightful.
- Use AI-powered methods like Markov Chains and Shapley Values to fairly distribute credit without personal data.
- Leverage tools like identity graphs and Unified IDs for accurate tracking across platforms and devices.
- Cookieless attribution builds trust, reduces legal risk, and gives early adopters a lasting competitive edge.
Marketers must start tracking user interactions without cookies. Major browsers, like Chrome, will soon stop using third-party cookies, leaving many to search for new ways to gather data. This is not just a technical issue; it changes how marketers understand customer behavior and measure their campaigns.
The problem is clear: cookie-based tracking is becoming outdated. Marketers who depend on data insights to improve their strategies feel a sense of urgency. Without cookies, tracking user journeys across different points becomes harder, leading to gaps in understanding customer behavior and campaign results.
Yet, this challenge offers a chance to grow. The answer is in using cookieless multi-touch attribution models that respect privacy while giving accurate insights into the customer journey. These models use new tracking methods and advanced analytics to replace cookies.
By focusing on first-party data, server-side tracking, and anonymous event tracking, marketers can still gain valuable insights without risking user privacy. In this article, we will explore cookieless multi-touch attribution, looking at the methods and technologies that help track user interactions effectively in a world without cookies.
What is Cookieless Multi-Touch Attribution?
Cookieless multi-touch attribution tracks and analyzes user interactions across various marketing channels without using traditional cookies. As privacy rules tighten and third-party cookies disappear, businesses must use methods that respect privacy while still gaining insights into customer journeys.
Cookieless attribution identifies and evaluates the multiple touchpoints a user interacts with before making a purchase. Unlike single-touch models, which credit only the first or last interaction, multi-touch attribution considers all interactions that lead to a conversion. This helps marketers understand the effectiveness of each channel and improve their strategies.
In a cookieless setup, attribution uses alternative data collection methods, like first-party data, server-side tracking, and anonymous event tracking. These methods comply with privacy laws, such as GDPR and CCPA, while still accurately tracking user behavior.
By using advanced analytics and AI, cookieless multi-touch attribution models offer a detailed view of how different marketing channels work together to drive conversions. This helps businesses allocate resources better, reduce ad waste, and improve overall marketing performance. Adopting these strategies is key to staying competitive in a changing digital world.
Benefits of Cookieless Multi-Touch Attribution
Using cookieless multi-touch attribution has several benefits, some are:
1. Stronger Privacy Compliance
- Cookieless attribution aligns seamlessly with global privacy regulations such as GDPR and CCPA.
- By avoiding third-party cookies and focusing on first-party data or privacy-friendly tracking techniques, companies can remain compliant and avoid hefty fines.
- It shows customers that their privacy matters, building long-term trust and brand credibility.
2. Improved Cross-Device Tracking
- Cookieless tracking methods, such as device fingerprinting, ID resolution, and server-side tracking, offer a more unified and accurate view of the customer journey across devices.
- This gives marketers better insight into how consumers move between channels and helps ensure no valuable interaction is left out of the attribution picture.
3. More Efficient Budget Allocation
- It allows you to assign value to all contributing touchpoints, even those that occur early in the funnel or on different platforms.
- This leads to more strategic spending, reduced wasted ad dollars, and a higher return on investment (ROI).
- Marketers no longer need to rely on guesswork; they can invest confidently in what’s proven to work.
4. Enhanced Data Accuracy and Stability
- Cookieless methods, especially server-side tracking, offer more stable data collection because it’s not tied to browser settings.
- You gain access to more persistent and reliable data, which strengthens your analysis and supports better decision-making over time.
5. Increased User Trust and Engagement
- Cookieless attribution, when paired with transparent data collection policies, creates a better user experience.
- Instead of relying on hidden trackers, brands can focus on gaining explicit user consent through value-driven interactions like newsletter sign-ups or gated content.
- This builds a two-way relationship where users feel respected and are more willing to engage.
6. Competitive Advantage Through Innovation
- Companies that move early to adopt cookieless attribution marketing are better positioned to adapt to the future.
- Early adopters not only stay compliant but also set themselves apart as innovative, forward-thinking brands.
- This positions them as leaders in customer experience, data responsibility, and performance-driven marketing.
In short, cookieless multi-touch attribution meets privacy needs, improves tracking accuracy, saves on ad spending, and promotes innovation.
For more on improving your marketing ROI, check out our Marketing ROI From PPC page.
Check out this guide on the top 7 Marketing attribution tools
{{INLINE_TOFU}}
Effective Methods for Cookieless Tracking
Marketers need new, privacy-compliant ways to track and understand user behavior. Fortunately, several effective methods are emerging that not only preserve user privacy but also provide actionable insights. Here are some of the key approaches:
1. First-Party Data Collection
First-party data is information you collect directly from your audience through website interactions, sign-ups, surveys, gated content, chatbots, or purchases. This data is highly valuable because it’s accurate, reliable, and fully owned by your business. It includes details like browsing behavior on your site, product interests, and engagement with emails.
While first-party data is more privacy-compliant, it may not give a complete picture of the pre-purchase journey, especially for top-of-funnel activities that happen off-site. Still, it's one of the most trusted foundations for cookieless tracking.
Bonus Tip: Encourage users to voluntarily share data by offering personalized experiences, exclusive content, or discounts.
2. Server-Side Tracking
Server-side tracking shifts data collection from the browser (client-side) to your server. This means user interactions are captured and processed in a more secure, controlled environment. It helps avoid issues caused by ad blockers, cookie restrictions, or browser limitations like Apple’s ITP (Intelligent Tracking Prevention).
Though it provides better accuracy and security, server-side tracking requires more development resources and infrastructure. It’s best suited for businesses with in-house technical expertise or those investing in advanced analytics.
Bonus Tip: Use tag management systems like Google Tag Manager Server-Side to simplify the setup and reduce load times.
3. Anonymous Event Tracking
Anonymous event tracking captures user actions, such as page views, clicks, video plays, or form submissions, without storing personal data or identifiers. This method doesn’t rely on cookies or user profiles but still allows marketers to understand behavioral trends and optimize experiences.
It’s especially helpful in regions with strict privacy regulations or when cookie consent isn’t granted. By analyzing anonymous behavior, marketers can still uncover what content works, what users are engaging with, and which journeys lead to conversions.
Bonus Tip: Use heatmaps, session replays, and scroll-depth tracking to complement anonymous data with rich behavioral insights.
4. Contextual Targeting
Instead of following users, contextual targeting focuses on the content users are consuming at the moment. For example, if someone is reading a blog post about hiking gear, they might see ads related to outdoor equipment. This approach doesn’t require personal data and is fully compliant with privacy laws.
Contextual targeting can be powerful when aligned with relevant messaging and well-placed creative, especially for awareness and consideration-stage marketing.
Bonus Tip: Pair contextual targeting with strong SEO and content marketing to naturally attract your ideal audience.
5. Identity Graphs and Unified IDs
Some advanced tools use deterministic data (like logins or hashed emails) and probabilistic modeling to build identity graphs. These graphs help track users across devices and channels without relying on cookies. Unified ID frameworks, such as Unified ID 2.0, aim to create a shared, privacy-friendly alternative to third-party cookies.
This method is more technical and often used by large enterprises or advertising platforms but can be effective in maintaining user-level insights while complying with privacy standards.
Bonus Tip: Make sure your data partners and platforms are transparent and compliant with relevant data regulations.
6. Privacy-Focused Analytics Platforms
Tools like Matomo, Fathom, and Simple Analytics are designed for a privacy-first world. They offer cookieless tracking by default and still provide robust insights on user behavior, traffic sources, bounce rates, and conversions.
These platforms are gaining popularity among marketers who want to balance data needs with ethical, user-respecting practices.
Bonus Tip: Choose a platform that offers GDPR/CCPA compliance out-of-the-box to reduce legal risk and build user trust.
By combining first-party data, server-side infrastructure, anonymous tracking, and privacy-compliant tools, you can continue to gather meaningful insights without compromising user privacy or losing performance visibility.
Also, read the Pros and Cons of Multi-Touch Attribution.
Top 3 AI Techniques in Multi-Touch Attribution
AI techniques offer advanced ways to analyze user behavior across multiple channels without relying on cookies. These models process large amounts of complex data and provide more accurate, privacy-friendly attribution insights.
1. Markov Chains
Markov Chains are a predictive modeling technique used to map out user journeys across channels. This method examines how users move from one touchpoint to the next and assigns credit based on each channel’s influence on the conversion path. One powerful feature is the removal effect, which calculates the drop in conversion rate if a specific channel is removed from the journey. This helps identify high-impact touchpoints, even if they don't directly lead to conversions.
2. Shapley Values
Rooted in cooperative game theory, Shapley Values offer a fair way to distribute credit among all marketing channels. Unlike linear or last-touch models, this method looks at every possible combination of touchpoints to determine how much each channel contributes to the final outcome. It’s especially useful when multiple touchpoints work together to drive a conversion, as it considers all their contributions, not just the most recent or the first.
3. Additive Hazard Model
This statistical model focuses on when conversions happen, rather than just if they happen. It looks at time-stamped user interactions and calculates the likelihood of a user converting at any given point. By analyzing the influence of past touchpoints over time, this model helps marketers understand the pace of the buyer journey and which channels accelerate or delay conversions.
These AI methods offer a smart way to do attribution. They help marketers improve strategies in a complex, multi-channel world without using cookies.
Common Challenges in Traditional Cookie-Based Attribution
Traditional cookie-based attribution has been a key part of digital marketing, but it faces big challenges today. Some are:
- Compliance with Data Privacy Laws: Cookie-based tracking struggles to meet regulations like GDPR and CCPA, increasing the risk of penalties and damaging brand trust.
- Growing Consumer Privacy Awareness: Users are more informed about tracking and frequently opt out or use ad blockers, reducing the effectiveness of cookies.
- Device Fragmentation: Cookies can't track users consistently across multiple devices, leading to fragmented and incomplete customer journeys.
- Short Cookie Lifespan: Users clear cookies regularly, and browsers now block them by default, making the data unreliable and incomplete.
- Limited Accuracy and Reach: With reduced cookie access, marketers face major gaps in tracking, causing less accurate attribution and poor decision-making.
These issues push the need for new attribution methods that respect privacy and give accurate insights, leading to cookieless solutions.
Check out this help guide on common B2B marketing challenges and solutions
Best Strategies to Implement Cookieless Attribution
Here are the best strategies to implement cookieless attribution:
1. Leverage First-Party Data
Start by focusing on first-party data—information you collect directly from users through forms, subscriptions, surveys, purchases, or customer support. This data is accurate, consent-driven, and compliant with privacy laws. It gives you valuable insights into user behavior, intent, and preferences without relying on third-party tracking.
2. Adopt Server-Side Tracking
Move your tracking from the user’s browser to your own server. Server-side tracking helps bypass browser restrictions, improves data consistency, and offers greater control over how data is collected and stored. While setup can be more technical, the long-term benefits in accuracy and privacy compliance make it worth the investment.
3. Use Anonymous Event Tracking
Track events like page visits, clicks, form submissions, and purchases without tying them to personally identifiable information. This keeps user data anonymous while still offering insight into behavior. It’s especially effective in regions with strict privacy laws, allowing you to stay compliant and still collect actionable data.
4. Integrate AI-Based Attribution Models
Apply advanced AI techniques such as Markov Chains, Shapley Values, and Additive Hazard Models. These models analyze patterns across user journeys and fairly attribute value to each touchpoint, even without personal data. They help marketers identify which channels are working together and which are underperforming.
5. Build a Privacy-Focused Culture
Make privacy a shared responsibility across your team. Train marketing, analytics, and development teams on privacy-first data practices. Stay updated with global regulations like GDPR, CCPA, and emerging standards to ensure ongoing compliance as rules evolve.
6. Test, Monitor, and Optimize Regularly
Cookieless attribution is still developing, so it's important to test strategies regularly. Use A/B testing, performance tracking, and feedback loops to refine your methods. Monitor data quality and adjust your approach as technologies and regulations shift.
By using these cookieless strategies, you meet privacy standards and better understand and engage your audience. For more on how Factors.ai can help, visit our How Factors Works page.
Navigating the Shift to Cookieless Multi-Touch Attribution
As third-party cookies disappear and data privacy regulations tighten, marketers face a major challenge: how to track and understand user journeys without losing precision or compliance. Cookieless multi-touch attribution answers this challenge by combining privacy-first technology with strategic data collection. This model credits multiple touchpoints across a user's journey using alternative methods like server-side tracking, anonymous events, and first-party data.
The guide explores how to replace cookie-based tracking with modern approaches that still offer actionable insights, without infringing on user trust. Marketers can use advanced AI models such as Markov Chains, Shapley Values, and Additive Hazard Models to assign value across touchpoints, even when personal identifiers are unavailable. These methods enable smarter budget allocation, improved cross-device visibility, and sustained campaign performance.
From identity graphs to contextual targeting, businesses that adopt cookieless attribution early can ensure accurate measurement while positioning themselves as privacy-forward. Success lies in continuous testing, aligned teams, and a willingness to invest in long-term solutions. The future of attribution is no longer cookie-based—it’s ethical, intelligent, and built on user consent.

A Step-by-Step Guide to Implementing a Conversational ABM Strategy
Here’re 8 steps to help you implement a successful conversational ABM strategy for your business in 2023. Conversational ABM full guide inside.

TL;DR:
- Conversational ABM is a marketing strategy that uses chatbots or live chats to actively engage with target accounts.
- It is crucial to identify and segment your prospects since the demography of each prospect could vary.
- Set proper boundaries when assigning SDRs and ensure that the visitors are routed to appropriate SDRs.
- Ensure you’re running personalized ads to each prospect and provide relevant and consistent messaging throughout.
- One of the best platforms to converse with your prospects is LinkedIn.
- Be ready for your prospect at any time by using AI-powered chatbots.
Human beings are social animals. Over thousands of years, we’ve developed gestures, languages, and tools to express ourselves to those around us. Our exceptional ability for communication has empowered us to exchange ideas like no other species on the planet. Given that this dialogue is at the heart of the human experience, it’s of little surprise that Conversational ABM is becoming an increasingly effective engagement technique for the modern-day marketer.
What is conversational ABM?
Conversational ABM is a marketing strategy that uses chatbots or live chat to engage actively with target accounts.
With real-time conversations, businesses can build strong relationships with their target audience and address specific needs. In addition, it creates a more human connection with prospects, leading to a higher likelihood of closing a deal.
And because 90% of prospects identify live messaging as their most favored channel of business communication, conversational ABM is a strategy worth considering.
How to implement a Conversational ABM strategy?
1. Identify your target accounts
As is the case with any ABM strategy, your first step should be to align marketing and sales through a collaborative identification of accounts.
The target list is usually determined by a few specific firmographic characteristics such as industry, revenue, and geography. Once generated, this list will dictate the tone and language of your messaging, content, and campaigns. So getting it right is pretty important.
2. Identifying and segmenting prospects
Once you’ve created a fresh list of target accounts, the next step is to identify individual users at these target accounts to reach out to within this list. Maybe you want to target CXOs, or maybe managers, or maybe engineers, or maybe a combination of a variety of such roles.
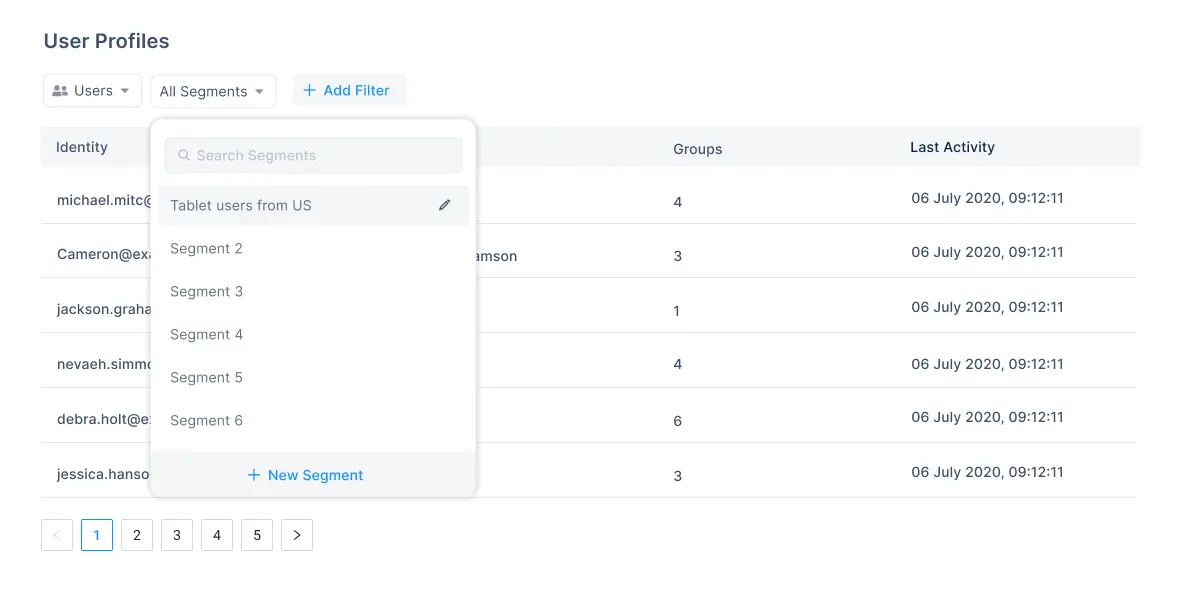
Regardless, the optimal approach for each demographic will undoubtedly vary. Hence, it would make sense to segment this list of prospects further by customer life cycle, sales stage, pain points, and, most importantly, intent. Then the person in charge allocates this segmented list among Sales Development Representatives, who can work out distinct marketing strategies for their targets.
3. Building boundaries
In an ABM approach, it is important to assign individual Sales Development Representatives to build a strong relationship with each prospect.
When assigning SDRs, always keep in mind to set strict ownership boundaries. It helps route the visitors to appropriate SDRs and eliminate any engagement overlaps.
4. Personalizing ads
Okay, now you know whom you’re contacting and why. Now it’s time to think about the approach for each prospect. This stage involves an intricate balancing act between personalization and scale.
Of course, every individual in every role across every company you’re targeting has their own unique preferences — but personalizing ads at that level isn’t feasible. Instead, customizing ads on a higher level — say, by role or industry, is the way to go. This entails running campaigns based on prospect-specific pain points, and value adds.
A CMO may care about marketing’s influence on revenue, while a marketing manager may be interested in improving workflow and automation. Your campaigns should resonate appropriately with all such use cases.
5. Sentry Surveillance
Your target list is ready, and your personalized ads are running. Now, the second a prospect from your list is on your website, your marketing + sales teams need to be conversation-ready.
The first step here is to make sure everyone has access to all the information they’ll need. It means all your CRM data, marketing automation data, and intent data should be consolidated, organized, and easily accessible. Once equipped with all relevant information about the visitor and their company, your SDR team is all set to engage with the prospect.
6. Complete consistency
Personalization is the most important aspect of conversational ABM when a prospect is currently on your website.
Assuming your prospects love your ads and visit your website, they should be landing on a homepage that’s relevant to them. Any decent content management system (CMS) will be able to identify a contact when they land on your homepage and cater to the web flow in a manner that ensures a personalized experience.
7. Chit-Chat
A relevant landing page will definitely help direct prospects toward your product. But a lot of the time, this won’t be sufficient.
A target will stay on your website only for a few precious minutes, and it’s important to make the most of it. Sure, you could wait until they make their way to the demo form and submit their details — but Conversational ABM encourages marketers and SDRs to proactively reach out through a relevant live-chat message.
References to the contact’s role, the company’s signals, or a prominent pain point are all great ways to get the conversation going. This is the meat and potatoes of the Conversational ABM process. SDRs utilize target data to provide a genuine, relevant, and personal dialogue with their prospects to confirm a demo and push accounts through the funnel
8. Conversational ABM - Around the clock
Conversational ABM involves interacting and connecting with prospects around the clock. While thorough research and proactive interactions are valuable tactics, you may want to employ AI-powered bots to render the process air-tight. So when you do happen to get that one inbound demo at 4 in the morning, you can trust that your chatbots will be up to schedule that demo for you.
Oh, and another thing — conversational ABM doesn’t top conversations on your website. Linkedin is your friend when it comes to interacting with your target’s content posts. Feel free to leave likes, comments, and, if appropriate, connection requests with prospects.
{{INLINE_MOFU}}
Conclusion
And there we have it. When executed well, conversational ABM can be a valuable strategy to bolster your marketing efforts and improve conversions. Though it’s definitely a lot more effort than traditional marketing techniques, conversational ABM pays its dividends in the long run. Prospects form stronger associations with the product and are almost certainly more likely to convert from a distant target to a tight-knit customer.
Factors.ai enables easy integration with CRM platforms like HubSpot and Salesforce. This can help you generate a more effective ABM campaign. Signup for free or book a demo to start your Conversational ABM campaign today.

Content Reporting: Tips and Best Practices to Create the Right Dashboards
Learn best industry practices in content reporting and how these can help your company maximize its content ROI
.avif)
Content managers spend the bulk of their time drawing up content briefs, editing email newsletters, and collaborating with marketing teams to ensure they set the right tone. Detailed content reporting on key metrics is essential for content managers to iterate and curate effectively going forward. This blog highlights the importance of content reporting as well as a few best practices to create relevant content dashboards.
What is content reporting?
Content marketers use content reporting to analyze the performance of their assets across website, organic channels, social media, syndication and more.
Modern content reporting eliminates the need for manual analysis. Instead of juggling between several unintuitive tools, marketers can use a unified, interactive dashboard to reflect holistic information about content performance.
This has the benefit of centralizing all your reporting and getting relevant insights to you in real-time. Metrics that content marketers keep track of to optimize their content performance include clickthrough rate (CTR), bounce rate, time on page, and website traffic through the identification of unique visitors.

Why is content reporting important?
It’s imperative for your content marketing team to create high-value content for your target audience. In order to do this, you have to understand how your target audience is responding to the content you’ve already put out. Once you figure out how different content resonates with different personas, you can create more content that is relevant to their journey at each stage of the funnel. Ultimately, this improves the customer experience and drives more conversions.
In a nutshell, content reporting helps marketers:
1. Understand which content performs well
Content makes up a significant proportion of any B2B company’s expenses. It’s important that you get the best results from the time and money your company puts into its marketing efforts. Dedicated content reporting based on metrics such as engagement (including time spent, scroll depth, bounce rate, and pageviews) or conversions (such as influenced demos and pipeline) gives you a keen idea of the type of content your target audience is looking for.
2. Measure the impact of content across the sales funnel
Marketing teams are increasingly being asked to tie their efforts back to pipeline and revenue. With comprehensive content analytics and reporting in place, marketers can connect the dots between distribution channels, assets, and bottom-line metrics.
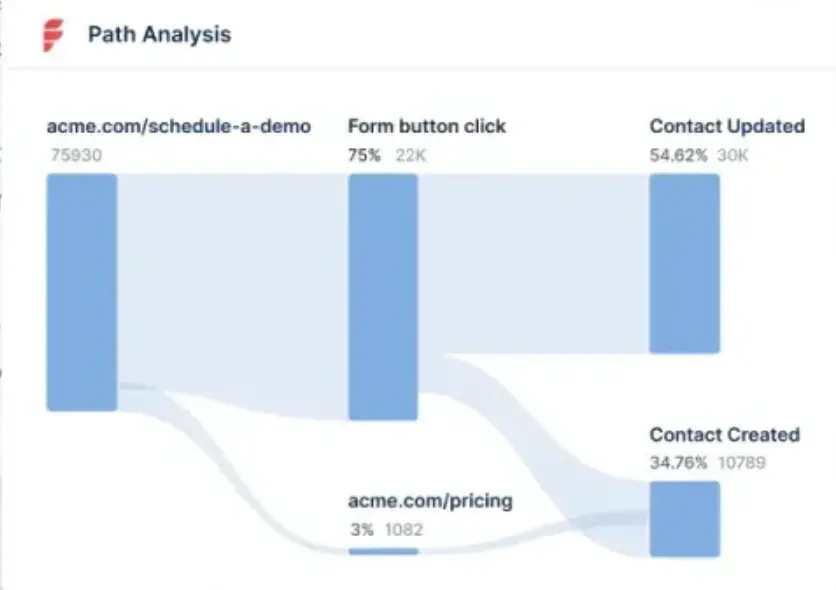
With path analysis and account journey mapping, marketers can pin-point how prospects are interacting with blogs, case-studies, white papers, etc before turning into MQLs, SQLs, and pipeline. With multi-touch attribution, marketers can determine which assets initially bring in top-of-the-funnel leads and which assets help influence the final conversion to paying customers.
Content analysis and reporting at this level helps prove content marketing’s impact on high level business objectives and improves content strategy by shedding light onto what works and what doesn't.
3. Streamline content production, distribution, and repurposing
Content reporting allows you to see what content provides value to your prospects when they’re at the bottom, middle, or top of the funnel respectively. You’ll therefore be able to streamline content production and offer prospects and clients content that’s relevant to them.
Your target audience’s needs are constantly evolving, though–which means your content also has to do the same. Dedicated content reporting will help you assess whether certain channels or posts are underperforming with respect to crucial content metrics. This information helps you know when you need to refresh your content. You can also see which content is performing well, so you can repurpose it for further use.
4. Optimize the process and minimize overheads
When you know which channels and content help to bring the most leads and conversions, you eliminate any shots in the dark about the conversion process.
You’ll be able to make more educated guesses about which marketing channels to invest in based on past trends. This allows you to cut down on marketing expenditure that doesn’t bring in results, and focus your energies towards high-value content creation and distribution on channels that will resonate with your target audience.
5. Understand what type of audience engages with each content piece
Content marketing teams often produce loads of ungated assets without actually knowing who the final consumer of their content is. Visitor identification tools like Factors.ai help identify anonymous accounts visiting the website — along with firmographics such as the visitor’s industry, employee headcount, and revenue range.
This provides unprecedented visibility for content marketers to gauge who their audience really is and what types of content appeal most to them. For example, maybe visitors from enterprise-level companies prefer content around security and privacy compliance. Early-stage start ups, on the other hand, may find content around pricing more relevant.
Visitor identification helps content marketers tailor assets towards their ideal audience and promote relevant content going forward.This, in turn, helps improve the odds of conversion along the customer journey.
What should you include in a content report?
Some metrics are more valuable than others when it comes to content reporting. Most free tools such as Google Analytics only provide the bare minimum to track content performance. This includes clicks, impressions, social-shares, and bounce rates. No doubt, these are useful metrics — but only when used in conjunction with other, granular KPIs, filters, and breakdowns.
For example, aggregate bounce rate on Google analytics is a metric that measures the number of visitors who drop off from a website after visiting a single page. In B2B, this is a remarkably ineffective metric unless broken down by B2B segment such as industry, revenue range and so on. Only then can marketers compare variations in bounce rates to discern how different assets influence different sets of audiences.
Your content team should employ tools that are able to measure metrics that industry experts recommend keeping track of for detailed content analysis. This includes:
- Scroll depth: The scroll depth is an engagement metric that encapsulates how deep a user scrolls down your landing page or blog content. Typically, a scroll depth of 50% or more means that your content is resonating with visitors.
- Conversion rate: The conversion rate represents the number of users who converted as a ratio of the total visitors to your website. If your product interests prospects, or your content addresses website visitors’ pain points, they are more likely to convert. Another version of this is the Marketing Qualified Lead (MQL) to Sales Qualified Lead (SQL) conversion rate.
- Impressions: Your impressions indicate how much engagement your content generates. This content could be anything: an article, a blog, or one of your web pages. The impressions metric helps you understand the performance of your social media and search engine marketing campaigns.
- Time on page: Like the scroll depth, the time a prospect spends on a web page or blog post indicates their interest in your service.
- Unique users: The number of visitors to your website can be challenging to calculate, since it’s essential that each unique visitor be counted only once, regardless of how often they visit your website.
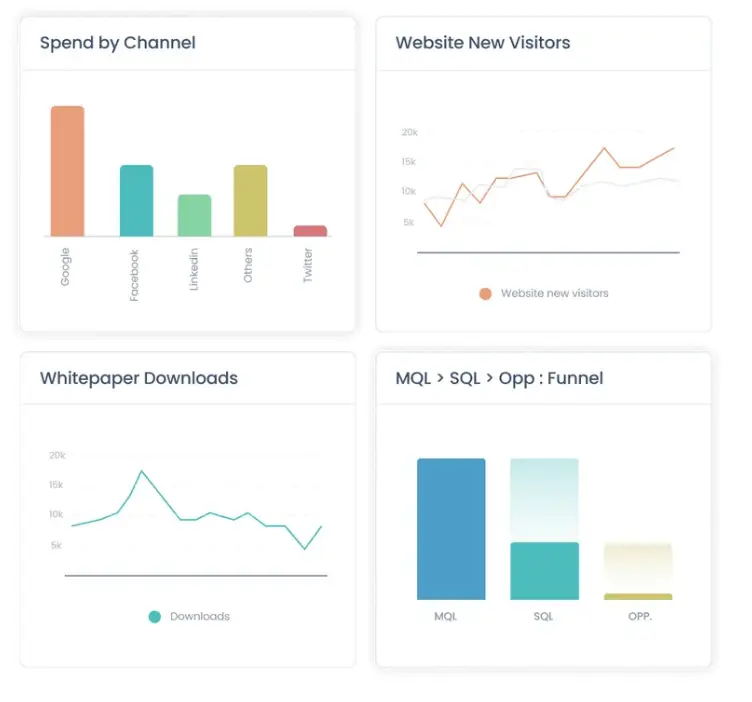
Your content reports also need detailed but easily understandable visualizations that allow you to make beneficial decisions at a glance. A content marketing dashboard should immediately help you grasp how key metrics are changing to drive efficient decision-making related to content and attribution.
{{INLINE_TOFU}}
Best practices to create effective content dashboards
Your content dashboard should show you everything you need to create an effective content strategy on the same page. Here’s how your marketing team can ensure it has the best possible content dashboard:
1. Understand the metrics you’re using
How is each metric connected to your strategic goals or overall revenue? Asking this question helps to streamline the information on your dashboard so it only shows you relevant metrics. Your marketing team needs to understand how each metric displayed corresponds to the company’s goals to effectively adapt the marketing strategy accordingly.
2. Set the right goals
Not all your goals have to be connected to revenue–some of them can be associated with your company’s strategic goals, such as acquiring prospects in a certain industry sector or locality. Metrics such as the influenced pipeline, for example, are not associated with revenue but with the success of your marketing efforts. Tracking the right metrics while keeping company goals in mind allow you to focus on growth.
3. Make data easy to consume
While deciding which metrics to include in your visualizations, ask yourself the following questions:
- Who/what is this visualization for?
- Does a specific metric help you make quicker and better marketing decisions? If the answer is yes, include it.
- Which visualizations are easiest to understand for each metric?
- How can each piece of data be connected to your company’s overall revenue?
4. Include comparison data
Comparison data is crucial for keeping track of progress. A dashboard incorporating comparison data will often employ graphs and charts that display how certain metrics have changed over selected quarters, for instance. This data helps you see how much closer you are to achieving company goals than before.
5. Don’t forget about influenced pipeline
Measuring how marketing has influenced pipeline helps you see what marketing content influences a lead’s decisions and how. Essentially, the influenced pipeline shows you the real impact of your marketing efforts, and informs you about the channels that most contribute to conversions. It helps you understand the buyer’s journey in greater detail.
Are there any tools to help with content reporting?
Tools like Factors offer analytics and multi-touch attribution dashboards, along with dedicated content reporting. You’ll be able to see all of your important metrics in one place, along with detailed, comprehensive visualizations that allow you to easily understand your company’s marketing strategy performance at a glance.
Factors’ attribution features also help combine all this information with your customer relationship management (CRM) software entries. This allows you to have a holistic understanding of each buyer’s journey, complete with the touch points that encouraged conversion and the content they found most useful.
Effective content reporting helps teams evaluate performance and refine strategies with clarity.
1. Core Focus: Track KPIs like engagement, conversions, and traffic quality through dynamic dashboards.
2. Best Practices: Align reports with business goals, segment data by audience, and update regularly.
3. Strategic Benefits: Enable informed decisions, highlight content impact, and improve marketing ROI.
Well-structured reporting transforms raw data into strategic value, driving smarter content and business outcomes.
Conclusion
Effective content reporting is a critical aspect of developing and adapting your content marketing strategy to current trends in the market. Book a demo with us today to find out how Factors can help your company with effective analytics, attribution, and reporting.
FAQs
1. What does a good content report look like?
A good content report includes key metrics for content marketing and visualizations that allow you to make quick and important marketing decisions on a single dashboard. Visualizations involving comparison data are also important, as they help you understand progress in performance.
2. What’s in a content report?
A content report displays changes in engagement and conversion metrics, and detailed analyses of how different types of content are performing across the various marketing channels your company employs. It should connect each metric to specific company goals, and also include easily understandable visualizations for quick decision-making.

Sales and Marketing Tools for B2B Teams
The only sales and marketing tools you need in 2026 to build a lean, high-converting revenue stack.

TL;DR
- Your ideal 2026 revenue stack should include 4–7 integrated tools, anchored by a CRM like Salesforce, HubSpot, or Zoho, eliminating data silos between marketing and sales.
- For marketing, use up to 3 tools: a marketing automation platform (HubSpot, Marketo, ActiveCampaign), an attribution solution (Dreamdata, Factors.ai, Marketo Measure), and an ABM or intent platform (6sense, Demandbase).
- Sales teams need just 2 tools: a sales intelligence platform (ZoomInfo, Apollo, LinkedIn Sales Navigator) to identify decision-makers, and a sales engagement tool (Klenty, Salesloft, Outreach) to automate outreach and accelerate deal flow.
- AI is already embedded in most leading tools, Factors.ai, Salesforce, Klenty, ZoomInfo, Outreach, but is only valuable when the data is clean, connected, and centralized in your CRM.
- Cut stack bloat through consolidation, not addition, run a tool audit, identify overlapping capabilities, and prioritize platforms that cover multiple use cases without sacrificing usability or adoption.
The average B2B marketing team uses 8 tools. Sales uses another 8. Add in your CRM, marketing automation, attribution, intent data, sales engagement, and call intelligence, and you've got 16 marketing and sales tools that are supposed to work together.
Here's the problem: most don't. Attribution lives in one place, and deal data in another. No one can say which touchpoints actually moved the pipeline. Marketing and sales aren't misaligned; their systems are.
You want to cut your stack without breaking everything, but don't know how.
And in this blog, we show you exactly that: the categories of tools you need, how they connect, and how to choose what stays and what goes.
So what exactly are marketing and sales tools?
Marketing tools like automation platforms, analytics and attribution systems, and ABM tools generate and nurture demand. Sales tools like CRMs, sales intelligence platforms, and sequencing tools convert that demand into revenue.
Simple on paper, but only 11% of companies have effective hand-offs between the two, according to Influ2's 2025 Sales-Marketing Alignment Report. The problem? Most treat these as separate systems with different owners and dashboards.
The fix isn't more tools. It's building one revenue stack connected to your CRM, where both teams see the same accounts, signals, and data.
What is a revenue stack? (and how many tools should be in it)
A revenue stack is the minimum set of sales and marketing tools needed to create pipeline, move deals forward, and prove which efforts impact revenue, with the CRM as the single source of truth.
You can decide whether a tool belongs in your revenue stack by checking if it does at least one of these three core jobs:
- Create pipeline by capturing and qualifying demand
- Move deals forward through sales engagement and execution
- Prove revenue impact through attribution and ABM
In practice, most revenue stacks include 4–7 tools spread across marketing, sales, and CRM.
Here’s how this usually plays out.
On the marketing side, teams typically use up to three tools to handle demand generation, attribution, and intent.
- An automation platform for campaigns and lead scoring
- An attribution tool to track what drives revenue
- An ABM or intent platform to identify high-intent accounts
The CRM sits at the center, bringing marketing and sales data together so pipeline and deals are tracked in one place.
On the sales side, teams usually rely on two tools to convert leads and move deals forward.
- A sales intelligence tool for contact and account data
- A sales engagement platform for outreach and follow-ups
{{INLINE_MOFU}}
Types of B2B marketing tools
For marketing tools, there are only three jobs that actually matter:
- Generate demand through campaigns: Ads, emails, nurture sequences that create consistent interest
- Measure which efforts drive closed deals: Full-funnel attribution that ties activity to revenue
- Identify high-intent accounts: Surface which prospects are ready to buy right now
And the tools to get these jobs done are:
Marketing automation platforms
Marketing automation platforms capture leads, run nurture campaigns, and score prospects, all while syncing with your CRM.
What to look for:
- Multichannel automation: Email, ads, LinkedIn, SMS in one workflow
- Clean CRM integration: No broken routing or duplicate leads
- Revenue reporting: Ties activity to pipeline, not just MQLs
1. HubSpot Marketing Hub
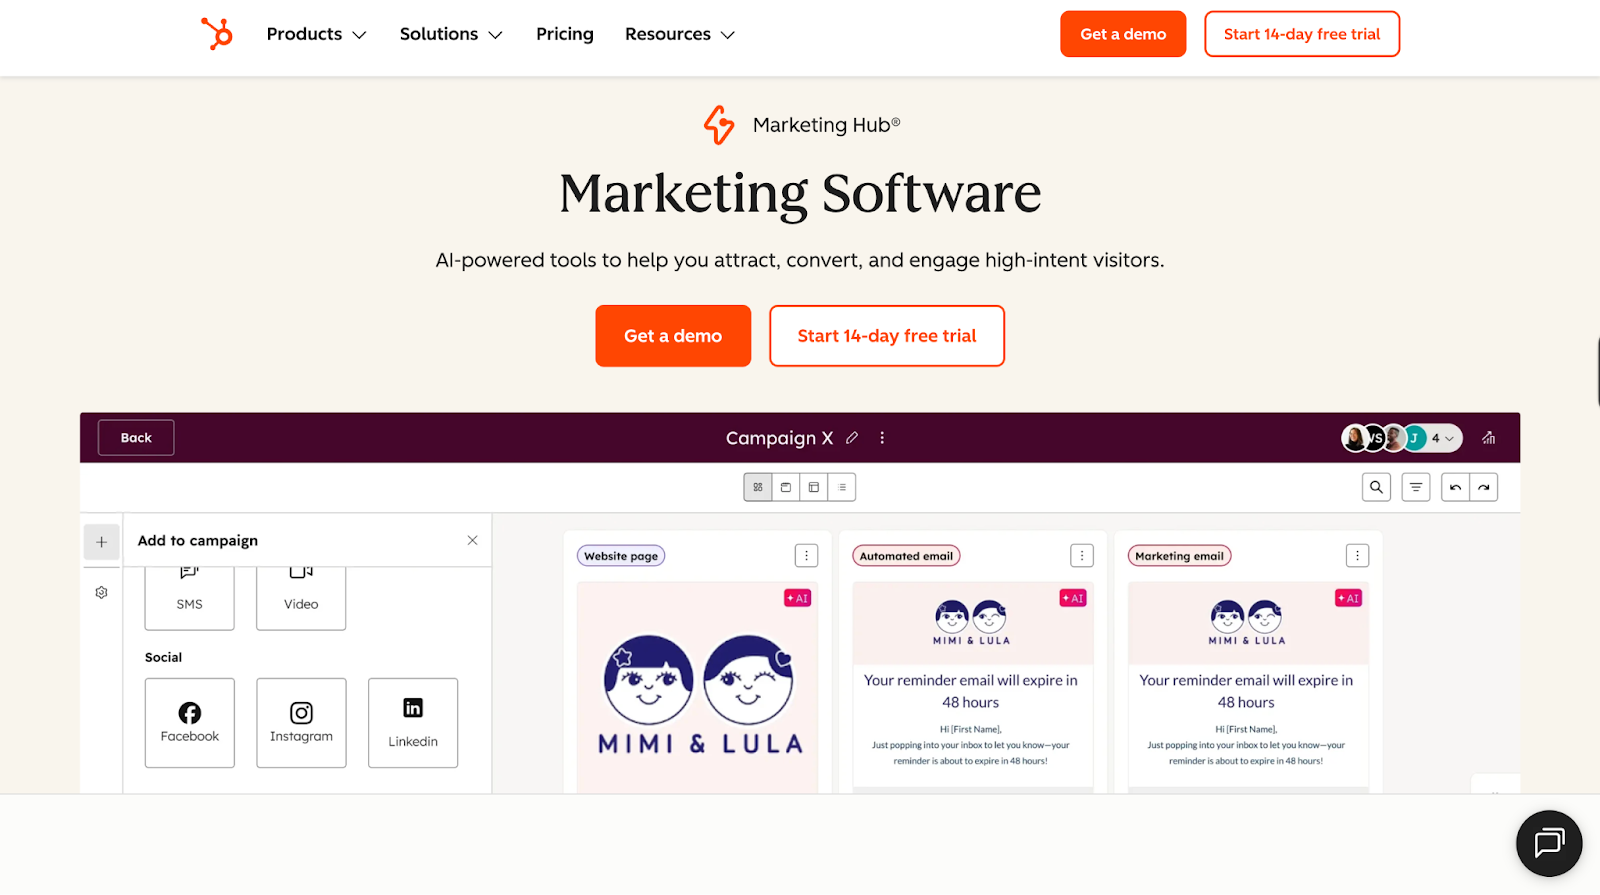
Best for: Small-to-mid-market companies looking for an easy-to-manage automation platform.
Pros:
- Built-in CRM, perfect for HubSpot CRM users
- Intuitive workflows to fast-track campaign launches from months to days
- Low learning curve and fast time-to-value
- Plug-and-play automations, great for companies without a dedicated ops person
Cons:
- Costs rise quickly once you cross 10K contacts ($800+)
- Paywalls for basic features like conditional logic and snippet limits
- Advanced customization, reporting and AI features require add-ons that can reach ~$3,200/month
Bottom Line: Choose this if you value speed and simplicity over deep customization. Budget accordingly because costs climb fast as you grow.
2. Adobe Marketo Engage
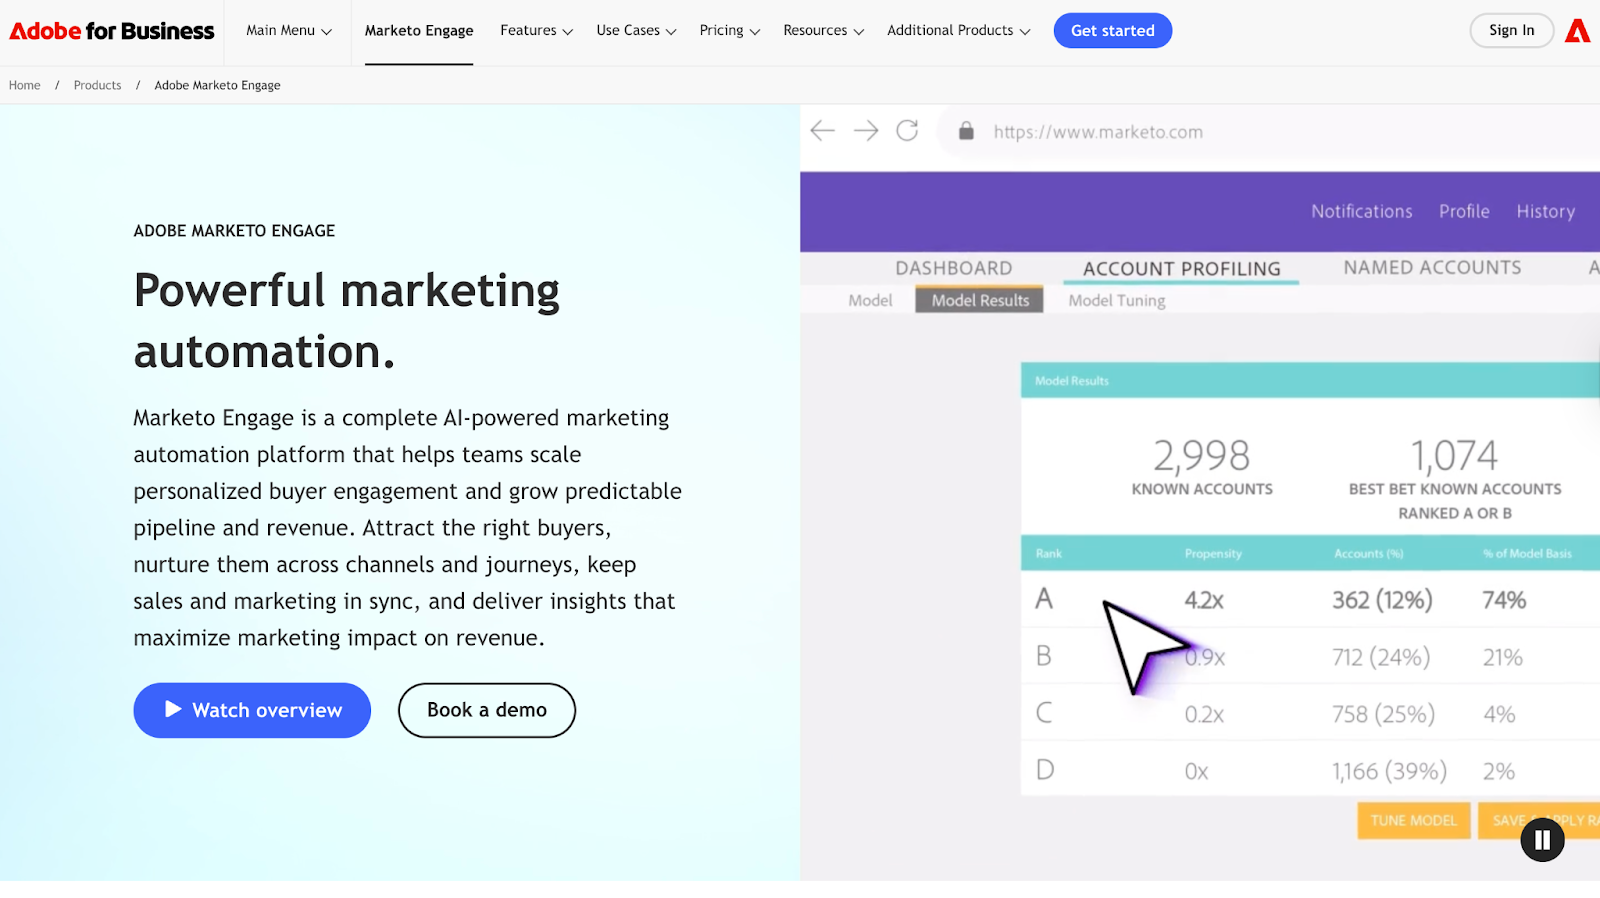
Best for: Enterprise teams with dedicated marketing ops that need advanced workflows and logic.
Pros:
- Powerful segmentation to run highly personalized, multi-step campaigns
- Built for complex use cases across regions, teams, and channels
- Predictive personalization that helps improve engagement at scale
- Works seamlessly with Salesforce and broader Adobe ecosystem
Cons:
- Steep learning curve, but very powerful and flexible once you get past it
- Need Marketo specialists to get the most out of the tool
- Clunky and outdated UX
- Overkill for teams under 50
Bottom Line: Only choose this if you have someone in-house who knows Marketo inside and out. Without dedicated resources, you're paying for features you can't use.
3. ActiveCampaign
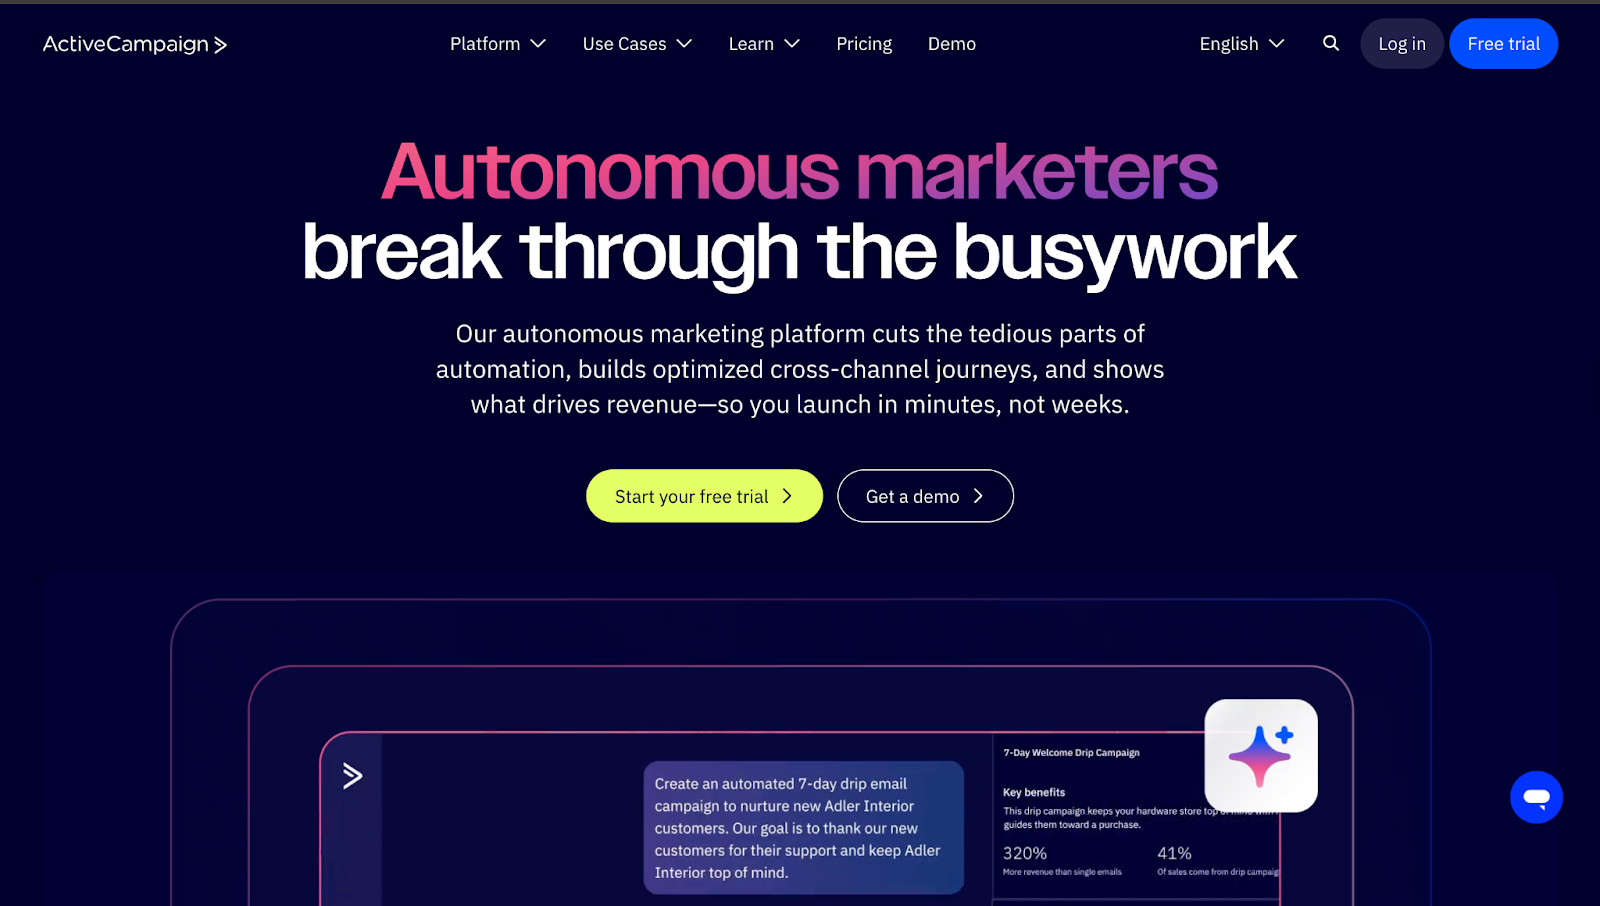
Best for: Budget-conscious startups and growth-stage teams looking for marketing automation with decent CRM features.
Pros:
- Easy to use visual and AI-powered automation builder
- Best for email marketing with a solid deliverability rate of 94.2%
- Great onboarding and support (not paid like HubSpot)
- Integrates with over 1,000+ tools
Cons:
- Limited CRM and CMS depth
- Doesn't offer account-level reporting or advanced attribution
- No sales features like booking links, scheduling, etc.
Bottom Line: Great starter platform for tight budgets, but plan your migration strategy upfront. You'll likely need to upgrade within 18-24 months.
Marketing Attribution Tools
59.4% of B2B teams use marketing attribution tools to end the sales vs. marketing blame game. How? Marketing attribution maps the full buyer journey to show which channels, campaigns, and touchpoints actually influence closed deals, giving both teams clarity on what works.
What to look for:
- Multi-touch attribution: Credit every touchpoint in the journey, not just first or last click
- Account-level visibility: Track all 6-10 stakeholders in the B2B buying committee, not just one lead record
- Automated integration: Clean data from CRM, ads, web, and marketing automation without manual work
4. Adobe Marketo Measure
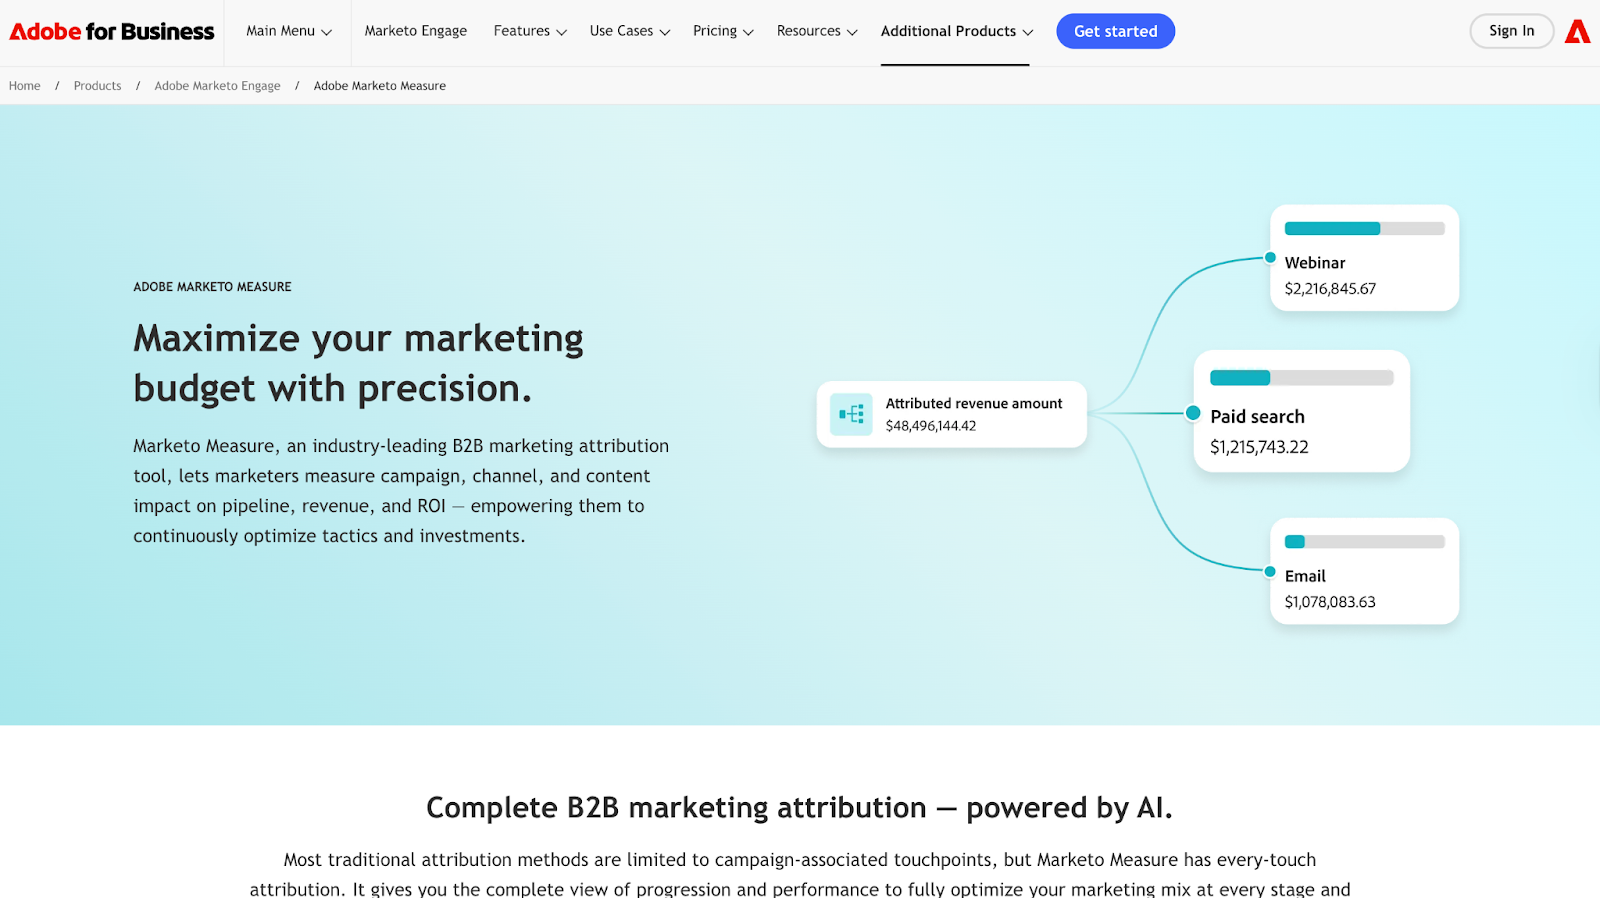
Best for: Enterprise teams already deep in the Marketo/Adobe stack.
Pros:
- Solid multi-touch attribution
- Tracks online + offline touchpoints across the funnel
- Deep Salesforce integration
- Excellent onboarding and customer support
Cons:
- Enterprise-heavy tool with a steep learning curve
- Manual cost entry for ad channels outside Google/Bing/Facebook
- No full-session journey visibility without the Amazon Redshift add-on
Bottom Line: Only worth it if you're committed to the Marketo ecosystem, otherwise you're paying enterprise prices for workflows that still require manual setup.
5. Dreamdata
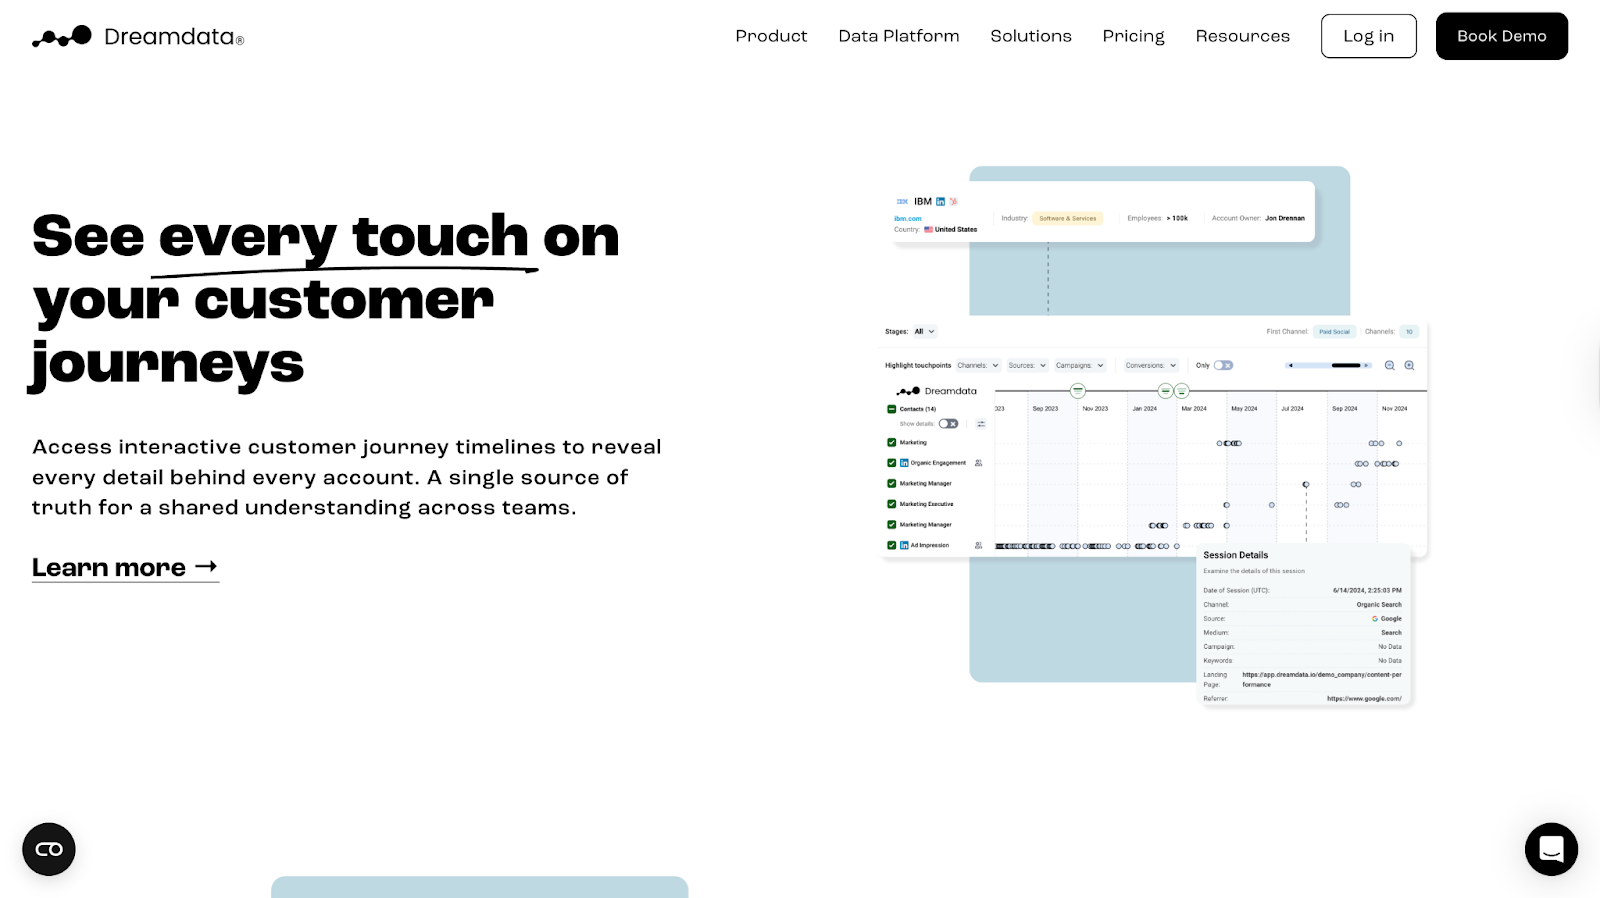
Best for: Mid-market teams that need revenue-linked account journeys without enterprise complexity.
Pros:
- Deep account-level visibility with journey maps and timelines
- Strong multi-source stitching across ads, web, and CRM
- Seamless LinkedIn ad data capture via CAPI integration
- Clean CRM syncing with HubSpot, Pipedrive and Salesforce
Cons:
- 5-10 seat caps per tier, teams outgrow it fast
- Limited reporting flexibility for complex RevOps questions
- UI feels dated compared to newer attribution tools
Bottom Line: Solid mid-market pick for account journey clarity, but you'll feel the limits as the team scales.
💡Also Read: Factors Vs DreamData and Factors Vs Marketo Engage (Bizible)
6. Factors.ai
Best for: High-growth B2B teams needing attribution + account intelligence without enterprise complexity.
Pros:
- Unlimited seats, perfect for high-growth teams
- Endless custom user stage models to segment leads
- Dedicated support on all plans, unlike Dreamdata
- More out-of-the-box integration options compared to Marketo Measure (9 vs 6)
- Onboarding in less than 30 minutes
- Larger IP database than Demandbase (4.6M vs 3.6M)
- LinkedIn AdPilot shows which companies saw ads and returned
- Doesn't deanonymize individual contacts
Cons:
- Doesn't integrate with Microsoft Dynamics 365
- There's a learning curve for custom reporting and advanced setup
- Doesn't deanonymize individual contacts
Bottom Line: Great for teams looking to cut stack bloat. Attribution + account intelligence + ABM in one tool. Expect a light learning curve as you scale into custom reporting.
💡Also Read: How Squadcast used Factors to reduce prospecting time by 25% using Factors.ai's account intelligence
ABM Tools
ABM tools identify which accounts are in-market right now, so sales stops playing eeny-meeny-miny-mo with leads who downloaded a PDF versus those checking pricing three times.
ABM-aligned companies grow revenue by 208% and increase profits 27% over three years.
What to look for:
- Account identification and intent signals: Who's in-market and what they're researching
- Cross-channel orchestration: Run LinkedIn, email, display ads, and direct mail from one place
- Shared account intelligence: Everyone sees the same signals and buying behaviors
7. 6sense
Best for: Enterprise GTM teams with strong RevOps support managing 200+ accounts per SDR.
Pros:
- Identifies accounts to prioritize from large lists
- Strong Salesforce fit once configured
- Catches early intent like competitor spikes or category interest
Cons:
- Needs a dedicated RevOps owner
- Data accuracy issues (stale contacts, false positives)
- Weak EMEA coverage
Bottom Line: Best for complex enterprise sales. Smaller teams struggle to get value, and it becomes shelfware.
8. Demandbase

Best for: Enterprise teams running heavy paid ads targeting full buying committees.
Pros:
- Strong account-level ad targeting across buying groups
- Hands-on support
- Integrates with Salesforce, HubSpot, Marketo, LinkedIn
- ABM + light sales intelligence in one
Cons:
- Intent signals need manual validation
- Limited segmentation
- Outdated UX
Bottom Line: Works well for big-budget ads. Less useful for outbound sales teams.
The CRM: Where marketing and sales data connect
Without a shared CRM, marketing can't prove ROI, and sales can't see buying signals. 90% of executives say unified customer data is critical; it's the difference between aligned teams and constant firefighting.
Your CRM is that single source of truth. Marketing tracks engagement and attribution. Sales logs calls and moves deals. Both teams work from the same data.
What to look for:
- Bi-directional sync: Marketing pushes leads in, sales pushes deal data back out
- Full-funnel visibility: Track from first touch to closed revenue in one system
- Automatic logging: Emails, calls, meetings, and campaign activity captured without manual entry
9. Salesforce
Best for: Enterprise GTM teams with complex processes and a Salesforce-centric revenue stack.
Pros:
- Highly customizable for intricate workflows
- Strong enterprise-grade security and governance
- Integrates well with tools across the revenue stack
- Deep automation + strong reporting with cross-team visibility
Cons:
- Requires a dedicated ops/admin owner
- Expensive as you scale modules and seats
- Steep learning curve for non-technical users
Bottom line: Strong choice for teams with ops support, heavy customization needs, and cross-visibility requirements. Lean teams may struggle with the overhead.
10. HubSpot CRM
Best for: Small–mid GTM teams who want fast adoption, tight marketing alignment, and minimal admin support.
Pros:
- Sales + Marketing data in one system, lifecycle clarity without stitching tools
- Integrates well with tools already in your revenue stack (Outreach, Gong, Factors, Marketo, etc.)
- Easy to set up, less dependence on RevOps
- Works well for simple pipelines and straightforward GTM motions
Cons:
- Less flexible data model than Salesforce
- Annual contracts, cancellation is cumbersome
- Advanced reporting and automation sit behind higher tiers
Bottom line: Perfect for basic CRM + marketing flows, but not ideal if you need heavy customization, deep reporting, or complex workflows.
11. Zoho CRM
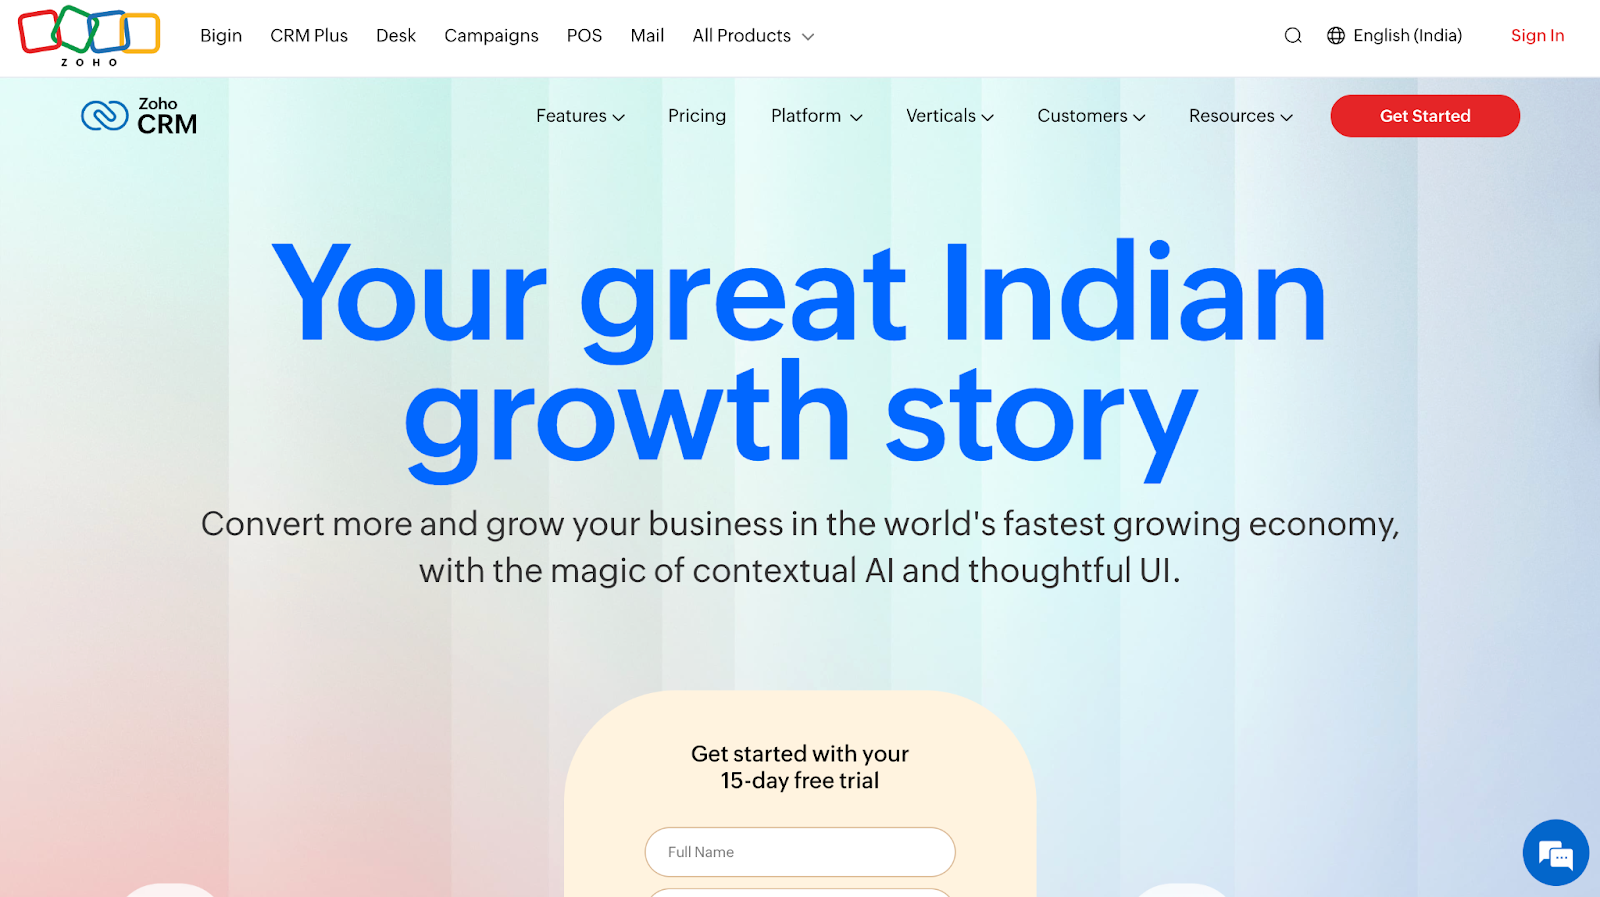
Best for: Budget-conscious, sales-driven teams that need CRM + ops + support in one place, and have basic ops/admin help for setup and upkeep.
Pros:
- CRM + email marketing + support desk + basic workflows in one suite
- Highly customizable for ops-heavy teams
- Low per-seat cost compared to HubSpot (good for scaling)
- Integrates with common GTM tools (LinkedIn Sales Navigator, Zapier, Slack, Google, Factors, Outreach, Gong)
Cons:
- Clunky UI, steeper learning curve
- Reporting and automation often need custom work
- Requires ongoing ops/admin ownership
Bottom line: Works well for custom ops setups, not the best if you need a simple, rep-friendly CRM.
Types of B2B Sales Tools
Once leads get qualified, it’s the sales team’s job to move them toward conversions. At this stage, they mainly focus on three jobs:
- Track every deal in one place: A CRM that stores contacts, conversations, and opportunities.
- Find the right people inside each account: Sales intelligence that identifies decision-makers and champions.
- Reach them efficiently: Engagement tools that automate outreach, schedule meetings, and reduce friction.
And the tools to get these jobs done are:
Sales Intelligence Tools
ABM shows which accounts are ready. Sales intelligence tools show who to contact within those accounts, along with their roles, seniority, buying authority, and engagement signals.
Two people from the same account may see your content, but only one is checking pricing or has decision-making power. Sales intelligence tools make that clear, so reps don't waste time.
What to look for:
- Fresh, accurate data: 70%+ verified contacts with weekly updates, stale data means bounced emails and dead calls
- Complete contact profiles: Direct dials, emails, LinkedIn URLs, roles, and job changes
- Account structure visibility: Org charts and buying committees to navigate multi-stakeholder deals
12. LinkedIn Sales Navigator
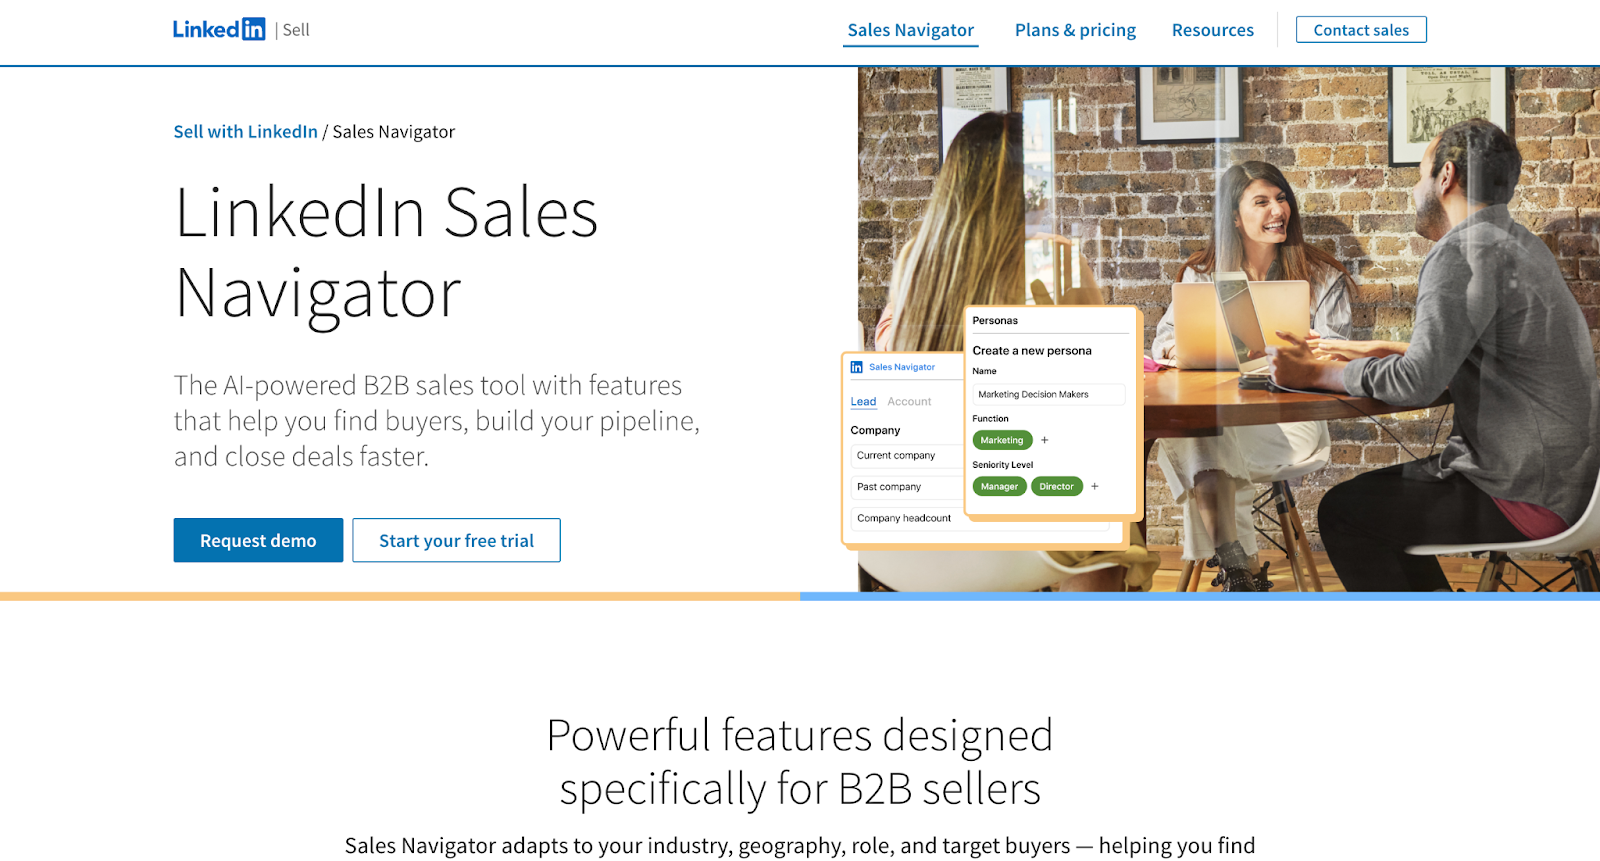
Best for: Teams doing high-volume LinkedIn outreach or social selling
Pros
- Advanced filters for B2B prospecting (function, growth signals, Boolean)
- Real-time signals (job changes, role updates, company news)
- Great for identifying decision-makers and mapping org structures
- Integrates with major CRMs (Salesforce, HubSpot, Zoho)
Cons
- Scraping/export automations carry real account-ban risk
- Native exports are limited, third-party tools needed
- High per-seat cost
Bottom line: Perfect for targeting and intelligence inside LinkedIn, but you’ll still need another tool for verified emails and mobile numbers.
13. ZoomInfo
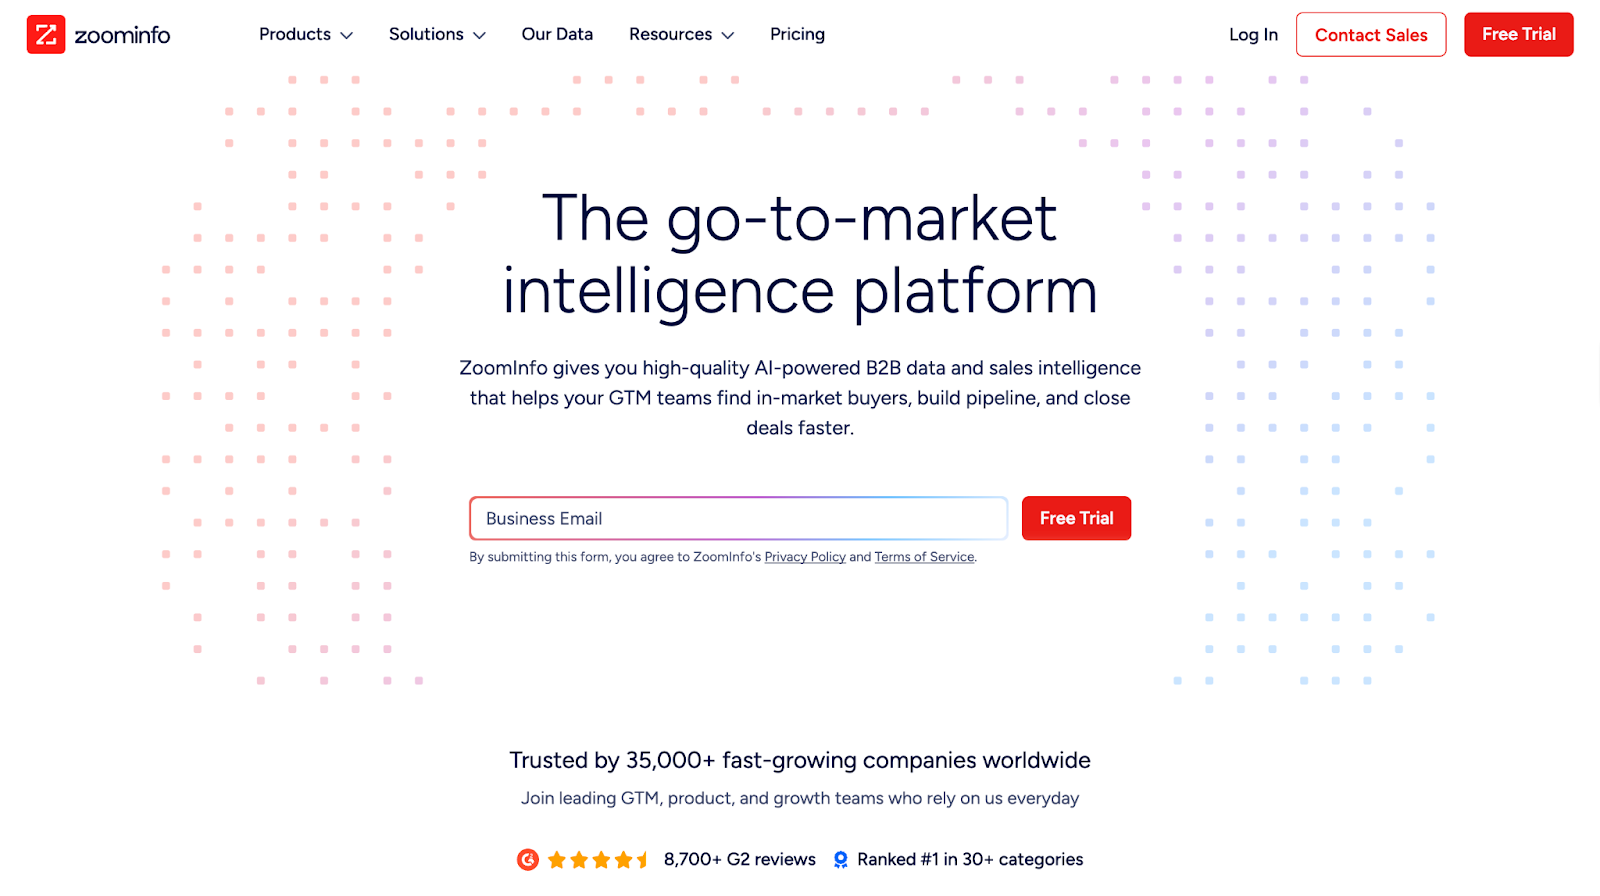
Best for: US outbound teams needing comprehensive contact data and org charts
Pros
- 85% data accuracy
- Fast enrichment and one-click CRM pushes
- Deep contact & account coverage - direct dials, verified emails, buying-committee visibility
- Strong intent signals and internal buying triggers that help prioritize in-market accounts
- Highest hit-rate for US tech + mid-market/enterprise personas
Cons
- Very expensive compared to Apollo, and Lusha
- EMEA/APAC data coverage is weaker and less reliable than US
Bottom line: Industry leader for data depth and accuracy. Expensive but worth it for teams doing serious outbound at scale.
14. Apollo
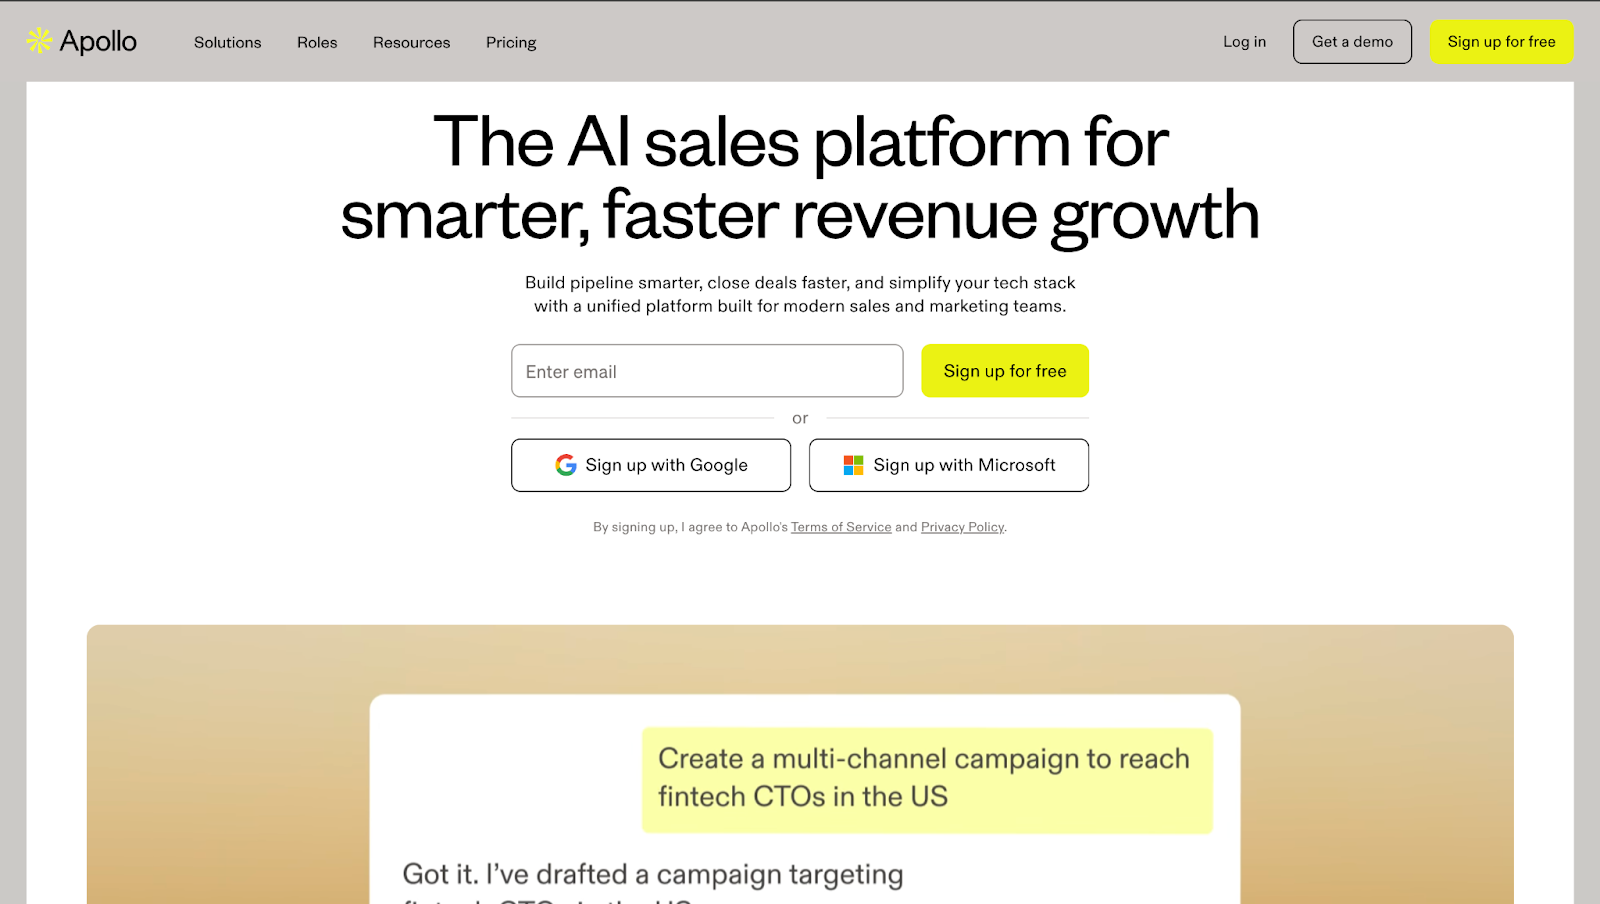
Best for: Budget-conscious GTM teams that want broad contact coverage, built-in outreach, and solid data without enterprise-tool overhead.
Pros:
- 210M+ contacts, 35M+ companies (70–80% accuracy)
- Strong value for price, ZoomInfo-like depth at lower cost
- Easy CRM integrations (HubSpot, Salesforce, Zoho, Pipedrive)
- Prospecting + sequencing in one platform across all paid plans
Cons:
- Phone/mobile accuracy weaker compared to ZoomInfo
- Data freshness varies, some roles outdated
- Daily send limits on lower-tier plans
Bottom line: ZoomInfo-level depth at a more competitive pricing. Expect 10–15% lower accuracy but 40–50% cost savings.
You can also pair Apollo with Factors.ai to identify and score in-market accounts first, then pull contact details for faster, higher-quality outreach.
Sales Engagement Tools
Sales engagement tools handle the repetitive work (sequences, follow-ups, meeting scheduling, next-step suggestions) so reps can focus on selling, not admin.
What to look for:
- Multichannel sequencing: Email, LinkedIn, calls, SMS, and follow-ups from one place
- Built-in calling + meetings: Native dialer with recordings and frictionless scheduling
- Personalization at scale: Dynamic fields and clear reply/meeting metrics
15. Klenty
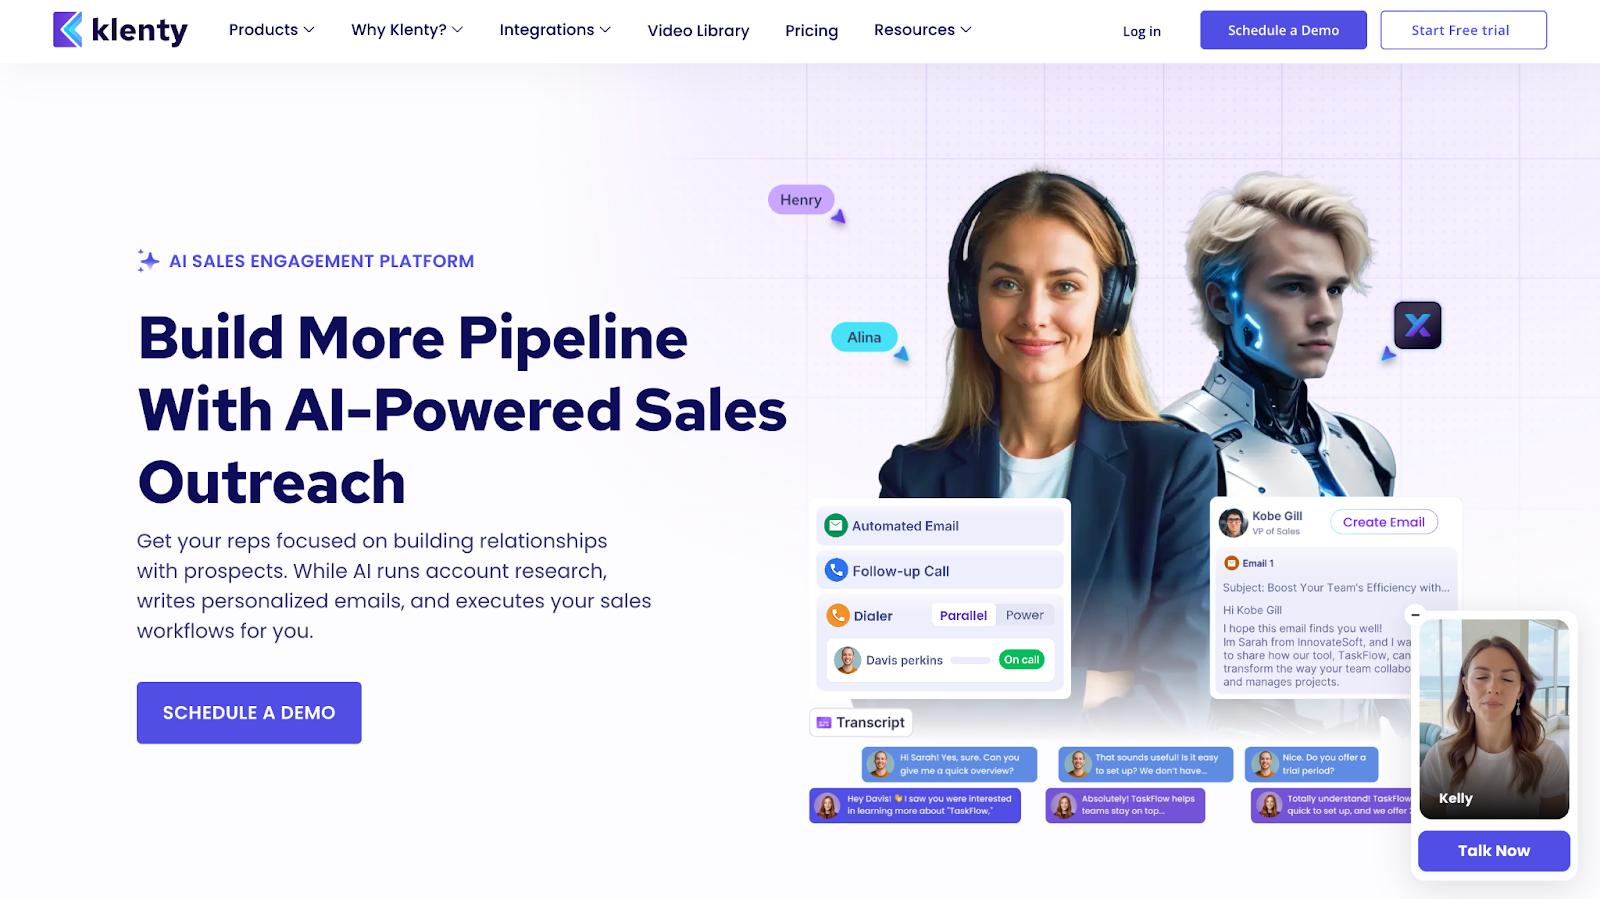
Best for: Small–mid sales teams that want fast, email-first outreach, smooth CRM syncing, and minimal setup.
Pros
- Lightweight to operate, no admin or training needed
- Strong email sequencing with high-volume support
- Built-in deliverability boosters (random send intervals, mailbox rotation)
- Smooth CRM integrations (HubSpot, Salesforce, Pipedrive, Zoho)
Cons
- Limited LinkedIn automation
- Paywalled features on lower plans
- Less customization than bigger platforms
Bottom line: A fast, no-friction outreach tool for email-first teams. Great for simple, high-volume execution, not the choice if LinkedIn or deep customization matters.
💡Case study: Klenty increased conversion rate by 34% using Factors.ai's intent data for sequence triggering.
16. Salesloft
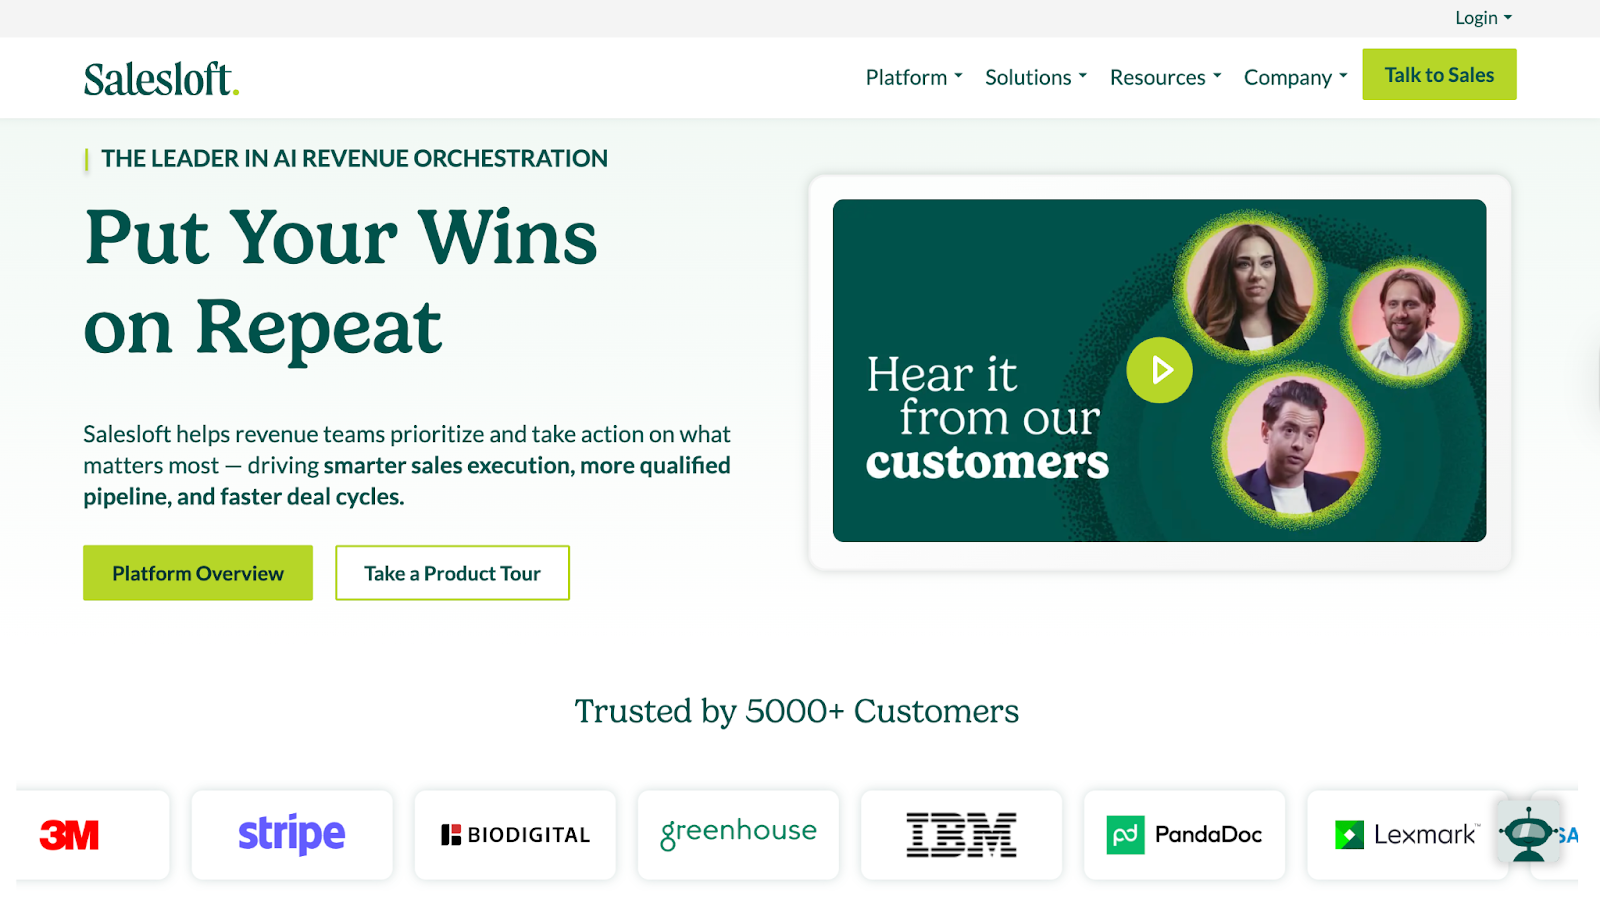
Best for: Mid to large sales teams running multichannel outreach who need deep Salesforce integration, deep reporting and analytics
Pros
- Powerful multichannel cadences across email, calls, LinkedIn
- Deep Salesforce integration with reliable bi-directional syncing
- Strong analytics, activity dashboards, and AI-driven task prioritization
- Conversation intelligence and deal insights for pipeline visibility
Cons
- Steep learning curve for new users
- Higher cost than most alternatives
- UI can feel heavy or cluttered for simple outreach needs
Bottom line: Strong for pipeline visibility and deep CRM integration. Skip if you need lightweight tools or tight budgets.
17. Outreach
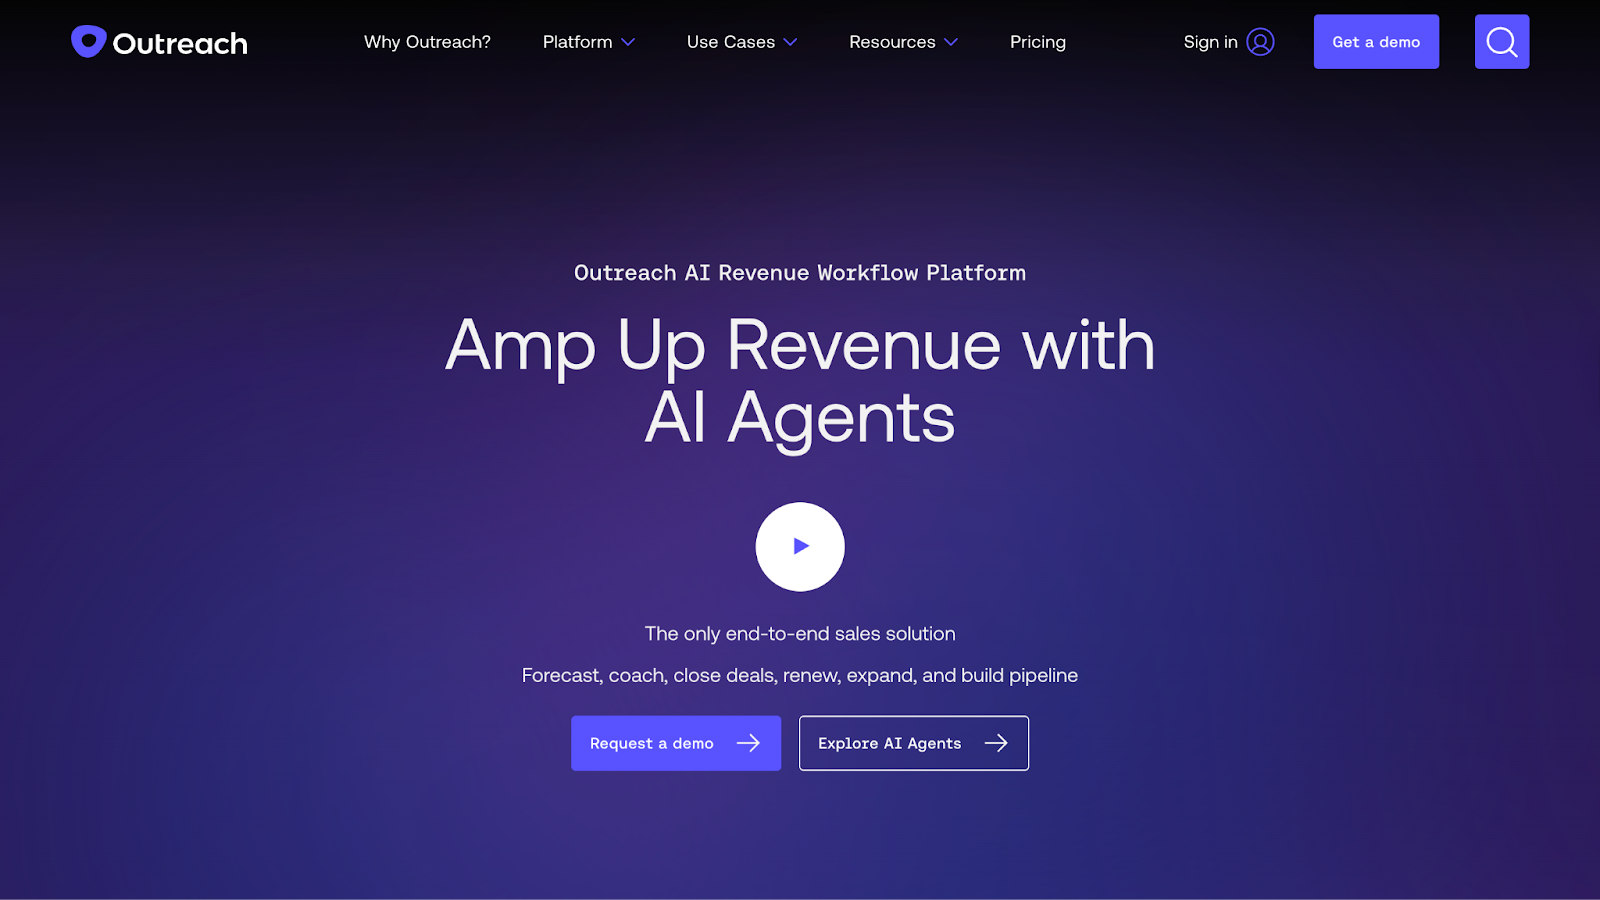
Best for: Enterprise teams that need deep visibility into pipeline activity and one system to manage outreach, calls, and deal tracking.
Pros
- Clear visibility from lead handoff to closed deal
- Outreach + conversation intelligence + revenue forecasting in one tool
- Great option for enterprise teams
- Handles high-volume outreach without breaking down
Cons
- Overly complicated UI
- Unresponsive customer support
- Limited automation flexibility
Bottom line: Best for enterprise teams needing forecasting and conversation intelligence in one platform. Too heavy for lean teams with under 50 reps.
💡Also Read: How Klenty increased their conversion rate by 34% with Factors.ai
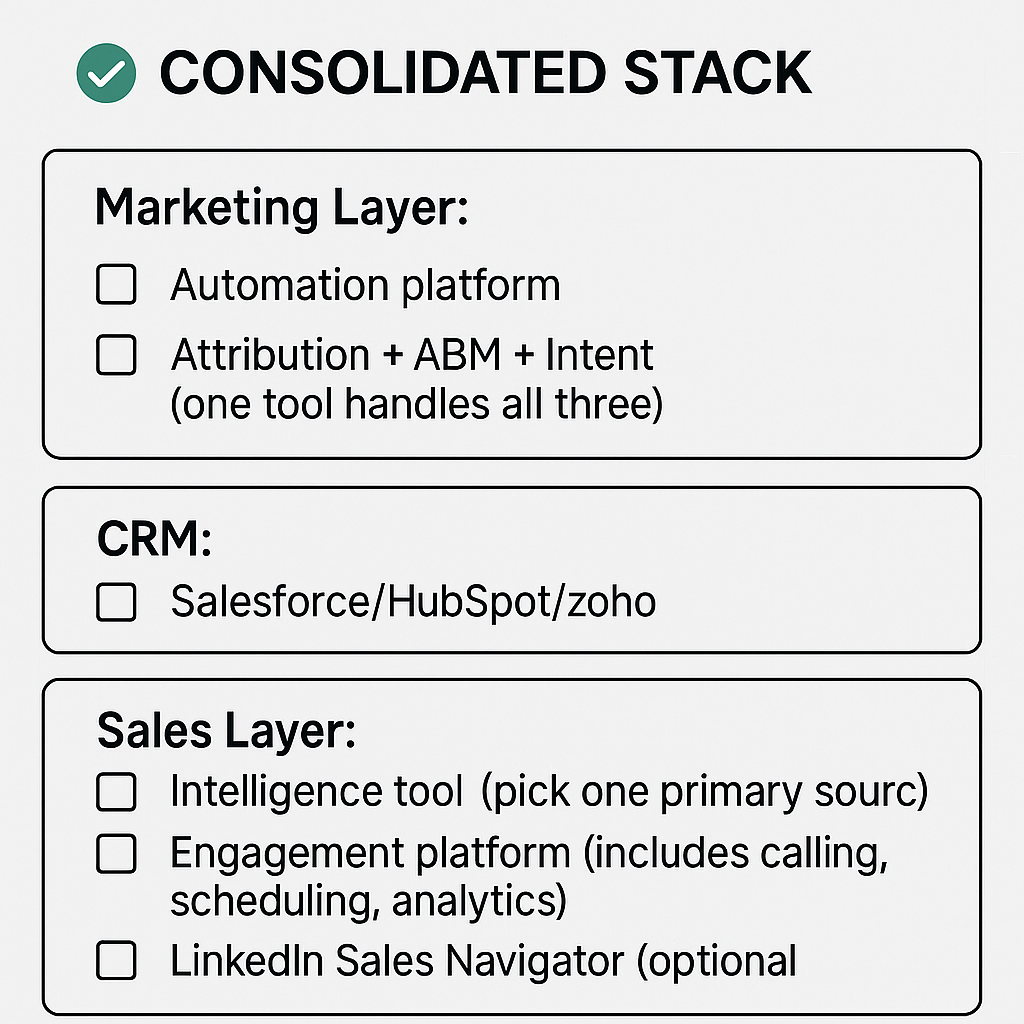
Consolidation opportunities: How to cut your stack from 16 to 6 tools
AI Sales Tools: Do you need them?
Searches for ‘AI sales tools’ and ‘sales AI tools’ are exploding. Threads list 70 plus options. But here’s the thing: You probably already have AI.
Look at what you already have:
- HubSpot / Marketo → AI lead scoring, send-time optimization
- Factors.ai / Dreamdata → ML-driven conversion prediction + account scoring
- Klenty / Salesloft → AI email writing, call summaries, next-step suggestions
- Salesforce → forecasting, opportunity scoring, pipeline health
- Outreach / Gong → AI deal insights, risk detection, talk-track breakdowns
- ZoomInfo → intent scoring + predictive buyer signals
- Apollo → AI research + AI scoring baked in
But none of it is useful in isolation. Unless every tool is integrated with your CRM, you only get a partial picture or end up spending time shuttling between multiple tools. AI is only as good as the data it’s fed.
How to choose the right marketing and sales tools?
Choosing the right sales and marketing in 2026 can be quite overwhelming. You open one blog and find 47 "best tools" lists. G2 shows 4.7 stars, but reviews say "great for enterprises, terrible for teams under 50." Three hours later: 23 tabs open, zero decisions made.
If that sounds like a day in your life, here’s how you can evaluate what belongs in your revenue stack:
1. Start with the gap, not the category
Ask: "What's actually breaking in our funnel?" Map the tool to your buyer journey. If prospects drop off after initial engagement, you need nurture automation. If sales can't tell who's serious, you need intent signals.
2. Integration with your CRM
No tool is worth buying if it doesn't sync cleanly with your CRM. Broken integrations create more problems than they solve. Check for native integrations first, not just ‘API available.’
3. User experience
Let your team decide. Take free trials to gauge ease of use. If reps won't use it, it's wasted budget.
4. Security and AI transparency
Ask: Where does the data come from? Does the AI learn from your closed deals or generic patterns? For sales intelligence tools, verify 70%+ data accuracy.
5. Pricing and contract terms
Calculate total cost: seat licenses, onboarding, training, and admin time. Before signing, confirm you can scale or cancel mid-contract.
Next Steps: Your 3-Step Stack Audit
Step 1: Map your current sales and marketing tools against the revenue stack
List every tool you're paying for. Which category does it serve? Look for functional overlaps. For example, if you have 2 tools doing attribution, you've found bloat.
Step 2: Look for consolidation opportunities
- Paying for attribution + ABM separately? Consolidate to one platform (like Factors.ai)
- Have ZoomInfo and Lusha? Choose one that offers deeper intelligence
- Using multiple engagement tools? Pick one that includes calling, sequencing, and scheduling
Step 3: Test before you cut
Run free trials for at least a month on new tools before replacing the older ones. If adoption sticks and data flows cleanly to your CRM, make the switch.
And that's how you build a sales and marketing tool stack that does more with less.
Start here: Try Factors.ai free to consolidate attribution + ABM + intent in one platform.
FAQs for Marketing and Sales Tools
1. What are marketing and sales tools?
Marketing and sales tools are platforms that generate demand, nurture leads, and convert customers. They include SaaS marketing tools, CRMs, ABM platforms, sales intelligence tools, and sales engagement software.
2. What are AI sales tools?
AI sales tools (also called sales AI tools) use artificial intelligence or machine learning to automate sales tasks like lead scoring, content generation, call/email assistance, and account research. Unlike normal automation that uses if-then clauses, AI learns from past wins to figure out the next best steps.
3. How is machine learning used in sales?
Machine learning automates a variety of sales tasks, including churn prediction, lead scoring, forecasting accuracy, and deal health scoring. These tools gauge buyer behavior and historical performance to determine the best way forward to move deals across the pipeline.
4. What are the best AI tools for sales?
The best sales AI tools depend on your tech stack, CRM, team size, and workflows. Pick based on the biggest gap in your funnel, whether that's assistants/copilots, predictive forecasting, or prospecting tools.
5. What are business development tools?
Business development tools (also called sales development tools) help teams find new opportunities and reach out to them. This includes prospecting platforms, sales intelligence tools, meeting-scheduling software, proposal tools, and LinkedIn-based outreach tools.
6. What are SaaS marketing tools?
SaaS marketing tools are platforms designed to help software companies attract, engage, and convert customers through digital channels like email, content, SEO, and paid advertising.
.avif)
How to Establish a Comprehensive Content Ecosystem for Your Brand
A comprehensive guide on how to set and run a comprehensive content ecosystem for your business

Digital marketing has become increasingly important in recent years as more and more people spend time online. In fact, according to a recent study by Statista, over 5.3 billion people use the internet worldwide. This means that digital marketing is a great way to reach a large and engaged audience.

Content plays an increasingly central role in modern marketing strategies. In the current landscape, 82% of marketers invest in content marketing, with short-form video taking center stage as it delivers high ROI and is the trend that will see the most growth in the near future.
Furthermore, 71% of B2B marketers believe content marketing has become more important to their organizations in the last year. With these statistics in mind, it’s clear that establishing a comprehensive content ecosystem is essential for any brand looking to thrive digitally.

All these digital tools require content. Content in digital marketing refers to any type of information that is created and shared online to promote a brand or product. This can include blog posts, articles, infographics, videos, podcasts, social media posts, and more.
The role of content in modern marketing strategies
Content is essential for promoting your business or product brand in today's digital world. It helps your business to achieve several important goals, including:
- Increase brand awareness and visibility: When your business creates and shares high-quality content regularly, you increase the chances of being seen by potential customers.
- Drive traffic to your website: Content can be used to attract visitors to your business's website through search engine optimization (SEO) and social media marketing.
- Generate leads and sales: You can use content to generate leads and sales by offering valuable information to potential customers in exchange for their contact information.
- Build trust and credibility: When your business consistently creates and shares high-quality content, you build trust and credibility with your target audience.
- Position your business as an expert in its field: By creating and sharing content that demonstrates its expertise in its field, your business can be positioned as thought leaders and attract more customers.
But the creation and distribution of content is not a simple, “click the button and you are done” task. It requires time and investments to make sure that the content is suited to your business and its audience and is relevant over a long period.
For this, you must develop a “content ecosystem” that covers all your products, brands, types of content, content teams, technologies, and distribution channels.
This blog will cover the main elements of a content ecosystem. It will highlight the importance of building an ecosystem, its components, the steps to create an actionable ecosystem, and the benefits of a well-designed content ecosystem.
What is a content ecosystem?
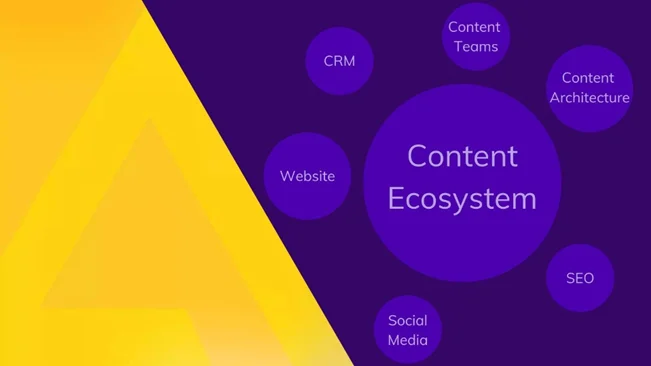
A content ecosystem refers to how the publication of content fits into the broader context of an enterprise. It is a strategic network of interconnected content assets that work together to achieve a common goal such as increasing brand awareness to generating leads and sales.
A robust content ecosystem is built upon five critical pillars:
- Content strategy
- Governance
- Creation
- Distribution
- Analytics
These components work in harmony to ensure that content is not only created and shared across the right channels but also analyzed for effectiveness, allowing for data-driven decisions to refine the strategy and content offerings.
But where does a content ecosystem fit within broader content marketing and digital marketing strategies?
Content ecosystems enable businesses to create and distribute content to the right people at the right time. They are a critical component of broader content marketing and digital marketing strategies. Here's why:
- Strategic Integration: Content ecosystems integrate with broader marketing strategies, ensuring content reaches the right audience when it's most impactful.
- Holistic Framework: They offer a structured approach, mapping out how different content pieces interconnect and support each other.
- Streamlined Process: Ecosystems streamline content production, promoting efficiency and the reusability of content assets.
- Optimization: They ensure content is crafted for maximum relevance and engagement, ready for multi-channel distribution across diverse platforms, broadening reach and enhancing brand visibility.
- Lead Generation: Through high-quality content, ecosystems attract site visitors, generate leads, and help convert these leads into sales.
Why does your company or brand need a content ecosystem?
Joe Pulizzi, Founder of Content Marketing Institute, says "A content ecosystem is a living, breathing thing. It's not just a collection of content assets. It's a network of interconnected content that works together to achieve a common goal."
{{INLINE_TOFU}}
What are the core components of a content ecosystem?
The core components of any content ecosystem include:
- Content Types: This includes both core content like website pages, product descriptions, FAQs, and supplementary content such as blogs, whitepapers, ebooks, social media updates, videos, podcasts, and case studies. The diversity in content types serves various objectives, from customer acquisition and retention to establishing industry thought leadership.
- Content Governance: These are the policies, practices, and standards that oversee the development, management, and dissemination of digital content within an organization. It ensures content aligns with the brand's messaging, values, and legal requirements, and involves defining roles and responsibilities among content creators.
- Content Creation: This is the process of generating digital content across different formats, designed to appeal to the target audience and presented in an easily digestible manner.
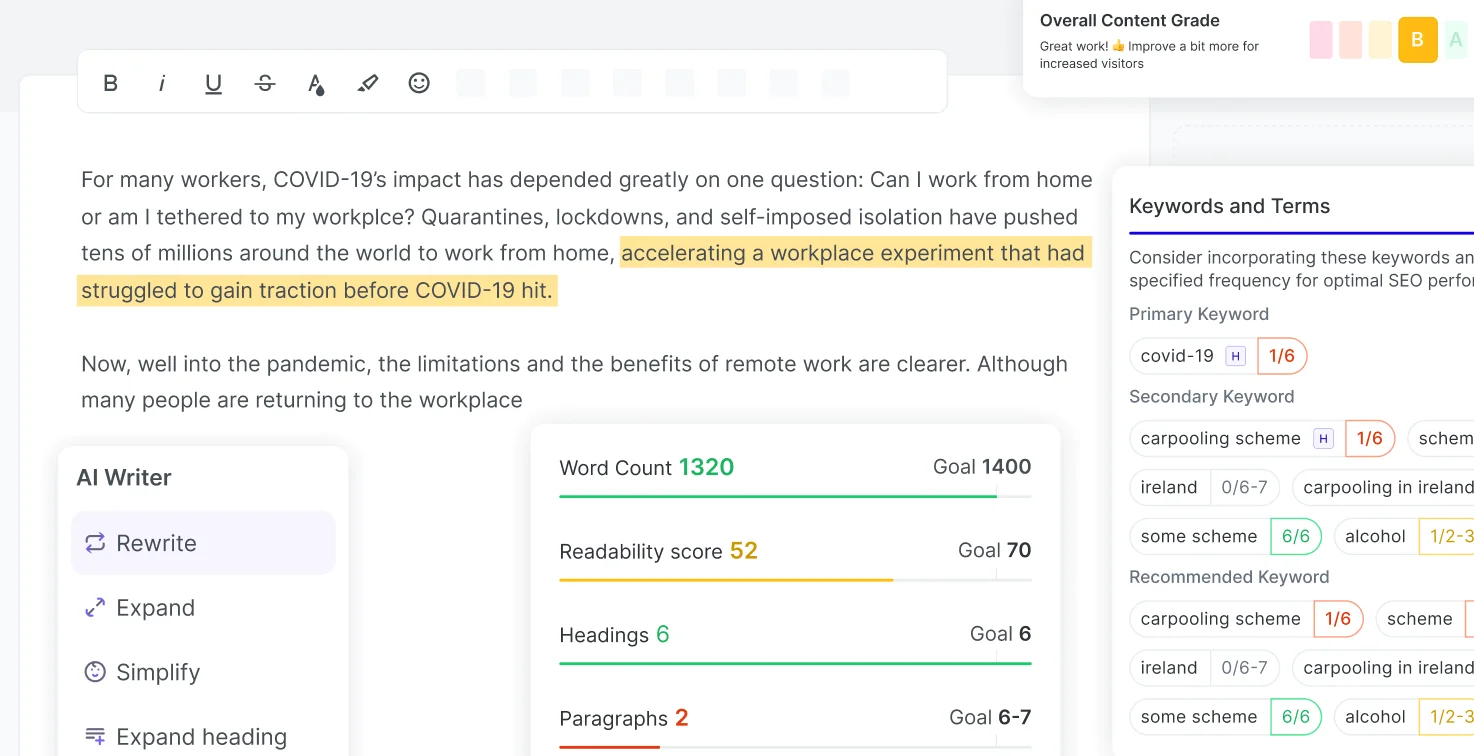
Did you know that Pepper CMP's Pepper Docs comes with an inbuilt SEO Grader that analyzes your content and grades it? Furthermore, you can use AI Writer to leverage the power of generative AI to improve your content, check plagiarism and readability scores, optimize your content for the SERPs with the SEO Guidelines feature, and more.
- Content Distribution: It involves the strategic sharing of digital content through chosen platforms like websites, email newsletters, and social media channels, tailored to the audience's consumption preferences.
- Content Analytics: This aspect refers to the measurement of content's success, monitoring metrics like website traffic, engagement, and conversion rates to inform data-driven improvements in the content strategy.
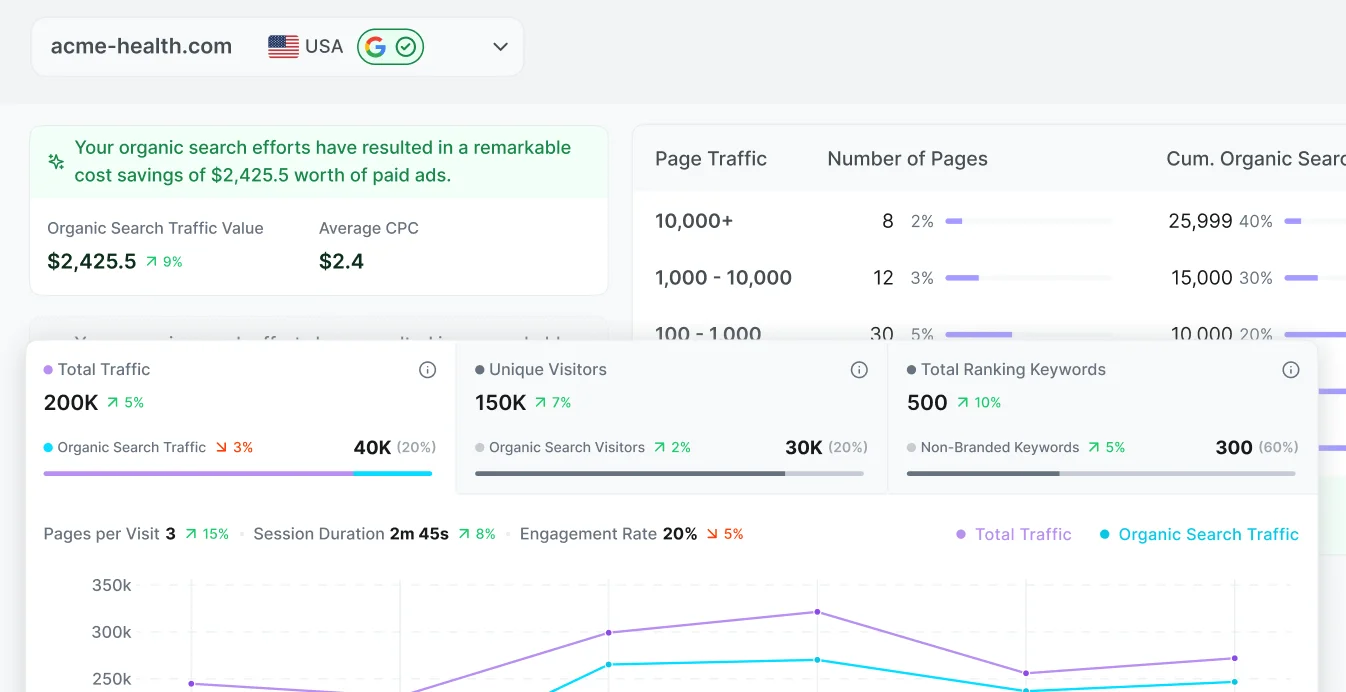
For example, Pepper CMP's Content Analytics and ROI feature not only helps you track KPIs such as traffic, engagement rate, and session durations, but it also fetches the dollar value of your content with insights such as organic search traffic value and average cost per click (CPC) so you can always stay on top of your ROI game.
- Content Platforms: Content platforms such as CMS, marketing automation tools, and digital asset management systems are used to produce, curate, and manage content.
How should you establish your content ecosystem?
You need to establish your content ecosystem in a way that supports your goals. The following steps can help you establish a robust ecosystem:
Step 1: Define your goals and conduct content research
Before diving into content creation, it's important to define your goals and conduct thorough research. Answer questions like:
- What values and messages do you want to convey?

Pepper CMP's Content Idea lab, for example, is an excellent tool that will help you with a seamless content ideation process. You can discover keywords, get outline recommendations, generate topic suggestions, and more — all while keeping track of parameters such as search volume, intent, ranking difficulty, etc.
- Who is your target audience?
- What are your competitors doing in the content space?
This will help you understand your target audience, identify relevant keywords, and develop a content strategy that aligns with your business objectives.
Step 2: Develop a Content Strategy
A well-thought-out content strategy is the backbone of a successful content ecosystem. It involves planning the type of content you want to create, the platforms you want to utilize, and the goals you want to achieve. Your strategy should be tailored to your brand's unique needs and objectives.
.webp)
Step 3: Create High-Quality Content
Whether it's blog articles, social media posts, or videos, make sure your content is of high quality and value-driven. This means it should be informative, engaging, and visually appealing. When creating content:
- Understand your audience’s search intent, that is, whether navigational, educational, commercial, or transactional.
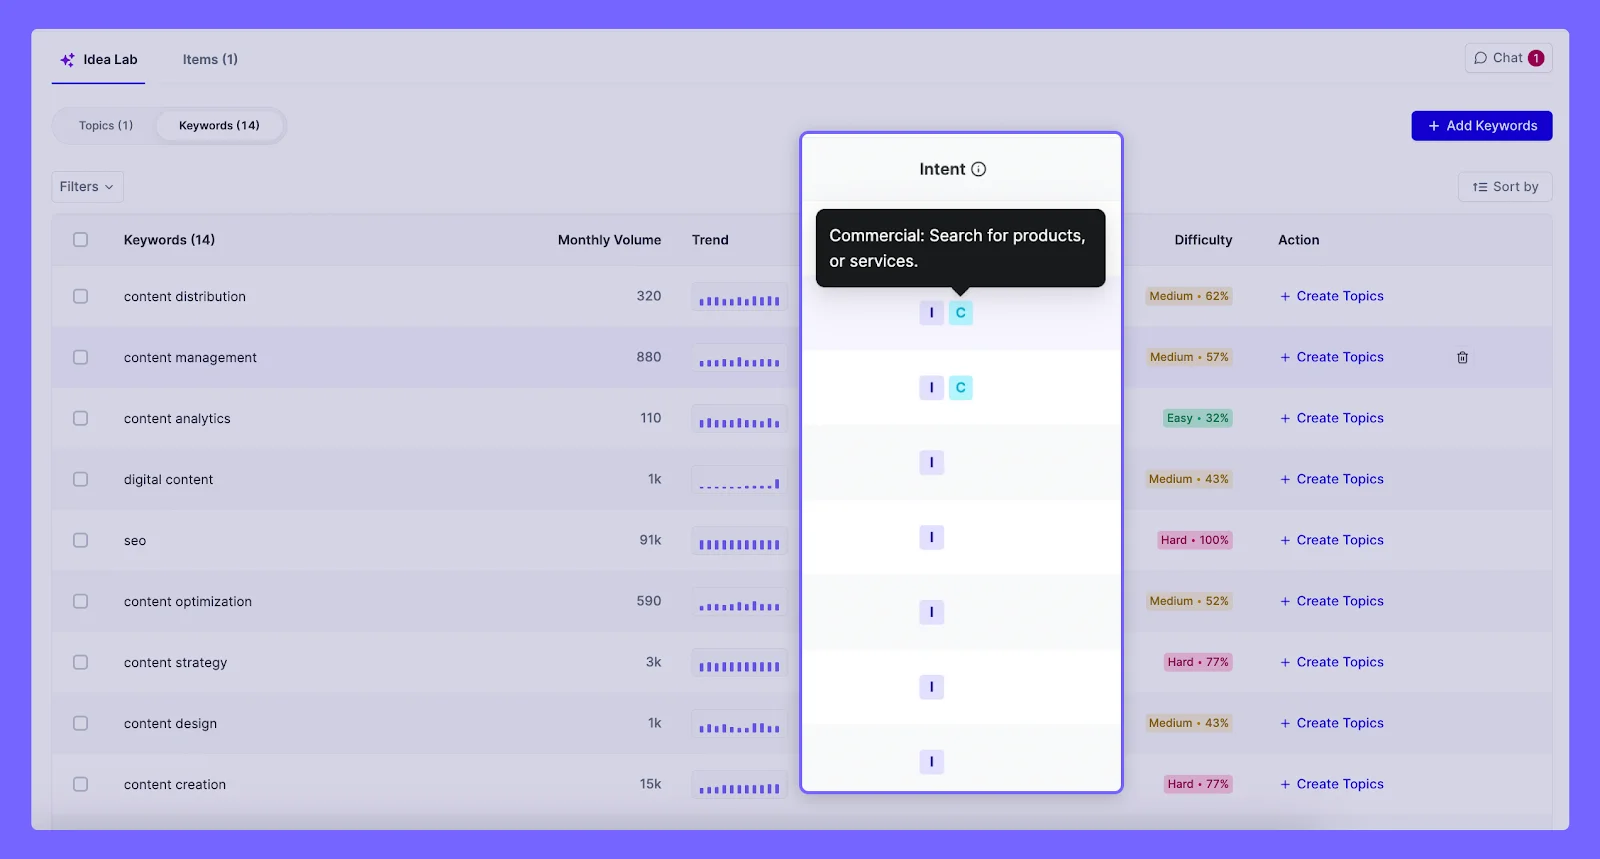
Here's an example of Pepper CMP's Discover Keywords feature that gives intent and other parameters before you select a few to find topics to get started with.
- Ensure proper formatting, thorough research, fact-checking, originality, and review your content before publishing.
- Invest in creating in-depth posts, which generate 9 times more leads than shorter content.
Step 4: Optimize for SEO
To ensure your content reaches a wider audience, it's important to optimize it for search engines. Conduct keyword research and incorporate relevant keywords naturally into your content. Additionally, focus on creating valuable and shareable content that others would want to link to.
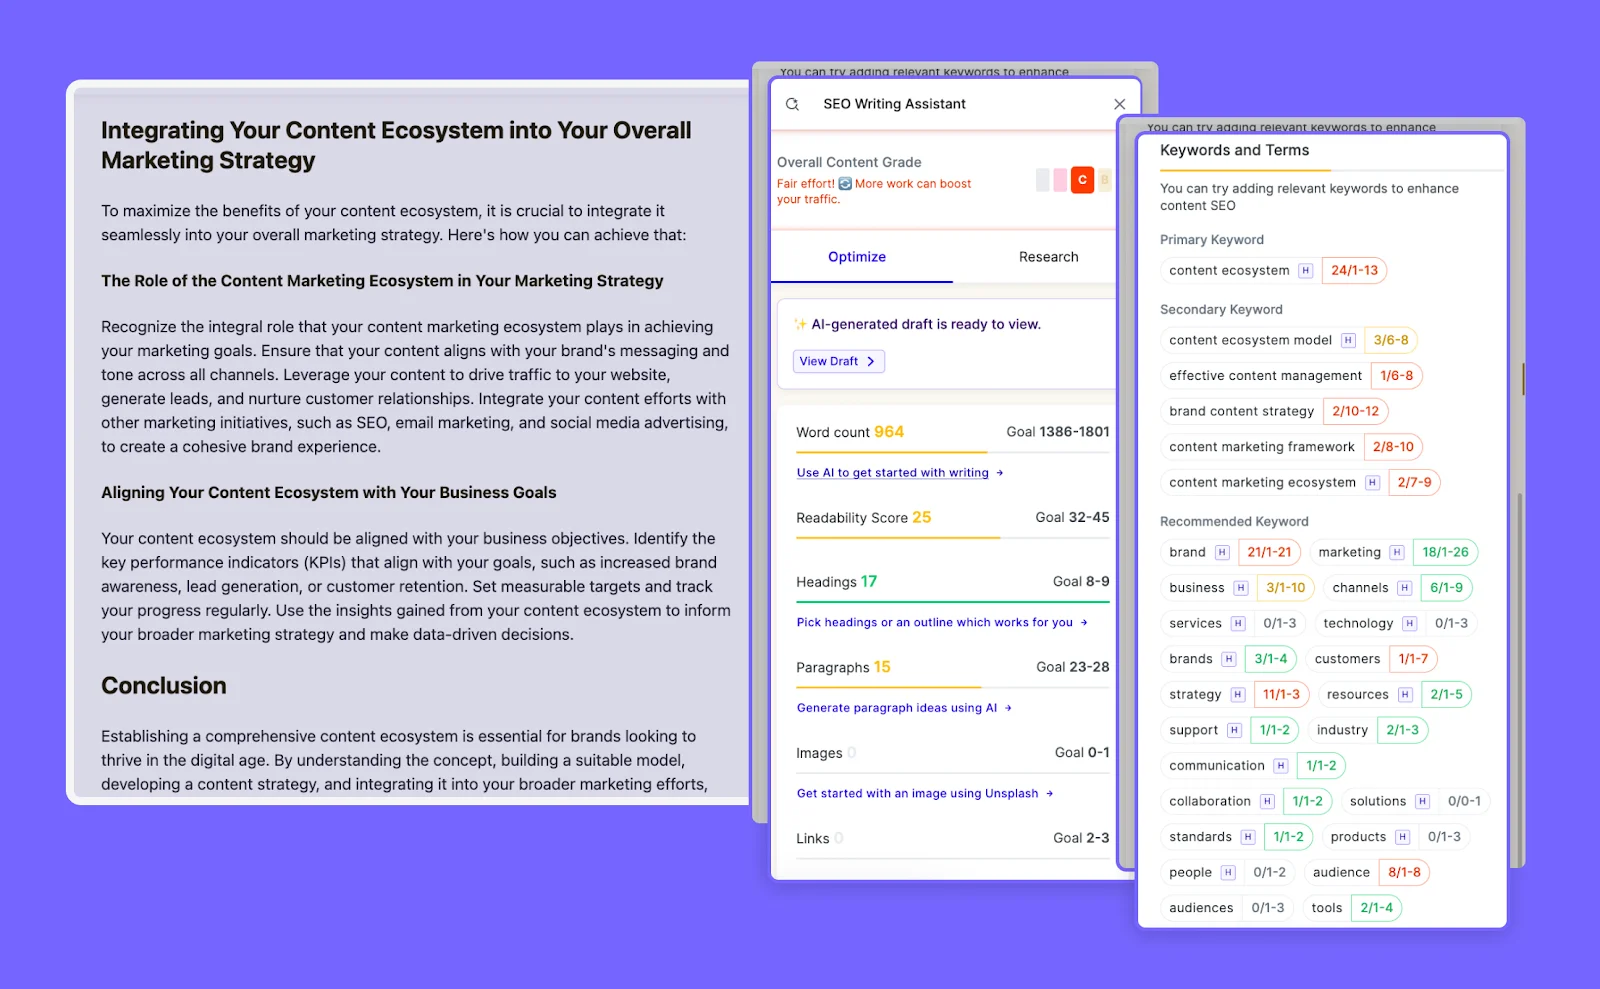
For instance, Pepper CMP's SEO Writing Assistance equips you with all the necessary SEO guidelines such as keyword integration, content grade, readability score, and more to ensure your content is well optimized.
Step 5: Streamline your content marketing workflows
Managing your content marketing workflows is essential to ensure smooth operations. Streamline the processes involved and identify the stakeholders responsible for each task. This will help you maintain consistency and ensure timely delivery of content. Use collaboration tools like the Pepper Content Marketing Platform to organize your tasks into projects for better oversight of the content creation process.
Step 6: Distribute your content across appropriate channels
Once your content is created, it's time to distribute it across appropriate channels. Utilize various platforms such as social media and email marketing to reach your target audience. Tailor your distribution strategy based on the preferences of your audience.
Step 7: Promote Your Content
Creating great content is just the first step. To maximize its reach, you need to promote it effectively. Share your content on social media, reach out to influencers in your industry, and engage with your audience through comments and discussions. The more visibility your content gets, the stronger your content ecosystem becomes.
Step 8: Analyze and track performance to make data-driven adjustments
Lastly, use analytics tools to track the performance of your content. Monitor key metrics such as website traffic, engagement, and conversions. Analyze the data to identify areas for improvement and make data-driven adjustments to your content strategy.
Conclusion
Building a content ecosystem can be a recurring process, but it's worth the investment. By consistently creating and distributing high-quality content, you can achieve your business goals and build a strong and loyal customer base.
Remember, your content ecosystem is a reflection of your brand's voice and values. Invest in creating high-quality, relevant, and engaging content that resonates with your target audience, and you'll reap the rewards in the form of increased brand awareness, customer engagement, and business growth.
Looking for an all-in-one content marketing platform that helps businesses create, distribute, and manage their content? Pepper Content Marketing Platform is here to help!
This guide to creating a comprehensive content ecosystem is a guest post by our friends over at Pepper Content. Book a demo to learn more about Pepper content

12 Content Marketing Metrics & KPIs For SaaS Companies
Keep track of the most content marketing metrics including organic traffic, CTRs, CAC, scroll depth, time on page, bounce rate, and more
For SaaS businesses, content is more than a 'good-to-have'—it's a business asset. A staggering 92% of marketers acknowledge the importance of content in the growth of their business.
But, merely recognizing the importance is not enough. You also need to understand what effective content marketing is, how it catalyzes growth, and what metrics can measure its effectiveness.
In this article, we’ll look at the top content marketing metrics and KPIs you need to measure for content effectiveness and success. Let's get started.
What are Content Marketing Metrics?
Content marketing metrics quantify the effectiveness of your strategy and content marketing efforts. They offer an understanding of how well your content—whether blogs, emails, videos, etc.—is engaging your target audience and converting them into customers.
As you continue to scale content, tracking these metrics should be of utmost importance, especially for SaaS marketing teams.
These metrics provide clarity about the strengths and weaknesses of your content strategy and can help you measure specific attributes of your content that your target audience likes—guiding your future content decisions.
Most importantly, content marketing metrics serve as a gauge for your content's impact on your business success, helping you make data-driven decisions and strategic adjustments to enhance the ROI.
Why Your SaaS Company Needs to Track Content Metrics
Content marketing metrics provide key insights into what's performing, what's not, and where you need to make changes. Metrics help you:
- Understand Your Audience Behavior: Stats like page views, time on page, and bounce rate paint a clear picture of how your audience interacts with your content. Are they hooked or leaving quickly? What content pieces are they consuming? And how can this data help create content that aligns with our audience's preferences? These insights help you create content that better fits what your audience wants.
- See Content Performance: How do you know if your content is successful? Social shares, comments, and conversion rates show whether your content resonates with your audience and leads them to sign up, download, buy, or any other goal you may have.
- Plan Future Content: By tracking metrics over time, you spot trends and patterns to shape your future content plans. For example, if one type of content always does well, create more of that type of content.
- Optimize Your Content: Tracking metrics allow constant optimization of your content. You can test different strategies, see their impact, and refine your content based on what works best.
- Prove ROI: Content marketing costs time and money. Metrics such as revenue, leads generated, and customer acquisition cost help show it's worth the investment. Execs want to see returns.
Next, let’s explore the types of metrics SaaS companies should monitor.
The Metrics Guiding Your B2B Content Strategy
As a B2B company, content marketing metrics are your compass to success. They show how to navigate the sea of content and connect with your audience. Here we explore the five types of key metrics to measure:
Consumption Metrics
These are the most basic metrics and provide insights into how your audience consumes your content. These metrics also look at the frequency and depth of their content consumption.

Stats like pageviews, sessions, and referrals reveal how many view your content, how often, and the channels they use.
Engagement Metrics
With engagement metrics, you can determine how your audience interacts with your content. They also help you guide your future content creation decisions by understanding what content is attractive to your audience.
Data on likes, shares, comments, and session duration are a few examples of engagement metrics. Keep track of these metrics to ensure steady growth and to build influence over time.
Retention Metrics
Once your audience has consumed and engaged with your content, they can either bounce off to never return, or keep coming back for more. Retention metrics help you understand how many of your users return to your content or website for more.
Data on return visits, subscription rates, and churn rates signal how valuable your audience finds your content.
For a SaaS business, retention can be difficult as competitors are prying for opportunities to copy your effort. But once you develop a content moat (think Hubspot or Drip), you have a strong business asset that prevents your customers from going elsewhere.
Cost Metrics
Next we come down to the metrics that tell you how valuable the content is for your business. These numbers include the cost per lead (CPL), cost per click (CPC), return on ad spend (ROAS), ROI, and others.
Cost metrics show whether your content achieves outcomes efficiently. It also helps you understand how long before your content starts generating positive ROI for your business and can help guide your budgeting decisions.
Lead Gen Metrics
Businesses create and distribute content to bring in leads. Lead gen metrics tell you how many leads your content has generated.
These metrics include lead volume, lead quality, and conversion rates indicating your content's impact on your business.
While these metrics may work individually, a combination of these metrics gives you a holistic view of your content performance. They steer your strategy by revealing what's effective and what needs refinement.
Content Marketing Metrics vs. KPIs: What’s the Difference?
Metrics and KPIs are words commonly thrown around in the marketing world. But what’s the difference? While KPIs and metrics are both quantitative measurements, they serve different purposes.
| Aspect | KPIs | Metrics |
|---|---|---|
| Purpose | Measure performance toward specific business goals | Measure the performance of specific business processes |
| Level Of Focus | High-level, strategic | Lower-level, operational, or tactical |
| Objective | Tied to an outcome or target | Measure day-to-day performance |
| Communication | Used to communicate the progress of business goals | Used to track specific areas or processes |
While all KPIs are metrics, not all metrics are KPIs. Understanding the difference between these two can help you better track and measure your content marketing success.
{{INLINE_TOFU}}
12 Content Marketing Metrics and KPIs SaaS Companies Should Measure
Now that you have a grasp on the types of metrics in content marketing, let’s look at the 12 most important content marketing metrics you need to keep track of to ensure your decisions are backed by the right data.
1. Organic Traffic
Organic traffic is the number of visitors who land on your website from unpaid search results.
This metric is a testament to the quality of your website's search engine optimization (SEO). It's a reflection of your website's relevance and the quality of its content. The higher your organic traffic, the more opportunities you have to generate leads and conversions.

Suppose you have recently started a blog to drive more organic traffic. You look at a tool like Google Search Console or Factors to see that your website has received 5,000 visits from organic search after a month of content efforts.
This indicates that 5,000 people found your website through a search engine and visited your site, demonstrating the effectiveness of your SEO efforts. Here, you can also check the keywords and terms that people search for to find your content.
2. Impressions
Impressions represent the number of times your ad or content is displayed and viewed by users. In the context of digital marketing, impressions give you an idea of the reach of your content. It's a measure of potential audience size, giving you insights into the potential reach of your content or ads.
Factors helps you see the exact number of impressions for all your campaigns in a single place. It makes it easy for you to take a holistic decision on what campaigns are working and how you can optimize your marketing channels with the best ads.

Consider that you run a LinkedIn ad campaign and your ad has 10,000 impressions. This means LinkedIn showed your ad to 10,000 people. It also helps you decide if segmenting further or broadening your keywords and audience can improve reach and targeting.
3. Clickthrough Rate
Clickthrough rate (CTR) is a ratio that compares the number of times your viewers click on a specific link to the number of total views on a page, email, or advertisement.

It's a key performance indicator for ad campaigns and provides insights into the effectiveness of your ads or emails. A higher CTR indicates that more people are clicking on your link, which could lead to higher conversions.

For example, an ad that was displayed 10,000 times (impressions) and received 200 clicks has a CTR of 2%. This means that 2% of the people who saw your ad ended up clicking on it. With this metric, you understand how well your ad copy or content is working for your audience on the platform.
4. Content-Assisted Demos
Content-assisted demos are the number of demos that were influenced by your content.
This metric is part of the marketing funnel and helps you understand the effectiveness of your content in driving leads and sales. It's a powerful indicator of the quality and relevance of your content, as it shows how well your content is able to engage potential customers and lead them further down the sales funnel.

Let’s assume you've published a blog post about the benefits of your product and included a call-to-action (CTA) to schedule a demo. Of 10,000 people who visit the blog post, 500 book the demo.
That gives you a CTR of 5%. However, attributing it to your content could be difficult. A tool like Factors can help you visualize the marketing funnel and tell you exactly how many of your leads came from your blog posts vs your website home page.
5. Bounce Rate
Bounce rate measures the percentage of visitors who land on your website and exit your website without looking at other pages. In other words, they "bounce off” instead of continuing to other pages within your site.
While this could indicate that your content solves the need that a user came in for, it also tells you that there’s more you can do to retain your visitors. The average bounce rate hovers around 50%.

To calculate the bounce rate, you divide the total number of single-page visits by the total number of entries to a website. The resulting figure is then multiplied by 100 to get a percentage.
Let’s assume one of your blog posts attracts 100 visitors a month. Of those, 40 left after reading just that one post. In this case, your bounce rate is 40% which means 40% of your visitors don’t interact with your site beyond the initial page they landed on. You can improve retention by looking at the time on the page, scroll depth, and tracking overall website behavior.
6. Customer Acquisition Cost (CAC)
Customer Acquisition Cost (CAC) is the total cost of resources and efforts a business allocates to gain new paying customers.
CAC is a critical business metric for determining the resources required to acquire and onboard new customers, and it helps assess your company’s overall health and profitability. It's calculated by dividing the total costs associated with acquisition by total new customers, within a specific time period.

Let's consider that you offer a project management tool. Your monthly marketing budget is $10,000, which includes costs for ad spend, content creation, and marketing software. In that month, you acquire 200 new customers.
The CAC would be $10,000 divided by 200, which equals $50.
This means you spend $50 on average, to acquire each new customer. This is an important number for understanding the efficiency of your marketing efforts and for planning future marketing budgets.
7. Unique Visitors
Unique visitors are the number of individual people visiting your website over a certain period of time.
This metric is critical for understanding the size and reach of your website's audience. It's different from the number of visits, which counts the total number of times your website has been visited by both new and old visitors. Instead, the unique visitors metric tells you just the number of users that have visited your website — avoiding double-counting those who visited multiple times.

Factors’ web sessions view
Suppose you recently started a blog to drive more organic traffic. A tool like Factors can measure that your website has received 3,000 visits in a month, but only from 2,000 individual users, some of whom may have visited multiple times. This means that your unique visitors for that month would be 2,000, indicating the size of your audience and the effectiveness of your user acquisition strategies.
8. SERP Ranking
SERP (Search Engine Results Page) ranking refers to the position of a website's content on the search engine results page.
The lower the number (for example, 1 is better than 7), the better your search visibility and the higher the chances of people visiting your site organically. It's a direct reflection of your SEO efforts, keyword relevance, backlink profile, and website quality that influences your ranking.

Suppose you offer a project management tool, and your blog post titled "Top 10 Project Management Tools in 2023" ranks 1st on the SERP for the keyword "project management tools 2023". You can view the SERP position by either directly searching on Google for your keyword or checking Google Search Console. Rank 1 means your SEO efforts have been successful in making your content highly visible to users searching for that specific keyword.
By employing a professional SEO tool like SE Ranking, you gain the ability to analyze the pages that currently hold top positions on the SERP. This valuable insight helps you understand the strategies and tactics that contribute to their success. Continuous monitoring of your competitors' rankings ensures that you stay informed about the dynamic landscape of search engine results.
9. Pages Per Session
Also known as page depth or depth of visit, pages per session reveal the average number of pages a user views during a single session on your website.
This metric tells you the effectiveness of your site content in keeping viewers engaged and navigating through your site. A higher number of pages per session indicates compelling content and an intuitive site design that encourages exploration. However, do note that most of your visitors will view a single page and leave.

Factors pages per session report
Suppose your marketing analytics tool shows an average of 5 pages per session. This means that users, on average, visit 5 different pages on your website in a single session. This could be a result of effective internal linking, engaging content, or a user-friendly site layout that encourages navigation.
10. Average Time on Page
Average Time on Page measures the average time users spend on a specific page before moving on to another one or exiting your site.
This metric helps you understand your users’ engagement with your site content. A high average time on a page generally indicates that users find your content valuable and engaging. However, the ideal duration will vary depending on the type of content you're offering and the goals of your website.
Let's consider that you've published a comprehensive guide on "How to Use Your SaaS Product". A month after publishing, you note that the average time on this page is 7 minutes.
Depending on the length of your guide, this may indicate that users are likely reading the entire guide or at least skimming through the important parts you may have highlighted. You can dive deeper into this by looking at click maps or scroll depth.
This shows that users are finding value in your guide and you should continue producing similar assets for your business.
11. Traffic Source
Traffic Source is the origin or medium through which visitors arrive at your website or digital platform. Knowing your traffic sources helps businesses know exactly what channels the marketing team should double down on and what channels are not generating enough ROI to keep going.
For instance, consider an e-commerce store that sells handmade home accessories. The store owner has implemented various marketing strategies like social media, paid advertising, organic search, and email marketing to drive traffic to the website. To evaluate the effectiveness of these promotional efforts, the store owner needs to analyze traffic sources to determine which is bringing the most visitors and which source results in the highest conversion rate.

Factors can indicate that 1,000 website visitors arrived from the following traffic sources—500 from social media, 200 from paid advertising, 200 from organic search, and 100 from email marketing campaigns. Based on this information, the marketing team can focus more on their social media strategy.
12. Scroll Depth
Scroll depth is a measure of how far down a webpage a user scrolls. It indicates how much of your content is being consumed and can provide insights into user engagement.
Scroll depth tracking in Factors allows you to see how much of a web page your visitors actually view.
For example, if you have a blog post that is 2000 pixels long, and users on average scroll 1000 pixels, your average scroll depth would be 50%.

This means that on average, users are viewing half of your content. If the scroll depth is low, it might indicate that users are not finding the content engaging or relevant, prompting you to optimize your content strategy. Along with this, you can create a custom report in Factors plotting how the scroll depth has improved as you update your site content and UX.
Unlock The Full Potential of Your Content Strategy
A data-driven content strategy is fundamental for any SaaS company seeking to maximize lead generation, website optimization, and business growth. A focus on metrics and KPIs paired with a comprehensive content analytics tool like Factors can help you gain deeper insights into your audience's behavior, content performance, and ROI.
Along with the basic metrics, Factors also helps you discover anonymous accounts visiting your website. This data can help you further optimize your account-based marketing efforts giving you a list of customers with the highest potential for conversion.
So, do not let valuable insights slip away—detect opportunities, gauge your success, and set your sights on new heights with Factors by your side.
Top 10 Content Marketing Metrics for SaaS Growth
Tracking key metrics ensures effective content marketing strategies and sustainable business growth.
1. Core Metrics: Organic traffic, conversion rate, and customer acquisition cost (CAC).
2. Engagement Indicators: Time on page, bounce rate, and click-through rate (CTR).
3. Strategic Impact: Backlinks, social shares, lead quality, and customer lifetime value (CLV).Monitoring these KPIs helps SaaS companies refine content strategies, boost engagement, and drive long-term success.

What is Content Analytics and How Should You Approach It? Here’s What 10 Experts Have to Say
Discover what content analytics is and gain insights from 10 experts. Learn the best approaches to analyze content performance and marketing strategies.
As digital marketing takes on new complexities, it’s essential for your marketing plan to incorporate content analytics. This will help you have a more detailed understanding of how customers interact with your company. You’ll be able to make more informed, data-driven decisions to effectively reach and convert your target audience.
What is content analytics?
Content analytics, or content intelligence, is a set of technologies that analyzes digital content in order for you to understand which content is performing well with your target audience. This enables you to create the most effective digital content possible to drive more conversions.

How does content analytics work?
B2B companies often offer highly specialized solutions. Accordingly, businesses must target their niche audiences with dedicated marketing initiatives and content that address relevant paint-points and use-cases.
You can generally figure out which content works best for your clients by analyzing certain metrics for the unstructured content your business has put out. Analytics and attribution tools like Factors.ai help marketing teams with granular insights into content performance and bottom line impact.
It’s important to remember that content analytics and attribution isn’t a linear process. We got in touch with B2B content industry leaders to ask how many metrics they use to measure content performance. Here’s what they had to say:

We also asked them which metrics they think are the most important in measuring the effectiveness of content. Here’s what they had to say:
- Clickthrough rate (CTR): Sophia Madhavan at GrowthMakerz and Vitaliy at Videowise include the CTR in the list of metrics they use to evaluate how well their content is doing. The CTR allows you to see how many times visitors to a certain page organically search for your content or click on your ad as a ratio to the total number of visitors to that page.
- Impressions: Impressions give you insight into the level of engagement your content is generating. This content could be a web page, advertisement, or blog post, for instance. Madhiruma Halder at Recruit CRM lists impressions among the metrics they use to understand how their social media campaigns and search engine marketing are performing.
- Marketing qualified lead (MQL): Not all leads are created equal. A lead that takes any high intent actions like scheduling a demo or signing up for a trial is far more likely to convert than others. Karishma Chopra at Hiver believes that the effectiveness of content should be measured in terms of its influence in driving MQLs.
- Time on page: The time a prospect spends on a particular page is indicative of their interest in the solution you’re offering. Praveen Das at Factors then uses these insights to create marketing campaigns informed by the content their prospects and clients are interested in.
- Scroll depth: Scroll depth is a measure of how far your website visitors scroll down a certain page. As a general rule of thumb, if most of your website visitors are scrolling at least halfway down the page, it indicates that your content has substantial value.
- Unique users: Chelsea Downing-West at The Martec finds unique users a crucial metric. The number of unique users may be challenging to calculate. Effective visitor identification allows you to see how many unique visitors your website receives by counting each visitor only once, no matter how often they visit the website.
- Bounce rate: The bounce rate of your website indicates the ratio of visitors who access your website and leave instead of clicking on and going through other webpages.
- Engaged Accounts: Understanding which specific accounts are consuming the content is another intuitive way for content marketers to analyze its effectiveness. Visitor Identification softwares like Factors can help marketers identify the account and its properties (employee range, industry) even if the user does not fill up a form. This helps Content Marketers plan content efforts tailored to specific industries or scale of employees.
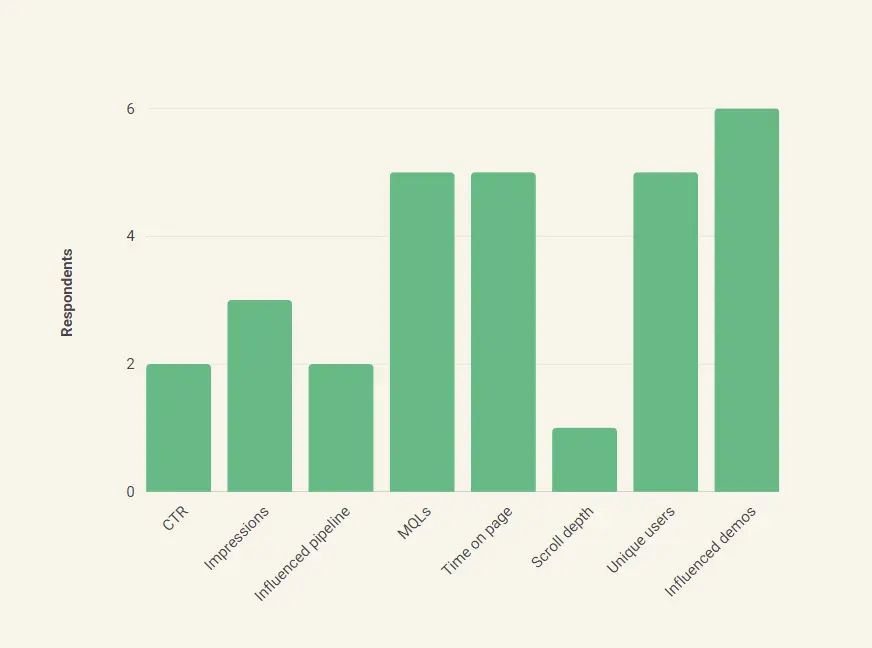
Why is content analytics important?
Your website content is the first thing that prospects see when they’re evaluating your company. It creates a lasting impression about your services. Content analytics helps you understand the types of content that perform well among your target audience, which in turn is crucial to designing a successful customer experience.
Moreover, marketing teams spend a substantial amount of time and budget to create content that prospects find valuable. A few of the experts we surveyed responded that they hire in-house teams for content creation and distribution. This indicates how valuable creating effective marketing content is to increasing overall revenue; B2B companies are willing to invest in salaries, 401(k)s, and insurance to generate engaging content. Respondents stated that they spent anywhere between $1000 and $10,000 a month towards content creation and distribution.
This expense makes sense when you consider how much content contributes to the overall pipeline. Respondents stated that the monthly investments they make towards content creation reaps significant rewards. Although responses varied greatly, most of the experts cited that around 30-40% of the pipeline is influenced by content creation and distribution.
Creating valuable content for prospects is almost entirely dependent on content analytics. Content analytics offer your sales and marketing teams multiple benefits:
- Helps marketers redefine their strategy based on how current content is performing
- Calculates the ROI for each piece of content, which in turn guides future content strategy and content repurposing.
- Superior prospect experience by focusing on the most relevant content and elimination of guesswork
- Quicker and easier conversion for prospects by offering them content that is relevant and important for them at each stage of the funnel
- Cuts down on redundant content by immediately finding out when certain pieces are underperforming
{{INLINE_TOFU}}
How can content analytics contribute to a better customer experience?
Understanding each interaction a prospect or customer has with your website and other marketing collateral enables you to improve your content offerings. You’ll be able to offer customers a far better experience by analyzing and iterating based on content data. Content analytics helps you:
Offer relevant content
You can offer clients valuable content depending on where they are in the conversion process. Content analytics help you anticipate which content is relevant at every stage of the funnel, thereby streamlining communication with prospects and clients alike.
Address specific client needs
You can also create a 360-degree buyer persona for existing clients. An integrated analytics software like Factors allows you to have a holistic overview of each client so you can see every interaction they’ve had with your company. You have access to each touchpoint and all their past behavior, thereby enabling you to make educated guesses about their pain points.
For instance, let’s say you run a company that creates CRM software. You could find through trends in content analytics that customers from the tourism industry are interested in the customer service features it offers. On the other hand, customers in the tech industry are more interested in its customization and workflow automation features. You can then use these trends to offer them content that best fits their needs.
Hyper-personalize your content
Prospects today expect a highly customized experience tailored to their needs. It’s essential to curate a personalized experience in order to create a lasting client relationship. Understanding which channels your client base uses, the keywords they’re interested in, and the time they spend trying to solve a pain point on a webpage are all crucial to personalization.
Make better decisions
Content reporting can help you make deeply informed decisions with respect to pricing, sales, organizational goals, and communication. You’ll never have to rely on guesswork again; all you need to do is gather user data through an analytics tool and leverage it relentlessly.
Your clients have needs that are continuously evolving, so you have to continuously utilize real-time data to create adaptive strategies that help you get the most out of your investment.
What are the biggest challenges of content analytics?
Customers’ preferences and expectations from content are constantly changing. Jess Cook from LASSO puts it best: content analytics isn't an exact science. Here are the biggest challenges that marketing and sales teams encounter in the process of analyzing content data:
Data silos
Your sales and marketing teams need access to a unified customer data infrastructure. End-to-end account journeys are of the utmost importance when you’re streamlining the sales and marketing processes. If your sales and marketing teams work independently of each other, there’s a huge chance that they have access to disconnected data.
Data silos lead to an underwhelming customer experience. The sales team should have access to all the marketing touchpoints the user has been through to avoid repetition, tedium, and misunderstandings in the sales process.
Visitor identification
De-anonymization is crucial to effective analytics, since you need to see how many unique visitors your website is drawing and the firmographic characteristics of these users such as company name, industry, employee range and revenue range. However, all users on the internet want anonymity, and there are laws to protect user data from illegal tracking.
Free content analytics tools have limitations
Tools like Google Search Console (GSC) offer users limited insight. Saffia Faisal at Userpilot believes that GSC is inadequate for dedicated content analytics and reporting. B2B companies require an in-depth analysis of how their content is performing. GSC’s algorithm limits accuracy in reporting, providing just a signal of how content performs. GSC also imposes limitations on the number of rows of data that can be exported at a query level.
How content analytics works in Factors
Factors.ai connects the dots between web sessions and CRM events to answer this question through automated form captures, customer journey funnels, and AI-powered inflection analysis to determine what content is helping/hurting larger objectives
“How are my website resources driving form submissions, MQLs, SQLs, Opportunities, Deals, and ultimately, Revenue?"
Content marketers and sales strategists need access to real-time, relevant data that provides a holistic overview of content and customers alike. These insights can help tailor new content based on what works, thereby driving greater revenue.



Automated insights to determine web content's impact on custom conversion goals
Customizable dashboards
Remember the data silos we mentioned earlier? They slow down the progression of the accounts into the sales funnel and may lead consumers to drop out of it altogether. With Factors, however, you have all your customer information present on the same dashboard. Your sales and marketing teams will have access to consistent information, and will be able to see all your clients’ touchpoints. You can choose which metrics you want to view on the dashboard.
Easy account identification
With Factors’ reverse IP lookup, you’ll be able to identify which companies are interested in your solutions through their website visits. If an individual in a company visits your website, Factors will match its IP address within its existing database and identify the company name and domain, industry, annual revenue, and employee headcount. Since the database relies on publicly available data and the data you draw from your website, this process is fully compliant with user privacy protections.
You’ll also be able to see which stage of the funnel a particular prospect is at by the type of content they consume. Once you know the identity and needs of your prospects, you can target them in a personalized manner.
Automated analytics and attribution
Your sales and marketing teams won’t need to crunch numbers or look for missing information. Factors provides all the data you need, such as time on page, page load time, button clicks, scroll percentage, and page views. By automating the process of content data collection, your teams can focus their energies on strategizing and creating quality content for clients.
Factors’ multi-touch attribution model helps your company understand the customer journey and give credit to the touchpoints involved in the conversion process. It provides more detail with respect to user behavior when compared to single-touch models. A multi-touch attribution model aims to highlight which touchpoints have the greatest influence in the account’s journey, and how they work together.
Adaptation based on new insights
Your customers’ requirements are constantly evolving. It’s necessary for your analytics and attribution systems to respond to these nuances. Factors allows you to obtain instant insights about which content assets are redundant or performing well. You can use these content performance reports to refresh older content and push pieces that are doing well across more channels.
Get in touch with us today to find out how Factors can help your company improve its content analytics and reporting.

____________________________________________________________________________________________
Dive in Deep with Factors
Factors.ai takes content analytics one step further with extensive breakdowns + filters, custom dimensions + KPIs, and Content Groups.
As a content marketer, you may be interested in granular insights into your resources. “What geographies are consuming most of my work?”, “Is my blog being read more frequently on a phone or on a desktop? Should I optimize accordingly?”, “What campaigns, channels, and sources is web traffic originating from? “What about my SEO efforts and organic traffic?”.

Factors.ai answers these questions and more with an extensive range of filters and breakdowns. Additionally, there’s ample flexibility to create your own custom events and KPIs if you’d like to track tailor-made metrics.

Finally, with Content Groups, you can group a collection of logically related URLs that make up your overall website content. For example, core web pages like “features” “pricing” and “product” may be defined under one group to measure holistic performance. Similarly, blog articles written with specific intent can be analyzed all in one go. No doubt, a handy feature for content marketing analytics.
Content analytics helps evaluate digital content to gauge its performance and audience engagement.
1. Key Metrics: Click-through rates (CTR), impressions, and marketing qualified leads (MQLs).
2. Platform Capabilities: Tools like Factors offer detailed breakdowns, custom KPIs, and intelligent content grouping.
3. Strategic Benefits: Refine content strategies, improve engagement, and make data-driven decisions.
Using content analytics empowers businesses to optimize performance and maximize the impact of their digital efforts.
FAQs
How do you use analytics in content marketing?
Content analytics include reporting on website, marketing, and sales metrics. Understanding how customers interact with your content allows you to personalize your marketing campaigns in order to drive more conversions. Measuring these metrics also helps you address specific pain points and therefore improve the overall consumer experience for your solution.
Which metrics should I measure for content performance?
We asked experts about the metrics they keep track of to ensure high content performance. Their responses included clickthrough rate, impressions, marketing qualified leads, scroll depth, time on page, unique visitor identification, downloads, funnel movement, influenced demos, and bounce rate.
And there you have. Our customers regularly use Factors.ai to make sense of their content performance and guide their B2B content marketing strategy with the help of granular web page analytics, end-to-end customer journey insights, and flexible content reporting. If you’d like to learn more about our work at Factors, schedule a personalized demo today.

6 Best Content Marketing Analytics Tools for SaaS Businesses In 2026
Content marketing analytics tools are digital platforms that help you understand how your content is performing. Here's a list of the best ones.
TL;DR
- Content marketing analytics tools help SaaS businesses understand and optimize their content strategy.
- Key features in these tools include visualizations, customer journey insights, integrations, metric tracking, an intuitive user interface, customizable reporting options, and real-time analytics
- The 6 best content marketing analytics tools for SaaS include: Factors, Google Analytics, HubSpot, HockeyStack, Dreamdata, and Matomo
- The right content marketing analytics tool can make your decision-making and optimization efforts more streamlined and provide valuable insights into audience engagement and campaign performance.
- Factors helps you identify top-performing content, uncover hidden patterns, and track customer journeys, ensuring that your content marketing strategy continually evolves for maximum impact.
Drowning in data but thirsty for answers? We've been there. As content creators, we have numbers on clicks, views, bounce rates, and more.
But what we need is for that information to come together and show us what's working, what's not, and how to improve.
That's where content marketing analytics tools come in.
Content marketing analytics tools are digital platforms that help you understand how your content is performing. They provide insights into key metrics like site traffic, social media engagement, search rankings, and whether your content is driving conversions.
They help make sense of your content so you can optimize your content marketing strategy. They show key metrics like site traffic, social engagement, search performance, and whether your long blogs are converting readers.
But with many options, finding tools for B2B SaaS teams is hard. We've listed the top content marketing analytics tools to prove & improve the impact of content. These tools ensure you're making progress with your content, not just treading water. Let's get started!
What to look for in a content marketing analytics tool?
Every tool is designed with a specific audience in mind. But here are some of the features that your content marketing analytics tool must possess.
- Account Visualizations: Visualizations translate raw stats into a form simple to grasp and analyze. They help you quickly spot trends, patterns, and outliers that wordy stats may miss. A solid analytics tool will offer various visual formats, like charts, graphs, and heat maps, to suit different data types and needs.
- Insight into Customer Journeys: Each customer interaction with your content is a step in their journey. Insight into how customers interact with your content is key to improving your content strategy. The analytics tool you choose should show each customer's full path, tracking what they do across channels and touchpoints. This means seeing the content they connect with, the actions they take, and the order of these interactions.
- Integrations with Other Tools: No tool operates alone. Your content marketing analytics tool must work with your other marketing software. This could mean your CRM, email tool, social media manager, and more. Seamless linking allows centralized data control, eliminating manual data transfer between systems.
- Ability to Track Relevant Metrics: Not all metrics are equal. The tool should track metrics most relevant to your goals. If your goal is brand awareness, track page views and social shares. If lead generation is what you’re after, track form completions, and newsletter signups. The tool should allow custom metrics for your needs.
- Intuitive User Interface (UI): A tool can have all features but if it’s hard to use, no one will want to use it. An intuitive interface makes it easy for all skill levels to navigate the tool and leverage it for their use cases. This means clear menus, logical layouts, and helpful tips.
- Customizable Reporting Options: Every business is unique, as are reporting needs. A good tool allows customized reports to focus on important data. You may also want a tool that allows you to choose metrics, how they're displayed, and who they're shared with. Custom reports also make it easier to share insights with stakeholders.
- Real-Time Analytics: The digital world constantly changes. What worked yesterday may not work today. Real-time analytics lets you monitor content performance now so you can quickly spot and respond to changes like traffic spikes, engagement drops, or social share surges. Responding fast gives you an edge.
6 Best Content Marketing Analytics Tools for SaaS in 2025
Let’s get started with the 6 best content marketing analytics tools that you must try.
1. Factors.ai

Factors is a must-have tool for B2B marketers. It provides real-time data and actionable insights that help B2B companies maximize content impact and drive measurable results. With Factors, you get a custom snapshot of how your audience is engaging with your content assets so you know what's working, what's not, and what needs to change.
Factors automatically tracks and compiles key content marketing metrics saving you time. You can use these data-driven insights to refine your content creation, enhance the distribution of your top-performing content, and refresh older content that needs improvement.
“The quality of data is amazing. It's one of the best in the market. With Factors.ai we have been able to increase our top of the funnel and at the same time we have been able to add a few into the middle of the funnel.” — Wilson L., 5-star review on G2.
Features
Factors offers a wide range of features designed to help you optimize your content marketing efforts:
- Comprehensive Content Analytics: Factors gives you in-depth insights into how your content is performing, who's engaging with it, and how well your campaigns are working. It helps content marketers easily see what's effective and make changes to optimize their strategy. As Praveen R., Head of Product Marketing at a small startup put it, Factors helped them identify the content and pages that were working well and offered good insights into the typical customer journey.
- Explain Feature: The "Explain" feature helps uncover important patterns in your data so you can spot trends and understand what's driving your results. Anirhudh Sridharan found it helpful in digging out patterns that impact their conversion metrics.
- Automated Alerts and Notifications: With this feature, you can get automated notifications about important visitor activities so you can respond promptly, engage leads at the right time and access a bigger pool of potential customers. Some Factors users have said that implementation of Factors has substantially expanded their top-level pipeline, granting them access to a broader pool of potential prospects and allowing them insight into each prospect's characteristics and behaviors.
- Attribution Tracking for Content Campaigns: This feature helps you keep track of how your content campaigns are performing across channels so you can double down on what's working and optimize your strategy. Chaitanya G., Head of Growth at a startup mentioned, Factors provides effective solutions to various challenges faced by marketing teams while offering automated alerts, enabling them to engage with prospects at the right time and focus on targeted campaigns that result in higher ROI.

- Easy Integration with Marketing Tools: Factors integrates perfectly with the platforms you already use, bringing all your data together for a complete picture of how your content is performing. No more juggling metrics across different places—get it all in one spot for easy insight into what's driving your results.
- Account Segmentation and Audience Insights: Factors gives you the power to segment accounts based on their behaviors and interests so you can tailor your marketing just for them. See who's engaging with what content, how they're interacting with your brand over time, and what makes them tick. Then craft targeted messaging and content to match. Gayatri Ivaturi S., Director of Digital and Content Marketing at a Mid-Market company, said Factors allow them to understand website activity and buyer intent at an account level. Combining multiple custom reports, they segment and target leads based on this behavior and intent data.
“Implementing automated alerts by Factors has dramatically enhanced the efficiency of our sales team. Gone are the days of dedicating countless hours to researching prospects before initiating contact, as we now possess all the necessary information readily accessible.” — Ashok D., 5-star review on G2
Integrations
Factors.AI offers a wide range of integrations to ensure seamless data flow and enhanced functionality. Here are some of the key integrations and how you can use them:
- 6signal: Discover anonymous companies on your site so you can understand their behavior and interests.
- Clearbit Reveal: Get the details on the companies stopping by your site so you can tailor your marketing to them.
- Salesforce: See how your marketing activities directly impact your sales and get insights right in your CRM.
- HubSpot: Share data between your marketing platform and CRM for a complete customer view and optimized efforts.
- Segment: Bring all your customer data together for a deeper analysis of your audience and how to best engage them.
- Rudderstack: Get a 360-degree customer view for smarter marketing and customer experiences.
- Google, Facebook, LinkedIn, and Bing Ads: Track how your ad campaigns are performing straight from Factors. Optimize your ad spend based on real data.
- Google Search Console: Gain insights into your site's visibility and performance in Google search. Improve organic traffic based on search behaviors.
For a full list of integrations, check out Factors’ integration page.
Pricing
Learn more about pricing here: www.factors.ai/pricing
2. Google Analytics

Google Analytics (GA)—we all know it and we've all used it at some point. For B2B SaaS brands, GA provides insights into who your customers are, how they're engaging with your content, and where the cracks are in their journey.
Features
Google Analytics offers a range of features that are relevant to content analytics, visualization, reporting, and dashboards. Here are some key features:
- Customer-Centric Measurement: Google Analytics allows you to understand how your customers interact across your sites and apps, throughout their entire lifecycle.
- Insights to Improve ROI: With Google's machine learning capabilities, Analytics can uncover new insights and anticipate future customer actions.
- Connect Your Insights to Results: Analytics integrates with Google's advertising and publisher tools, giving you the flexibility to optimize your marketing performance based on the insights you gain from your data.
- Make Data Work for You: Google Analytics offers an easy-to-use interface and shareable reports. You can quickly analyze your data and collaborate with your team, making your data work for you.
Integrations
Google Analytics is designed to work seamlessly with other Google solutions, providing a complete understanding of your marketing efforts and enhancing performance. Some of the top integrations include:
- Google Ads
- Search Ads 360
- Display & Video 360
- Google Cloud
- Google Search Console
Apart from these, most tools integrate and pass data to Google Analytics
For more detailed information on these integrations, you can visit the Google Analytics Integrations page.
Pricing
Google Analytics is a free tool, making it an excellent choice for businesses of all sizes. For more advanced features, Google offers Analytics 360, a more customizable version of Analytics, that is part of Google’s paid suite of products. That said, pricing starts at $150,000 per year which may not be affordable for midsized companies.
3. HubSpot

HubSpot is a comprehensive marketing analytics platform that provides insights into your marketing efforts and their impact on revenue. It offers a suite of tools for tracking, reporting, and analyzing your marketing channels.
Features
- Track the Complete Customer Lifecycle: With Hubspot, you can build reports that analyze your CRM data to discover key trends. Track the actions of your website visitors to understand behavior and trigger automation workflows. Use multi-touch revenue attribution to map how marketing touchpoints work together to drive revenue.
- Check Site Performance and Measure Traffic: You can measure traffic to your website and check its quality based on interactions. This feature also allows you to analyze how each of your pages is performing, compare key metrics like sessions and conversion rates, and find out which traffic sources bring in the most sessions and customers over time.
- Analyze Reports Across Several Marketing Channels: HubSpot's analytics are built into everything you do, right out of the box. You can see detailed reports for every marketing asset, from your website to emails, blog posts, social media, and more. Then add any report to your dashboard to track everything in one place.
Integrations
HubSpot seamlessly integrates with over 1,250 leading apps and web services, including:
- Google Contacts
- Mailchimp
- Xero
- Aircall
- Airtable
- Microsoft Dynamics 365
For more detailed information on these integrations, you can visit the HubSpot Integrations page.
Pricing
HubSpot's pricing for its marketing analytics software is structured as follows:
- Professional Plan: Starts at $800 per month, billed annually. This includes 2,000 marketing contacts. Additional marketing contacts cost $225 per month per 5,000 contacts.
- Onboarding Fee: You’re also charged a $3,000 onboarding fee for the Professional plan and a $6,000 onboarding fee for the enterprise plan.
4. HockeyStack

HockeyStack is an analytics and attribution tool designed for B2B companies. It provides a complete picture of every customer touchpoint, from the first interaction to the closed deal, helping you refine your marketing strategy.
Features
- Attribution 2.0: HockeyStack uncovers every touchpoint, from the first interaction to the closed deal, providing a comprehensive view of the customer journey.
- Custom Dashboards and Reports: HockeyStack allows you to create custom dashboards and reports to visualize your data in a way that makes sense for your business.
- Goal, Funnel, and Segment Tracking: Track your marketing goals, funnels, and segments to understand the effectiveness of your marketing efforts.
- CRM, Billing System, Customer Support, and Ad Network Integrations: HockeyStack integrates with your existing tech stack, providing a unified view of your marketing, sales, revenue, and product data.
Integrations
- CRM: HubSpot, Salesforce
- Ads: Google, Facebook, LinkedIn, and Twitter Ads
- Account-Based Marketing: 6sense, Rollworks
- Marketing Automation: Mailchimp, Pardot, Marketo, HubSpot Marketing Hub
For more detailed information on these integrations, you can visit the HockeyStack Integrations page.
Pricing
HockeyStack's pricing starts from $949 per month for 10,000 visitors per month and 10 seats. The setup and onboarding are completely free.
5. Dreamdata

Dreamdata is a B2B revenue attribution platform that connects your content to pipeline and revenue. It provides insights into how your content is influencing leads, prospects, and new business, helping you make data-driven decisions about your content strategy.
Features
- Content Analytics: Dreamdata's Content Analytics provides insights into how your content is influencing leads, prospects, and new business.
- Content Funnel Performance: It allows you to see what content influenced your accounts at different stages of their journey.
- Content Performance: With Content Analytics, you can identify what source channel is bringing in the right audience to your content.
- Data-Driven Content Strategy: Dreamdata helps you develop a truly data-driven content strategy by providing insights into what content to create for each step of the funnel, how long to wait for conversions at each stage of the pipeline, what channels to invest more in, and which are your true evergreen pages.
Integrations
Dreamdata integrates with a wide range of tools across different categories. Here are some of the key integrations relevant to content marketing:
- CRM: HubSpot, Salesforce, Pipedrive, Microsoft Dynamics
- Ads: LinkedIn Ads, Google Ads, Facebook Ads, Twitter Ads
- Marketing Automations: HubSpot, Marketo, Pardot
- Customer Success: Intercom
- Sales Tools: Outreach
- Website Tracking: Segment, analytics.js
- Data Warehouse: BigQuery, Amazon Redshift, Snowflake
- Business Intelligence: Google Data Studio, Tableau, Looker, PowerBI, Metabase
- Reverse ETL: Hightouch, Census
For more detailed information on these integrations, you can visit the Dreamdata Integrations page.
Pricing
Dreamdata offers several pricing tiers, starting from a free tier to custom enterprise solutions:
- Free: $0/month, includes up to 30,000 Monthly Tracked Users, up to 5 Seats, B2B Web Analytics, Unified Ad Spend Report, Company Enrichment & Segmentation, De-anonymize Traffic, LinkedIn Ads Engagement, and the option to share reports with your colleagues.
- Team: From $599/month, includes everything for Free, plus 30,000 Monthly Tracked Users, up to 10 Seats, Connect your CRM, Revenue & Multi-Touch Attribution, Performance Analytics & ROAS, Customer Journeys up to 2 years, LinkedIn & Google Conversion Optimization, and Data-Driven Contact to Company resolution.
- Business: From $1,499/month, includes everything in the Team, plus 60,000 Monthly Tracked Users, 20 Seats, Connect your Marketing Automation, Replay Historical Tracking Data, Content Analytics, Customer Journeys up to 3 years, SSO & User Roles, and Shared SOC2 Type II Report.
- Enterprise: Custom pricing, includes everything in Business, plus Unlimited Monthly Tracked Users, 30 Seats, ROI & CAC Reporting, Data Warehouse Access, Custom Stage Objects, Custom Attribution Model, SAML, OpenID, Azure AD, OneLogin, or Okta, and Service Level Agreement.
6. Matomo

Matomo is a powerful open-source analytics platform that provides insights into your website's traffic and marketing effectiveness. It's designed to give you complete control over your data, with a strong focus on privacy compliance.
Features
- Content Tracking: Matomo's Content Tracking feature shows how effective specific pieces of content are at generating interactions on your website or app. It tracks content impressions and content interactions, allowing you to analyze the interaction rate and discover the most effective placements and variations for your content.
- Customizable Dashboard: Matomo allows you to customize your dashboard to suit your needs, providing a personalized view of your analytics.
- Multiple Integrations: Matomo can be integrated with the most popular Content Management Systems, Ecommerce platforms, and Tag Managers.
Integrations
Matomo offers a variety of integrations with popular Content Management Systems, Ecommerce platforms, and Tag Managers. Here are some of the key integrations:
- Content Management Systems (CMS): WordPress, Wix, Webflow, Squarespace, Drupal, GoDaddy Website Builder, Jimdo, Microsoft SharePoint Online, Joomla, Kajabi
- Ecommerce: Shopify
- Tag Manager: Google Tag Manager
- Other: Cloudflare, React, Vue.js
Pricing
Matomo offers several pricing plans, including a free option:
- Free Plan: This plan is free and includes self-hosted analytics, full data ownership, and no data limits.
- Cloud-hosted Plans: Starts at $23/month for 50,000 hits a month. The pricing increases as your monthly traffic grows. However, all plans, including the base plan have all the important features.
- Enterprise Plan: If you need Custom data limits, custom data retention period, white labeling, custom domains, or specific enterprise requirements, this plan is the ideal fit for your needs.
{{INLINE_MOFU}}
Experience The True Potential of Your Content Marketing Analytics
The B2B SaaS landscape has evolved beyond traditional content marketing and embraced the power of data-driven decision-making. Content marketing analytics tools enable this transition and help marketers better understand their audience, optimize campaigns, and ultimately, drive growth and success.
Factors stands out as an exceptional choice for SaaS businesses in search of an analytics tool. It not only reveals hidden insights but also streamlines the most complex aspects of content marketing strategy. It works behind the scenes to reveal anonymous website visitors, track customer journeys, and offer actionable data. It equips businesses with the invaluable information needed for strategic, well-informed marketing decisions.
So, don't let the vast sea of data intimidate you. A powerful and flexible content marketing analytics tool like Factors can make your life simple.
Ready to make the best of your content marketing efforts? Book a demo with Factors today and see how it can help you make the right decisions.
Content marketing analytics tools help SaaS businesses assess and optimize their content strategies by analyzing key metrics like traffic, engagement, rankings, and conversions.
1. Top Tools for SaaS: Factors.ai, Google Analytics, HubSpot, HockeyStack, Dreamdata, and Matomo.
2. Key Features: Real-time data, actionable insights, CRM integration, customer journey tracking, and revenue attribution.
3. Strategic Benefits: Optimize content impact, track performance across channels, and drive measurable results.
4. Tool Selection: Choose the right tool based on specific business needs, integrating platforms for a comprehensive content marketing strategy.
Content Marketing Metrics
Discover the essential content marketing metrics to track for measuring your campaign success. Learn more in Factors.ai's latest blog post.

Content is king, and a solid content marketing strategy is your key to B2B success.
According to studies, over 88% of all B2B brands currently utilize content marketing for their everyday efforts, while another 76% of them intend to do so in the future as well.
As per definition, content marketing refers to using a strategy that involves creating and sharing valuable, meaningful content (such as videos, articles, and infographics) with your target audience. This sharing promotes audience engagement, value-addition to your marketing efforts, and above all, a positive brand image.
To explain this better, here's a thumb rule - the more value you provide to your customer, the more likely they are to opt for your products and services. Half-hearted marketing efforts are a thing of the past now, and paying attention to your content strategy is just as important as other aspects of your branding journey.
However, here's a question that you might ask yourself while starting with content marketing - "What metrics do I use to track the performance of my content strategy?"
Well, your search ends here.
In this blog, we'll cover the top content marketing metrics you must track, why these metrics are important as well as FAQs on content marketing metrics.
What Are Content Marketing Metrics and Why Are They Important?
The biggest factor that sets content marketing apart from other strategies is that its goal is not to promote the brand's products or services but to provide value to the customer's journey.
Engaging your audience's interest with industry insights, product reviews, Ask-And-Answer events, infographics, and niche-specific content works wonders for your sales funnel.
The first step of a marketing funnel is "Awareness". While a traditional ad campaign or search engine campaign may drive in customers, a robust content marketing strategy will hook your audience right in, and keep them engaged for a long time. As mentioned above, the more value you provide to your audience, the more curious and eager they will be to consider your brand while opting for a product/service.
To measure your strategy's success, you must track certain metrics that can help evaluate past performance, predict future trends, as well as help you optimize your current efforts.
6 Content Marketing Metrics You Must Track
Impressions
This metric is particularly useful on social media platforms. Put simply, the number of impressions your post garners is the number of times your audience has viewed it. A higher number of impressions indicates a higher level of reach and potential user engagement.
Sometimes, understanding what type of content your audience would like to see on their feed plays a vital role in the impressions gained. Hosting regular polls and surveys can help your brand deliver content that your audience wants, likes, and shares with their network.
Page Traffic
Page traffic or website traffic is the most important indicator to see how well your content is performing across various channels. This metric is closely related to others such as CTR, which we'll take up later in this blog.
Apart from tracking how much page traffic you're getting, it's important to know where this traffic is coming from. Is it your company blog page? Is it your social media posts that are bringing in more users? Is it your newsletter or your tutorials on YouTube? Understanding which content channels are bringing in the most (and least) number of customers is a handy insight to have.
Once you know which efforts need optimization and which need more (or less!) investment, you can modify and create a better content strategy accordingly.
CTR
Your Click-Through-Rate measures the number of clicks your ad/content receives, as compared to the number of times it is shown. Are your customers visiting your blog page via your latest Instagram post? Is your audience signing up for that newsletter you advertised in your latest email? Is your audience clicking on your website for your latest paid ads campaign on a popular search engine? Did they reach your product page through an infographic?
Measuring your CTR provides insights into whether your strategy is successful at nudging your audience into the next step of your sales funnel, or whether there are gaps and leaks in the funnel that you need to fix.
Conversion
You've set up a content marketing strategy, and are driving in a good amount of traffic to your website and social media pages. But what next?
Measuring how many of these visitors are converting into leads, and how many leads are converting into paying customers is an essential metric to track.
Enter conversion.
Your conversion rate measures what percentage of your audience in a certain stage of your sales funnel is "converting" into users in the next stage. A higher conversion rate is an excellent indicator of your strategy's success, while a lower one indicates the need for optimization of your current strategy.
If your content does not provide any real value to your customers' journey, you can expect a dip in your conversion rates as well as overall website traffic.
Tip: Pay attention to the path your customers take before they make a purchase, i.e., the touchpoints that are most effective in the conversion process for better insights. Here's how you can use Factors.ai for the same.
SEO metrics
Where there's digital marketing, there's SEO. If your content is created optimized for SEO( or Search Engine Optimization), it will rank much higher on relevant keyword searches on both search engines and special media platforms.
Identifying top keywords that are relevant to your brand or content group, using keywords in your website copy, meta descriptions, headings, subheadings, and even alternate text help boost organic reach. For example, a blog on dog food will stand a higher chance of ranking on Google's first page if its heading says "The Best Foods For Your Dog" than "Feeding Your Dog".
SEO metrics such as keyword search volume and page rankings help you understand which keywords need to be worked upon, which keywords your content is ranking well for, and which sections of your website or social media page need to be optimized for better organic reach.
Content Shares
"We just went viral!" - the one sentence every brand wants to hear after posting content on digital platforms. Be it social media or search engines, aiming for a high amount of shares from your audience is at the top of every content marketer's list. For search engines like Google, the more your content (such as blogs) is shared, the more authority it is assigned, leading to a higher search ranking the next time a user searches for related keywords or phrases.
A good way to build authority and boost shares is by using backlinking strategies. Backlinks are created when one website links to another. For example, the statistic we mentioned at the very start of the blog is linked to a page by the Content Marketing Institute. For social media platforms, creating bite-sized content that your audience will want to share with their network is the best way to increase page awareness and boost traffic.
The takeaways?
- Make sure your content is share-worthy, i.e., of high quality and adds value to your customer's journey.
- Backlinks, backlinks, backlinks
User Engagement
Be it email marketing campaigns or your latest Reel on Instagram, tracking and studying user engagement is the best way to understand how well (and how often) your users interact with your content.
One can track email open rate, likes, shares, page follows reposts, and retweets, as well as sign-ups for notifications about your upcoming posts. However, an important aspect of audience engagement that most brands miss out on is this - interact with your audience regularly.
Respond to their comments, answer their queries, and host Q&A sessions on your social media pages. Engaging with both the brand and its content on various platforms creates an excellent customer ecosystem, boosting engagement rates, brand awareness, and a positive brand image.
FAQs
How can I measure content marketing metrics?
One can measure such metrics with the help of analytics software, such as Google Analytics, Factors, or Oribi. These tools can be customized according to your campaign goals, content channels, campaign types, etc. For social media platforms, keep an eye on your analytics dashboard that tracks user traffic, post impressions, total reach, social media campaign metrics, and more.
Why are content marketing metrics important?
Tracking these metrics helps you measure how well your content strategy is working across different channels, where you need to optimize your efforts, and most importantly, they help you understand audience behavior better.
{{INLINE_TOFU}}
Top 10 Content Marketing Metrics for SaaS Growth
Tracking key metrics ensures effective content marketing strategies and sustainable business growth.
1. Core Metrics: Organic traffic, conversion rate, and customer acquisition cost (CAC).
2. Engagement Indicators: Time on page, bounce rate, and click-through rate (CTR).
3. Strategic Impact: Backlinks, social shares, lead quality, and customer lifetime value (CLV).
Monitoring these KPIs helps SaaS companies refine content strategies, boost engagement, and drive long-term success.
Wrapping Up
Content marketing is becoming every brand's top priority, simply because of the potential, it carries for brand growth and audience engagement. Measuring your strategy's performance with these metrics is the best way to know what's working well for your brand, and which efforts need optimization.

How CMO Responsibilities are Evolving in the Age of Data Analytics and Visualization
CMO responsibilities have evolved dramatically with the advent of data. This article covers how CMOs can leverage data to make the most of marketing.
Remember the days when the role of marketing was limited to promotions, campaigns, and branding? Because we…don't 😅. Marketing has evolved into an all-encompassing function that covers everything from demand generation and sales enablement to CX and pipeline growth.
And at the helm of all this? The Chief Marketing Officer.
CMOs today are responsible for far more than just creative strategy. In addition to leading traditional marketing functions, It’s essential for CMOs to stay on top of product-market fit, consumer trends, competitive landscapes, and marketing’s bottom-line impact on revenue.
And none of this would be possible without data.
In fact, 64% of marketing executives strongly agree that data-driven marketing is crucial to business success. But how exactly is data, analytics and visualization influencing (and even improving!) the responsibilities of a CMO?
This article highlights everything you need to know about the evolution of CMO responsibilities and the profound impact of data and technology on the marketing function.

Understanding The Current State Of CMO Responsibilities
Data and technology has transformed the current state of CMO roles and responsibilities. Here’s how:
Intuition can only take you so far
In the past, CMOs relied heavily on intuition and creative judgment to form strategies that may or may not work. These decisions were based on personal experience, high-level market trends, and subjective industry knowledge.
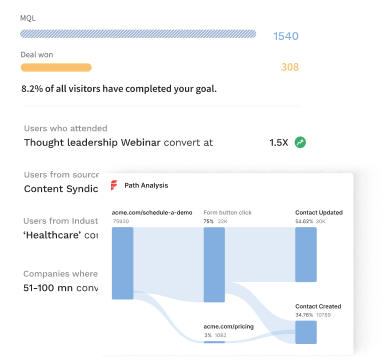
Now, CMOs work with data-driven insights to guide their decision making process. No doubt, intuition and personal judgment still play an important role in successful marketing. But it certainly helps to back up a hypothesis with hard-hitting numbers.
As businesses increasingly become digital-first, collecting relevant data across the customer journey has become far more accessible. Marketing leaders can leverage this data to drive results across brand strategy, customer acquisition, and retention by understanding what works and what doesn’t.
In addition to validating decisions, data-driven marketing also encourages dynamism and adaptability within various marketing functions. Experiments that would otherwise take months to produce results can be answered in a matter of days with journey analytics, heat maps, and A/B testing. This results in an agile, hyper-efficient marketing function that’s primed to optimize ROI and drive growth.
Data delights marketers & customers alike
Just as data and analytics benefits marketers, so does it benefit buyers and the overall customer experience. Back in the day, marketing teams had very little information to work with. CMOs had no choice but to make broad assumptions and rely on spray & pray tactics to attract buyers.
For one, targeting a wide audience with generic messaging can be expensive for smaller teams with limited budgets. Secondly, it can be ineffective (and annoying to customers) given that broad messaging that tries to appeal to everyone, generally appeals to no one.
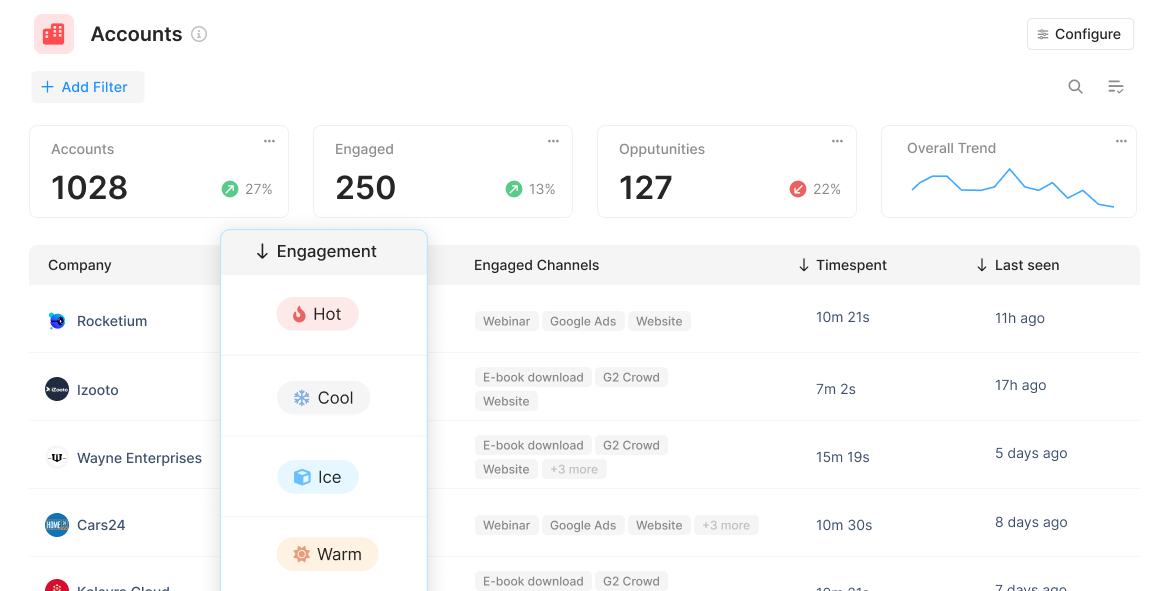
Today, CMOs can use cutting-edge visitor identification technology, account scoring, and intent data to specifically target sales-ready buyers with relevant marketing initiatives. This improves the buying experience for customers by swapping spammy email blasts and cold calls with personalized initiatives for the right accounts at the right time. Ultimately, this personalized marketing bolsters brand perception, improves conversions with fewer resources, and drives customer lifetime value — which is far more cost-effective than acquiring new customers.
The more things change, the more they stay the same
Since the days of David Ogilvy, driving sales has been the north star for marketing. This, most definitely, hasn’t changed. That being said, the accuracy and granularity with which we can measure marketing's impact on revenue has improved dramatically in recent years.

Gone are the days of tedious, unintuitive marketing reporting. Several plug and play solutions can automatically consolidate marketing and revenue data across campaigns, content, website, CRM, and more under one roof. As we’ll see in later sections, this unified data can then be used for further analysis, visualization, and dashboarding.
It’s also easier than ever to quantify the influence of every customer touchpoint on pipeline and revenue with sophisticated tools like multi-touch attribution. All this, to help CMOs’ prove and improve marketing’s impact on sales.
How Is The Data Boom Shaping The World Of Marketing?
Now that we’ve established the importance of data and analytics, let’s explore a few data-based tools and techniques that CMOs can leverage to drive ROI and shape marketing strategy:
1. Customer Segmentation & Personalization
Customers, especially B2B ones, expect a personalized experience at every turn of the buyer journey. For instance, if you’re a CMO, you likely receive dozens of cold emails every week — but only respond to, if any, the well-researched, personalized mails that are actually relevant to you. It’s no different with any other buyer.
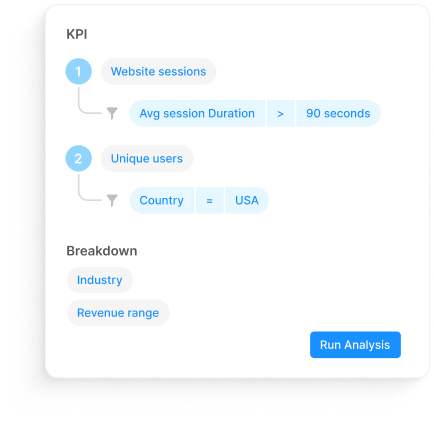
Customer segmentation allows marketers to slice and dice their audience based on firmographics (revenue range, head count, etc), technographics (techstack), and intent data (engagement, page views, etc). This in turns allows marketers to personalize their efforts and target high-intent buyers with tailor-made efforts. Less spam, better conversions: win, win!
2. Account Intelligence
B2B SaaS marketing teams invest heavily in driving relevant traffic to the company website. Unfortunately, even the most optimistic benchmarks find that only about 5% of website traffic actually convert through form submissions or sign ups. So is the remaining 95% of anonymous traffic simply taken to be potential pipeline down the drain? Well, until recently, yes 😳.
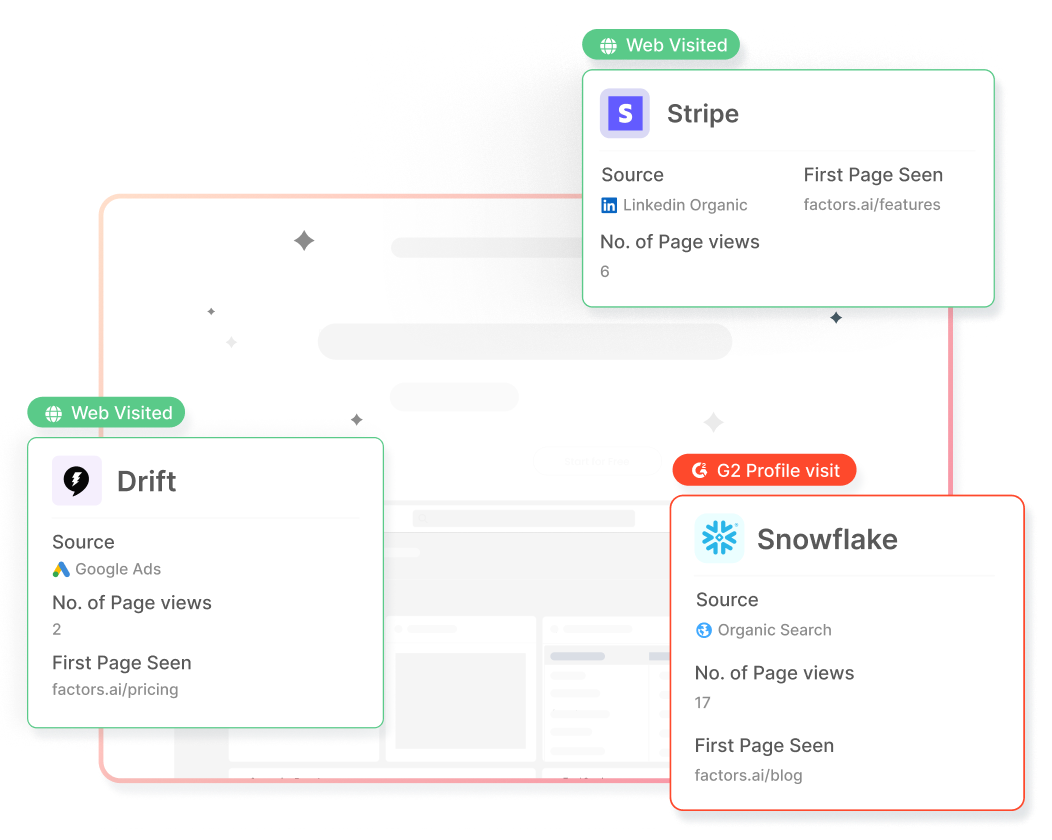
Now, with IP-lookup technology, marketing teams can tap into databases with millions of companies to identify accounts that are already visiting the website but are yet to convert.
How can CMOs and marketing teams use this?
- Optimize RoAS by retargeting accounts from paid ads who are yet to sign-up.
- Know in real-time when target accounts are live on the site, to strike while the iron’s hot
- Run relevant marketing efforts based on what target accounts are engaging with.
3. A/B Testing & Heatmaps
“What would work better on this landing page: Headline A or Headline B?”
Questions like this are exactly what A/B testing tools help answer with practical data. Rather than relying on individual judgment or biased surveys, A/B testing showcases multiple versions of a web page, creative, etc to a particular audience. Based on real-life performance, A/B testing can reveal what works better very quickly.
Heat maps are also valuable in identifying what visitors or users are engaging with within your website. This provides insight into points of resonance and friction for the target audience.
4. Customer Journey Mapping
B2B customer journeys have always been lengthy, nonlinear, and complex. To solve for this, several solutions (including Factors.ai) can help unify and visualize various touchpoints along the journey in an intuitive manner. This helps CMOs achieve a bird’s eye view of the entire buying process from first visit, to sales engagement, all the way to deal closure.
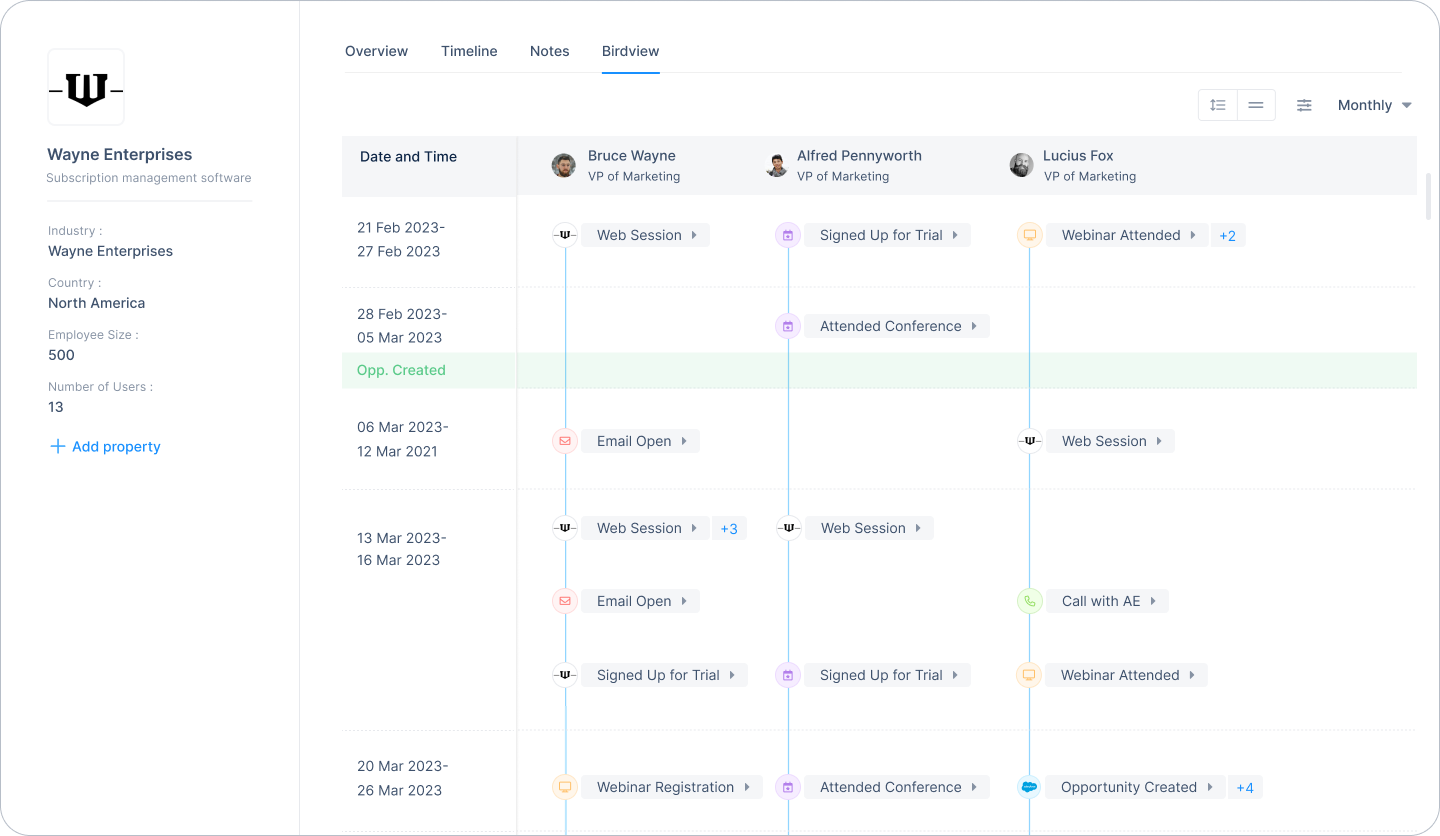
5. Multi-Touch Attribution
As businesses embrace digital transformation, CMOs and marketing teams are increasingly adopting multi/omni-channel marketing to deliver a consistent, persuasive experience to online buyers. Marketing channels range from search ads, email marketing, social media, organic blogs, marketplaces, and more.
Without making sense of the numbers, it can be difficult to know which of these channels actually influenced conversions. Multi-touch attribution is a sophisticated analytics technique that collects and credits every touch point along a customer journey based on its relative influence on conversions.
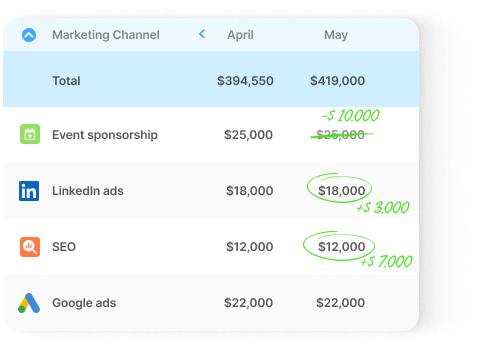
All the tools and analytics techniques discussed above rely crucially on data. The more voluminous and accurate your database, the more valuable the insights will be. The following section discusses a few practices for CMOs to make the most of their data.
Fulfilling CMO Responsibilities In The Age Of Data Analytics & Visualization
Here are a few key practices for CMOs to reap the benefits of data and analytics tools.
1. Build a culture around data
As previously mentioned, none of the tools or techniques discussed in preceding sections would be possible without data. It’s essential for CMOs to create a strong, unequivocal culture around data-driven marketing — whether it be maintaining hygienic CRMs or qualifying a hypothesis with data-backed experiments.
It’s also just as important to eliminate siloed data by unifying numbers and KPIs under one roof. This ensures that the entire department, if not organization, is on the same page.
2. Pick the right tools
Every marketing department is built different. CMOs must invest in appropriate tools and marketing technologies to support their team based on size, scale, and objectives. For example, heatmaps or attribution tools may not be essential to a smaller team that are just starting out. On the other hand, visitor identification, customer segmentation, and dashboarding tools can provide significant ROI for early-stage teams with limited budgets.
In addition to functionality, here are a few more aspects to consider when investing in a martech tool:
3. Create relevant dashboards
It’s definitely not feasible (or recommended) for CMOs to stay on top of every little marketing effort that the team’s working on. Instead, CMOs may rely on a bird eye’s view to guide strategy and improve performance at a higher level. CMO dashboards offer an intuitive view of all things marketing at a quick glance.
Suggested reading: The complete guide to building a SaaS CMO dashboard
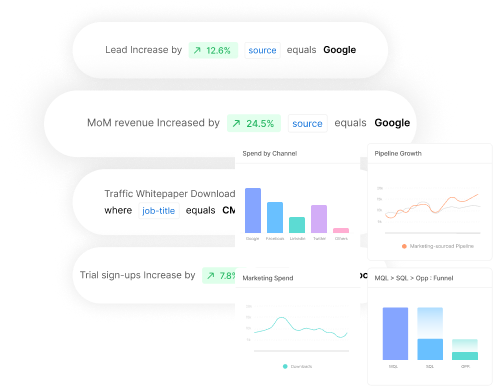
Based on the nature of your business, your CMO dashboard may reflect marketing spends, marketing sourced-pipeline by channel, MQLs generated by campaign, and other high-level marketing KPIs. You definitely don’t need to be bogged down by CTRs and likes, unless otherwise there’s a true anomaly in performance.
4. Ensure privacy compliance
Lastly, in an increasingly privacy-first digital ecosystem, it’s important to ensure privacy compliance with all the tools and technologies that associate with customer data. SOC2 Type II and GDPR are industry-standard security frameworks that you should look for in every data-based product you’re considering investing in. (Psst…Factors is SOC2 Type II, GDPR, PECR, and CCPA compliant)

{{INLINE_TOFU}}
How CMOs Can Take Marketing Data From Insights To Impact
Before concluding this article, here’s a quick highlight of the profound value that data can have on influencing and improving CMO responsibilities in this digital age.
- Optimize spends: Rather than relying on guestwork, CMOs can confidently allocate spend towards initiatives that work. This results in less marketing leakage all around.
- Real-time decision-making: Rather than relying on intuition alone or waiting several weeks, CMOs can take a glance at a dashboard to make quick, data-driven decisions.
- Drive marketing ROI: CMOs may adopt powerful tools like attribution to understand what works when. This results in the efficient allocation of resources and maximum ROI.
- Reduce CAC: With the right set of data, marketers can personalize targeting and improve conversion rates with less spend. This, in turn, reduces the cost of acquiring customers and even improves the overall LTV of customers.
- Prove marketing impact: Finally, marketing data and data-leveraging tools help CMOs quantify the impact of marketing on bottom-line business objectives like pipeline & growth.
And there you have it. We’ve seen how data has well and truly disrupted the role and responsibilities of a CMOs. Luckily, it's only for the better. CMO responsibilities have transcended creative strategy to encompass a wide range of bottom-line objectives — all of which can be turbocharged with the right data analytics tools and technologies.
Curious to see how Factors help CMOs drive marketing results and business growth? We’d be happy to have a quick chat!
CMOs play a critical role in shaping business success through integrated marketing leadership.
1. Core Responsibilities: Strategic planning, brand oversight, and aligning marketing with business goals.
2. Key Functions: Lead campaigns, analyze market trends, and drive data-informed decisions.
3. Strategic Impact: Foster collaboration across departments to boost performance and long-term growth.
Effective CMOs bridge vision and execution, ensuring marketing fuels measurable business outcomes.

How to Check Competitor Website Traffic: Tools, Benchmarks & Keyword Wins
Learn how to check competitor website traffic using Semrush, Similarweb, Ahrefs, and SpyFu. Compare visits, traffic sources, top pages, and keywords—plus understand what these estimates can and can’t tell you.
You might think you know what a competitor’s SEO strategy looks like. But are you really going to market on gut feel alone?
Sure, if you had an unlimited budget, you could afford to guess. Most of us don’t.
When you’re working with near-zero budgets and million-dollar growth targets, assumptions get expensive fast. What you actually need is real data on which content formats bring in visitors before you spend a single rupee.
That visibility comes from analyzing competitor website traffic.
The only catch is, you cannot access their first-party data through Google Analytics or Search Console.
So, let’s talk about the next best method to find competitor website traffic and keywords so you can compete for them on the SERPs.
Quick answer: how to check competitor website traffic
- Enter a competitor domain into Similarweb, Semrush, or Ahrefs.
- Review estimated monthly visits, traffic sources, and country-level trends.
- Inspect the site’s top pages and top keywords to see what drives that traffic.
- Compare multiple competitors over time instead of trusting a single snapshot.
What tools do you need for Competitor Website Traffic Analysis?
Before jumping into competitor analysis, you need the right website traffic analysis tools. Here’s a quick list of the free and paid ones you can use based on your budget and how deep you want to go.
ToolBest forTraffic data shownKeyword dataTop pagesTraffic sourcesFree accessMain limitationSimilarwebHigh-level traffic benchmarkingEstimated visits, geography, engagementLimitedYesYesLimited free checksBest for directional estimates, not exact analyticsSemrushTraffic share and channel analysisVisits, trends, market share, audience overlapStrong organic and paid dataYesYesLimited reportsFull competitive workflows require paid plansAhrefsOrganic traffic and page-level SEO researchOrganic traffic estimatesStrong organic keyword dataYesLimited channel detailNo meaningful free traffic checkerWeaker for full channel-mix benchmarkingSpyFuPPC competitor researchEstimated paid visibilityStrong paid keyword historySome landing-page visibilityLimitedLimited free lookupsMost useful for ads, not broad traffic analysisSE RankingBalanced SEO and paid snapshotsOrganic and paid estimatesGood keyword coverageYesYesLimited trial accessSmaller data sets than the largest platformsUbersuggestBudget-friendly keyword discoveryBasic traffic estimatesBasic organic keyword dataLimitedLimitedYesLess depth and fewer comparison features
Free Tools for Quick Checks and Analysis
- Similarweb Website Traffic Checker provides directional visits, traffic sources, and country breakdowns with five free daily comparisons.
- Semrush Website Traffic Checker offers 10 free traffic reports per month showing estimated traffic, channel mix, and accuracy scores.
- Neil Patel's Ubersuggest gives limited daily searches for traffic estimates and top keywords.
These free options work well for occasional competitor checks or when you're just starting to build competitive intelligence.
But when you need comprehensive website traffic data across multiple competitors with historical data tracking, premium tools become worthwhile investments.
Paid Tools for Deeper Analysis
Semrush Traffic Analytics + Market Explorer compares traffic share, audience overlap, and growth velocity across five domains. Key features include the Growth Quadrant showing who's gaining or losing position. According to Semrush's documentation, their clickstream data covers over 200 million users.
- Ahrefs Site Explorer excels at organic search intelligence with traffic estimates, top pages, and traffic share by domain. Ahrefs updates frequently, making it reliable for tracking ranking changes and spotting content momentum.
- Semrush paid plans add features such as Semrush Trends, advertising research, market share views, and social media tracking.
- SE Ranking provides organic and paid breakdowns with geographic distribution. Its models also adjust click-through-rate estimates based on SERP features.
- SpyFu specializes in PPC intelligence with budgets, paid keyword history, and ad copy variations. SpyFu tracks more than 15 years of historical data, revealing seasonal patterns and campaign trends.
Step-by-Step: How to Check Competitor Traffic
Running a one-time competitor check gives you a snapshot. Building a repeatable process gives you actionable traffic insights you can act on. The workflow below helps you move from curiosity about competitor traffic to a repeatable system that plugs directly into your content marketing calendar and paid campaigns.
1. Build Your Competitor List
Track both direct competitors (same products, same audience) and search competitors (ranking for your keywords).
Semrush Organic Research helps you expand beyond obvious rivals by showing sites competing for the same organic keywords.
Your direct competitor might be another project management tool, but your search competitor could be a productivity blog ranking for "how to organize team tasks." Both steal potential customers at different funnel stages. And you need to pay attention to both.
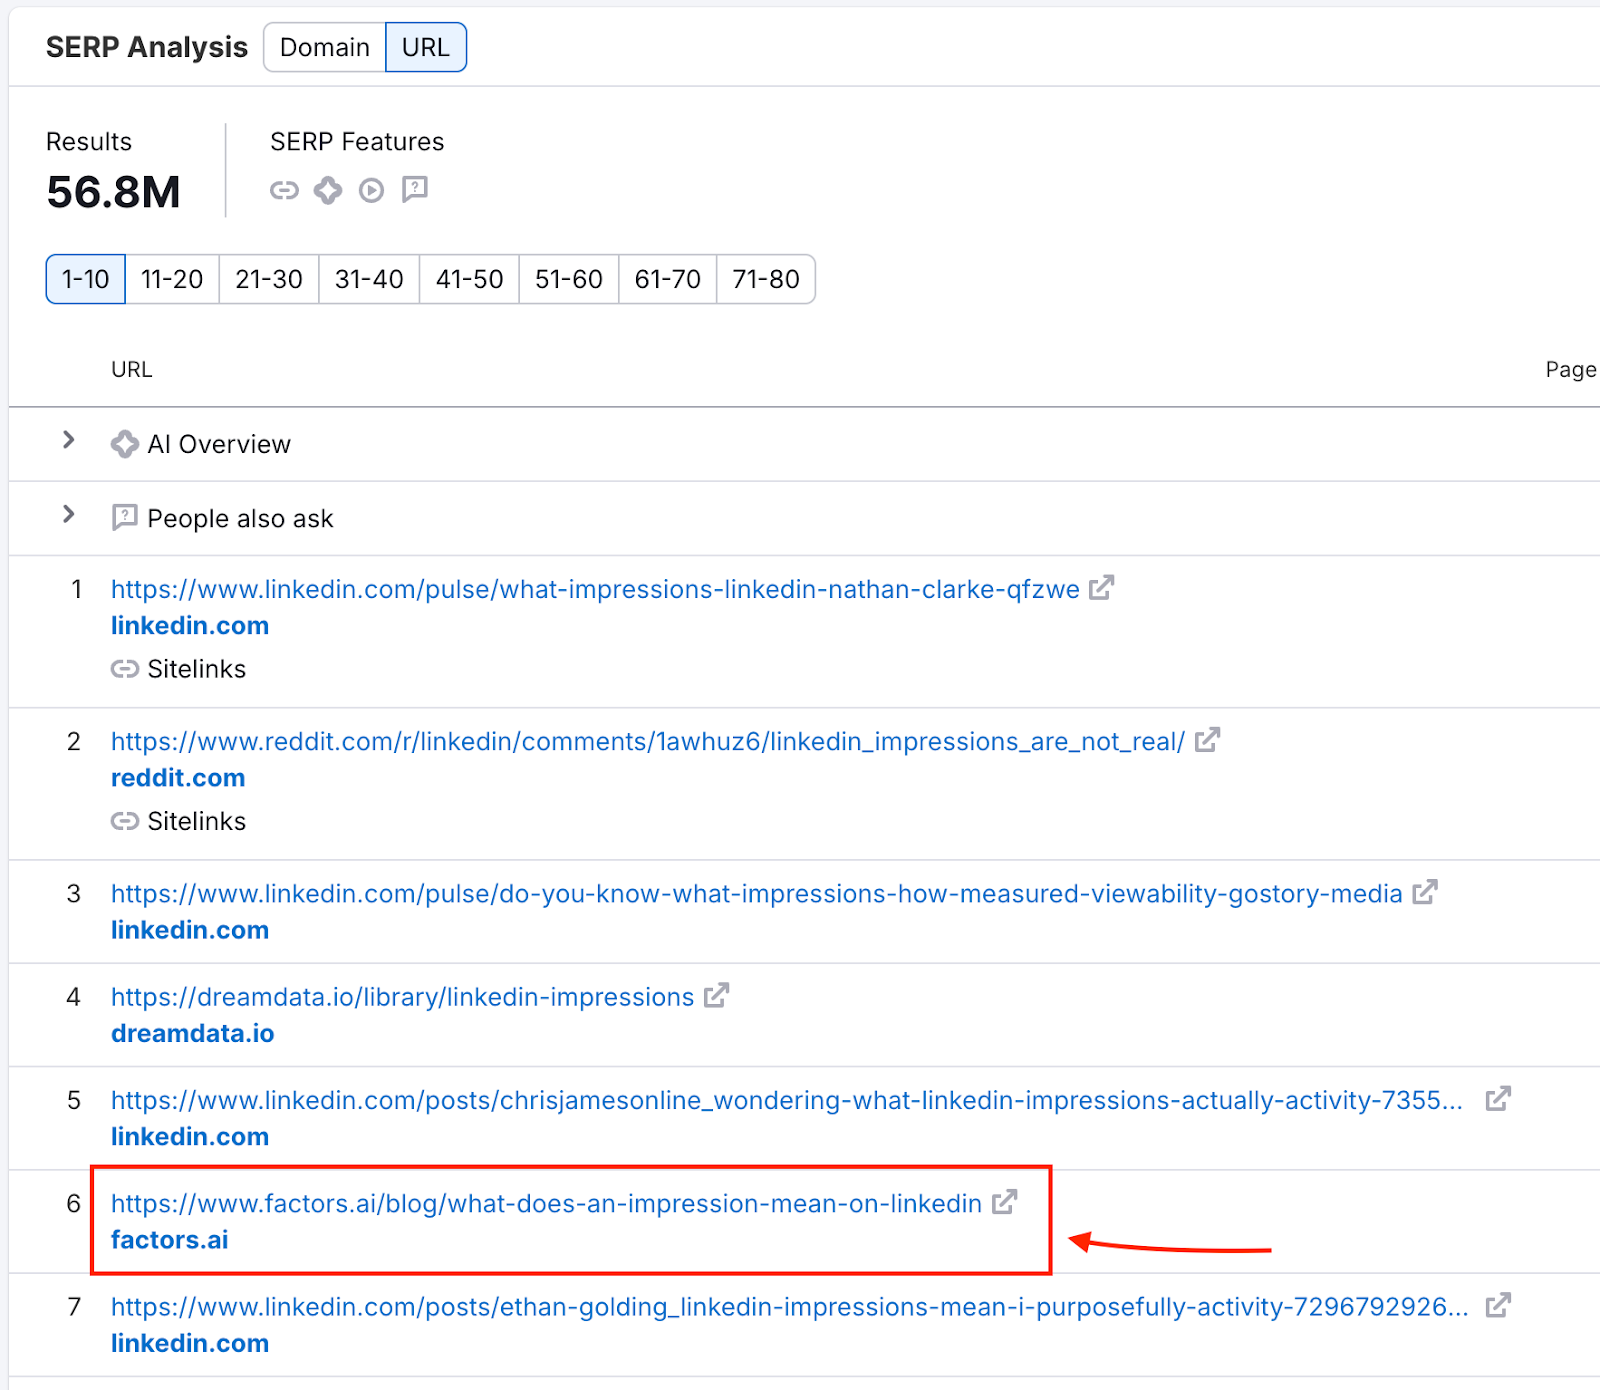
Here’s how you could go about it:
- Start by listing 3-5 companies you know compete for the same deals.
- Enter your domain in Semrush, navigate to Organic Research > Competitors, and you'll discover 2-3 sites you never considered.
- Pay attention to competitors with 30-50% keyword overlap. A CRM might compete with a sales automation tool and a lead generation guide for "sales pipeline management."
2. Get Traffic & Channel Mix
Pull up each competitor in Similarweb or Semrush. Then, note estimated monthly visits (US-filtered), channel split (organic, paid, direct, referral, social), and three-month traffic patterns.
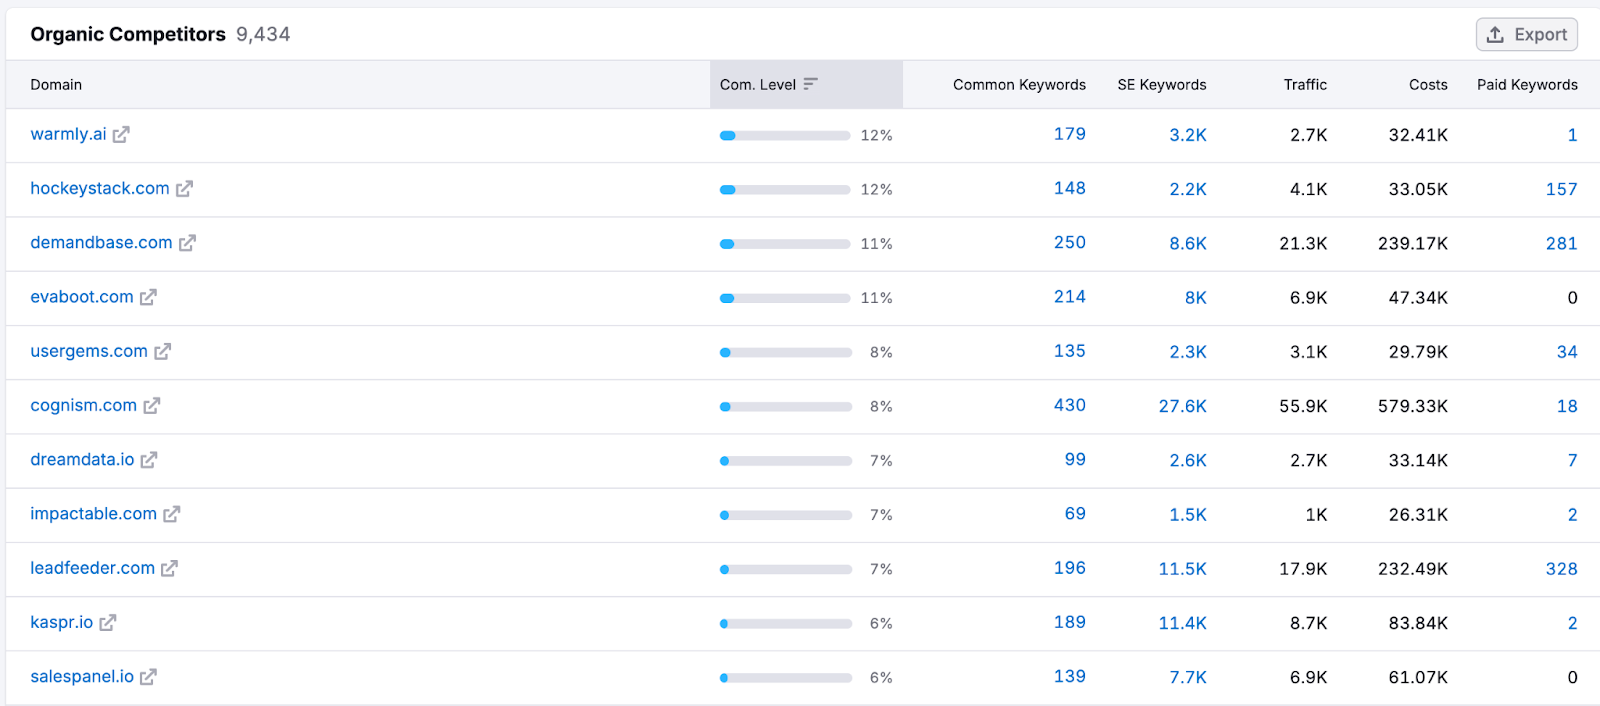
Channel mix reveals resource allocation.
- Competitor A shows 150k monthly visits: 65% organic, 15% paid.
- Competitor B shows 180k visits: 35% organic, 45% paid.
Despite similar traffic, they run different acquisition playbooks.
In this case, Competitor A has built an SEO moat while Competitor B relies more on paid acquisition with higher customer costs and greater ad-platform vulnerability.
3. Benchmark Share & Growth
Semrush Market Overview shows traffic share percentages and positions competitors in a Growth Quadrant: "Game Changers" (high growth, rising share), "Leaders" (high share, stable), or declining players.

For instance, you may celebrate 100k monthly visits while competitors capture 500k each. Then you discover the total addressable search volume sits at 5M monthly searches. You're fighting for 2% market share while three competitors own 10% each. That 70% unclaimed territory represents your real opportunity for gaining a competitive edge.
4. Identify Top Pages
Semrush Traffic Pages shows which URLs drive the most visits. The question you want to be asking is, does your competitor dominate with comparison pages, long-form guides, or product landing pages?
For instance, checking whether a page like our guide to the best ABM tools ranks well tells you whether listicles or dedicated comparisons win that space.
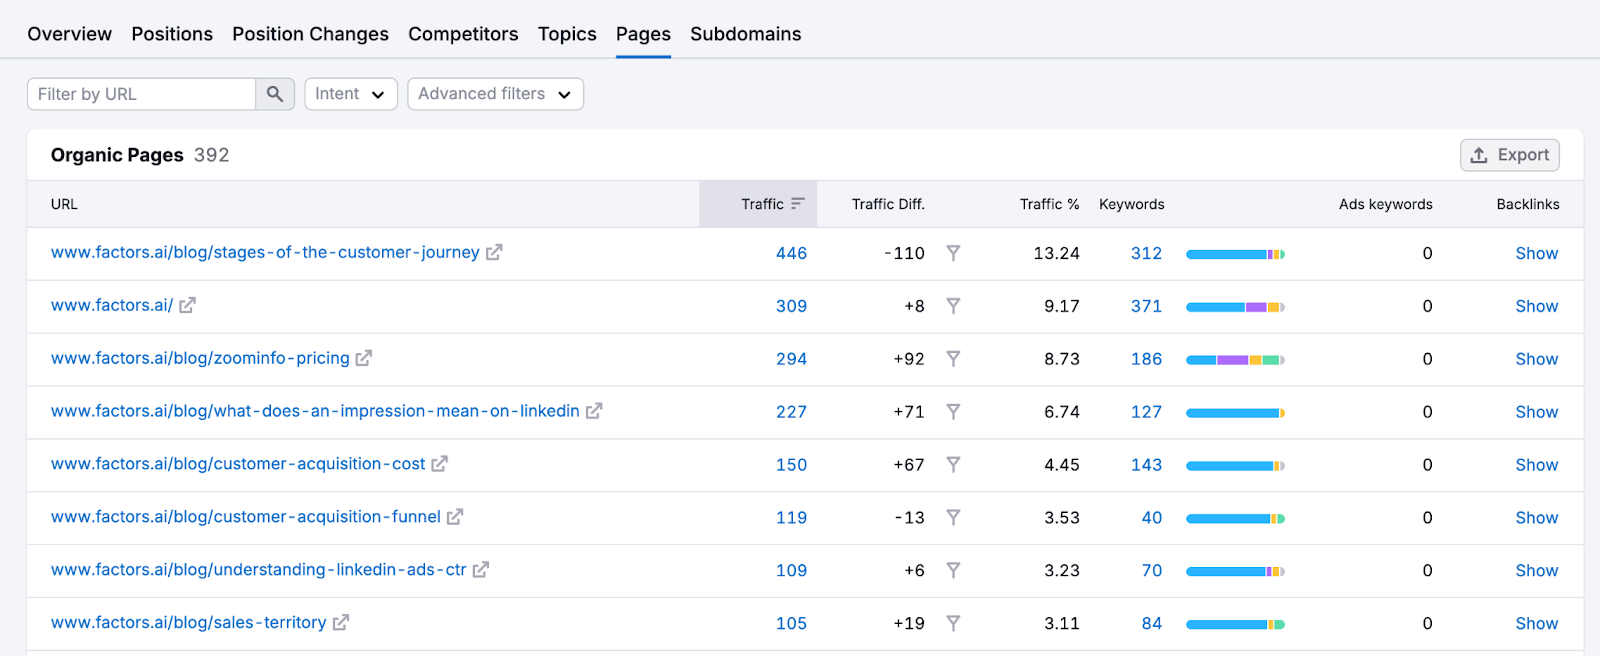
Go through 10-20 SERP competitors and look for repeatable content patterns. For instance, if 60% of your competitors have “A vs. B” comparison pages ranking in the top 10 and you don’t, that’s a clear gap you need to fill.
5. Turn Competitor Traffic Into Keyword Opportunities
Once you know which pages bring competitors the most traffic, the next step is turning those pages into keyword opportunities you can actually act on.
- Export the competitor’s top pages from Semrush, Similarweb, or Ahrefs.
- Pull the top organic keywords for each winning page and note position, volume, and traffic share.
- Group those terms by intent, such as comparison, category, integration, or problem-aware searches.
- Identify missing keywords you do not rank for and weak keywords where you sit outside the top 10 or top 20.
- Prioritize terms with clear commercial value, strong relevance, and realistic ranking potential.
- Feed the winners into your content roadmap, comparison pages, and paid search tests.
This step matters because traffic estimates alone tell you where competitors are winning, but keyword-level analysis shows why they are winning and what you should build next.
6. Monitor Changes
Set weekly snapshots in your chosen tool. For example, a tool like Visualping alerts you when competitor pages update.
You can create a simple tracking dashboard for the same. Every Monday:
- Log each competitor's total traffic, top 5 ranking changes, and new content published.
- Watch for sudden traffic spikes.
- Check Google Trends for the target keyword.
- Flat trend means they improved the content.
- A rising trend means they caught a wave.
Also set up Visualping to track their pricing page, features page, and main landing page. Pricing changes often precede major campaigns. New feature launches reveal product roadmap priorities.
When three competitors simultaneously increase paid spend, industry competition is heating up. When all reduce content output, that's your window to dominate organic search.
{{INLINE_BOFU}}
Going from Competitor Traffic to Competitor Keywords and Beyond
Traffic numbers tell you what. Keywords tell you the how.
Knowing a competitor gets 500k monthly website visitors means little until you understand which search terms and paid campaigns actually drive those visitors. So let’s look at the extraction process.
Organic Keyword Extraction
Semrush Organic Research shows every term competitors rank for, with position, search volume, difficulty, and traffic share. Filter for positions 1-10 with volume above 500 to surface their money keywords. Keyword Gap reveals shared keywords (you both rank, they outrank you), missing keywords (they rank, you don't), and weak keywords (you rank outside the top 20).
Ahrefs Site Explorer takes a page-level approach. Click any top page to see its organic keywords and traffic drivers. The "Traffic share by domains" report shows which competitors own visibility for specific keyword clusters.
Organic keyword research reveals what content attracts searchers. Paid keywords reveal where competitors invest actual budget, making them more reliable indicators of what actually converts.
PPC Competitor Keywords
SpyFu shows every keyword competitors bid on, estimated CPC, monthly spend, and ad copy variations. SpyFu's Kombat tool reveals keywords multiple competitors bid on for strong conversion signals. According to Directive Consulting, keyword overlap identifies high-value terms validated by competitor budgets.
Semrush Advertising Research and Ahrefs Paid Keywords show search ads copy, landing pages, and spend trends. Google Ads Keyword Planner offers free keyword discovery. Just enter a competitor's domain under "Discover new keywords."
Build Your Tracking Dashboard
Raw website traffic data doesn't help without organization.
Create a spreadsheet with these columns: Domain, US Visits (est.), Traffic Share %, Channel Mix, Top Pages, Top Organic Keywords, Top Paid Keywords, Change vs Last Month %, and Notes. Populate monthly to spot patterns like paid plan budget shifts, new content hubs, or post-redesign traffic drops.
How accurate is competitor website traffic data?
Competitor website traffic data is useful, but it is never exact. Tools such as Similarweb, Semrush, Ahrefs, and SpyFu rely on modeled estimates built from clickstream panels, keyword data, and other third-party sources.
That means each platform can show a different traffic number for the same domain. Smaller sites usually have wider error margins, while larger sites tend to produce more stable directional estimates. When two or three tools point to the same trend, you can trust the pattern more than the exact visit total.
Use competitor traffic tools for relative analysis, not perfect measurement. In practice, the most decision-useful metrics are:
- share of traffic versus competitors
- channel mix across organic, paid, direct, referral, and social
- top pages and the topics behind them
- month-over-month or quarter-over-quarter momentum
Cross-checking multiple tools gives you a more reliable view than relying on a single dashboard. If one platform says a site has 120k visits and another says 180k, the exact number may be fuzzy, but both can still confirm whether the competitor is growing, slowing down, or shifting channels.
What external tools still can't show
You'll never see exact Google Analytics data, conversion rates, or real user behavior metrics for a competitor. Email and app traffic also stay largely invisible. MonsterInsights confirms: "First-party data gives exact numbers only for properties you control. Third-party tools provide estimates."
These tools are excellent for tracking search visibility, traffic sources, and ranking patterns, but they cannot tell you what happens after visitors land on the site. You will not see bounce rate, time on page, or which sessions convert into pipeline or revenue. For your own site, pair competitor research with Search Console and analytics data for a complete picture.
Turn Competitor Traffic Into Your Content Strategy
Checking competitor traffic shows what's already working in your market. With that data, you're simply gathering validated strategies, then building better ones or filling in overlooked gaps.
To get started, pick one competitor and run them through Similarweb for traffic overview, Semrush for market share and top pages and organic keyword gaps. Export their top 20 ranking keywords and compare against your rankings. You'll typically find 5-10 terms where you could rank and haven't created content yet.
That's your roadmap. For paid campaigns, download their SpyFu keywords and filter for consistent monthly spend (conversion signals). Then test a few keywords in your campaigns with lower bids, tracking performance against existing keywords.
Set monthly check-ins to find traffic share changes, content launches, and ranking shifts. When a competitor gains 20% more organic traffic, investigate what changed. New content hub, site speed improvements, fresh backlinks. Learn from their wins while avoiding their losses.
Web traffic analysis works because it proves what converts in your market. Your competitors already ran the experiments and validated the demand. You just need to analyze the results and execute better. Combine these website traffic checker insights with other tools like Google Analytics and Search Console for your own properties to build complete market intelligence.
Frequently Asked Questions
Q: How can I see how much traffic a website gets?
A: Use Similarweb or Semrush for directional traffic estimates, then add Ahrefs for top pages and organic keyword data. Treat the numbers as trends, not exact analytics, and cross-check multiple tools when possible.
Q: What's the most accurate way to check traffic?
A: The most accurate view is the site owner’s internal analytics, which you cannot access. For competitor research, combine Semrush, Ahrefs, and Similarweb and validate what you see against keyword rankings and backlink signals.
Q: How do I compare competitors' traffic against mine?
A: Use Semrush Market Explorer or similar benchmarking views to compare traffic share, growth trends, and channel mix. Relative positioning usually matters more than exact visit counts.
Q: Which tools show competitors' top pages?
A: Semrush Traffic Analytics and Ahrefs Top Pages are the most useful starting points. They surface the URLs driving the most visibility so you can reverse-engineer formats, topics, and keyword themes.
Q: How do I find competitors' PPC keywords?
A: Use SpyFu first for paid keyword lists, spend estimates, and historical ad copy. Semrush Advertising Research and Ahrefs Paid Keywords can then help confirm active terms and landing pages.
Q: Any free ways to get competitors' keywords?
A: Yes. Google Ads Keyword Planner offers free discovery if you enter a competitor domain under "Discover new keywords," and Ubersuggest provides a limited number of daily searches.
Q: What is the best free tool to check competitor website traffic?
A: Similarweb is usually the best free starting point for competitor website traffic because it quickly shows estimated visits, traffic sources, and geography. Semrush’s free reports and Ubersuggest can also help, but they are more limited.
Q: Can I see a competitor’s Google Analytics traffic?
A: No. You cannot see a competitor’s exact Google Analytics traffic unless they give you access. Third-party tools can only estimate traffic based on external data sources and modeling.

What is Content Analytics and How Should You Approach It? Here’s What 10 Experts Have to Say
Learn how you can utilize content analytics to improve your sales and marketing teams’ ROI.

As digital marketing takes on new complexities, it’s essential for your marketing plan to incorporate content analytics. This will help you have a more detailed understanding of how customers interact with your company. You’ll be able to make more informed, data-driven decisions to effectively reach and convert your target audience.
What is content analytics?
Content analytics, or content intelligence, is a set of technologies that analyzes digital content in order for you to understand which content is performing well with your target audience. This enables you to create the most effective digital content possible to drive more conversions.
How does content analytics work?
B2B companies often offer highly specialized solutions. Accordingly, businesses must target their niche audiences with dedicated marketing initiatives and content that address relevant paint-points and use-cases.
You can generally figure out which content works best for your clients by analyzing certain metrics for the unstructured content your business has put out. Analytics and attribution tools like Factors.ai help marketing teams with granular insights into content performance and bottom line impact.
It’s important to remember that content analytics and attribution isn’t a linear process. We got in touch with B2B content industry leaders to ask how many metrics they use to measure content performance. Here’s what they had to say:
We also asked them which metrics they think are the most important in measuring the effectiveness of content. Here’s what they had to say:
- Clickthrough rate (CTR): Sophia Madhavan at GrowthMakerz and Vitaliy at Videowise include the CTR in the list of metrics they use to evaluate how well their content is doing. The CTR allows you to see how many times visitors to a certain page organically search for your content or click on your ad as a ratio to the total number of visitors to that page.
- Impressions: Impressions give you insight into the level of engagement your content is generating. This content could be a web page, advertisement, or blog post, for instance. Madhiruma Halder at Recruit CRM lists impressions among the metrics they use to understand how their social media campaigns and search engine marketing are performing.
- Marketing qualified lead (MQL): Not all leads are created equal. A lead that takes any high intent actions like scheduling a demo or signing up for a trial is far more likely to convert than others. Karishma Chopra at Hiver believes that the effectiveness of content should be measured in terms of its influence in driving MQLs.
- Time on page: The time a prospect spends on a particular page is indicative of their interest in the solution you’re offering. Praveen Das at Factors then uses these insights to create marketing campaigns informed by the content their prospects and clients are interested in.
- Scroll depth: Scroll depth is a measure of how far your website visitors scroll down a certain page. As a general rule of thumb, if most of your website visitors are scrolling at least halfway down the page, it indicates that your content has substantial value.
- Unique users: Chelsea Downing-West at The Martec finds unique users a crucial metric. The number of unique users may be challenging to calculate. Effective visitor identification allows you to see how many unique visitors your website receives by counting each visitor only once, no matter how often they visit the website.
- Bounce rate: The bounce rate of your website indicates the ratio of visitors who access your website and leave instead of clicking on and going through other webpages.
- Engaged Accounts: Understanding which specific accounts are consuming the content is another intuitive way for content marketers to analyze its effectiveness. Visitor Identification softwares like Factors can help marketers identify the account and its properties (employee range, industry) even if the user does not fill up a form. This helps Content Marketers plan content efforts tailored to specific industries or scale of employees.
Why is content analytics important?
Your website content is the first thing that prospects see when they’re evaluating your company. It creates a lasting impression about your services. Content analytics helps you understand the types of content that perform well among your target audience, which in turn is crucial to designing a successful customer experience.
Moreover, marketing teams spend a substantial amount of time and budget to create content that prospects find valuable. A few of the experts we surveyed responded that they hire in-house teams for content creation and distribution. This indicates how valuable creating effective marketing content is to increasing overall revenue; B2B companies are willing to invest in salaries, 401(k)s, and insurance to generate engaging content. Respondents stated that they spent anywhere between $1000 and $10,000 a month towards content creation and distribution.
This expense makes sense when you consider how much content contributes to the overall pipeline. Respondents stated that the monthly investments they make towards content creation reaps significant rewards. Although responses varied greatly, most of the experts cited that around 30-40% of the pipeline is influenced by content creation and distribution.
Creating valuable content for prospects is almost entirely dependent on content analytics. Content analytics offer your sales and marketing teams multiple benefits:
- Helps marketers redefine their strategy based on how current content is performing
- Calculates the ROI for each piece of content, which in turn guides future content strategy and content repurposing.
- Superior prospect experience by focusing on the most relevant content and elimination of guesswork
- Quicker and easier conversion for prospects by offering them content that is relevant and important for them at each stage of the funnel
- Cuts down on redundant content by immediately finding out when certain pieces are underperforming
{{INLINE_TOFU}}
How can content analytics contribute to a better customer experience?
Understanding each interaction a prospect or customer has with your website and other marketing collateral enables you to improve your content offerings. You’ll be able to offer customers a far better experience by analyzing and iterating based on content data. Content analytics helps you:
Offer relevant content
You can offer clients valuable content depending on where they are in the conversion process. Content analytics help you anticipate which content is relevant at every stage of the funnel, thereby streamlining communication with prospects and clients alike.
Address specific client needs
You can also create a 360-degree buyer persona for existing clients. An integrated analytics software like Factors allows you to have a holistic overview of each client so you can see every interaction they’ve had with your company. You have access to each touchpoint and all their past behavior, thereby enabling you to make educated guesses about their pain points.
For instance, let’s say you run a company that creates CRM software. You could find through trends in content analytics that customers from the tourism industry are interested in the customer service features it offers. On the other hand, customers in the tech industry are more interested in its customization and workflow automation features. You can then use these trends to offer them content that best fits their needs.
Hyper-personalize your content
Prospects today expect a highly customized experience tailored to their needs. It’s essential to curate a personalized experience in order to create a lasting client relationship. Understanding which channels your client base uses, the keywords they’re interested in, and the time they spend trying to solve a pain point on a webpage are all crucial to personalization.
Make better decisions
Content reporting can help you make deeply informed decisions with respect to pricing, sales, organizational goals, and communication. You’ll never have to rely on guesswork again; all you need to do is gather user data through an analytics tool and leverage it relentlessly.
Your clients have needs that are continuously evolving, so you have to continuously utilize real-time data to create adaptive strategies that help you get the most out of your investment.
What are the biggest challenges of content analytics?
Customers’ preferences and expectations from content are constantly changing. Jess Cook from LASSO puts it best: content analytics isn't an exact science. Here are the biggest challenges that marketing and sales teams encounter in the process of analyzing content data:
Data silos
Your sales and marketing teams need access to a unified customer data infrastructure. End-to-end account journeys are of the utmost importance when you’re streamlining the sales and marketing processes. If your sales and marketing teams work independently of each other, there’s a huge chance that they have access to disconnected data.
Data silos lead to an underwhelming customer experience. The sales team should have access to all the marketing touchpoints the user has been through to avoid repetition, tedium, and misunderstandings in the sales process.
Account identification
De-anonymization is crucial to effective analytics, since you need to see how many unique visitors your website is drawing and the firmographic characteristics of these users such as company name, industry, employee range and revenue range. However, all users on the internet want anonymity, and there are laws to protect user data from illegal tracking.
Free content analytics tools have limitations
Tools like Google Search Console (GSC) offer users limited insight. Saffia Faisal at Userpilot believes that GSC is inadequate for dedicated content analytics and reporting. B2B companies require an in-depth analysis of how their content is performing. GSC’s algorithm limits accuracy in reporting, providing just a signal of how content performs. GSC also imposes limitations on the number of rows of data that can be exported at a query level.
How content analytics works in Factors
Content marketers and sales strategists need access to real-time, relevant data that provides a holistic overview of content and customers alike. These insights can help tailor new content based on what works, thereby driving greater revenue. Here's how Factors helps improve your content analytics efforts:
Customizable dashboards
Remember the data silos we mentioned earlier? They slow down the progression of the accounts into the sales funnel and may lead consumers to drop out of it altogether. With Factors, however, you have all your customer information present on the same dashboard. Your sales and marketing teams will have access to consistent information, and will be able to see all your clients’ touchpoints. You can choose which metrics you want to view on the dashboard.
Easy account identification
With Factors’ reverse IP lookup, you’ll be able to identify which companies are interested in your solutions through their website visits. If an individual in a company visits your website, Factors will match its IP address within its existing database and identify the company name and domain, industry, annual revenue, and employee headcount. Since the database relies on publicly available data and the data you draw from your website, this process is fully compliant with user privacy protections.
You’ll also be able to see which stage of the funnel a particular prospect is at by the type of content they consume. Once you know the identity and needs of your prospects, you can target them in a personalized manner.
Automated analytics and attribution
Your sales and marketing teams won’t need to crunch numbers or look for missing information. Factors provides all the data you need, such as time on page, page load time, button clicks, scroll percentage, and page views. By automating the process of content data collection, your teams can focus their energies on strategizing and creating quality content for clients.
Factors’ multi-touch attribution model helps your company understand the customer journey and give credit to the touchpoints involved in the conversion process. It provides more detail with respect to user behavior when compared to single-touch models. A multi-touch attribution model aims to highlight which touchpoints have the greatest influence in the account’s journey, and how they work together.
Adaptation based on new insights
Your customers’ requirements are constantly evolving. It’s necessary for your analytics and attribution systems to respond to these nuances. Factors allows you to obtain instant insights about which content assets are redundant or performing well. You can use these content performance reports to refresh older content and push pieces that are doing well across more channels.
Get in touch with us today to find out how Factors can help your company improve its content analytics and reporting.
FAQs
How do you use analytics in content marketing?
Content analytics include reporting on website, marketing, and sales metrics. Understanding how customers interact with your content allows you to personalize your marketing campaigns in order to drive more conversions. Measuring these metrics also helps you address specific pain points and therefore improve the overall consumer experience for your solution.
Which metrics should I measure for content performance?
We asked experts about the metrics they keep track of to ensure high content performance. Their responses included clickthrough rate, impressions, marketing qualified leads, scroll depth, time on page, unique visitor identification, downloads, funnel movement, influenced demos, and bounce rate.
The Hidden Complexity of LinkedIn Conversion Tracking: Connecting LinkedIn, Web Tracking and CRM
Learn how to navigate LinkedIn conversion tracking complexities, connect web and CRM data, and optimize campaigns for better B2B outcomes.

TL;DR
- LinkedIn conversion tracking is more complex than Google Ads due to multi-session, multi-channel B2B buyer journeys.
- Traditional tools often miss connections between website interactions and CRM data, leaving blind spots.
- Effective tracking requires capturing website and CRM events, retaining LinkedIn click IDs, and connecting offline conversions.
- Factors’ AdPilot bridges data gaps, providing a complete view of LinkedIn campaign performance for better optimization and ROI.
LinkedIn conversion tracking isn't as straightforward as it might seem. While other platforms like Google Ads follow a relatively simple path from click to conversion, LinkedIn's B2B nature makes things a bit more complicated. Let's break down why this matters and how to get it right.
Also, read optimizing LinkedIn ads targeting for B2B audience by focusing on intent signals.
Understanding LinkedIn Campaign Types
First, let’s break down the two main ways people engage with your LinkedIn ads:
- Lead generation campaigns where visitors fill out a form directly on your website
- Website visit campaigns where users click an ad and engage with your content
Both seem simple enough on the surface, but there's more to the story.
The Click ID Challenge
When someone clicks on your LinkedIn ad, a LinkedIn Insight Tag (similar to Google's GCLID) is generated. This unique identifier helps track what happens after the click. But here's where things get interesting - and challenging.
Unlike Google Ads, where most conversions happen directly on your website after a click, LinkedIn conversions often occur through multiple channels and over longer periods. This creates some unique tracking challenges.
{{INLINE_TOFU}}
The Multi-Session Reality
Consider how B2B buyers typically behave. They might:
- Click your ad and browse your website briefly
- Leave without taking action
- Return days later to check out your pricing page
- Finally convert through a completely different channel
Traditional tracking systems often miss these complex journeys because they only look at single-session interactions. To get the full picture, you need a way to track and retain the LinkedIn conversion identifier across multiple sessions.
Online vs. Offline Conversion Tracking
Here's another challenge: LinkedIn conversion tracking needs to combine both website data and CRM data. Most tools only handle one or the other:
- LinkedIn Insight Tag tracks website interactions
- Zapier handles CRM events but ignores website data
This split creates a significant blind spot. You either lose visibility into website interactions or miss valuable CRM conversions, making it hard to track the full buyer journey effectively.
The B2B Conversion Difference
Perhaps the biggest misconception about LinkedIn conversion tracking is assuming it works like Google Ads. On Google, the conversion path is typically linear: click, visit, and fill out a form. LinkedIn, however, operates differently because it’s primarily an Account-Based Marketing (ABM) platform.
Your LinkedIn ad might influence conversions that happen through various channels:
- An SDR email gets a response because the prospect recognizes your brand from LinkedIn ads
- A sales call goes well because the prospect has been seeing your content
- A prospect engages with your website over multiple sessions before reaching out
These ‘indirect’ conversions are just as valuable as direct form submissions – maybe even more so. But they're harder to track.
Sending the Right Signals
To make LinkedIn's bidding engine work for you, you need to feed it comprehensive conversion data. This means:
- Capturing website interactions across multiple sessions
- Tracking CRM events and offline conversions
- Connecting everything back to the original LinkedIn click ID when possible
- Using email and company data for matching when click IDs aren't available
By feeding LinkedIn’s system with richer data, you improve its ability to optimize campaigns for better performance.
Making It All Work Together with Factors
The key to successful LinkedIn conversion tracking is having a system that can:
- Track both website and CRM conversions
- Retain click IDs across multiple sessions
- Connect offline conversions back to LinkedIn campaigns
- Handle various types of conversion events
This is where Factors’ AdPilot suite steps in. We bridge the gap between your data sources, stitching together website and CRM data to provide a complete view of your LinkedIn campaign performance. With Factors, you’ll see exactly how your LinkedIn conversions happen, enabling smarter optimization and better results.
The Bottom Line
Effective LinkedIn conversion tracking requires thinking beyond simple click-to-convert scenarios. By understanding and properly tracking the complex B2B buyer journey, you can:
- Get more accurate campaign performance data
- Help LinkedIn's algorithms optimize for your actual business outcomes
- Prove the real ROI of your LinkedIn advertising efforts
Remember, in the B2B world, conversions rarely follow a straight line. Your tracking solution needs to be as sophisticated as your buyers' journey.

Cognism Pricing 2026: Plans, Costs & Alternatives
Get a complete breakdown of Cognism pricing for 2026. Discover platform fees, per-seat costs, hidden onboarding charges, and the best B2B alternatives.

TL;DR: Cognism Pricing Summary
- Pricing Model: Annual contracts with platform fee + per-seat licensing
- Grow Tier (formerly Platinum): $1,500–$10,000/year (essential features, 25M contacts)
- Elevate Tier (formerly Diamond): $2,550–$25,000/year (verified mobiles, intent data, AI features)
- Platform Fee: $15,000 (Grow) or $25,000 (Elevate) baseline
- Per-Seat Cost: ~$1,500/user/year (Grow), ~$2,500/user/year (Elevate)
- Free Trial: No free trial available; demo only
- Hidden Costs: Onboarding ($500–$1,500), intent data add-ons, 10-15% annual renewal increases
- Best For: Enterprise teams targeting European markets with $10K+ budgets
Cognism is a popular B2B sales intelligence platform that helps users discover and engage with their ideal prospects with premium company and contact information. But with numerous alternatives available to users, how does Cognism fare in terms of its data quality, pricing, and features?
In this blog, we'll explore Cognism, Cognism pricing, and Cognism's alternatives in detail
What is Cognism?
Cognism is a sales intelligence platform that provides advanced data enrichment, lead generation, and prospecting features to help businesses improve GTM operations. Here's how Cognism impacts each of these verticals:
Cognism enables direct dialing of verified contacts, streamlines the process of prospecting for new leads, and provides access to company-specific data, enhancing lead generation and qualification efforts.
For marketing teams, leveraging the platform facilitates the targeting of new accounts with contextual data points that make it easy to build account lists. It also equips marketing teams with intent data for a more targeted approach.
Furthermore, Cognism serves as a valuable tool for GTM leaders in devising strategic initiatives to drive company growth. It aids in identifying buyer intent, matching and populating missing lead values in your database, and setting a more accurate lead scoring system.
Here are all of Cognism's product offerings that help achieve these results:
Prospector: Cognism combines contextual data with intent data helping you truly understand your buyer to get your relevant message right in front of buyers.
Enhance: Cognism prevents data decay and helps append your database with updated company and contact information so you don't lose out on revenue.
Intent Data: Cognism Intent Data helps you identify accounts actively searching for your product or service, making the sales cycle shorter and helping reduce CAC.
Cognism's product offerings and features serve different purposes for different operations, but what about its impact on your growth and revenue?
Who Is Cognism Best For?
Cognism isn't a one-size-fits-all solution. Here's who benefits most from the platform:
Also read: 10 Best Madison Logic Alternatives And Competitors In 2026
- Enterprise SDR/BDR teams: Teams with 5+ reps running high-volume outbound campaigns benefit from unlimited exports and Diamond Data's verified mobiles
- Companies targeting EMEA: Cognism's European data coverage is unmatched, making it ideal for businesses expanding into or focused on EU markets
- Revenue leaders needing intent signals: GTM leaders who want to prioritize accounts showing buying intent through Bombora integration
- Organizations with strict compliance needs: Cognism's built-in GDPR, SOC2, and ISO27001 compliance is critical for companies in regulated industries
Cognism may not be the best fit for: Solo SDRs or freelancers (minimum $15K+ annual cost), US-only prospecting teams (stronger alternatives exist), or startups needing month-to-month flexibility.
{{INLINE_BOFU}}
Why Choose Cognism?
Cognism has great benefits for businesses looking to streamline their sales prospecting and create laser-focus outreach campaigns that shorten the sales cycle and drive revenue and growth:
1. Compliance and Security
Security forms the core of Cognism's service provision. The platform maintains rigorous compliance with GDPR, SOC2, and ISO27001 standards, guaranteeing the protection and responsible handling of your business data in line with globally recognized benchmarks. Cognism's dedication to safeguarding Personally Identifiable Information (PII) underscores its commitment to ensuring robust security measures.

2. Integrations
Cognism's integration library may not be as extensive as some competitors, but it still offers a solid selection of compatible apps. This is understandable considering Cognism's smaller user base. Despite its smaller customer pool, Cognism provides integration options with popular platforms such as HubSpot, Salesforce, Pipedrive, Microsoft Dynamics, Outreach, Zapier, Wufoo, Salesloft, Vidyard, G Suite, Yahoo, Office365, Gmail, Insightly, Slack, Zoho CRM, Copper, and Close.

3. Chrome Extension
The Cognism browser extension gives you quick access to company employees and your prospects' coworkers. It not only enhances LinkedIn profiles and Sales Nav prospect lists with actionable contact data but allows you to access company website information on target firms and their employees.
The Cognism Chrome extension integrates seamlessly with Outreach and Salesforce to enrich records within your CRM or Sales Engagement tool- making it easier for sales teams to perform tasks without switching back and forth between multiple tabs or windows.
4. Diamond Data (Phone-Verified Mobiles)
Cognism's Diamond Data is its standout differentiator. Unlike standard databases that rely on algorithmic verification, Diamond Data contacts are manually phone-verified by Cognism's research team. This results in significantly higher connect rates for cold calling — users report 2-3x better pickup rates compared to non-verified numbers. Diamond Data is available exclusively on the Elevate (formerly Diamond) tier.
5. Bombora Intent Data
Cognism partners with Bombora to provide B2B intent data that identifies accounts actively researching topics related to your product or service. This helps sales teams prioritize accounts showing genuine buying signals, shortening the sales cycle. Intent data topics can be customized but may cost extra depending on your plan — typically $75–$400 per additional topic beyond what's included in your package.
Cognism Pricing
Although Cognism refrains from providing detailed pricing information on its website, the factors influencing pricing can aid prospective clients in understanding the associated costs. Here are the three factors that help determine the pricing for Cognism's clientele:
1. Core Platform Fee
Central to Cognism's pricing model is a fixed platform fee, granting users access to its web application and Chrome extension. Moreover, Cognism seamlessly integrates with popular sales tools like Salesforce and HubSpot. This fee ensures users can harness the platform's robust functionalities and integrations to optimize their sales and marketing endeavors.
2. Unrestricted Data Access
Cognism's platform offers an extensive repository of data to assist businesses in identifying and engaging potential leads. Under the pricing structure, users benefit from unrestricted access to this data, including the ability to export information for utilization in other applications or tools. This access empowers users to fully leverage the platform's potent data capabilities for lead identification and targeted marketing initiatives.
3. Adaptable Workflows
One of the main reasons why Cognism's pricing structure is tailor-made is because of its custom workflows. This feature enables users to customize the platform to suit their specific requirements, crafting workflows that enhance lead qualification and streamline the sales process, and are charged accordingly.
Also read: Top 10 Warmly.AI Alternatives and Competitors In 2026-Compare Pros, Cons & Pricing
These factors determine the final cost in their pay-as-you-go subscription model. However, the ambiguity may be a cause of concern for businesses of all sizes. Apart from this, Cognism does not provide a free trial. Uncertainty with Cognism pricing? Here are a few alternatives for your consideration:
Estimated Cognism Cost by Team Size (2026)
| Team Size | Grow (formerly Platinum) | Elevate (formerly Diamond) |
|---|---|---|
| 1 user | $16,500/year | $27,500/year |
| 3 users | $19,500/year | $32,500/year |
| 5 users | $22,500/year | $37,500/year |
| 10 users | $30,000/year | $50,000/year |
Note: These are estimated costs based on publicly available data. Actual pricing varies based on negotiation, contract length, and specific feature requirements. Contact Cognism for a custom quote.
Hidden Costs & Contract Considerations
Beyond the base platform fee and per-seat licensing, there are additional costs to factor into your Cognism budget:
- Onboarding fees: $500–$1,500 depending on team size and customization needs
- Intent data add-ons: Bombora intent topics may cost extra ($75–$400 per topic) depending on your plan
- Annual renewal increases: Users report 10–15% price increases upon renewal — negotiate a price lock upfront
- Auto-renewal clauses: Contracts typically auto-renew 30–60 days before expiration. Mark your calendar to renegotiate
- Fair-use limits: While Cognism advertises 'unrestricted access,' high-volume usage may trigger fair-use policy reviews
- No monthly billing: Annual contracts only — no month-to-month flexibility
Negotiation tip: Request a multi-year discount or ask for intent data topics to be bundled into your base package. Teams that negotiate can save 20–30% off the initial quote.
Is Cognism Worth the Price?
Whether Cognism is worth the investment depends on your team's size, target market, and outbound strategy. Here's a quick breakdown:
Cognism is worth it if:
- Your team targets European/EMEA markets — Cognism's GDPR-compliant data and EU contact coverage is industry-leading
- You rely heavily on cold calling — Diamond Data (phone-verified mobile numbers) delivers high connect rates
- You're an enterprise team with $15K+ budget and need unlimited data exports
- You need Bombora intent data integration to prioritize accounts showing buying signals
Cognism may not be worth it if:
- You're a startup or SMB with a limited budget — the $15K+ annual commitment is steep
- Your primary market is the US only — alternatives like ZoomInfo or Apollo offer stronger US data
- You need a free trial before committing — Cognism only offers demos, not hands-on trials
- You want month-to-month flexibility — Cognism requires annual contracts
What Real Users Say About Cognism
Based on user reviews and community discussions across Reddit, G2, and Capterra, here's what actual Cognism users report:
What Users Like
- European data quality: Cognism's EMEA contact database is consistently praised as best-in-class, especially for phone-verified mobile numbers
- GDPR compliance: Built-in compliance features give teams confidence when prospecting in regulated markets
- Unlimited exports: Unlike competitors with credit-based systems, Cognism includes unlimited data exports
- Chrome extension: Seamless LinkedIn enrichment and CRM integration directly from the browser
Common Complaints
- Pricing transparency: Users consistently wish Cognism would publish pricing publicly instead of requiring a sales demo
- US data coverage: Several users note that US contact data quality doesn't match the European database strength
- No free trial: Unlike alternatives like Apollo or Lusha, Cognism doesn't offer a hands-on trial period
- Contract rigidity: Annual contracts with auto-renewal clauses frustrate users who want flexibility
Sources: Reddit r/marketing, r/sales, G2, Capterra reviews
Cognism Alternatives
Here are some of the most popular Cognism alternatives for B2B businesses:
1. ZoomInfo
ZoomInfo offers a robust platform beyond traditional B2B contact directories, catering specifically to sales, marketing, and recruitment professionals. In addition to its expansive database of detailed profiles, ZoomInfo provides unique features such as intent signals, which indicate companies actively exploring specific topics. Another one of its notable features is Scoops, offering valuable insights into potential business opportunities. For those seeking to optimize their outreach strategies, ZoomInfo is a standout choice.
Why pick Zoominfo over Cognism: While Zoominfo and Cognism pricing arent transparent and can prove to be costly for smaller teams, features like Scoop and advanced analytics are bonus features that make Zoominfo a better choice for teams looking for added capabilities in their sales intelligence software.
Also read: ZoomInfo Alternatives: Top 6 ZoomInfo Competitors In 2026
2. Clearbit (now Breeze Intelligence by HubSpot)
Clearbit was acquired by HubSpot in 2023 and rebranded as Breeze Intelligence. It's now natively integrated into HubSpot's CRM platform, providing real-time data enrichment and visitor identification directly within HubSpot workflows. While it's no longer available as a standalone product, HubSpot users benefit from seamless enrichment without third-party integrations.
Why pick Clearbit/Breeze over Cognism: If your team already uses HubSpot CRM, Breeze Intelligence provides native data enrichment without additional platform fees. However, it's no longer a standalone alternative — non-HubSpot users should consider Apollo.io or Lusha instead.
3. Lusha
Lusha, a Sales Intelligence Software, empowers business professionals in building trustworthy connections with leads, contacts, and candidates. With streamlined tools, it facilitates the enrichment and verification of business profiles, aiding sales, recruitment, and marketing efforts.
Lusha simplifies the process by retrieving emails and phone numbers with just one click, enhancing business profiles across social networks, Gmail, and Salesforce. Its clientele spans from small and medium businesses to industry giants like Google, Amazon, Salesforce, and Apple.
Why pick Lusha over Cognism:
Lusha claims to update its database weekly and provides proactive job change alerts to keep the sales team well-informed. Cognism falls short in this aspect as users report receiving outdated information on the platform.
4. Factors.ai
Factors is an account intelligence tool with robust partnerships with 6sense and Clearbit. This is reflected in our database of over 50M companies & 4.7B IP addresses. Factors delivers industry-leading enrichment rates of up to 64% and helps qualify and target the right accounts based on website engagement, intent signals, and firmographic information.

5. Apollo.io
Apollo.io is one of the most popular Cognism alternatives for startups and SMBs. It offers a generous free plan with 10,000 email credits/month, making it accessible for teams that aren't ready for Cognism's $15K+ annual commitment. Apollo combines a 275M+ contact database with built-in email sequencing, a dialer, and meeting scheduling — eliminating the need for separate sales engagement tools.
Why pick Apollo over Cognism: Apollo's free plan and affordable paid tiers ($49–$119/user/month) make it the go-to choice for budget-conscious teams. While Cognism excels in European data quality, Apollo offers stronger US coverage and an all-in-one platform that reduces your total tech stack cost.
6. 6sense
6sense is an account-based marketing (ABM) platform that uses AI to identify anonymous buying signals and predict which accounts are in-market. Unlike Cognism's focus on contact data, 6sense emphasizes account-level intent intelligence to help marketing and sales teams prioritize their outreach.
Why pick 6sense over Cognism: If your primary need is intent data and account-based orchestration rather than individual contact data, 6sense provides deeper buying signal intelligence. However, 6sense pricing typically starts at $35K+/year, making it more expensive than Cognism for teams that primarily need contact enrichment.
Cognism vs Alternatives: Pricing & Features Comparison (2026)
| Feature | Cognism | ZoomInfo | Apollo.io | Lusha |
|---|---|---|---|---|
| Starting Price | $16,500/yr | $15,000/yr | Free–$79/mo | Free–$29/mo |
| Pricing Model | Annual contract | Annual contract | Monthly/Annual | Monthly/Annual |
| Free Trial | No (demo only) | No (demo only) | Yes (free plan) | Yes (free plan) |
| Best For | EU/EMEA markets | US market | Startups/SMBs | Individual reps |
| Verified Mobiles | Yes (Diamond Data) | Limited | Limited | Yes |
| Intent Data | Bombora (add-on) | Built-in | Basic signals | No |
| GDPR Compliance | Built-in | Available | Available | Available |
| G2 Rating | 4.6/5 | 4.4/5 | 4.8/5 | 4.3/5 |
Cognism Pricing & Features
Cognism offers flexible pricing tailored to business needs, with two primary license tiers.
Also read: Factors.ai vs Clearbit (Breeze Intelligence): which is the better GTM platform?
- Grow Tier (formerly Platinum): Essential features, priced between $1,500 and $10,000 annually.
- Elevate Tier (formerly Diamond): Advanced AI capabilities, ranging from $2,550 to $25,000 per year.
- Included Benefits: Unrestricted data access, individual and page-level exports (up to 25 profiles), and seamless integrations at no extra cost.
- Additional Services: A flat platform access fee covers data maintenance, setup, onboarding, and 24/7 live chat support.
For exact pricing aligned with your business needs, contacting Cognism directly is recommended.
Cognism FAQs
What is Cognism and what is it used for?
Cognism is a B2B sales intelligence software that helps sales and marketing teams to build lead lists and supercharge their outbound efforts.
How does Cognism collect data?
Cognism has created its database for email generation apart from relying on third-party vendors for data collection.
How much does Cognism cost per user?
Cognism's per-user cost depends on the tier. The Grow plan (formerly Platinum) costs approximately $1,500/user/year, while the Elevate plan (formerly Diamond) costs around $2,500/user/year. Both tiers also require a base platform fee of $15,000–$25,000/year on top of per-seat costs.
Does Cognism offer a free trial?
No, Cognism does not offer a free trial. Instead, they provide a personalized demo where a sales rep walks you through the platform. You'll need to request a demo through their website to see the product in action before committing to an annual contract.
How does Cognism compare to ZoomInfo?
Cognism excels in European/EMEA data coverage and GDPR compliance, while ZoomInfo has a stronger US database and more advanced analytics features. Cognism's pricing typically starts lower than ZoomInfo's enterprise plans, but both require annual commitments and custom quotes.
What is the difference between Cognism Grow and Elevate plans?
The Grow plan (formerly Platinum) provides core contact and company data with 25M+ contacts. The Elevate plan (formerly Diamond) adds phone-verified mobile numbers (Diamond Data), Bombora intent data, and AI-powered features. Elevate costs roughly 60–70% more than Grow.
Is Cognism better for US or European markets?
Cognism is generally considered stronger for European and EMEA markets, where it offers industry-leading GDPR-compliant data coverage and phone-verified mobile numbers. For US-only prospecting, alternatives like ZoomInfo, Apollo, or Clearbit may offer better data quality and coverage.
What is the difference between Lusha and Cognism?
Lusha is a more affordable, self-serve option best suited for individuals and small teams, with plans starting under $500/year. Cognism is an enterprise-grade platform with deeper data enrichment, intent signals, and verified mobile numbers, but requires a minimum $15K+ annual investment. Lusha updates its database weekly, while Cognism focuses on phone verification accuracy.
Clearbit Pricing, Overview & Comparison In 2026
Learn about Clearbit pricing. Know what Clearbit costs and compare Clearbit with alternative visitor identification solutions.
Clearbit is a B2B marketing intelligence platform that offers a range of data-based products, mainly: visitor identification, account enrichment, and intent capturing. It’s built for marketing teams to leverage company and contact-level data for ad targeting, intent-based outreach, form optimization, lead scoring and other GTM use-cases.
But how much does Clearbit cost? And what are the different Clearbit pricing plans? This article highlights everything you need to know about Clearbit pricing and shares an overview of the product and its alternatives.
Clearbit Pricing
Clearbit offers three plans: a free tier with limited features, a business tier for custom paid plans, and a Powered by Clearbit tier targeted to other data-based products.
Clearbit’s paid plans are based on monthly web traffic and the volume of accounts and contacts enriched. Unfortunately, Clearbit no longer openly shares pricing details for this on its website. You’ll have to book a demo to find the exact commercials for your requirements.

That being said, it’s still possible to dig out approximate details on Clearbit pricing from customers and documentation. Our findings are summarized in the table below.
What Does Clearbit Cost?
| Product | Price | What is it? |
|---|---|---|
| Clearbit Reveal | $18,000+ annually for up to 50K monthly unique visitors | Clearbit Reveal is an IP-based visitor intelligence tool that identifies and tracks anonymous companies visiting a website — without the need for form submissions. |
| Clearbit Enrichment | $99/month for 275 API requests ($0.36/API Request/Mo) Or $199/month for 550 API requests ($0.36/API Request/Mo) | Clearbit Enrichment uses an enrichment API to refine Email IDs and Domains with firmographic and contact level attributes such as industry, number of employees, revenue range, titles, phone numbers, tech stack & more. |
| Database Enrichment - Salesforce/Marketo/HubSpot etc | $30,000 annually for up to 525K records (records include people & accounts) | Database enrichment is built upon the Clearbit Enrichment platform. It’s used to enrich existing accounts and leads inside CRMs/MAPs with relevant firmographic and contact level data. |
Note that the prices quoted above are subject to increases and discounts on a case-by-case basis. For instance, individual prices are likely to reduce when purchasing multiple products as part of a package. Accordingly, a company with around 50,000 monthly website visitors would be quoted at least $1500 per month ($18,000 annually) for the following features:
- Clearbit Reveal for account deanonymization (expect a match rate of 25-50%)
- Clearbit Enrichment for account and contact data (expect up to 70,000 records enriched)
- Real-time Slack/Email alerts (expect up to 5 alert configurations)
- Engagement analytics, Form optimization, Intent signals, etc.
What does Clearbit offer for free?
Apart from its paid products, Clearbit offers a few nifty tools and limited features for free. Here’s a breakdown of what this includes:
- Weekly Visitor Report: A weekly report of a handful of de-anonymized companies visiting your website. Limited to the first 25K IPs that visit your website every week.
- TAM Calculator: Calculate your total addressable market based on firmographic filters
- Batch Enrichment: Although payment is required for full functionality, access to Clearbit’s preliminary batch enrichment service is free. As the name suggests, it lets you enrich a limited batch of emails and domains with relevant contact data.
- Clearbit Connect: A free chrome extension that helps users find verified emails from target companies. Limited to 100 free credits a month.

Clearbit Overview
Curious to learn more about Clearbit? The following sections highlight Clearbit’s features, database, and integration capabilities.
Clearbit Features
The Clearbit platform is broken down into 3 core products: Reveal, Enrich, and Capture.
- Reveal: Reveal is Clearbit’s IP-based account intelligence solution. In short, users can identify a fraction of anonymous companies already visiting their website without the need for form submissions.
- Enrich: Enrichment refines target accounts and supports lead generation with over 100+ data points including industry, techstacks, employee count, revenue, and more. This enriched data can automatically be updated in CRMs and MAPs using Webhooks
- Capture: Capture identifies relevant buyer info (Emails, Phone numbers, etc) as well as intent signals from website engagement, G2 reviews, LinkedIn impressions and more.
Based on these three core products, Clearbit can be leveraged for a range of use-cases such as real-time alerts, dynamic web content, intent-based outreach, form optimization, and lead scoring.

Clearbit Database
Clearbit employs a combination of 250+ public and private data sources across social profiles, websites, legal filings, and more to build its marketing intelligence database. Here’s a summary of its database:
- 44M+ companies
- 389M+ contacts
- 4.5B IPs
- 55+ company attributes (techstack, revenue, headcount, etc)
- 40+ contact attributes (email ID, phone number, title, etc)
- Claimed 94% email accuracy
To put this in perspective, Clearbit alternatives like Leadfeeder (Now Dealfront) and Factors tap-into larger company databases with 66M+ and 50M+ companies respectively.
Clearbit Integrations
Clearbit offers native integrations with some of the most popular sales and marketing tools. Here’s a breakdown of out-of-the-box Clearbit integrations:
- CRMs: Salesforce, HubSpot
- MAPs: Pardot, Marketo
- CDP: Segment
- Automation: Zapier
- Others: Slack, G2
Clearbit also offers a wide range of partner integrations to automate third-party workflows. A few key Clearbit technology partners include:
- Intercom
- Gong
- Chili Piper
- Qualified
Clearbit Reviews


Clearbit Alternatives
There are several marketing intelligence platforms in the market — each with their own unique strengths and limitations. Here are 5 popular alternatives to Clearbit:
- Factors.ai - Alternative to Clearbit Reveal
- Leadfeeder [Now Dealfront]
- Albacross
- Lead Forensics
- Kick Fire

Read on: 5 Clearbit Alternatives.
Clearbit Comparison: Why Factors Over Clearbit?
Considering investing in Clearbit Reveal to identify anonymous website visitors? Here are three reasons why you may want to check out Factors instead:
1. Better data accuracy
Rigorous testing with over 20,000 domains reveals that Factors achieves a match rate of 64% vs Clearbit’s 50%. Overall, that’s 27% more accounts identified than Clearbit. Factors also taps into a larger database with nearly 50M company records and 5B+ IP addresses — all of which is kept up to date with proprietary ML technology.

2. Cost-effective plans
Assume you have 1000 monthly unique website visitors and Clearbit and Factors both manage to identify 350 accounts (35% match rate).
Since Clearbit charges on a per call basis, you’ll be billed for all 1000 API calls regardless of how many accounts Clearbit actually identifies. On the other hand, Factors charges per unique account identified. This means that Factors will only bill for the 350 accounts it accurately identifies out of 1000 unique visitors.
Accordingly, Factors is significantly more palatable for early to mid-stage teams, especially given the fact that Clearbit has effectively discontinued its discounted start-up program.
Factors pricing starts at $99/month for up to 1000 monthly visitors. Learn more about our pricing here: factors.ai/pricing
3. Advanced analytics
Most account intelligence and analytics tools track high-level website metrics — page views, session duration, etc — that are rarely sufficient. Factors offers holistic intent signal tracking across website engagement, G2, and LinkedIn. In addition to this, Factors auto-tracks granular metrics and touchpoints including button clicks, scroll depth, and journey timelines for actionable insights.
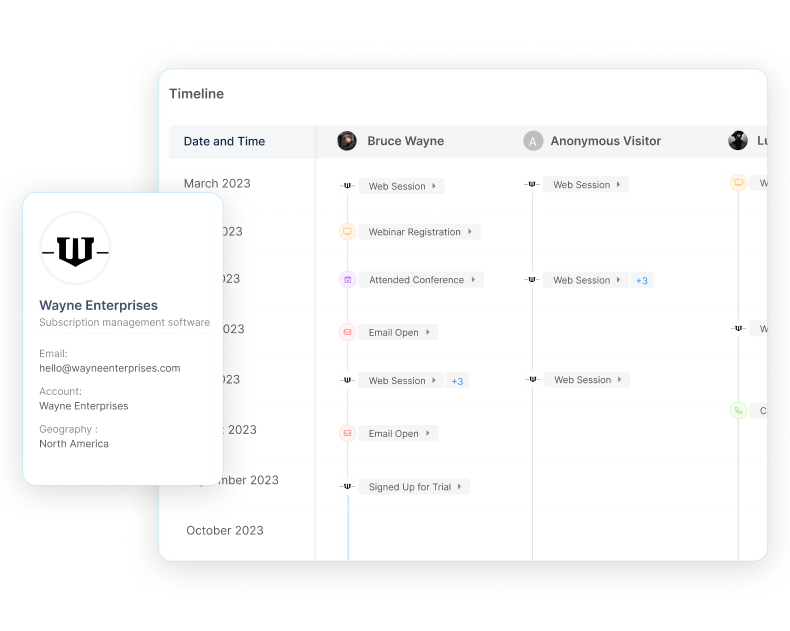
{{INLINE_BOFU}}
What Clearbit Will Eventually Cost You
There’s no doubt that Clearbit is a great product and a leader in the marketing intelligence space. That being said, its relatively steep price coupled with relatively inaccurate account identification capabilities raises concerns around its opportunity cost.

For example, in an experiment with 12,000 unique IPs, Clearbit and other vendors were able to accurately identify 30%, or 4781 accounts. Factors, on the other hand, managed to identify 52%, or 6124 accounts accurately. The impact of starting with a larger pool of accurately identified accounts trickles down through each stage of the customer journey. Ultimately, this resulted in Factors’ data helping close 9 more deals and almost $1M more in bottom line revenue.
Missing out on those 9 additional deals is the opportunity cost with tapping into relatively inaccurate visitor identification data with tools like Clearbit and Kickfire.
Curious to see Factors in action? Book a personalized demo with us at factors.ai!
{{CTA_BANNER}}
Clearbit FAQs
1. How much does Clearbit cost?
Clearbit’s paid plans are based on monthly website traffic and volume of accounts/contacts enriched. Plans can also be customized to include add-ons like forms, advertising, intent capture, and more. Refer to the above table for approximate pricing information.
2. What is Clearbit used for?
Clearbit is a B2B marketing intelligence platform that provides account and contact level data enrichment. It is used to enable a wide variety of marketing and use-cases such as retargeting, lead scoring, form optimization, intent-based outreach, and more.
3. Is Clearbit GDPR compliant?
It can be. Clearbit offers EU suppression settings to comply with EU’s General Data Protection Regulation (GDPR) privacy policy
4. Is Clearbit Connect free?
Yes. Connect is a free chrome extension for up to 100 credits (1 credit = 1 email) per month
5. How much does Clearbit prospector cost?
Prospector is a seemingly under the radar Clearbit product that works in tandem with Salesforce to find accounts and contacts in your TAM. Our research suggests that Clearbit prospector starts at $18,000 for an annual subscription.
7 Best Clearbit Alternatives For Website Visitor Identification In 2026
This article compares the top five Clearbit alternatives to help you pick the best account identification tool for your needs.
TL;DR
- Clearbit was acquired by HubSpot and rebranded as Breeze Intelligence, effectively killing its standalone version and locking non-HubSpot CRM users out while forcing others into expensive credit packages.
- Clearbit alternatives offer independent, lightweight script tracking that connects seamlessly with any CRM (Salesforce, Pipedrive, etc.) and provides higher IP-match rates.
- Pick your alternative based on regional data strength: Leadfeeder or Factors.ai for the European market, Albacross for programmatic personalization, or Factors.ai for unified marketing analytics.
- Factors.ai dominates for growth teams, leveraging a waterfall enrichment via 5 data-providers to drop enterprise-grade account deanonymization rates right into a budget-friendly mid-market tier.
Clearbit doesn't exist anymore. Not really. HubSpot bought it in December 2023, and by the time INBOUND 2024 rolled around, the product had a new name: Breeze Intelligence. Same underlying data, same enrichment engine, but a completely different business wrapped around it.
Clearbit is a well-established B2B marketing intelligence platform that helps identify anonymous website visitors at an account level and enrich this information with firmographics, intent data, and contacts.
There’s no doubt that Clearbit is great at what it does. But no tool is perfect.
Whether it be pricing, data quality, data coverage, customer support, user experience, or anything else — there might always be an alternative to Clearbit that better suits your particular requirements.
This article highlights 5 comprehensive Clearbit alternatives specifically for website visitors identification. That is, the ability to reveal and track anonymous companies visiting your website (including firmographics and intent) without the need for form submissions.
Given that the tools covered on this list are alternatives to Clearbit (and each other), they all share a handful of commonalities including the ability to:
- Identify anonymous companies visiting your website with IP-based technology
- Enrich company names with firmographics (industry, headcount, revenue-range, etc)
- Deliver real-time Slack/MS teams/Email alerts when high-intent visitors are live on the site
- Implement in a matter of minutes by installing and activating lightweight scripts to the website
If you used Clearbit Reveal to spot anonymous companies browsing your site, this matters. Breeze Intelligence lives inside HubSpot now. You need an active HubSpot subscription to touch it, and even then, visitor identification comes with less flexibility than the old standalone Reveal API had.
Here's what has changed:
- Acquired by HubSpot in December 2023, rebranded as Breeze Intelligence at INBOUND 2024.
- Standalone signups are gone. No HubSpot, no Breeze.
- The free tools got shut down entirely. Clearbit Connect, the Weekly Visitor Report, the TAM Calculator, and the free Slack integration all sunset April 30, 2025. The Logo API followed on December 1, 2025.
- Pricing now runs on HubSpot credits: roughly $45 to $50 a month for 100 credits, scaling into the thousands for real volume, stacked on top of whatever HubSpot tier you're already paying for.
- Reveal is still in there, but plenty of teams report it's narrower and harder to configure than the standalone version used to be.
None of that makes Breeze Intelligence a bad product. If you're already deep in HubSpot, the integration is smooth: enrichment happens on the record, forms shorten automatically, and you're not stitching together an API yourself. But if you're on Salesforce, Pipedrive, or nothing in particular, you're out of luck. That's true whether your priority was enrichment or the visitor identification use case this list is built around.
This piece was originally about five Clearbit alternatives for website visitor identification. So here are eight tools worth a look in 2026.
Every tool below can identify anonymous companies on your site through IP-based matching, enrich company names with firmographics, and fire real-time Slack or email alerts when a high-intent account shows up. Most install in minutes with a lightweight script tag. Where they actually differ is data quality, coverage, pricing, and what happens after a visitor gets identified.
Clearbit Alternatives For Website Visitor identification
1. Factors.ai
Factors.ai has moved well past a single visitor-identification tool. The core product still identifies anonymous accounts on your site. But now there are more features built around it: account intelligence, sales intelligence, attribution and analytics, and ad activation on LinkedIn and Google.
The identification method changed, too. Factors.ai no longer leans on one source. It runs a waterfall model blending four providers, then stitches the results together. By Factors' own reporting, which catches more than 75% of anonymous visitors at the account level, with the recent RB2B partnership, it can now offer person-level identification of up to 40%.
Scout is an AI agent layer trained only on your own account and pipeline data, answering questions like why the pipeline dropped last month, or building in minutes what used to take a BI team two weeks. It also ships pre-built agents for account scoring, churn risk, competitive displacement, and pre-call briefings, and runs inside Slack, HubSpot, Salesforce, or even Claude and ChatGPT through Factors' own MCP server.
G2 rating: 4.5/5 with mid-market leader badges for account-based analytics and orchestration.
For a team that just wants reveal-and-alert, the visitor identification product alone still covers that job. Teams that want scoring, ad activation, and AI reporting layered on top now get all of it from one vendor instead of stitching several together. One less procurement conversation, either way.
Factors.ai Pricing
The pricing starts at $199 per month for the Lite plan. Free trial available. Learn more about pricing here: factors.ai/pricing
2. Leadfeeder

Leadfeeder is a Helsinki-based B2B lead generation software that identifies and tracks website visitors, scores accounts based on behavior and firmographics, and provides contact information. Leadfeeder recently partnered with Echobot to form Dealfront; a Europe-centric go-to-market data platform.
Why Leadfeeder over other alternatives?
Here are a couple reasons why you may prefer Leadfeeder over other alternatives:
1. Europe-centric data
Especially since its collaboration to form Dealfton, Leadfeeder has doubled down on its focus as a visitor identification powerhouse for Europe. While Leadfeeder’s database comprises only about 8 million companies in the US, Asia, Australia, and other non-Europian geographies, it records a whopping 26 million companies within Europe.
So, if you’re looking to specifically target European companies visiting your website, look no further than Leadfeeder.

2. Contact-level data
No tool can identify exactly who’s visiting your website at a user level without form submissions. Still, like Clearbit Enrich, Leadfeeder can provide a few ideal leads from the companies visiting your website for further outreach.
Note that these contacts won’t necessarily be the same people who visit your website. Rather, it’s similar to using Zoominfo or Apollo to identify decision makers to reach out to from your target list of accounts.
Leadfeeder Pricing
Leadfeeder (not Dealfront) has starting plans starting at $220/month for 3 seats and 2500 credits which may be used across identifying visitors, enriching companies, and uploading contact/account data to CRM.
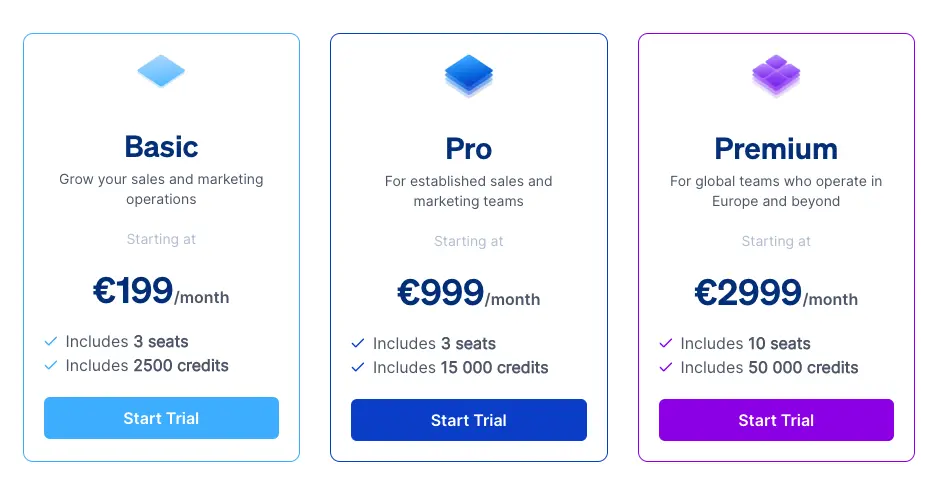
3. Albacross

Albacross is another well-established visitor identification and intent data platform. The Swedish company works with over 10,000+ companies to provide go-to-market intelligence. In addition to providing top draw website identification, Albacross also offers website personalization and display advertising features.
Why Albacross over other alternatives?
Here are a couple reasons why you may prefer Albacross over other Clearbit alternatives:
1. Website personalization
Albacross emplowers website website personalization at account level at scale by combining its visitor identification technology with optimizely-esque personalization technology. This means users can instantly change messaging based on different segments of visitors.
For example, messaging around bottom line pipeline generation or security compliance may be more compelling to larger companies with over 1000+ employees. Messaging around cost-saving and easy implementation might appeal better to smaller teams with <500 employees. With Albacross, you can experiment with different headlines for different visitors.
2. Account-based Targeted Display ads
Albacross partners with several publicists including The New York Times and Daily Mail to distribute account-level targeted display ads. These ads can be launched and monitored within Albacross’s native campaign management platform.
Albacross Pricing
Albacross pricing plans start at $87/month to identify up to 1,000 companies.
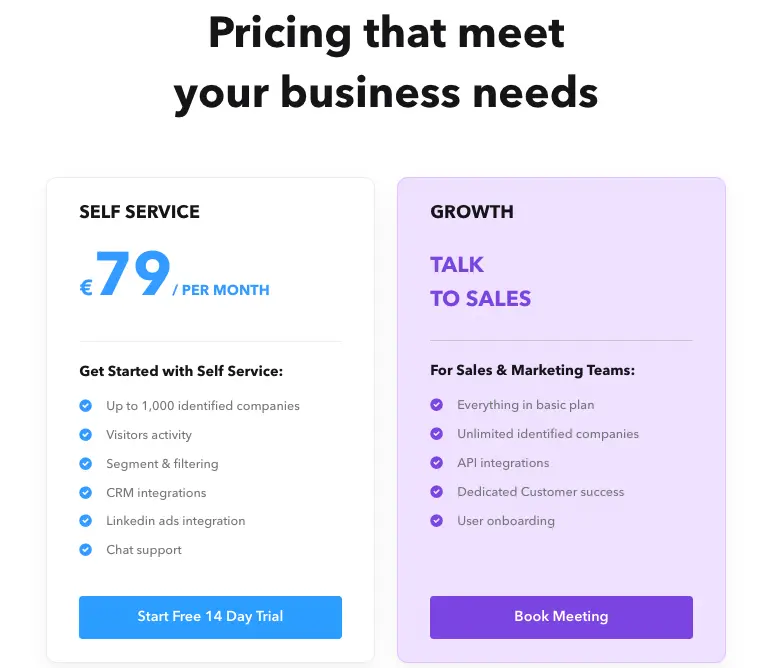
4. Lead Forensics
Lead Forensics has been around longer than most tools on this list, Clearbit included. It says it owns and maintains its own B2B IP database, and it tells you which company a visit came from, not which person made it.
Why Lead Forensics over other alternatives?
Beyond spotting which companies visit your site, Lead Forensics adds firmographic detail, decision-maker contact data, real-time alerts, lead scoring and a built-in lead manager. It connects to Salesforce, HubSpot, Microsoft Dynamics, Pipedrive and Zoho, which suits teams that miss Reveal but aren't on HubSpot.
5. Kickfire (Foundry Intent)

KickFire is a Foundry company that, surprise surprise, identifies website visitors as well as their firmographics and intent data. Given its association with Foundry, Kickfire taps into more than just website activity to discern account and contact-level intent. More on this in the next section.
Why KickFire over other alternatives?
KickFire is really unique in the way it captures intent. Unlike other tools on this list, including Clearbit, KickFire identifies contact-level intent by connecting the dots between website visitors, Foundry’s proprietary data across digital content, content syndication programs, AND the public web by tapping into conversational signals across socials, blogs etc for over 5 million companies.
They match these buyer signals with accounts identified on your website for further targeting and outreach.
6. RB2B
RB2B showed up specifically to catch teams losing Clearbit Reveal, and it's built for exactly one job: identifying individual US-based visitors by name, not just the company they work for.
No enrichment API. No page personalization. No ad platform bolted on. Just person-level reveal, with a free tier covering up to 100 reveals a month and paid plans starting at $99.
For a small marketing team that mainly wants to know which specific people from a target account showed up this week, RB2B is close to the fastest, cheapest way to get there.
Factors.ai has partnered with RB2B to offer person-level identification with up to 40% coverage. If you are looking to get all the benefits RB2B offers, along with features like predictive account scoring, AI agents, ad spend optimization, multi-touch attribution, and basically run multi-channel ABM, then you must consider Factors.ai.
7. Warmly
As of July 2026, Warmly has been acquired by Zoom.
Warmly picks up where most reveal tools stop. It identifies visitors, then layers in AI-driven outbound and sequencing, so the team isn't handing sales a spreadsheet of accounts every Monday morning.
That combination sits it in the middle of the market: more capable than a pure reveal tool like RB2B, lighter-weight than a full ABM platform like 6sense. If your bottleneck used to be turning Clearbit's alerts into actual outreach, Warmly is built around closing exactly that gap.
What are the best Clearbit alternatives for ad targeting
If your main use for Clearbit was building ICP audiences to run on Facebook, Google, or LinkedIn, most of the tools above aren't built for that job. A handful are.
Albacross is the most direct fit for pure account-based display. Its publisher partnerships let you run targeted ads to specific accounts without leaving the platform, and it's the closest thing on this list to what Clearbit's own advertising audiences used to do.
Demandbase is a full ABM/ABX platform where account-based advertising is a core product, not a bolt-on, paired with buying-committee identification so ads reach more than one person at the target account. Pricing runs enterprise-only, typically $40,000 to $120,000 a year.
6sense plays in a similar territory. Predictive scoring feeds directly into ad orchestration, so spend follows accounts actually showing intent instead of a static list.
And Factors.ai has moved into this space too, with two dedicated products, LinkedIn Adpilot and Google Adpilot, built to activate the same visitor and account data it uses for identification. It also offers what 6sense offers, predictive account scoring, and lets you run multi-channel ABM like Demanbase. So, if you are looking at a tool that can replace 6sense and Demandbase. Worth a look if you'd rather have targeting and identification under one roof than stitched together from two vendors.
What are the other Clearbit alternatives for account scoring
Clearbit never really did scoring on its own. It fed data into whatever scoring model you built elsewhere. If you want scoring built into the product, look at 6sense, MadKudu, or Factors.ai, each for a different reason.
6sense's scoring is predictive and stage-based. It won't hand you a single 0-100 number. It'll tell you an account looks like it's in the "decision" stage, based on intent signals, firmographic fit, and engagement history combined.
MadKudu, now under HG Insights, takes a different approach: explainable scoring. Every account gets a score plus a plain-language reason behind it, which matters if your sales team has ever ignored a score because nobody could explain where it came from.
Factors.ai scoring now runs through Scout, the company's AI agent layer. One agent tiers accounts into Tier 1, Tier 2, Tier 3, or Disqualified using firmographic fit and CRM signals. A second rate ICP alignment 1 to 5, weighing industry, headcount, revenue band, funding stage, and tech stack. Both write back into HubSpot or Salesforce automatically. It also offers Predictive account scoring. No manual scoring needed.
A Clearbit alternative with more than basic firmographics
If firmographics alone don't cut it and you want headcount trends, funding timelines, and hiring signals, you're really asking for a different category of tool: chronographic data, changes over time, not a snapshot.
Crustdata is built for exactly this. It tracks headcount growth as a percentage over a defined window, not just a static employee count, alongside funding stage and hiring velocity by department. You can search in natural language, too. Ask for Series B fintech companies in New York with 50 to 200 employees, and it returns matches instead of making you build a filter tree.
Coresignal plays a similar role as a raw data layer: workforce and hiring data at scale, refreshed frequently enough to support trend forecasting rather than a one-time export.
None of these replaces a visitor identification tool. They solve a different problem: telling you when something changes at an account you already care about, which static firmographics were never built to do.
And there you have it! 7 unique Clearbit alternatives for your consideration. Looking to learn more about Factors can help identify visitors, target the right leads, and convert more pipeline with less spend? Let’s chat!
.avif)
Clearbit + Factors.ai: Partnership Announcement
We’re delighted to announce our partnership with the leading B2B marketing intelligence platform, Clearbit!
We’re delighted to announce our partnership with leading B2B marketing intelligence platform, Clearbit!
With this partnership, users can leverage Clearbit’s extensive intelligence database in tandem with Factors’ proven analytics platform to identify, qualify and convert accounts like never before.
Not a Clearbit customer yet? No worries! You’ll still be able to enrich anonymous accounts with over 100+ firmographic & technographic attributes through Factors at no additional cost.
If you’re already using Clearbit, you can simply connect Factors to your Clearbit account using an API key.

We’re super excited for the immense value this partnership brings to our customers. Here are a few ways in which you can expect to make the most of Clearbit + Factors.
What’s in it for you?
Factors is a tried and tested analytics & attribution solution loved by 200+ high-growth SaaS teams. This partnership with Clearbit complements our core features — web analytics, multi-touch attribution, account scoring, path analysis, and more — with robust IP-based intelligence and account enrichment. Here’s what’s in it for you:
1. Identify, qualify & convert
It’s commonly accepted that only about 4% of website traffic actually reveals itself through form submissions or sign-ups. This means that the majority of accounts engaging with your brand, remain anonymous! Now, with IP-based intelligence & enrichment, you can accurately identify hidden accounts visiting your website, engaging with product reviews, or simply viewing ad campaigns. Once identified, you can configure custom scoring criteria to qualify high-intent accounts based on their firmographics, technographics, and engagement.
This is tremendously valuable to marketing and sales teams as it’s far more effective to prioritize in-market, brand-aware accounts as opposed to cold accounts from generic ICP lists.

With Factors x Clearbit, you can accurately identify up to 50% of anonymous accounts already engaging with your brand. These accounts may then be filtered down to ICP accounts based on firmographic and technographic properties such as industry, size, geo, techstack and more.
Now, it’s probably unlikely that all ICP accounts on your website are ready-to-buy. Some may be further along the funnel than others. Factors helps qualify sales-ready accounts based on their engagement across websites, product reviews, and ad impressions.
Let’s take 5 milestones to explain:
- visits pricing page
- visits G2 review
- reads blog for > 30s
- views LinkedIn ad
- opens sales email
On Factors, you may configure your scoring model to tag accounts that complete all 5 milestones as “hot”, accounts that complete none as “ice”, and accounts that complete 2-3 milestones as “warm”. Note that this scoring model is completely customizable within Factors based on the touchpoints you care about most.
Ultimately, this combination of intelligence and analytics empowers teams to go after the right accounts at the right time to drive markedly more conversions.
But don’t just take our word for it…
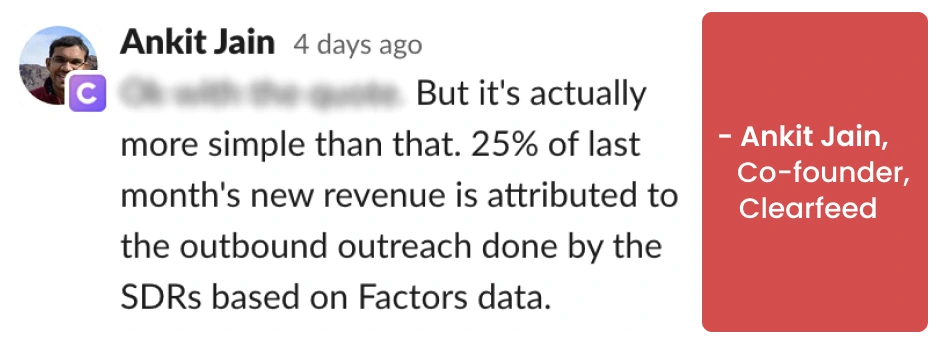
2. Build workflows, effortlessly
Go-to-market teams should spend less time worrying about operations and logistics and more time iterating on strategy to drive pipeline. To support this approach, Factors can push relevant account data to nearly any other platform (CRMs, MAPs, internal comms, etc) in the world using Webhooks (Zapier, Make, etc).
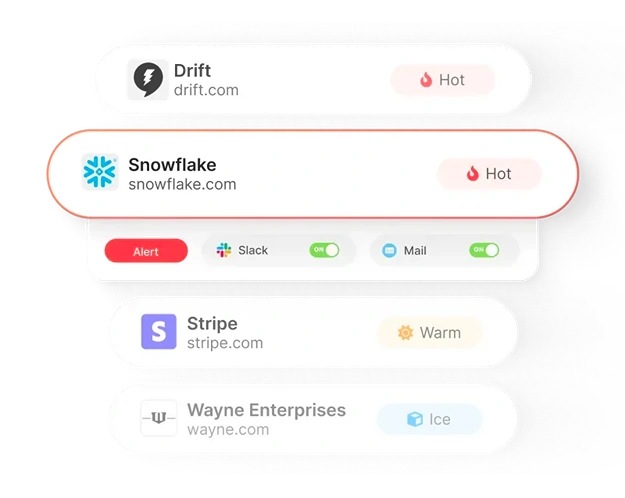
For example, let’s say your ICP looks something like this: US-based software companies with 500-1000 employees using HubSpot. With Factors, you can configure trigger alerts so when an account that matches this criteria visits a high-intent page (like factors.ai/pricing), Factors can automatically:
- Push this data to a retargeting list in your CRM
- Notify the relevant SDRs on Slack
- Initiate a sequence on your mail automation tool
This way,
- The marketing team can retarget warm accounts with relevant ad campaigns
- SDRs can reach out to relevant prospects while the iron’s still hot
- And known prospects can be placed in a nurture sequence
All without any manual intervention.
In short, Factors can automate a lot of the heavy lifting, so teams can focus on what they do best.
Learn more about how customers use Factors for intent-based outreach and retargeting.
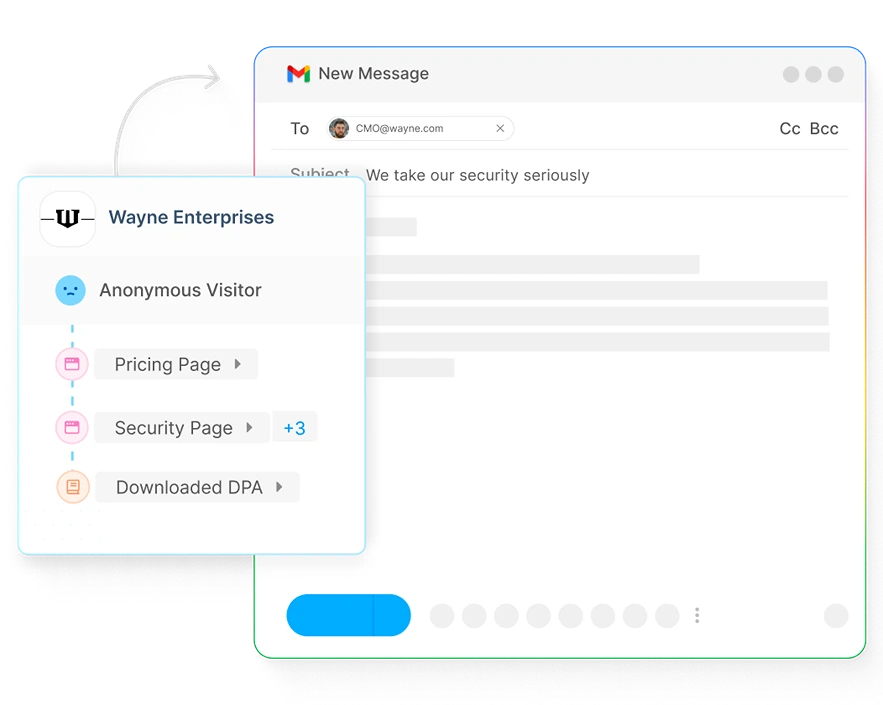
3. Make the most of marketing
If you’re like most B2B teams, you’re investing significantly in paid ads, content & seo, events & webinars, and other marketing efforts. For the most part, however, it's challenging to measure the impact of these efforts.
Let’s take content, for example. Without the right tools, marketing teams have little visibility into which anonymous accounts are reading blogs, how accounts are engaging with case-studies, and what the bottom-line impact of content assets are.

As a solution to this, Factors and Clearbit complement each other seamlessly to:
- Identify anonymous organic traffic to monitor traffic quality
- Measure engagement with metrics such as time spent & scroll-depth
- Attribute the impact of ungated content assets on conversions & pipeline
There are several other ways in which our customers are leveraging Clearbit’s intelligence with Factors’ analytics and attribution. If you’re curious to learn more, schedule a demo with our team here:
{{CTA_BANNER}}
Why Clearbit?
While it’s true that there are several B2B intelligence platforms and alternatives out there, Clearbit stands out as one of the best when it comes to accuracy, technology and value. As a leader in this space, Clearbit is home to one of the largest, most reliable IP databases & infrastructure in the market.
We believe that this partnership will further empower our customers to discover otherwise hidden buyer intent, build robust audience lists, analyze the impact of content and campaigns, and improve customer experience and conversions across the board.
The integration of Clearbit and Factors empowers B2B marketers with enriched insights and sharper targeting.
1. Core Integration: Combines Clearbit’s identity resolution with Factors’ behavioral analytics.
2. Marketing Impact: Identifies and enriches anonymous traffic for improved lead qualification.
3. Strategic Benefits: Uncovers hidden opportunities, boosts personalization, and increases conversion efficiency.
Together, Clearbit and Factors deliver a powerful solution for turning unknown visitors into high-quality leads.
{{INLINE_TOFU}}
FAQ
1. Do users need a separate Clearbit account to use this?
Nope! You do not need to be a Clearbit customer. Our partnership allows users to leverage Clearbit data as part of Factors for no additional charge. Learn more about how this works over a quick chat with our team!
2. How does pricing work?
Access to Clearbit data is part and parcel of our pricing plans at Factors. You won’t have to pay extra or purchase Clearbit separately. Instead, our pricing is based on the volume of accounts identified and monthly unique visitors. Learn more about our pricing here: factors.ai/pricing
3. Can Factors identify email IDs or phone numbers of anonymous website visitors?
No. Factors works with data partners to discover account-level information such as company name, industry, size, technographics, and much more. Factors does not identify or distribute anonymous user level information such as phone numbers or mail IDs.
4. Is Factors privacy compliant?
Absolutely! Factors is aligned with GDPR & PECR privacy standards. Factors is also SOC2 Type II certified. Rest assured, your data is yours alone — and is protected vigilantly with industry-standard security practices. Moreover, Factors only de-anonymizes IP data at an account-level. We do not identify or distribute anonymous user-level data (personal phone numbers, mail IDs, etc) whatsoever.
5. How does IP-based identification work?
Read more about how IP-based account identification works here.

Best Clay Alternatives for GTM Teams in 2026
Explore the best Clay alternatives for GTM teams in 2026. Compare Clay vs Apollo, ZoomInfo, and all-in-one GTM automation tools like Factors.

TL;DR
- Clay is great for data enrichment and workflow building, but it falls short when it comes to execution.
- Apollo and ZoomInfo solve specific problems, but don’t unify GTM workflows.
- As GTM motions mature, teams need systems that connect intent, action, and CRM updates.
- Factors.ai stands out by focusing on signal-driven activation, not just data prep.
- The right tool depends on your GTM maturity, not feature checklists.
If you’ve used Clay, you know it’s impressive. It pulls data from the deepest corners of the world, lets you shape it exactly how you want, and helps build flexible workflows with a high degree of control. For fast-moving teams, this gives a powerful edge.
But once Clay becomes part of day-to-day GTM operations, it loses steam. 🌫️
Yes, Clay keeps doing its part well, but it stops short of actual execution. If I had to tell you another thing that bothered me… it would be maintenance. I spent more time keeping existing workflows running than I expected. I also had to jump between tools just to act on the data, while outreach, ads, and intent signals were all on different platforms.
I could prepare everything perfectly, but I still had to decide (through human intervention) what to do next and where to do it. At this stage, it really started to feel like automation that isn’t automated?!
The pattern became obvious for me: Clay helped me get ready, but it didn’t help me execute.
That’s when I understood why GTM teams start looking for alternatives. While Clay does its job pretty well, it’s not enough anymore. Job requirements have changed. GTM motions have grown more complex, and the question has shifted from “How do I enrich this data?” to “How do I turn real signals into action without jumping between different tools?”
This guide is for that moment.
Criteria for Evaluating Clay Alternatives in 2026
Yes, Clay is good at what it does (There’s a reason so many growth teams adopted it early). But the way teams evaluate alternatives today is very different. These teams know firsthand that connecting multiple tools is like playing Jenga: Each workflow works fine on its own, but one small change (like a broken sync, or a missed signal) and the whole thing starts wobbling.
That’s why I have evaluated Clay alternatives that align with the changing requirements - a new system that helps you choose “better alternatives”:
- Unified data and activation:
The first thing I look for now is unified data and activation. Clean data matters, but it’s useless if it can’t trigger action. The system should know when something important happens and act on it without waiting for manual steps.
- CRM hygiene:
CRM hygiene is next. If the tool doesn’t keep records clean, updated, and consistent, everything downstream suffers. A modern GTM tech stack should prevent mess, not create more of it.
- Intent integration:
Teams need real buyer intent signals (not static worksheets) that show when an account is warming up along with the ICP.
- Workflow automation:
Workflow automation still matters, but the bar is higher. It’s moved on from just building clever logic to whether workflows actually reduce work across teams.
- AI-driven routing and prioritization:
This one helps in deciding what deserves attention right now.
- Cost efficiency:
Cost plays a bigger role, too. Tools that look affordable initially can become expensive once usage scales.
- Integration:
Integration is another non-negotiable. Any serious alternative needs to work cleanly with LinkedIn Ads, Google Ads, and the CRM. If those connections are weak, the system won’t hold.
And finally, I asked one simple question: Can this tool function as growth engineering infrastructure, or is it just a one-off solution?
These are the criteria on which I have chosen the seven Clay alternatives.
What Is Clay Better At (But Where It Falls Short)
But, before we get down to the alternatives, there are a few upsides and downsides to Clay (you start to feel these just as soon as you catch momentum) that need to be looked at.
Also read: Factors.ai vs Cognism: The GTM Platform Breakdown
Clay does a lot of things (genuinely) well:
- It is excellent at data enrichment.
- The spreadsheet-style interface feels familiar.
- The workflows are flexible.
- Its ability to layer logic on top of data is impressive (and powerful).
For research-heavy GTM work or one-off growth experiments, it’s hard to beat.
It’s also great for teams that like to build. If you enjoy tinkering, testing prompts, and building complex workflows, Clay gives you a big sandbox. That flexibility is the reason so many growth teams opt for it in the first place.
But, here’s where it falls short:
- Clay isn’t built to run end-to-end GTM automation:
There’s no native prioritization layer (to help you decide which accounts matter right now), and it doesn’t even give you a sense of timing (so you know when to outreach prioritized accounts). Everything still depends on someone checking workflows, exporting data, and deciding what to do next.
- Clay assumes technical expertise:
It assumes your team has the technical skills to manage workflows on their own. Your team has to own the logic, watch credit usage, debug broken workflows, and keep everything in sync, which works when volume is low or the team is small. Scaling with it becomes harder, when SDRs, marketers, RevOps, and growth teams all depend on the same system.
- Clay doesn’t unify GTM touchpoints:
Fragmentation is its biggest limitation. Clay can’t unify GTM touchpoints on its own. Ads data, contact details, website intent, all are managed separately. CRM updates happen after the fact. Yes, Clay is in the middle of all this, but it doesn’t close the loop.
So, while Clay remains a strong data enrichment and workflow tool, it struggles to become the system that runs GTM. If your team is hustling toward full GTM engineering, this gap is hard to ignore.
Now, let’s take a look at the alternatives.
{{INLINE_BOFU}}
Top Clay Alternatives for GTM Tools & Growth Teams
Note: Not every Clay alternative (listed here) is trying to replace the same thing. Some replace data enrichment, some sequencing, while a few others try to replace the system Clay often ends up sitting inside.
- Factors.ai (Best for unified GTM automation: intent, ads, signals)
If Clay is your prep kitchen (it helps you source ingredients, clean them, cut them, label them, and keep them ready), Factors.ai is your head chef + service flow (it watches what guests are doing, who just walked in, who is lingering, and who looks ready to order).
Factors.ai combines strong enrichment with workflow automation, helping GTM teams act on data instead of just collecting it.

Factors.ai starts with account-level intelligence and is designed to turn signals into action. This means it:
- Captures intent and engagement across touchpoints, including website activity and account behavior
- Syncs that context into the CRM, keeping records current without manual updates
- Routes signals to sales teams in real time, so outreach happens when timing is right
- Triggers action across channels, including outbound motions and LinkedIn and Google Ads through AdPilot.
- Maintains closed feedback loops between signals, actions, and CRM updates
By orchestrating website activity, account signals, ads, and CRM feedback loops in one system, it removes much of the manual data movement that slows GTM teams down. For teams doubling down on growth engineering motion, Factors.ai comes up to be one of the cleanest Clay alternatives.
Related Read: How Factors.ai connects intent, signals, and activation across the full GTM funnel
- Apollo.io (Best for scaling cold outreach quickly)
If Clay is your prep kitchen, Apollo is your serving line (where the focus is on getting plates out fast rather than perfecting ingredients. Speed matters more than nuance).
At first glance, Clay vs Apollo feels like a simple choice: Clay is technical and flexible, while Apollo is practical and ready to use. But that framing misses the MAIN question GTM teams should be asking.
Also read: 10 Best Madison Logic Alternatives And Competitors In 2026
| Instead of asking “Which tool is better?”, they should be asking “Where do we keep getting stuck?” |
Apollo has its own database and works well as an email automation tool when speed is your goal. If you need sales reps to send emails fast, Apollo removes friction. Lead lists, sequences, replies, and basic reporting all come together in one place, making it easy to get an SDR motion off the ground without much operational/administrative work.
With Apollo.io, you get:
- A large contact database that makes list-building fast
- Built-in email sequencing, so that reps can move from list to outreach quickly
- A straightforward outbound setup with minimal operational friction
- An easy path to spinning up SDR motions without heavy tooling or setup
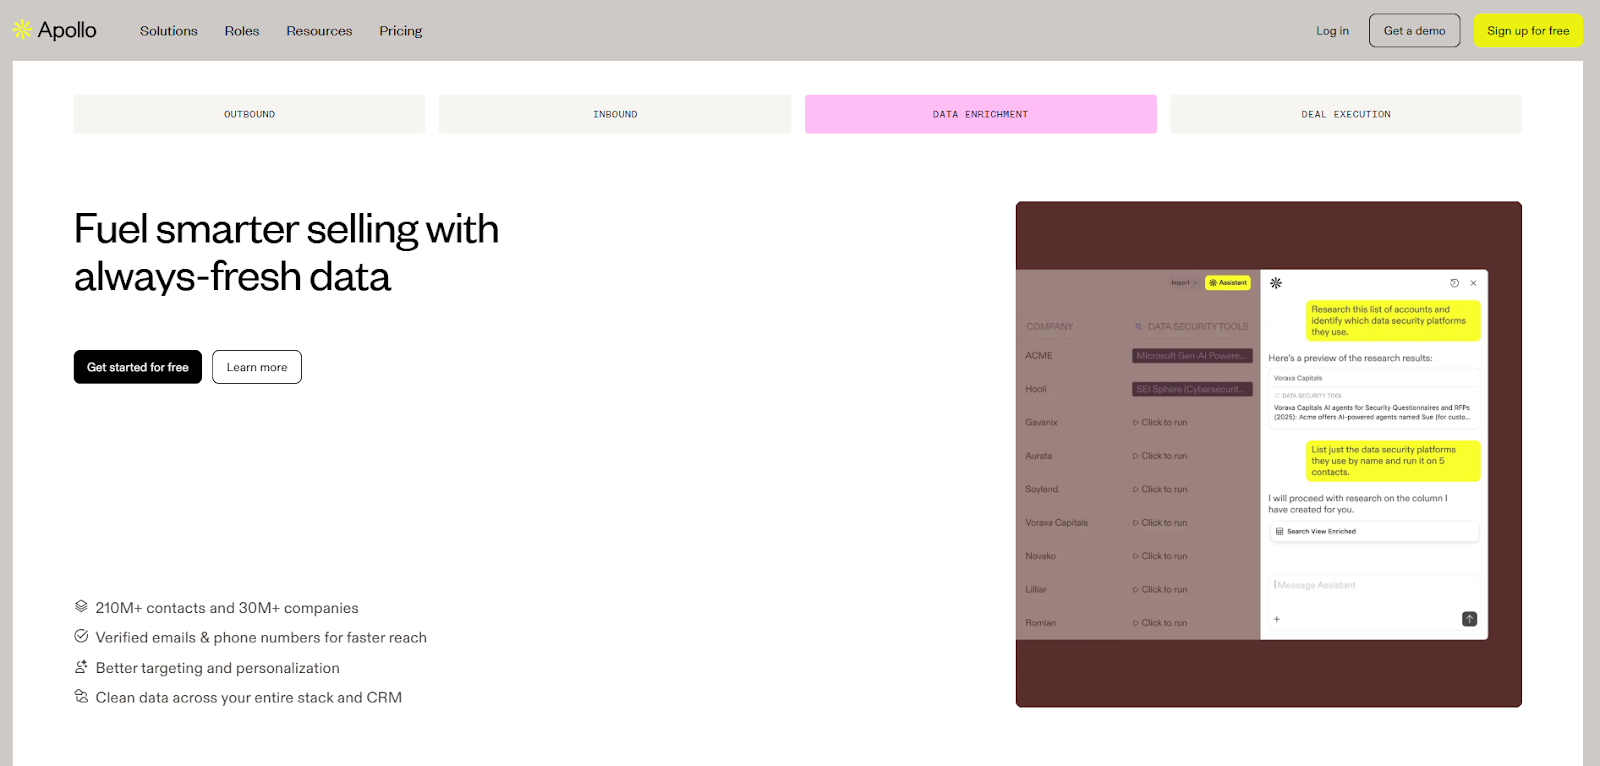
But Apollo’s data is broad, and context can feel thin. Meaning,
- You get the job titles without any real insights
- Personalization feels templated because the intent signals aren’t clear.
Where Clay fits:
Clay is on the opposite end of the spectrum. It focuses on data enrichment and workflow building, with strong automation features for shaping and transforming data.
| If your problem is “I need better inputs,” Clay usually delivers. |
Where Clay falls short:
Clay doesn’t activate outbound on its own. It doesn’t have native sequencing, prioritization, or timing sense. Apollo, meanwhile, activates outbound easily but doesn’t always give teams confidence in who they’re reaching or why now is the right moment.
So GTM teams end up connecting the two: Clay prepares the data and Apollo runs the sequences.
Simple, right? Not so much…Turns out connecting the two creates handoffs and sync issues.
Why teams move past the Clay vs Apollo debate
At this point, GTM teams move away from the ‘Clay vs Apollo’ debate, towards GTM workflows. Instead of alternating between better data and sequencing, they want a unified platform that not only silences this debate but also takes away the pain of connecting different tools.
Factors.ai helps you achieve this seamlessly. Using company-level intelligence and intent data, Factors.ai identifies an account that’s warming up and triggers activation automatically. That activation can be outbound, ads through AdPilot (Google and LinkedIn), CRM updates, or alerts to sales teams to amplify their outreach efforts.
| This is a critical differentiator: While Apollo and Clay each own a separate slice of the workflow, Factors.ai focuses on action. This makes Factors.ai an ideal choice for GTM teams that care less about running more sequences and more about running the right ones at the right time. |
- ZoomInfo (Best for enterprise data quality and depth)
If Clay is your prep kitchen (where the ingredients are sourced from different suppliers), ZoomInfo is your walk-in freezer stocked by a national supplier (where everything is labeled, organized, reliable, and comes from one large, dependable source).
The Clay vs ZoomInfo comparison usually comes up when GTM teams start questioning the data itself, instead of just how fast they can act on it.
ZoomInfo stands out when accuracy and coverage matter more than flexibility. Large teams rely on it for firmographics, org charts, and buyer intent, especially in US-focused sales motions. You get some of the most accurate contact data, especially for the US, and buyer intent is part of the package. For sales teams that want confidence in who they’re reaching and whether an account fits their target market, ZoomInfo feels reliable. It gives leadership confidence that the data foundation is solid.
The downside here is how that data is used. ZoomInfo isn’t built to adapt to custom GTM workflows or to support rapid experimentation. Activation usually happens elsewhere, and teams rely on downstream sales tools to turn data into action. Cost also becomes a factor as usage scales.
ZoomInfo is strong at answering who exists. It’s less strong at helping teams coordinate what happens next.
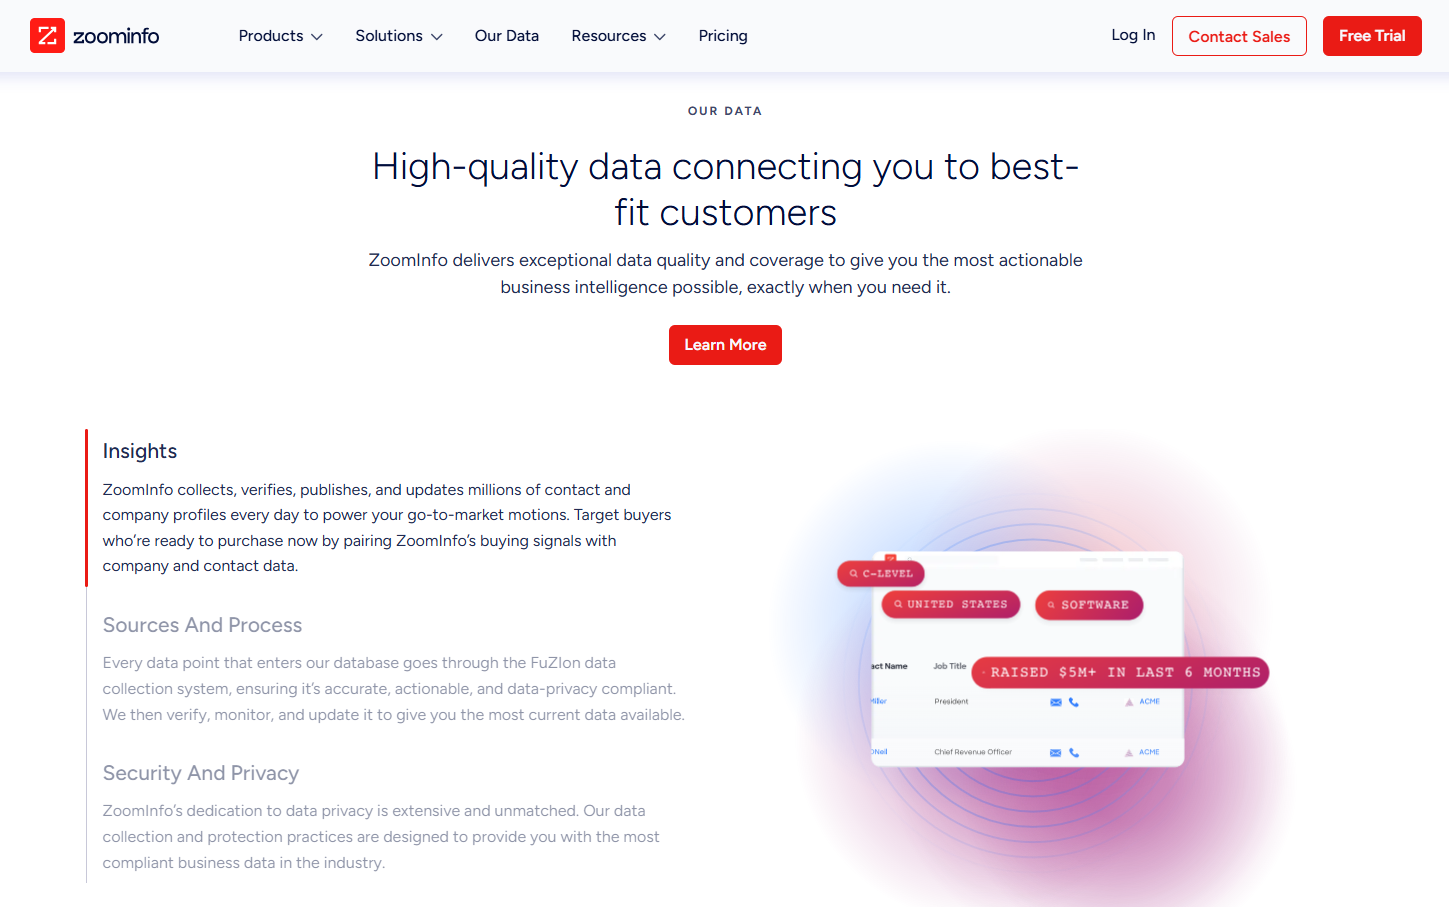
Where Clay fits:
Clay flips that. Clay is all about flexibility. You can combine data sources, apply logic, and shape data to fit your process. If the problem is adapting data to your GTM motion, Clay gives you room to do that.
Where both tools fall short is execution (again). Neither is built for multi-channel GTM engineering. Intent, outbound, ads, and CRM updates still live in different places, which means manual stitching and fragile feedback loops.
Some GTM teams take a step back from this data depth vs workflow flexibility row. Instead, they look for systems that handle both intent and activation together. Factors.ai does this seamlessly. By ingesting account-level intent and triggering activation from the same place, it reduces the need for constant handoffs and data silos.
Clay and ZoomInfo solve different problems well. But once GTM becomes system-level, data alone isn’t enough.
Related Read: Detailed comparison of Factors.ai vs ZoomInfo
Also read: Top 10 Warmly.AI Alternatives and Competitors In 2026-Compare Pros, Cons & Pricing
- 6sense / Terminus (Best for ABM and intent signal programs)
If Clay is your prep kitchen (focused on getting ingredients ready), 6sense and Terminus are your banquet planning system (they decide which tables matter, what meals are being served, and how the evening is structured) that assumes you have well-trained staff and set menu.
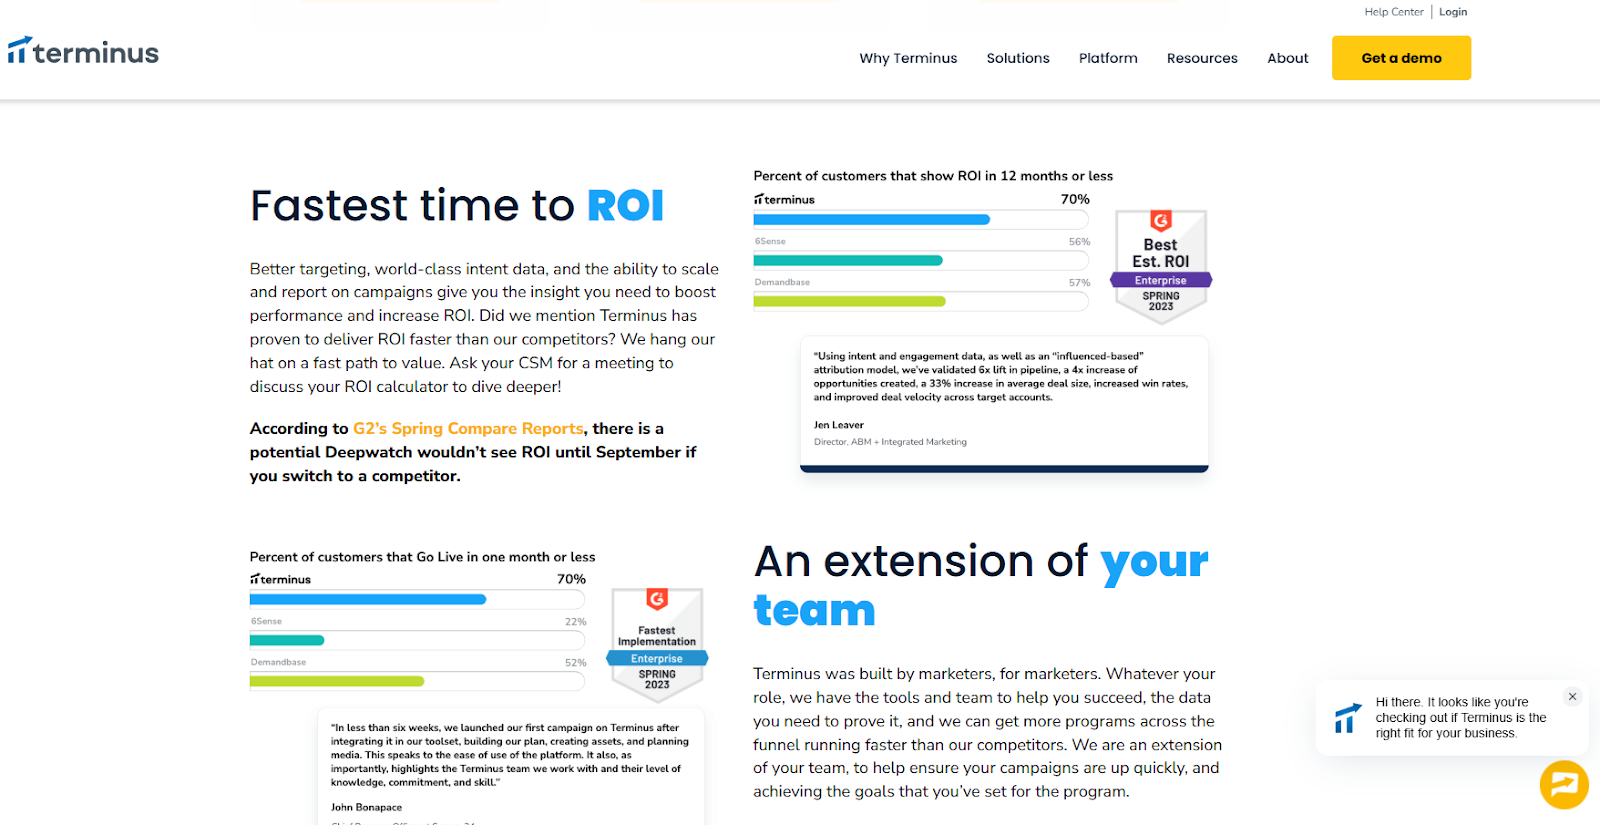
6sense and Terminus are purpose-built for account-based motions. They bring intent data, account insights, and advertising together under an ABM framework. For enterprise teams running planned, top-down GTM programs, this structure works well.
The challenge is weight. These platforms take time to implement, require alignment across teams, and come with higher cost. They’re opinionated systems, which makes them powerful in the right environment but less flexible for teams still evolving their GTM motion.
For mid-market or lean teams, they can feel like committing to a GTM model before it’s effectiveness is clear.
- n8n (For GTM teams with in-house engineering muscle)
If Clay is your prep kitchen, n8n is the plumbing and wiring behind the building. It’s powerful, flexible, and gives you full control, but it doesn’t know anything about GTM on its own.
n8n is an open-source workflow automation tool. It’s loved by technical teams because you can self-host it, customize it deeply, and build exactly what you want using APIs and custom logic. For GTM engineering teams with strong developer support, this is appealing. You can recreate enrichment flows, routing logic, and tool-to-tool syncs without being boxed into a predefined GTM model.
However, n8n doesn’t understand concepts like intent, accounts warming up, buying stages, or prioritization. You have to define all of that yourself. Every scoring rule, every trigger, every edge case becomes your responsibility. Maintenance scales with complexity.
n8n works best when:
- You already have engineers supporting GTM
- You want maximum control over workflows
- You’re comfortable building and maintaining logic long-term
It’s less ideal if you want GTM intelligence and execution out of the box. n8n moves data extremely well, but it doesn’t tell you what matters or when to act unless you explicitly build that intelligence yourself.
- Make (For teams that want flexibility without full engineering)
If Clay is your prep kitchen, Make is the conveyor system that moves ingredients between stations quickly and reliably.
Make (formerly Integromat) is a low-code automation platform designed for speed and accessibility. Compared to n8n, it’s easier to set up and friendlier for RevOps or growth teams that don’t have deep engineering support. You can connect tools, automate handoffs, and build fairly complex workflows without writing code.
That ease comes with limits. Like n8n, Make doesn’t understand GTM context. It doesn’t know what an intent spike is, how to score accounts, or when outreach should happen. You can automate actions, but you still have to decide the logic manually, often using static rules or scheduled checks.
As GTM motions grow more complex, Make workflows can become fragile. Small changes in tools or logic often require manual fixes, and prioritization still lives outside the system.
- Clearbit, People Data Labs, Datagma (Breadcrumb-style enrichment tools; Good for data, not for GTM workflows)
If Clay is your prep kitchen (where ingredients are turned into something usable), Breadcrumb tools such as Clearbit, People Data Labs, and Datagma are ingredient suppliers (they just deliver high-quality ingredients at your doorstep).
Tools like Clearbit, People Data Labs, and Datagma enrich records, fill gaps, and improve data quality inside your CRM or warehouse. But they stop at enrichment. There’s no orchestration, no activation, and no feedback loop. Teams still need other systems to route leads, trigger outreach, run ads, or prioritize accounts.
They work best as supporting pieces in a larger tech stack if your goal is end-to-end GTM automation.
Deep Dive: Why GTM Engineering Teams Prefer Unified Platforms
Growth engineering has pushed GTM teams to think in systems. The focus is no longer on what a single tool can do, but on how everything works together once real volume and multiple channels are involved.
That’s why Clay alternatives are increasingly evaluated at the system level.
- Unified view of account activity:
GTM teams want one common view for account activity and intent. When signals, engagement, and context live in different tools, decisions slow down and confidence drops.
Also read: ZoomInfo Alternatives: Top 6 ZoomInfo Competitors In 2026
- Multi-Channel Activation From One Signal:
They also want multi-channel activation built into the same workflow. A meaningful signal should trigger the right actions across outbound, ads, and the CRM without manual coordination.
- CRM hygiene automation:
This has become just as important. Rather than fixing routing or fields as problems appear, growth engineering teams want systems that keep records clean as signals change.
- Real-time signal-based routing:
Static rules miss timing. Teams want actions triggered by actual behavior over scheduled batches and fixed logic.
- Turning Intent Into Ads Automatically:
And finally, insights need to flow directly into ad activation. When intent stays locked in dashboards, value is lost. The strongest systems push those insights straight into LinkedIn and Google automatically.
Tools like Factors.ai work well because they operate as a unified system for account intelligence and activation, connecting signals, routing, CRM updates, and ads in one place. Factors.ai also works across LinkedIn, Google, CRM, Slack, and HubSpot workflows, aligning closely with how growth engineering teams run GTM today.
Related Read: Intent data platforms and how they work
Case Study Highlights: Common Patterns Across Factors Customers
Teams from Descope, HeyDigital, and AudienceView show a similar shift in how they run GTM once they move to a unified setup with Factors.ai.
Rather than centering GTM around spreadsheets and enrichment workflows, these teams focused on account-level signals and automation.
Here, using company intelligence as the trigger for action, website engagement and account activity acted as the starting point. This then flowed into downstream GTM actions without manual handoffs.
Next, they activated multiple channels from the same signal. The same account insight informed outbound outreach and ad activation, rather than maintaining separate lists for SDRs and marketing. This reduced lag and kept messaging aligned.
Also read: Factors.ai vs Clearbit (Breeze Intelligence): which is the better GTM platform?
CRM data hygiene also improved as a result. Instead of cleaning records after issues appeared, routing, ownership, and key fields updated automatically as engagement changed. Now, RevOps involvement shifted from constant maintenance to oversight.
By changing the operating model, i.e. keeping intent, activation, and CRM data updates in one place, these teams reduced operational drag and made GTM execution easier to scale and trust.
Related Read: Turning anonymous visitors into warm pipeline
Pricing Comparison: Clay Alternatives
| Tool | Pricing Model | What Drives Cost | Predictability as You Scale |
|---|---|---|---|
| Clay | Usage-based custom pricing, with a free plan | Enrichment volume, API calls, AI workflows | Medium. Costs are manageable early but harder to forecast at scale |
| Apollo.io | Starts at $49/m, with a free plan | Number of users and plan level | High. Easy to budget, even as usage grows |
| ZoomInfo | Annual contracts, provides a free plan | Data access, intent modules, seats | Medium to low. Predictable for enterprises, expensive for mid-market |
| Factors.ai | Usage-based, transparent, with a free plan | Signals, workflows, activation | High. Cost scales with GTM activity, not data rows |
Who should choose what:
- Lean teams experimenting with enrichment and workflows often start with Clay.
- Outbound-heavy teams that value speed and predictable pricing lean toward Apollo.
- Enterprise teams from established companies prioritizing data depth and coverage typically choose ZoomInfo.
- GTM engineering teams focused on intent, automation, and system-level execution tend to prefer other platforms like Factors.
Final Recommendation: Best Clay Alternative by GTM Maturity
| GTM Team Stage | Recommended Setup | Why It Fits |
|---|---|---|
| Lean teams | Clay + Apollo | Flexible enrichment and fast outbound are enough when volume is low and experimentation matters |
| Scaling mid-market teams | Clay alternative like Factors.ai | Unified intent, activation, and CRM workflows reduce operational drag as GTM scales |
| Enterprise teams | ZoomInfo or 6sense + unified GTM platform | Deep data and intent paired with system-level activation and routing |
| Technical GTM engineering teams | Factors + n8n | GTM intelligence and activation with room for custom integrations |
Simply put: There’s no universal winner. The right choice depends on where your team is currently and how much GTM engineering you actually want to run. Evaluate the path that fits your maturity, rather than opting for a tool that looks powerful on paper.
FAQs for Best Clay Alternatives
Q. Is Clay a data provider or an orchestrator?
Clay is primarily an orchestration and enrichment platform. It aggregates third-party data sources and layers workflows and AI research on top, rather than owning a single proprietary database.
Q. Which Clay alternative has the best US contact data?
For US contact coverage and depth, ZoomInfo is most often cited in community discussions. Apollo.io is commonly chosen for price and ease of use, with mixed views on accuracy.
Q. Can Apollo replace Clay?
Sometimes. Apollo bundles contact data and sequencing, which makes it a simpler and cheaper option for solo users or small teams. Power users often keep Clay for research and personalization, then export it into Apollo for sending. Teams that move toward signal-based GTM often replace both with systems like Factors.ai, where activation is driven by intent rather than static lists.
Q. What’s a good Clay alternative for signal-based prospecting?
LoneScale is frequently mentioned for real-time buyer signals at scale. Some teams layer it with platforms like Factors.ai to combine signal ingestion with downstream activation across outbound sales processes and CRM workflows.
Q. If I just need automation, not databases, what should I try?
Tools like Bardeen, Persana, or Cargo focus on automation rather than owning data. If you need automation tied to GTM signals and activation, Factors.ai fits better than general-purpose automation tools.

We don’t just write about demand gen. We deliver it.
Our AI Agents help you uncover high-intent accounts, run campaigns that actually convert, and keep your GTM motion in sync.
1000+ GTM teams have already scaled their pipeline with Factors.
*Includes built-in peace of mind. And fewer late-night funnel audits.

.svg)



.avif)

