

Good Reads
Fix pipeline pains. Solve GTM puzzles. Read strategic brain dump.
Written for marketers who want real solutions to a leaking pipeline (and their dark circles).
Want to read more from us?


I’m looking for…

Top LinkedIn Agencies in Middle East
Explore the leading LinkedIn marketing agencies in the Middle East. These agencies leverage advanced strategies and innovative approaches to help businesses maximize their LinkedIn ads to achieve their marketing goals.
.avif)
TL;DR
LinkedIn is an indispensable platform for business growth and professional networking in the Middle East, mainly due to its alignment with the region's economic diversification and digital transformation goals. Professionals and businesses in the UAE, Saudi Arabia, and other GCC countries use LinkedIn for industry insights, networking, and exploring business opportunities. LinkedIn marketing strategically uses the platform for brand awareness, lead generation, and targeted advertising. Top LinkedIn marketing agencies in the Middle East, such as Nexa Digital, Ubrik Media, Prism Digital, Red Berries, and Spider Works, offer specialized services to enhance LinkedIn presence and engagement. Partnering with these agencies ensures businesses leverage LinkedIn’s full potential, driving growth and maximizing ROI.
As the world's largest professional network, LinkedIn boasts over 830 million members globally, with a substantial and rapidly expanding user base in the Middle East. This platform transcends traditional social media by cultivating a professional environment where businesses and individuals can connect, network, and grow.
LinkedIn allows companies to maintain business continuity, engage with customers, and recruit talent despite physical constraints. It provides professionals opportunities to stay connected, share insights, and pursue career advancements in a rapidly changing job market.

Here’s why LinkedIn is a valued social media channel in the Middle East
LinkedIn's features, such as job postings, professional groups, and thought leadership content, align perfectly with the Middle East’s focus on economic diversification and innovation. As businesses and professionals navigate the new normal, LinkedIn stands out as a critical tool for sustaining and enhancing professional growth and business development in a digitally driven world.
In the Middle East, LinkedIn's importance is amplified due to the region's scale of economic activities and entrepreneurial spirit. The platform fosters knowledge sharing and collaboration across borders, contributing to a more integrated, growth-oriented, innovative business environment. Professionals in the UAE, Saudi Arabia, and other Gulf Cooperation Council (GCC) countries use LinkedIn to stay abreast of industry trends, engage in thought leadership, and explore new business opportunities. This regional vision is reflected in business partnerships, such as the India-GCC Business Partnership, which includes a database of over 1.8 billion people, offering both parties a vast customer base and market potential.
- Economic Growth:
The Middle East is experiencing rapid economic diversification and digital transformation, making LinkedIn an essential tool for business growth and professional networking.
- Professional Development:
Professionals in the UAE, Saudi Arabia, and other GCC countries use LinkedIn to stay ahead of industry trends, engage in thought leadership, and explore new business opportunities.
- Strategic Partnerships:
The platform facilitates knowledge sharing and collaboration across borders, fostering a more integrated and innovative business environment.
LinkedIn for Business
LinkedIn allows companies to establish a formidable online presence, share industry insights, and engage with a targeted audience. Through LinkedIn, businesses can showcase their products and services to an extensive professional network, boosting brand awareness and nurturing customer relationships. LinkedIn's advanced advertising solutions also allow precise targeting, ensuring marketing efforts reach the most relevant and high-value prospects.
{{INLINE_MOFU}}
But wait, what is LinkedIn Marketing?
LinkedIn marketing refers to the strategic use of LinkedIn as a platform for promoting a business, building brand awareness, and engaging with a professional audience. As a powerful tool in digital marketing, LinkedIn marketing includes a range of activities designed to exploit the platform's unique capabilities fully.
Key components of LinkedIn marketing through LinkedIn agencies in the Middle East:
- Profile Optimization
Ensuring personal and company profiles are professionally crafted to reflect brand identity and key messages. A well-optimized profile is a digital business card, making a solid first impression and enhancing credibility.
- Content Marketing
Creating and sharing valuable content, such as articles, posts, and videos, that engages the audience and establishes thought leadership. Consistent and relevant content keeps the audience engaged, drives traffic, and positions the business as an industry leader.
- Advertising Campaigns
Utilizing LinkedIn's targeted advertising options, including Sponsored Content, Sponsored InMail, and Text Ads, to reach specific professional demographics. These campaigns ensure that marketing efforts reach the right audience, maximizing ROI.
- Networking and Engagement
Building connections with industry professionals, participating in groups, and engaging with followers to foster relationships and drive business conversations. Active engagement helps build a robust professional network and opens doors for collaboration and business opportunities.
- Lead Generation
LinkedIn's tools and features, such as Lead Gen Forms and Sales Navigator, can be used to identify and connect with potential business leads. Effective lead generation strategies convert connections into customers, driving business growth.
LinkedIn’s popularity across different industries and sectors
- Technology & IT
Professionals and companies in IT and tech use LinkedIn to hire top talent, share innovations, and network with global tech communities.
Benefits: LinkedIn helps these companies stay at the forefront of industry developments and connect with key influencers.
- Oil & Gas
Given the Middle East's significant role in the oil and gas sector, LinkedIn is vital for networking opportunities, recruitment, and business development.
Benefits: Companies can engage with a global audience, highlight their contributions, and attract skilled professionals.
- Education
Universities and educational institutions use LinkedIn for outreach, alumni networking, and promoting educational programs.
Benefits: LinkedIn facilitates connections with prospective students, alumni, and academic peers, enhancing the institution's visibility and reputation.
- Healthcare and Pharmaceuticals
Professionals use LinkedIn to stay updated with industry advancements, share research, and connect with peers.
Benefits: The platform supports professional development and collaboration, driving innovation and sharing best practices.
- Finance and Banking
This sector utilizes LinkedIn for insights into market trends, recruitment, and establishing thought leadership through industry-related content.
Benefits: LinkedIn enables finance professionals to network with industry leaders, stay informed about financial news, and enhance their professional profiles.
Criteria for selecting top LinkedIn agencies in the Middle East
- Experience and Expertise
- Years in Operation
Agencies with a longer track record often possess extensive knowledge and experience in LinkedIn marketing. Longevity indicates stability and a proven ability to adapt to the dynamic media world.
- Specialization in LinkedIn Marketing
Agencies specializing in LinkedIn marketing demonstrate a deeper understanding of the platform's nuances. Unlike general digital marketing agencies, these specialists can provide more targeted and effective strategies.
- Client Portfolio
- Types and Sizes of Clients Served
A diverse client portfolio, including businesses of various sizes and industries, showcases the agency’s ability to cater to different needs. This versatility indicates adaptability and a broad skill set.
- Case Studies and Success Stories
Success stories and case studies provide evidence of an agency's impact and capabilities. They offer insights into the agency’s strategic approach, creativity, and effectiveness in achieving client goals.
- Range of Services
- Content Creation
Agencies proficient in content creation can develop engaging articles, posts, videos, and graphics tailored to the target audience. High-quality content is essential for building a strong LinkedIn presence and driving engagement.
- Ad Campaign Management
Effective LinkedIn ad campaigns require strategic planning, precise targeting, and continuous optimization. Agencies skilled in ad campaign management can maximize ROI and reach the desired audience.
- Profile Optimization
Ensuring client profiles are polished, professional, and optimized for visibility and engagement is crucial. Optimized profiles enhance credibility and attract more business opportunities.
- Lead Generation
Agencies with robust lead generation strategies and tools can help clients identify and nurture leads efficiently. Effective lead generation is critical for business growth and sales success.
- Reputation and Reviews
- Client Testimonials
Positive feedback from satisfied clients highlights an agency’s competence and reliability. Testimonials demonstrate the agency’s ability to deliver results and maintain strong client relationships.
- Industry Awards and Recognitions
Awards and recognitions validate an agency's capabilities and standing within the marketing community. These accolades are a testament to the agency’s excellence and industry leadership.
Why partner with a specialized LinkedIn marketing agency?
- Expertise and Experience: Specialized agencies deeply understand LinkedIn's unique features and can craft strategies specifically designed for professional networking and B2B marketing.
- Targeted Campaigns: These agencies can create highly targeted ad campaigns, ensuring your marketing efforts reach the most relevant and high-value prospects.
- Content Optimization: They provide expert content creation and profile optimization services that enhance your brand's visibility and credibility on LinkedIn.
- Lead Generation: With advanced tools and techniques, these agencies can effectively identify and nurture leads, driving business growth.
Here’s a list of the Top LinkedIn Agencies in the Middle East
- Location: Dubai, UAE
- Background: Established in 2005, Nexa is a leading digital marketing agency headquartered in Dubai, with additional offices in New York and Manchester. Nexa has gained recognition as a top provider of digital marketing solutions in the Middle East, particularly excelling in strategic LinkedIn marketing initiatives.
- Key Services
- LinkedIn Marketing
- Content Creation
- SEO and SEM
- Lead Generation
- Notable Clients and Case Studies: Nexa has collaborated with major brands such as Audi, Aramex, and Bosch. Their campaigns have significantly improved brand engagement and lead generation through targeted LinkedIn strategies.
- USPs:
- Nexa is a Diamond-tier HubSpot Partner, showcasing its proficiency in inbound marketing techniques, including LinkedIn marketing.
- It is also recognized as a Google Premier Partner, underscoring its expertise in Google Ads campaigns that complement LinkedIn's strategies.
- Nexa's LinkedIn marketing strategies are carefully data-driven, ensuring optimal results and ROI for clients.
- Industries: B2B Marketing, Education, Automotive, Healthcare, Hospitality, Real Estate, E-commerce.
- Location: Dubai, UAE
- Background: Ubrik Media was established to help businesses navigate the digital world effectively. The agency has grown to become a leader in digital marketing in Dubai, with a strong emphasis on results.
- Key Services:
- LinkedIn marketing and advertising
- Generation of traffic and leads
- Converting leads into customers
- Quantifying ROI for marketing activities
- Pacing with global market trends
- Increase in competition
- Retention of existing customers
- USP:
- Comprehensive digital marketing solutions with a focus on LinkedIn
- Proven track record of delivering high ROI by helping over 200+ brand
- Industries: Education & Direct Manufacturers.
- Location: Dubai, UAE
- Background: Founded over a decade ago, Prism Digital has consistently ranked among Dubai's top digital marketing agencies. They pride themselves on staying ahead of digital trends and delivering creative, result-driven campaigns.
- Key Services:
- LinkedIn marketing and advertising
- SEO and content marketing
- Social media marketing
- Web design and development
- Email marketing
- Notable Clients and Case Studies: Prism Digital has handled LinkedIn marketing for major UAE-based clients, significantly increasing their engagement and inquiries.
- USPs:
- Award-winning digital marketing strategies
- Expertise in leveraging LinkedIn for B2B marketing
- Strong focus on creative and innovative solutions
- Helps connect directly with industry decision-makers
- Industries: Hospitality, Real Estate, Pharmaceuticals.
- Location: Dubai, UAE
- Background: Red Berries was established in 2004 and has evolved from a creative agency into a full-service digital marketing firm. It is known for its customized and innovative digital marketing strategies.
- Key Services:
- LinkedIn marketing and advertising
- SEO and SEM
- Ad campaigns
- Content marketing
- Notable Clients and Case Studies: Red Berries has implemented successful LinkedIn campaigns for clients in multiple sectors, driving significant engagement and brand recognition improvements.
- USPs:
- Customized LinkedIn advertising plans
- Experts to help you
- Extensive experience in managing LinkedIn advertising campaigns
- Industries: Real Estate, Pharmaceuticals, Hospitality.
- Location: Dubai, UAE
- Background: SpiderWorks has established itself as a top LinkedIn marketing agency in Dubai. They focus on creating and managing effective LinkedIn marketing strategies that drive business growth.
- Key Services:
- LinkedIn marketing and advertising
- Content creation and management
- SEO strategy
- Analytics and optimization
- Notable Clients and Case Studies: SpiderWorks has successfully executed LinkedIn campaigns for clients in various sectors, leading to enhanced brand authority and increased lead generation.
- USPs:
- Precision targeting with LinkedIn marketing and outreach campaigns
- Expertise in crafting compelling LinkedIn content and building connections
- A data-driven approach to continuous improvement using consistent analysis and refinement
- Industries: Real Estate, Hospitality, Finance.
Selecting the right LinkedIn marketing agency can be crucial for businesses aiming to maximize their online presence and drive growth. That said, the necessity of partnering with a specialized LinkedIn marketing agency cannot be overstated. These agencies enable businesses and professionals to leverage LinkedIn's vast capabilities with precision and expertise. Companies can optimize outcomes and maximize return on investment (ROI) by prioritizing data-driven strategies.
Here’s how you can take a pick
Conducting thorough research into an agency's background, client portfolio, and industry recognition is the first step to making an informed decision. Here are some steps to consider:
- Review Client Portfolios: Look at the types and sizes of clients the agency has served. A diverse portfolio indicates the agency’s capability to cater to different needs.
- Examine Case Studies: Success stories and case studies provide insight into the agency’s strategies and their effectiveness in achieving client goals.
- Check Testimonials: Positive feedback from satisfied clients highlights the agency’s competence and reliability.
- Evaluate Industry Recognition: Awards and recognitions validate an agency's capabilities and standing within the marketing community.
Agencies specializing in LinkedIn marketing offer tailored services that maximize the platform's potential, from profile optimization to targeted advertising and lead generation.
LinkedIn remains a vital conduit for professional development and business innovation as the region participates in digital transformation.
While these agencies will help you up your LinkedIn game, we at Factors are launching LinkedIn AdPilot. This tool will help you unlock the power of data-driven insights to precisely target the correct accounts and rapidly enhance your LinkedIn ROI. Don’t just take our word for it; join our beta program today and discover how AdPilot can revolutionize your marketing strategy.
LinkedIn has become a key platform for B2B marketing in the Middle East, aligning with the region's economic diversification and digital transformation.
1. Leading Agencies: Nexa Digital, Ubrik Media, Prism Digital, Red Berries, and SpiderWorks.
2. Services Offered: Profile enhancement, content marketing, and targeted advertising.
3. Strategic Benefits: Effective engagement with professional audiences, enhanced brand visibility, and business growth in the competitive Middle Eastern market.
Partnering with specialized agencies can optimize LinkedIn strategies and drive success in this region.
Top 15 Intent Data Platforms to Boost Your B2B SaaS Growth in 2026
An intent data platform is software that tracks online buying signals. Discover the top 15 platforms to scale your 2026 GTM strategy. Explore the top 15 intent data platforms, their features, and pricing. Choose the one that fits your budget and business goals.

TL;DR
- Real-time buying signals help prioritize outreach and improve conversion rates.
- Intent data platforms are software tools that uncover anonymous digital buying signals, enabling your sales team to pitch accounts before they fill out a form.
- Modern outbound success relies on moving away from flat lists and using real-time behavioral insights to reduce wasted ad spend and shorten sales cycles.
- Tools like Factors.ai and Bombora dominate the market, balancing unique data sourcing with native CRM automation.
- Pick a platform that natively plugs into your existing marketing stack and offers transparent, GDPR-compliant data collection patterns.
Here are the top intent data platforms for B2B targeting compared
Most B2B sales teams struggle with cold leads, wasted ad spending, and missed opportunities. Relying on outdated or incomplete data means reaching out too late, or to the wrong people altogether. This results in low engagement, long sales cycles, and lost revenue.
This is where intent data platforms give you a competitive edge. By tracking real-time buying signals, they help you identify high-intent prospects, personalize outreach, and close deals faster. This guide will explore the top 15 intent data platforms to help you turn buyer intent into revenue.
What are Intent Data Platforms?
Intent data platforms help track and analyze digital actions that show buying interest. These platforms gather signals from online activities like website visits, content downloads, product reviews, forum chats, and research habits. They use this data to find companies wanting to buy specific products or services.
For instance, if a company's employees read many articles on cloud security or download papers on cybersecurity, intent data platforms note this as a buying signal. This helps sales teams focus on interested accounts and reach out with the right message at the right time.
Why is Intent Data Important for B2B Sales?
Intent data is vital for B2B sales because it identifies who is ready to buy. With 67% of the buyer's journey now happening online, traditional methods struggle to find potential customers.
Intent data aids sales teams in three main ways:
- Timing: Sales teams can reach out when prospects are actively researching solutions. This boosts response rates and speeds up sales cycles.
- Prioritization: Focusing on accounts with high intent means sales teams target those most likely to convert. Companies using intent data see conversion rates triple.
- Personalization: Knowing what content prospects engage with allows for more relevant conversations. If a prospect explores specific features, sales teams can discuss those directly.
{{INLINE_MOFU}}
How to Choose the Right Intent Data Platform?
1. Identify Your Business Goals
Before selecting an intent data platform, define what you want to achieve:
- Are you looking to improve lead generation?
- Do you want to align marketing and sales teams with data-driven insights?
- Are you focusing on account-based marketing (ABM) strategies?
- Do you need better predictive analytics to forecast sales opportunities?
Understanding your objectives helps you choose a platform that aligns with your business needs.
2. Evaluate Data Sources and Accuracy
Not all intent data is created equal. Some platforms focus on first-party intent data, such as website visits and email engagement, while others specialize in third-party data, including research activity across the web. Consider:
- Data variety: Does the platform provide both first-party and third-party intent signals?
- Data freshness: Is the intent data updated in real-time or batch-processed on a weekly or monthly basis?
- Data accuracy: Does the platform use AI and machine learning to eliminate false positives?
- Global reach: Does the platform provide global intent signals if you operate internationally?
A platform with high-quality, real-time intent data ensures your sales and marketing teams target the right prospects at the right time.
3. Assess Integration Capabilities
An intent data platform should seamlessly integrate with your existing sales and marketing tech stack. Check for compatibility with:
- CRM Systems
- Marketing Automation Platforms
- ABM Tools
- Business Intelligence Software
Seamless integration ensures intent data flows across your organization, making it actionable for sales and marketing teams.
4. Look for Advanced Analytics and Reporting
A strong intent data platform should offer deep insights rather than just raw data. Key features to look for:
- Custom intent scoring to prioritize high-intent accounts.
- Real-time dashboards to track engagement trends.
- Multi-touch attribution to measure marketing effectiveness.
- Predictive analytics to forecast future buying behavior.
These features allow teams to make data-driven decisions and optimize outreach efforts.
5. Ensure Privacy and Compliance
With increasing data privacy regulations, it’s essential to choose a platform that follows compliance guidelines, including:
- GDPR and CCPA compliance to protect customer data.
- Transparent data sourcing to avoid unethical data collection.
- Opt-in tracking mechanisms to ensure data is collected legally.
A compliant platform minimizes legal risks and builds trust with prospects.
6. Compare Pricing and ROI Potential
Intent data platforms use different pricing models based on:
Also read: Top 5 6sense Alternatives and Competitors For B2B GTM Teams in 2026
- Number of accounts monitored
- Data usage volume
- Features included (basic vs. advanced analytics)
Consider the total cost of ownership, including setup fees, training costs, and add-on charges. A platform should deliver measurable ROI, such as:
- Higher conversion rates
- Shorter sales cycles
- Better marketing efficiency
Request a trial or demo before committing to a platform to ensure it meets your needs.
7. Check Customer Support and Training Options
A reliable intent data platform should offer strong customer support and training to maximize usage. Look for:
- Dedicated account managers for onboarding and optimization.
- 24/7 support availability via chat, email, or phone.
- Training resources such as webinars, help centers, and community forums.
A well-supported platform ensures teams can quickly adopt and use intent data effectively.
Top 15 Intent Data Platforms In 2026
1. Factors.ai
Factors.ai is an AI ABM and marketing attribution platform for growth stage and enterprise SaaS companies. Factors.ai is the best intent data platform designed to help businesses identify high-intent companies, decode customer journeys, and measure marketing ROI.
By capturing intent signals from various sources, it provides a unified view of customer engagement, enabling marketing and sales teams to build better audiences and execute intent-based campaigns.

Product Features:
- Account Identification–Matches anonymous website visitors to their companies, identifying high-intent accounts.
- Account Intelligence– Enhances firmographic and technographic data for a complete customer view.
- Customer Journey Mapping–Visualizes touchpoints across the buyer journey to optimize engagement.
- Marketing Analytics–Tracks campaign performance, content engagement, and visitor behavior.
- Workflow Automation–Automates go-to-market tasks, improving efficiency for marketing and sales teams.
- LinkedIn AdPilot–Syncs audiences with LinkedIn for precise targeting and improved ad performance.
- Multi-Touch Attribution–Identifies which marketing efforts drive conversions with AI-powered insights.
Pricing:
It has a free plan. Custom pricing for all other tiers. Talk to us for quotes.
2. SMARTe
SMARTe closes the gap between spotting demand and acting on it with Bombora-powered intent data that pairs native buying signals with verified contact data, so teams can find in-market accounts and reach the decision-makers behind them in a single workflow. It surfaces accounts researching your category across 18,000+ Bombora topics, then layers on verified emails and direct dials for buyers across 200+ countries.
With real-time verification and 75%+ US mobile coverage, it lets your team act while an account is still in-market. It is SOC 2 Type II certified, GDPR-aligned, and CCPA-compliant, making it a safe choice for teams working with intent data at scale.
Product Features:
- Native Bombora Intent Data: Surfaces accounts researching your category across 18,000+ topics with weekly refresh, and scores each one Very Hot, Hot, or Warm.
- Five Precision Intent Filters: Narrow by topic, surge threshold, intent level, region, and trend direction to surface high-fit, in-market accounts.
- Verified Contact Data: Reach buyers with 289M+ verified B2B contacts, 75%+ US mobile and direct dial coverage, and 50%+ globally.
- Real-Time Verification: Validates emails and phone numbers at the point of use rather than from a stale batch, cutting bounce rates on outreach.
- CRM Export & Enrichment: Push in-market accounts straight to Salesforce, HubSpot, Outreach, or Salesloft, and enrich records at 90%+ match rates with job-change tracking.
- Firmographic & Technographic Filters: Segment 66M+ company profiles across 64K+ technographic products for precise account targeting.
- AI Agents & MCP: Auto-discover buying groups per account, and connect a SMARTe MCP that gives AI assistants live access to verified B2B data.
Pricing:
Free plan available with 10 credits per month. Pro starts at $25/month on pay-per-credit with no per-seat fees. Intent is included in Enterprise, which starts at $15,000/year. One company unlock costs 3 credits. Custom quote is also available.
3. Cognism
With its real-time intent data, verified contact information, and AI-driven insights, Cognism enables sales and marketing teams to target the right accounts at the right time. The platform ensures compliance with GDPR and other global regulations, making it a reliable choice for businesses looking to leverage intent data for prospecting and revenue growth.

Product Features:
- Intent-Driven Lead Generation – Identify companies showing buying intent with Bombora-powered intent data.
- Real-Time Contact Data – Access verified phone numbers and emails to reach decision-makers instantly.
- AI-Powered Data Enrichment – Automatically update and enrich CRM records with fresh, accurate intent data.
- Sales Companion Extension – Find and engage with high-intent leads while browsing LinkedIn or company websites.
- Advanced Filtering & Segmentation – Prioritize prospects based on intent signals, industry, and firmographics.
Pricing:
Public pricing is not available.
4. Bombora
Bombora is a pioneer in B2B intent data, providing businesses with insights into which companies are actively researching their products or services. The platform integrates with top CRM, marketing automation, and sales intelligence tools, ensuring businesses can act on intent data seamlessly.

Product Features:
- Company Surge Intent Data – Identifies businesses researching specific topics, signaling buying intent.
- Data Cooperative Model – Gathers intent signals from a proprietary network of B2B websites.
- Customizable Topic Tracking – Monitors intent signals across more than 12,000 industry-specific topics.
- Scoring & Prioritization – Ranks accounts based on the intensity of their intent signals.
- Multi-Channel Activation – Enables targeted outreach via email, advertising, and sales engagement tools.
Pricing:
Public pricing is not disclosed.
5. Lead Forensics
Lead Forensics is a B2B website visitor identification platform. It shows which companies visit your site and what they look at, which gives sales and marketing teams a source of first-party website intent, as opposed to third-party intent data from networks such as Bombora. Teams use it to spot and follow up with companies showing interest at the right time.
Product Features:
- Company-Level Visitor Identification – Reveals the companies visiting your website, with firmographic details, pages viewed and return visits. It identifies the company, not the individual visitor.
- Decision-Maker Contact Data – Provides contact details for relevant decision-makers at identified companies. These contacts are not necessarily the people who visited.
- Real-Time Alerts – Notifies sales teams when target companies visit the website.
- Lead Scoring and Lead Manager – Scores leads automatically and lets teams manage them inside the platform.
- Unlimited Users – User count doesn't affect price, so sales and marketing teams can share access.
Pricing:
Quote-based, calculated from your website traffic. One-week free trial.
Also read: Factors.ai vs Clearbit (Breeze Intelligence): which is the better GTM platform?
6. Demandbase
Demandbase is a leading intent data platform designed to help B2B businesses identify, engage, and convert high-intent buyers. It enables sales and marketing teams to focus on accounts that are actively researching solutions by leveraging AI-driven account intelligence and real-time behavioral data.

Product Features:
- Multi-Source Intent Data – Aggregates first-party, third-party, and partner intent data to create a complete view of account behavior.
- Engagement-Based Account Scoring – Prioritizes accounts based on their likelihood to convert, helping sales teams focus on the right prospects.
- Cross-Channel Engagement – Enables personalized marketing and ad campaigns based on intent signals.
- Sales Intelligence & Alerts – Notifies sales teams when high-intent accounts are showing active buying interest.
Pricing:
Pricing is not available publicly.
7. ZoomInfo
ZoomInfo is a comprehensive intent data platform that provides businesses with deep insights into buyer behavior. With a vast B2B database, AI-driven insights, and seamless integrations, ZoomInfo enables organizations to prioritize high-intent accounts and accelerate conversions.

Product Features:
- Real-Time Buyer Intent Signals – Identifies prospects showing active buying interest by tracking online searches, content engagement, and firmographic data.
- AI-Powered Lead Scoring – Prioritizes accounts based on predictive analytics and behavioral insights.
- Comprehensive B2B Data – Provides access to an extensive database of company and contact-level information to refine targeting.
- Multi-Source Intent Data – Aggregates data from first-party and third-party sources for a holistic view of prospect behavior.
Pricing:
Public pricing is not available.
8. Lead Onion
Lead Onion is an AI-powered buyer intent platform designed to help B2B organizations identify and engage with in-market buyers. By consolidating 20 unique sources of buyer intent data, it provides a comprehensive view of potential customers actively researching products or services. This enables sales and marketing teams to prioritize high-intent leads and engage them ahead of competitors.

Product Features:
- Multi-Source Intent Data Aggregation: Combines first, second, and third-party intent data within a single platform, offering a holistic view of buyer behavior.
- AI-Powered Buyer Identification: Utilizes artificial intelligence to scan billions of signals, identifying in-market buyers, predicting their purchasing stages, and recommending optimal engagement strategies.
- Real-Time Data Updates: Ensures access to the most current information, allowing businesses to respond promptly to emerging opportunities.
- Advanced Segmentation and Filtering: Enables precise targeting by segmenting prospects based on various criteria, such as industry, company size, and engagement level.
Pricing:
Public pricing is not published.
9. 6Sense
6sense is another best intent data platform that empowers B2B organizations to identify and engage potential buyers demonstrating active interest. It provides actionable insights into buyer behavior, enabling sales and marketing teams to prioritize high-intent accounts and tailor their outreach effectively.

Product Features:
- Predictive Analytics: Utilizes AI-driven models to predict buying stages, assisting teams in engaging prospects at optimal times.
- Audience Building: Facilitates the creation of dynamic audiences using over 80 filters for segmentation and activation across channels.
- Advertising Integration: Enables targeted advertising campaigns across display, video, retargeting, and social platforms.
- Conversational Email: Leverages AI to craft personalized emails that qualify and convert accounts at scale.
Pricing:
It has a free plan. Paid plan pricing is not publicly disclosed.
10. DemandScience
DemandScience is a prominent intent data platform that enables B2B marketers to identify and engage with potential buyers exhibiting active interest. By leveraging advanced data analytics and artificial intelligence, it delivers actionable insights, enabling sales and marketing teams to target high-intent accounts effectively.

Product Features:
- Comprehensive Intent Data: Aggregates and analyzes buyer intent signals to reveal businesses expressing interest in specific topics, allowing for timely and targeted engagement.
- PurePredict Intent Engine: Combines intent signals from multiple sources to assess a company's likelihood to purchase, enabling precise segmentation and prioritization.
- Self-Serve Platform: Offers an intuitive interface for building campaigns, uploading creative assets, and segmenting data, simplifying campaign management.
- Targeted Email Campaigns: Enables reaching the right audience with precision-targeted email strategies, enhancing engagement rates.
Pricing:
Public pricing is not available.
11. Leadfeeder
Leadfeeder is a B2B intent data platform that specializes in identifying companies visiting your website and transforming anonymous traffic into actionable leads. By analyzing visitor behavior, this software enables sales and marketing teams to engage with potential customers demonstrating interest in their products or services.

Product Features:
- Behavioral Analytics: Tracks visitor interactions on your site, helping prioritize leads based on engagement levels.
- Lead Scoring and Filtering: Automatically scores and filters visitors using over 50 behavioral and firmographic filters to identify high-potential leads.
- Contact Information Retrieval: Provides access to a database of decision-makers, allowing users to find and connect with the right contacts within identified companies.
- Customizable Reporting: Offers tailored reports and dashboards to monitor website traffic, lead generation efforts, and sales performance.
Pricing:
It has a free version. Paid plan starts at €99 per month.
12. IntentData.io
IntentData.io is a specialized intent data platform that provides detailed, contact-level intent data, enabling businesses to identify individuals who demonstrate an active interest in products or services. This software provides precise insights, enabling sales and marketing teams to focus on high-potential leads and refine their outreach strategies.

Product Features:
- Contact-Level Intent Data: Unlike many providers that offer account-level data, IntentData.io delivers insights at the individual contact level, facilitating more personalized and effective engagement.
- GDPR Compliance: Ensures that all data collection and processing adhere to data protection regulations, maintaining high standards of privacy and security.
- Transparent Data Sourcing: Provides clear insights into data origins and collection methodologies, fostering trust and reliability in the data provided.
Pricing:
Pricing is not publicly available.
13. Datarade
Datarade is a comprehensive data marketplace platform that connects businesses with a vast network of over 2,000 data providers, facilitating the discovery and acquisition of diverse datasets, including B2B intent data.

Product Features:
- Extensive Data Provider Network: Access to a wide array of data categories such as geospatial data, commerce data, financial data, company data, and more, allows businesses to find the precise data they need.
- B2B Intent Data Sourcing: Facilitates the procurement of B2B intent data, helping marketers engage with quality leads by understanding purchasing intent through tracking company behavior and signals.
- Data Provider Comparisons: Enables users to compare different data providers, ensuring they select the most suitable sources for their specific requirements.
- Data Request Posting: Allows businesses to post specific data requests, inviting data providers to offer tailored solutions, thereby streamlining the data acquisition process.
- Marketplace for Data Providers: Offers data providers a platform to list their datasets, reaching a global audience and tapping into qualified budgets for data.
Pricing:
Public pricing is not available.
14. Lusha
Lusha is a prominent B2B sales intelligence platform that assists sales, marketing, and recruitment teams in connecting with their ideal prospects by providing accurate contact information and company details.

Product Features:
- Prospecting: Create tailored prospecting lists using advanced filters such as job title, industry, company size, and more.
- Buyer Intelligence: Target potential buyers based on intent data, identifying companies actively searching for solutions like yours.
- API Integration: Enrich data in various databases, systems, or applications seamlessly.
- Browser Extension: Access contact information directly from LinkedIn and other web pages using Lusha's Chrome extension.
- Engagement Tools: Connect with prospects directly from Lusha, utilizing AI-powered recommendations and automated outreach features.
Pricing:
It has a free plan. Paid plan starts at $14.95 per month.
15. Foundry ABM
Foundry ABM is a comprehensive B2B intent data platform that enables marketing and sales teams to effectively identify and engage with in-market buyers. By capturing and analyzing intent signals from various sources, Foundry provides actionable insights to drive revenue growth.

Product Features:
- Contact-Level Intent Data: Provides detailed insights at the individual contact level, enabling personalized engagement strategies.
- ABM Software Integration: Combines intent data with account-based marketing tools, facilitating targeted campaigns and improved conversion rates.
- Sales Acceleration Tools: Equips sales teams with the necessary data and assets within their existing CRM systems to expedite conversions.
Pricing:
Pricing is not publicly available.
16. G2
G2 is a leading B2B software review and intent data platform that helps businesses identify in-market buyers by leveraging authentic user-generated reviews and real-time intent signals. By analyzing buyer behavior across its platform, G2 provides actionable insights to sales and marketing teams, helping them engage prospects more effectively.

Product Features:
- G2 Buyer Intent Data: Tracks when businesses research software categories and vendors, providing insights into in-market buyers.
- Review-Based Intent Signals: Identifies prospects evaluating competitors or software in the same category.
- G2 Stack Integration: Offers visibility into the tech stack of potential customers, helping businesses tailor their outreach.
- Competitive Benchmarking: Provides insights into competitor positioning and customer perception.
- Audience Targeting for Ads: Enables businesses to run ad campaigns targeting specific G2 visitors with intent signals.
Pricing:
Public pricing is not available.
The Best Intent Data Platforms to Accelerate B2B Growth
Finding the right buyers at the right time is one of the biggest challenges in B2B sales. Modern B2B sales hinge on timing, relevance, precision, and intent data platforms offer all three. Instead of relying on static lead lists or generic campaigns, sales and marketing teams can now act on real-time behavioral signals from high-intent prospects. These platforms monitor online research behavior across websites, content hubs, and search activity to surface buying interest early.
Without clear intent signals, sales teams waste time on unqualified leads, and marketing efforts miss the mark. Intent data platforms solve this by identifying companies actively researching solutions like yours, allowing for precise and timely engagement.
This curated list of the top 15 intent data platforms covers both market leaders and agile newcomers. You’ll find options offering everything from advanced account identification and multi-touch attribution to CRM integrations and AI-powered lead scoring. Whether you're optimizing an ABM strategy or refining outreach cadences, these tools help shorten sales cycles and elevate targeting accuracy.
Key considerations such as pricing models, compliance standards, integration depth, and signal accuracy are broken down to support decision-making. With the right platform, your team can confidently engage buyers before the competition does—and with far more relevance.
FAQs on top intent data platforms
Q. Which is the best intent data provider for identifying in-market B2B buyers?
An in-market B2B buyer identification platform is an account intelligence tool that maps anonymous digital footprints, such as web traffic, ad views, and review site activity, back to corporate profiles to identify live buyers.
If you want the honest truth, legacy tools are great at telling you which company is active, but they leave you guessing who is doing the digging. Factors.ai completely changes the game here by identifying up to 75% of your anonymous web traffic and mapping out exact user timelines (yes, down to the specific pricing pages they visited). It gives your sales reps the exact context they need to reach out before a competitor even realizes the account is looking.
Q. Which intent data platforms offer the strongest, deepest CRM and ad platform integrations?
Hands down, Factors.ai wins this on engineering depth. While major platforms like ZoomInfo and 6sense connect well with enterprise setups like Salesforce and Marketo, their integrations are famously rigid and typically require a dedicated RevOps engineer to maintain without breaking.
Factors.ai features native, out-of-the-box bidirectional integrations with HubSpot, Salesforce, Google Ads, LinkedIn Ads, Meta, and Bing Ads, alongside automated webhook mapping via Make and Zapier.
Q: When it comes down to execution, which platforms deliver the most accurate intent targeting?
Match rate and accuracy both depend on how a vendor builds its data. Some tools maintain their own IP database, and others layer several data providers. Factors.ai uses a waterfall enrichment model across 5 data providers to identify up to 75% of company visits, depending on your traffic mix. Whichever tool you evaluate, ask for match-rate and accuracy figures on your own traffic during a trial rather than relying on vendor claims.
Q: Which software providers offer true predictive analytics based on intent signals?
Factors.ai brings total transparency to predictive scoring by combining behavioral intensity with custom Milestones. The platform's built-in AI Agents continuously scan your funnel patterns to predict which deals are moving fast and which are going cold. The moment an account crosses an active-intent threshold, the system triggers a high-priority Slack or Teams alert directly to the account owner, complete with an AI-generated brief that maps out missing stakeholders in the buying group. It’s predictive analytics built for direct sales action, not just static dashboard reporting.
Q. What platforms use search intent signals for ad targeting?
An intent-based ad targeting platform is a B2B media orchestration tool that tracks search patterns and topic surges across the web to automatically trigger targeted marketing campaigns.
While most platforms just push static lists to ad channels once a week, Factors.ai runs circles around them with its LinkedIn AdPilot framework. It acts as an automated bridge, taking active search and on-site intent signals to dynamically update your audiences without manual intervention. Plus, the Smart Reach feature solves the annoying platform paradox where 80% of your budget gets hogged by the top 10% largest corporate accounts on your list.
Q. Is third-party intent data actually accurate, or is it mostly just noise?
Third-party data on its own can be incredibly noisy. A company "surging" on a keyword might just be an intern doing research or a competitor snooping around. The secret is using it as a tiebreaker layered over your first-party web traffic, when an account surges on Bombora AND hits your pricing page, that is your cue to strike.
Q: Can Factors.ai identify the exact person visiting my website, or just the company name?
By default, Factors.ai identifies the company behind a visit, maps its chronological journey, and uses AI to suggest the likely buying group so your reps know which roles to multi-thread into. For US traffic, an optional RB2B integration can also surface an individual visitor's name, title and work email. Person-level identification isn't available for visitors outside the US.
Q: What is the real setup friction like for setting up a tool like Factors.ai?
Unlike the legacy platforms (looking at you, 6sense and Demandbase) that take months of agonizing configuration and a dedicated operations hire, Factors.ai goes live in under two weeks. They provide a high-touch, white-glove onboarding team and spin up a shared Slack channel with you so you aren't left stranded trying to map your ICP yourself.
Q: We are on a tight budget. Is a free intent tier even worth implementing?
Absolutely, stop leaving free pipeline on the table! Factors.ai offers a completely free plan that de-anonymizes up to 200 companies a month and pipes alerts straight into Slack. It is the perfect, zero-risk sandbox to prove to your leadership team that web visitor identification works before you commit to a larger contract.
Q: How do we prevent our sales reps from burning warm intent leads with generic outreach?
The biggest mistake teams make is sending a creepy "Hey, I saw you looking at our website" email. You need to use intent data as contextual timing cover. If Factors.ai alerts your rep that an account is researching a specific feature, the rep should reach out, offering a case study or checklist addressing that exact problem without mentioning the tracking script.
Top Inbound Marketing Software for Business Growth
Discover the top inbound marketing software like HubSpot, Marketo, Salesforce, and more. Learn how these tools help businesses and how Factors.ai enhances inbound strategies.
TL;DR
- Inbound marketing software helps businesses attract, engage, and convert leads by streamlining content creation, email marketing, social media management, lead nurturing, and analytics.
- Popular platforms like HubSpot, Marketo, Salesforce, MailChimp, and Google Analytics offer various tools for CRM integration, marketing automation, personalized content, and detailed performance tracking.
- Each platform caters to different aspects of the inbound marketing funnel, allowing businesses to efficiently manage and measure their campaigns.
- Factors plays a key role in enhancing inbound marketing by providing in-depth analytics for funnel tracking, helping businesses optimize content, and driving conversions through a better understanding of customer behavior.
- This allows marketers to align efforts more closely with business objectives, ultimately improving ROI.
Unlike the old-school tactics that shove products in people's faces, inbound marketing is all about creating content that's so valuable and engaging that your audience can't help but be drawn to you. It’s like having a party where everyone’s invited because they’re genuinely excited about what’s happening!
But to throw this epic inbound marketing party, you need the right tools to manage the guest list, keep track of the fun, and ensure smooth operation.
This blog will explore the top inbound marketing software that can make your marketing efforts go from good to great.
What is Inbound Marketing Software?

Inbound marketing software refers to tools that help businesses attract potential customers, engage them with valuable content, and nurture relationships to convert them into paying customers. The key components of inbound marketing software include features such as:
- Content Management (for blogs, social media, landing pages)
- Lead Generation (forms, calls-to-action, pop-ups)
- Customer Relationship Management (CRM) (tracking interactions, sales pipeline)
- Marketing Automation (email campaigns, workflows)
- Analytics & Reporting (measuring campaign performance, ROI)
Types of Inbound Marketing Software
A. Marketing Automation Platforms
Marketing automation platforms allow businesses to streamline repetitive tasks, such as email follow-ups, lead nurturing, and segmentation, while delivering personalized content to leads at the right time. Some of the leading platforms are:
1. Marketo by Adobe

- Marketing Automation: Marketo Engage offers end-to-end marketing automation solutions that enable personalized engagement across multiple channels, including email, social, and mobile.
- Lead Management: This includes lead nurturing, lead scoring, and real-time personalization to help businesses effectively target and convert their leads.
- Account-Based Marketing (ABM): Marketo supports ABM strategies, allowing teams to target specific accounts with personalized content and experiences.
- Analytics & Reporting: Comprehensive reporting and analytics tools to measure ROI and track campaign effectiveness.
- Integration: Seamless integration with other Adobe products like Adobe Experience Cloud for cohesive marketing strategies.
2. HubSpot CMS

- Content Management: HubSpot’s CMS Hub allows users to create and optimize web content with SEO recommendations, drag-and-drop editing, and adaptive testing.
- Personalization: Offers personalized content experiences based on visitor data and behavior, improving user engagement.
- Integrated CRM: Integrates natively with HubSpot CRM to provide data-driven insights and a seamless customer experience.
- Security & Performance: Built-in SSL, global CDN, and website protection for optimal performance.
- Flexibility: No coding knowledge required, with flexible templates for marketers and developers alike.
3. Brevo
· Marketing Automation: Brevo provides robust automation tools for email, SMS, and chat campaigns, enabling businesses to streamline communication strategies.
· Contact Management: Centralized contact management with advanced segmentation to deliver highly targeted messages.
· Transactional Messaging: Seamlessly integrates transactional email and SMS into marketing workflows for a unified customer experience.
· Personalization: Offers dynamic content and personalized messaging based on user behavior and preferences.
· Analytics: Comprehensive analytics for tracking campaign performance, open rates, and customer engagement in real-time.
B. CRM Platforms
CRM systems are essential for tracking interactions with leads and customers, providing businesses with a detailed view of their sales pipeline. Here are some top CRM platforms:
1. Salesforce CRM

- Sales Cloud: Salesforce’s CRM offers lead and opportunity management, task automation, and pipeline tracking.
- Customer 360: Provides a unified view of customer interactions across sales, service, and marketing.
- AI Integration: Built-in AI (Einstein) offers predictive insights to improve sales performance.
- Mobile App: Full-featured mobile CRM app for managing sales on the go.
- Extensive Integrations: Supports integration with thousands of apps, including marketing automation tools.
2. Insightly
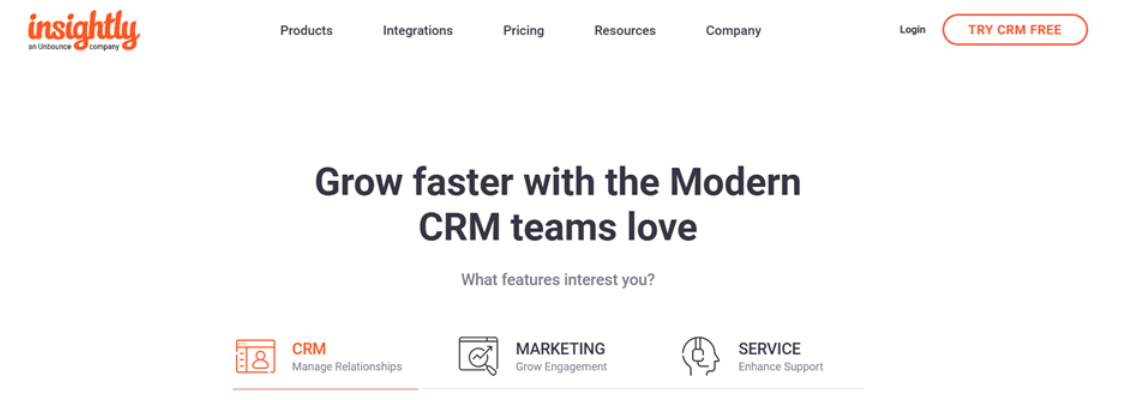
- CRM Features: Insightly offers robust tools for contact management, lead tracking, and project management tailored for small and mid-sized businesses.
- Marketing Automation: Includes features for email campaigns, customer journey mapping, and personalized content delivery.
- Project Management: Combines CRM with project tracking, enabling teams to manage post-sale projects seamlessly.
- Custom Dashboards: Provides customizable dashboards and reporting tools to monitor sales performance and project progress.
- Integrations: Supports integrations with popular apps like G Suite, Microsoft 365, and Slack for enhanced productivity.
- Mobile App: Access CRM and project management tools on the go with Insightly’s intuitive mobile app.
3. Pipedrive

- Sales Pipeline: Pipedrive is a highly visual sales pipeline management tool that easily tracks deal and leads progress.
- Customization: Customizable fields and workflows to suit business-specific sales processes.
- Automation: Automates repetitive tasks like follow-ups, reminders, and data entry.
- Integration: Integrates with email and other third-party apps to streamline communication.
- Reporting & Insights: Detailed insights into sales activities and performance metrics.
C. Email Marketing Platforms
Email marketing remains one of the most effective channels in inbound marketing. Specialized platforms help manage email lists, automate campaigns, and track performance:
1. MailChimp

- Email Marketing: MailChimp specializes in email campaign automation, offering customizable templates and drag-and-drop editors.
- Website Builder: Provides a website-building tool with SEO and mobile optimization features.
- Audience Segmentation: Advanced segmentation tools help target specific groups within a mailing list.
- Reporting: Offers detailed insights into campaign performance, including open rates, clicks, and conversion data.
2. Constant Contact

- Email Campaigns: Constant Contact is a user-friendly platform for creating email campaigns with pre-designed templates.
- List Management: Easy list-building tools and audience segmentation for personalized campaigns.
- Automation: Supports autoresponders and scheduled email campaigns for automated marketing.
- Social Media Integration: Allows users to integrate social media channels with email marketing campaigns.
- Analytics: Offers real-time tracking and reporting on email engagement.
3. Loops

- Email Campaigns: Loops offers intuitive email marketing tools for creating personalized, automated email campaigns.
- Customer Segmentation: Advanced segmentation features allow for targeted email delivery based on user behavior, preferences, and demographics.
- Automation Workflows: Automate customer journeys with behavior-triggered emails, including welcome sequences, follow-ups, and re-engagement campaigns.
- A/B Testing: Built-in A/B testing tools to optimize email subject lines, content, and send times for better performance.
- Analytics & Reporting: Detailed analytics track open rates, click-through rates, and conversions to measure campaign effectiveness.
- Integrations: Seamlessly integrates with other platforms, including CRMs and e-commerce tools, to enhance marketing efforts.
D. Social Media Management Platforms
Social media is an essential part of any inbound marketing strategy. Managing multiple platforms efficiently requires specialized tools:
1. Hootsuite

- Social Media Management: Hootsuite allows scheduling and managing posts across multiple social media platforms from one dashboard.
- Monitoring: Users can track brand mentions, keywords, and engagement metrics.
- Collaboration: Supports team collaboration with different access levels for account managers, writers, and social media coordinators.
- Analytics: Offers detailed social media performance analytics to track campaign effectiveness.
- Integrations: Integrates with popular platforms like Facebook, Instagram, Twitter, and LinkedIn.
2. Buffer
- Simple Scheduling: Buffer is known for its intuitive interface for scheduling posts across platforms like Twitter, Facebook, Instagram, and LinkedIn.
- Analytics: Offers post-performance analytics and insights into audience engagement.
- Post Queue: Users can create a content queue to automate posting at optimal times.
- Team Collaboration: Supports multiple user access for collaboration on social media strategy.
E. Landing Page Builders
Landing pages are critical for converting visitors into leads, and specialized software can help design, A/B test, and optimize them:
1. Unbounce

- Landing Page Builder: Unbounce specializes in creating high-conversion landing pages with a drag-and-drop builder.
- A/B Testing: Allows users to A/B test different versions of landing pages to optimize performance.
- Lead Capture: Includes built-in forms and pop-ups for capturing leads directly from landing pages.
- Customization: No coding knowledge required; provides highly customizable templates.
2. Semrush Landing Page Builder

- Drag-and-Drop Builder: Create high-converting landing pages easily with an intuitive drag-and-drop editor, with no coding required.
- Templates: Offers customizable templates optimized for various goals like lead generation, product promotion, and event registration.
- SEO Optimization: Built-in SEO tools to help optimize your landing pages for better search engine rankings and visibility.
- A/B Testing: Run A/B tests to evaluate page designs, copy, and calls-to-action to improve conversion rates.
- Analytics & Reporting: Track page performance with detailed reports on visitor behavior, conversions, and traffic sources.
- Integrations: Integrates with other Semrush tools, CRM platforms, and email marketing services for streamlined workflows.
F. Website Analytics Platforms
Measuring the success of inbound marketing efforts is essential, and analytics platforms help track key metrics such as traffic, conversions, and user behavior:
1. Google Analytics

- Website Traffic Insights: Google Analytics provides an in-depth analysis of website traffic, user behavior, and acquisition channels.
- Conversion Tracking: Allows businesses to track conversions and measure the success of marketing campaigns.
- Custom Reports: Users can create custom reports to focus on specific metrics and KPIs.
- Real-Time Data: Provides real-time data on user activity, helping businesses optimize marketing strategies.
2. Adobe Analytics

- Real-Time Analytics: Provides real-time insights into customer behavior, enabling businesses to make data-driven decisions instantly.
- Advanced Segmentation: Offers robust segmentation tools to analyze customer journeys and tailor marketing strategies.
- Customizable Dashboards: Create personalized dashboards to track KPIs, conversions, and other metrics relevant to your business goals.
- Predictive Analytics: Leverages AI to forecast trends and customer behaviors, helping businesses plan future strategies.
- Cross-Channel Insights: Collect data across various channels, including web, mobile, and social media, for a comprehensive view of customer interactions.
- Integrations: Easily integrates with other Adobe products and third-party tools to enhance your marketing and analytics capabilities.
{{INLINE_MOFU}}
Factors for Inbound Marketing
Factors.ai plays a critical role in helping businesses optimize their inbound marketing efforts. While traditional inbound platforms like HubSpot, Salesforce, or Google Analytics provide a range of tools for content creation, CRM, and marketing automation, Factors.ai specializes in offering deep insights into the inbound marketing funnel, such as customer behavior patterns, conversion drivers, and touchpoint effectiveness.
By leveraging AI and machine learning, Factors.ai tracks how leads engage across different channels, identifies friction points in the customer journey, and predicts future behaviors. It also provides detailed attribution models, helping marketers understand the contribution of each interaction in the conversion process. These actionable insights allow businesses to optimize their campaigns in real-time, adjust strategies based on performance data, and prioritize high-impact touchpoints for better ROI
Here’s how Factors.ai can help with inbound marketing:
● Funnel Optimization
Factors provides businesses with a detailed view of their marketing funnel, helping identify where leads drop off and how to improve conversion rates.
For example, if you're a SaaS marketer at a company like TechCo launching a new product, "Product X," Factors can pinpoint the exact stage where leads tend to abandon their journey—during sign-up, onboarding, or post-trial follow-up. By identifying these friction points, you can tweak your content or workflows to guide leads seamlessly through the funnel.
● Predictive Analytics
By analyzing historical data, Factors can predict future trends, helping businesses make data-driven decisions that improve the efficiency of their inbound campaigns.
For instance, TechCo could use predictive analytics to forecast which marketing channels (e.g., webinars, email, or organic search) are likely to generate the most leads for "Product X." This allows the marketing team to prioritize high-performing channels and allocate budget more effectively.
● Real-time Insights
Factors offers real-time insights into the performance of various inbound strategies, enabling businesses to adjust and optimize their marketing efforts for better results.
Imagine you're running an email campaign for "Product X," and seeing unexpectedly low open rates. With Factors’ real-time insights, you can quickly test and adjust subject lines, sending times, or content to improve engagement in the current campaign rather than waiting for a full campaign analysis after the fact.
● Personalization
The platform also allows businesses to personalize their inbound marketing strategies based on the data it collects, ensuring that content and campaigns are tailored to the needs of individual prospects.
For example, if TechCo targets small business owners for "Product X," Factors can analyze their website behavior and previous interactions to deliver personalized content. This could be a targeted case study on how "Product X" helped a similar-sized business, which can increase the likelihood of conversion.
For businesses looking to refine their inbound marketing strategy, Factors.ai is an essential tool for maximizing results and ensuring that every stage of the marketing funnel is optimized for conversion.
In a Nutshell
Inbound marketing is a powerful approach for businesses looking to attract and engage customers non-intrusively. With the right tools, companies can automate tasks, manage customer relationships, analyze data, and optimize every stage of the marketing funnel. Whether you’re a small business or an enterprise, platforms like HubSpot, Salesforce, and Factors provides the essential tools to succeed in inbound marketing. Businesses can see significant improvements in lead generation, customer retention, and overall ROI by using the right software and continuously optimizing strategies.
%2520(1).avif)
Top LinkedIn Agencies in Europe: Choose the Right Partner
Want to leverage LinkedIn for marketing? Discover how to choose the right linkedin ad agency for your B2B company.

Running LinkedIn ads isn’t everyone’s cup of tea. With the ever-changing algorithms and new updates, it can be hard for even the best marketing professionals to understand how to optimize their ads. Plus, targeting ads in Europe, where there is a wide range of linguistic barriers and time differences, can be complicated.
That’s where LinkedIn ad agencies come in. But how do you choose the right agency for your business needs?
Not to worry; we’ve come up with a list of the top LinkedIn agencies in Europe that you can evaluate and partner with, to take your ad campaigns to the next level 📈
What to look for before investing in a LinkedIn ad agency
Before diving into the list, it's crucial to understand what makes a LinkedIn ad agency stand out. Here are some key factors to consider:
1. Proven Expertise in LinkedIn Ads
Look for agencies that specialize in LinkedIn advertising rather than offering it as part of a broader suite of services. Search for certifications, case studies, and client testimonials demonstrating their expertise.
2. Industry Experience
Different industries require different approaches on LinkedIn. Agencies with experience in your specific sector will better understand your target audience, messaging, and campaign strategies.
3. Customizable Service Offerings
A good LinkedIn ad agency should offer tailored solutions rather than one-size-fits-all packages. Flexibility is key when you need full campaign management or specific services like creative design or A/B testing.
4. Transparent Reporting
Transparency is essential in digital marketing. Ensure the agency provides detailed, easy-to-understand reports that track key metrics like CTR, conversion rates, and ROI.
5. Innovative Approach
LinkedIn’s advertising landscape is constantly evolving. Agencies that stay ahead of the curve by adopting new features, ad formats, and strategies will give your campaigns a competitive edge.
6. Client Communication
Effective communication is crucial for a successful partnership. The agency should be responsive, easy to reach, and proactive in providing updates and recommendations.
Top LinkedIn Agencies in Europe
Now that you know what to look for, here’s our curated list of the top LinkedIn agencies in Europe, along with insights into their services and specializations:
Searched 6 sites
Here's a detailed review of five LinkedIn ad agencies in Europe, specifically focusing on their LinkedIn services and why B2B companies might consider partnering with them. This should help you understand what each offers and make a more informed decision.
1. Getuplead
Website: Getuplead
Overview: Getuplead is a digital marketing agency focused on driving B2B lead generation through various platforms, with a strong emphasis on LinkedIn. They offer a comprehensive approach to LinkedIn advertising, from account audits to detailed targeting and content strategies.
Why Choose Them: Getuplead's service is tailored for B2B companies looking to leverage LinkedIn's professional network to generate high-quality leads. They excel in creating customized ad campaigns that resonate with specific target audiences. Their methodical approach to campaign management ensures that every ad dollar is maximized for ROI.
Pricing: Specific pricing is not listed on their website, but they offer consultations to discuss potential campaigns and costs.
2. Eskimoz
Website: Eskimoz
Overview: Eskimoz is a leading LinkedIn Ads agency that focuses on helping B2B companies reach highly qualified audiences. Their services include precise targeting, ad creation, and continuous optimization of campaigns to ensure maximum ROI.
Why Choose Them: Eskimoz is known for its expert handling of LinkedIn's various ad formats, including Sponsored Messaging, Video Ads, and Dynamic Ads. They bring a deep understanding of LinkedIn's algorithms and targeting capabilities, making them a strong partner for companies aiming to improve their brand awareness and lead generation on the platform.
Pricing: Pricing details are not openly available, but they focus on providing value through performance-driven campaigns.
3. Fill My Funnel
Website: Fill My Funnel
Overview: Fill My Funnel is a specialized LinkedIn marketing agency dedicated to B2B businesses. Their services cover every aspect of LinkedIn advertising, from initial audits and strategy development to ongoing optimization and reporting.
Why Choose Them: Led by Tom Tigwell, one of the top 30 LinkedIn Ads experts globally, Fill My Funnel stands out for its deep expertise and proven track record in driving growth for B2B companies. They employ a holistic approach, integrating LinkedIn ads seamlessly into broader marketing strategies.
Pricing: They offer free consultations to discuss potential strategies and pricing based on the specific needs of your business.
4. LinkedIst
Website: Linkedist
Overview: Linkedist is a B2B LinkedIn marketing agency, offering content creation, personal branding, lead generation, advertising, ambassador workshops, and optimization for AI search (GEO / AEO) for worldwide brands. Their proven strategies help brands and executives scale their digital authority and visibility across LinkedIn and AI-driven platforms.
Why Choose Them: Linkedist is a B2B LinkedIn marketing agency that provides services including content creation, personal branding, lead generation, LinkedIn advertising, ambassador workshops, and optimization for AI search (GEO / AEO) for brands operating worldwide. The agency focuses on helping both companies and executives strengthen their visibility and authority across LinkedIn and AI-driven discovery platforms. In 2025, Linkedist secured top positions in the TechBehemoths Awards across categories such as Content Marketing, Personal Branding, and Advertising. Their hybrid approach is designed to support engagement, employee advocacy, and measurable reach, with reported outcomes and clients seeing data-backed growth.
Pricing: Specific pricing is not listed on their website, but they offer tailored packages for brands of all sizes, with flexible pricing for projects or ongoing campaigns.
5. Coseom
Website: Coseom
Overview: Coseom is a digital marketing agency with a strong emphasis on LinkedIn advertising for B2B companies. They provide end-to-end services, from strategy formulation to campaign management, with a focus on generating high-quality leads.
Why Choose Them: Coseom is particularly suited for companies looking for a comprehensive approach to LinkedIn marketing. They combine their expertise in digital marketing with a focus on LinkedIn’s unique strengths to create campaigns that drive engagement and conversions.
Pricing: Pricing information is typically discussed during consultations, tailored to the specific requirements of each campaign.
6. DGTL Base
Website: DGTL Base
Overview: DGTL Base is a digital marketing agency that offers specialized LinkedIn advertising services. They focus on creating targeted campaigns that help B2B companies reach their ideal audience on LinkedIn.
Why Choose Them: DGTL Base is known for its data-driven approach to LinkedIn advertising, ensuring that every aspect of a campaign is optimized for the best possible performance. Their expertise in managing LinkedIn’s ad formats and targeting options makes them a valuable partner for businesses aiming to enhance their LinkedIn presence.
Pricing: DGTL Base provides custom quotes based on the scope and objectives of the campaign.
{{INLINE_MOFU}}
Want to run ads in-house? AdPilot to the rescue
Choosing the right LinkedIn ad agency can significantly impact your marketing success. Whether you’re looking for a data-driven approach, creative excellence, or specialized industry expertise, the agencies listed above offer some of the best LinkedIn advertising services in Europe. Take the time to assess your specific needs, review each agency’s strengths, and select the partner that aligns best with your business goals.
However, if you want to take things in-house, look no further than Factors LinkedIn AdPilot! From intent based impression control to automated campaign management, AdPilot can help you save ad spend while doubling your LinkedIn ROI! Book a demo today to see how AdPilot can be a game-changer for your LinkedIn campaigns.

Top LinkedIn Ads Agencies
Discover top LinkedIn ads agencies: HeyDigital, Impactable, B2Linked, TripleDart, and New North. Get insights and optimize your LinkedIn with Factors.ai.
LinkedIn has emerged as a crucial platform for B2B marketing, enabling businesses to reach a professional audience with targeted advertising. With the right strategy, LinkedIn ads can drive significant growth, leads, and conversions. To take advantage of LinkedIn's full potential, many businesses turn to something known as a LinkedIn ads agency.

The Importance of LinkedIn Agencies
LinkedIn has become a powerful tool for B2B marketing, offering unparalleled access to a professional audience. However, running successful LinkedIn ad campaigns requires a deep understanding of the platform, its targeting capabilities, and best ad creation and optimization practices. This is where LinkedIn ad agencies come in. These agencies specialize in maximizing the effectiveness of LinkedIn advertising, helping businesses to:
- Reach Targeted Audiences: Agencies leverage LinkedIn's advanced targeting features to ensure the most relevant audiences see ads.
- Optimize Ad Spend: By continuously monitoring and adjusting campaigns, agencies ensure that ad spend is used efficiently, maximizing ROI.
- Create Compelling Ads: Experienced agencies know how to create ads that capture attention and drive engagement.
- Analyze and Report: Agencies provide detailed analytics and reporting, allowing businesses to understand the impact of their campaigns and make informed decisions.

Here Are Some Of The Top LinkedIn Ads Agencies
1. HeyDigital

Overview:
HeyDigital is a leading LinkedIn ads agency known for its expertise driving growth for SaaS and B2B companies. They offer a comprehensive range of services including LinkedIn ad management, conversion rate optimization, and landing page design. Founded in 2019, HeyDigital has quickly built a reputation for delivering high-quality client results by focusing on data-driven strategies and creative ad development.
Key Features:
- Specialized in SaaS and B2B Companies: HeyDigital focuses on SaaS and B2B companies, providing tailored strategies that align with industry-specific goals.
- Comprehensive Ad Management and Optimization: They handle every aspect of LinkedIn ad campaigns, from initial setup to ongoing management and optimization.
- Conversion-Focused Landing Page Design: HeyDigital creates custom landing pages to maximize conversions and drive more leads.
- In-Depth Reporting and Analytics: They provide detailed reports and analytics to track campaign performance and inform strategic decisions.
Pros:
- Expertise in SaaS and B2B Sectors: Their specialization ensures a deep understanding of these industries' unique challenges and opportunities.
- Proven Track Record of Success: HeyDigital has a history of delivering impressive client results, and numerous case studies showcase its success.
- Detailed and Transparent Reporting: Clients appreciate HeyDigital's transparency and detail in reporting, which helps them understand their campaigns' ROI.
Cons:
- May Be Cost-Prohibitive for Smaller Businesses: HeyDigital's services are premium, which might be beyond the budget of smaller companies.
- Limited to Certain Industries: Their focus on SaaS and B2B sectors may not be the best fit for companies outside these areas.
Pricing:
- Custom pricing based on the scope of the project. HeyDigital tailors its pricing to match each client's specific needs and goals, ensuring a personalized approach.
2. Growthspree

Overview:
Growthspree is a B2B SaaS marketing agency where LinkedIn Ads is one of the sharpest strengths, run as a pipeline channel rather than a lead channel. Senior operators run every account, backed by $60M+ in managed SaaS ad spend across 300+ companies like PriceLabs, Rocketlane, Hubilo, and Hasura. What sets them apart is measurement: their proprietary MCP attribution layer connects LinkedIn, Google, and Meta directly to HubSpot, so campaigns are optimized for cost per SQL and closed-won revenue, not vanity clicks or in-platform form fills.
Key Features:
- Senior Operators on Every Account: Experienced strategists run your campaigns daily, not rotating junior managers learning on your budget.
- MCP Pipeline Attribution: A proprietary Model Context Protocol layer ties LinkedIn spend to CRM pipeline and cost per SQL, included at no extra cost, so you finally see which campaigns drive revenue.
- QLA (Qualified Lead Accelerator): Feeds ICP-qualified signals back to LinkedIn's algorithm, driving 30–50% lower cost per SQL.
- Everything Included: Campaign management, LinkedIn-native creatives, landing pages, Conversions API setup, and RevOps, all under one flat fee.
- Proven Outcomes: PriceLabs scaled ROAS from 0.7x to 2.5x; Trackxi hit 4x trials at 51% lower cost per SQL; Rocketlane reached 3.4x ROAS at 36% lower cost per demo.
Pros:
- Revenue, Not Vanity Metrics: Optimizes to pipeline and cost per SQL rather than CPL or lead volume, exactly what marketing leaders need to prove impact.
- Transparent, Aligned Pricing: A flat $3,000/month with no lock-in and no percentage of spend means every extra budget dollar goes to media, not agency margin.
- Strong Third-Party Proof: 4.9/5 across 50+ reviews on G2, plus Google Partner and HubSpot Solutions Partner status.
Cons:
- Growthspree works exclusively with B2B SaaS and B2B tech companies. It's not a fit for B2C brands or businesses outside that space.
- The pipeline-attribution advantage is most powerful for teams running HubSpot or a connected CRM.
Pricing:
- Flat $3,000/month, month-to-month, no lock-in, no percentage of spend. Fees stay fixed regardless of ad spend.
3. Impactable

Overview:
Impactable is dedicated to helping businesses achieve their advertising goals through targeted LinkedIn campaigns. They provide full-service LinkedIn ad management, from strategy to execution and optimization. Impactable focuses on creating highly effective LinkedIn ads that drive meaningful engagement and conversions.
Key Features:
- Full-Service LinkedIn Ad Management: Impactable handles every aspect of LinkedIn advertising, ensuring a seamless and effective campaign from start to finish.
- Detailed Audience Targeting and Segmentation: They use advanced targeting techniques to reach the most relevant audiences for their clients.
- Advanced Analytics and Reporting: Impactable provides comprehensive analytics and reporting to track the performance and impact of LinkedIn ad campaigns.
- A/B Testing for Continuous Improvement: They regularly conduct A/B tests to refine ad strategies and improve results over time.
Pros:
- Focused Expertise on LinkedIn Ads: Impactable's sole focus on LinkedIn advertising ensures they stay up-to-date with the latest trends and best practices.
- Robust Targeting Capabilities: Their advanced targeting methods help clients reach the right audience more effectively.
- Strong Emphasis on Data-Driven Results: Impactable prioritizes data and analytics to drive decision-making and campaign improvements.
Cons:
- Services Can Be Expensive for Small Businesses: Like many specialized agencies, Impactable's services come at a premium.
Pricing:
- Custom pricing based on advertising spend and service requirements. Impactable works with clients to develop a pricing plan that aligns with their budget and advertising goals.
4. B2Linked
Overview:
B2Linked specializes in LinkedIn advertising and offers services designed to maximize ROI for its clients. Its focus is on high-precision targeting, campaign management, and continuous optimization. Founded by AJ Wilcox, a recognized expert in LinkedIn advertising, B2Linked brings a wealth of knowledge and experience to its clients.
Key Features:
- Precision Targeting and Segmentation: B2Linked uses LinkedIn's targeting capabilities to reach specific professional audiences.
- Comprehensive Campaign Management: They manage every aspect of LinkedIn ad campaigns, from setup to ongoing management and optimization.
- Continuous Optimization and A/B Testing: B2Linked conducts regular tests and optimizations to ensure the best possible performance.
- In-Depth Performance Tracking and Reporting: They provide detailed reports and analytics to help clients understand the impact of their campaigns.
Pros:
- Highly Specialized in LinkedIn Ads: B2Linked's focus on LinkedIn advertising allows them to develop deep expertise in this area.
- Excellent Targeting Capabilities: Their precise targeting methods help clients reach the most relevant audiences.
- Transparent and Detailed Reporting: Clients appreciate the detailed and transparent reporting provided by B2Linked.
Cons:
- May Not Offer Services Beyond LinkedIn: B2Linked's specialization means they do not provide broader digital marketing services.
- Pricing Can Be High for Startups: Their premium services might be out of reach for smaller companies or startups.
Pricing:
- B2Linked offers custom pricing based on client needs and campaign complexity. It works with clients to create a pricing structure that aligns with their goals and budget.
5. TripleDart

Overview:
TripleDart offers a holistic approach to LinkedIn advertising, focusing on creating compelling ads that drive engagement and conversions. They provide end-to-end LinkedIn ad management services tailored to meet specific business goals. TripleDart's team brings a wealth of experience in digital marketing, ensuring comprehensive support for LinkedIn campaigns.
Key Features:
- End-to-End LinkedIn Ad Management: TripleDart manages every aspect of LinkedIn ad campaigns, from strategy development to execution and optimization.
- Creative Ad Design and Development: They focus on creating visually appealing and engaging ads that capture attention and drive action.
- Data-Driven Targeting and Optimization: TripleDart uses data and analytics to refine targeting and optimize ad performance.
- Performance Analytics and Reporting: They provide detailed reports and insights to help clients understand campaign performance and ROI.
Pros:
- Comprehensive Service Offering: TripleDart offers a full range of LinkedIn ad services, from strategy to execution and optimization.
- Focus on Creative Ad Development: Their emphasis on creative ad design helps clients stand out on LinkedIn.
- Data-Driven Approach: TripleDart uses data and analytics to inform its strategies and optimize performance.
Cons:
- May Require Higher Budgets for Optimal Results: Their comprehensive services require a higher budget to achieve the best results.
- Some Services May Be Outsourced: Depending on the project's scope, some services might be outsourced to third-party providers.
Pricing:
- Custom pricing based on campaign scope and objectives. TripleDart works with clients to develop a pricing plan for their budgets and goals.
6. New North

Overview:
New North is a digital marketing agency that offers specialized LinkedIn advertising services. They focus on creating and managing LinkedIn campaigns that align with broader marketing strategies to drive business growth. New North combines strategic planning with creative execution to deliver impactful LinkedIn ads.
Key Features:
- Integrated Marketing Strategy: New North ensures LinkedIn ad campaigns are aligned with overall marketing strategies to maximize impact.
- Targeted LinkedIn Ad Campaigns: They create and manage campaigns that effectively reach and engage the target audience.
- Continuous Campaign Monitoring and Optimization: New North monitors and optimizes campaigns to ensure optimal performance.
- Comprehensive Reporting and Analysis: They provide detailed reports and analysis to track campaign performance and inform strategic decisions.
Pros:
- Strategic Integration with Overall Marketing Plans: Their approach ensures LinkedIn ads are part of a broader, cohesive marketing strategy.
- Expert Campaign Management: New North's team brings experience managing LinkedIn ad campaigns, ensuring high-quality execution and results.
- Emphasis on Continuous Improvement: Their focus on monitoring and optimizing ensures campaigns always perform at their best.
- Detailed Reporting and Insights: Clients receive comprehensive reports that provide valuable insights into campaign performance.
Cons:
- Potentially Higher Costs: Their integrated and comprehensive approach might come with higher costs than more specialized agencies.
- Broader Focus Might Mean Less Specialization: While their integrated approach is beneficial, they are less specialized in LinkedIn ads than agencies focusing solely on this platform.
Pricing:
- Custom pricing based on client needs and campaign scope. New North works with clients to develop a pricing structure that aligns with their marketing budgets and goals.
Criteria for Selecting the Right LinkedIn Ads Agency
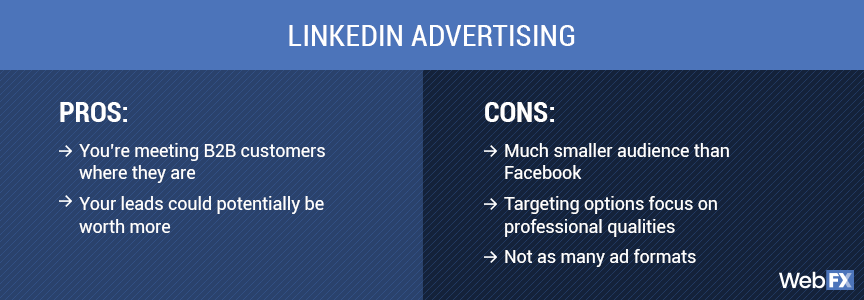
Choosing the right LinkedIn ads agency is critical to the success of your campaigns. Here are some key factors to consider:
- Industry Experience
Look for agencies with experience in your specific industry. Specialized knowledge can significantly impact understanding your audience and crafting effective campaigns.
- Proven Track Record
Review case studies, client testimonials, and success stories to gauge an agency's effectiveness. A strong track record indicates their ability to deliver results.
- Service Offering
Ensure the agency offers your services, from strategy development to execution and optimization. Comprehensive services can simplify management and improve campaign cohesion.
- Customization
The best agencies tailor their services to meet your specific needs and goals. Avoid one-size-fits-all solutions.
- Budget
Understand the pricing structure and ensure it aligns with your budget. Consider the return on investment (ROI) potential rather than just the cost.
- Communication and Transparency
Effective communication and transparency are crucial for a successful partnership. Ensure the agency provides regular updates and detailed reports.
- Expertise and Innovation
Look for agencies that stay current with the latest LinkedIn trends and innovations. Their ability to adapt and innovate can keep your campaigns ahead of the competition.
- Cultural Fit
Ensure the agency's values and work style align with your own. A good cultural fit can enhance collaboration and overall satisfaction.
{{INLINE_MOFU}}
Step-by-Step Approach to Help You Choose the Perfect LinkedIn Ads Agency

Choosing the perfect LinkedIn ads agency involves a detailed evaluation of potential partners. Here’s a step-by-step guide to help you make the right choice:
- Define Your Goals
Clearly outline your advertising goals. Are you looking to increase brand awareness, generate leads, or drive conversions? Knowing your objectives will help you find an agency that aligns with your vision.
- Research and Shortlist
Conduct thorough research to identify potential agencies. Use directories, read reviews, and seek recommendations. Shortlist agencies that specialize in LinkedIn advertising and have a strong reputation.
- Evaluate Experience and Expertise
Look into the agency's experience with LinkedIn ads. Check their expertise in your industry and their understanding of your target audience.
- Request Case Studies and References
Ask for case studies demonstrating their success with similar campaigns. Contact references to get firsthand insights into their performance and client satisfaction.
- Assess Their Approach
Understand their strategy for LinkedIn advertising. Do they conduct thorough market research? How do they create and optimize ads? Ensure their approach aligns with your expectations.
- Analyze Reporting and Analytics
Effective reporting and analytics are crucial for tracking performance. Ensure the agency provides detailed, transparent reports that help you understand the impact of your campaigns.
- Discuss Pricing and ROI
Clarify the agency's pricing structure and ensure it fits your budget. Discuss the agency's approach to maximizing ROI and how it measures success.
- Test Communication and Responsiveness
Effective communication is key to a successful partnership. During the initial interactions, evaluate their responsiveness and willingness to address your concerns.
- Consider a Trial Period
Start with a smaller project or a trial period. This allows you to assess their performance and compatibility before committing to a long-term partnership.
Choosing the right LinkedIn ads agency can significantly impact your advertising success. Considering factors such as industry experience, service offerings, budget, and communication, you can find an agency that aligns with your goals and maximizes your LinkedIn advertising potential. The top agencies mentioned in this guide have proven track records and specialized expertise, making them excellent choices for businesses leveraging LinkedIn for growth and networking. Whether you choose HeyDigital, Impactable, B2Linked, TripleDart, or New North, you can be confident in their ability to deliver impactful LinkedIn ad campaigns that drive results.
However, managing LinkedIn ads efficiently also requires robust analytics and performance tracking.
Factors’ LinkedIn AdPilot
This is where our LinkedIn AdPilot comes into play. AdPilot enables marketers to double down on their LinkedIn ROI with capabilities such as Smart Reach, Audience Builder, Campaign Automation, View-Through Attribution, and Factors’ CAPI integration, enabling marketers to up their LinkedIn Ads game.
Make the most of your LinkedIn ad campaigns with the perfect combination of expert agency services and powerful analytics from Factors.ai.
Also Read: Top LinkedIn Agencies in North America
Also Read: Top LinkedIn Agencies in Middle East
These top agencies specialize in LinkedIn ad strategies to drive targeted B2B campaigns, optimizing ad spend and performance.
1. HeyDigital: Experts in SaaS and B2B, offering ad management, conversion rate optimization, and landing page design.
2. Growthspree: Focuses on LinkedIn ads and marketing for B2B SaaS growth with senior ad operators.
3. Impactable: Focuses on LinkedIn ads and marketing for B2B growth with dedicated ad specialists.
4. B2Linked: Over $150M in ad spend experience, known for pioneering principles to maximize LinkedIn Ads ROI.
5. TripleDart: Specializes in enhancing ad performance and lead generation through LinkedIn.
6. New North: Aims to optimize LinkedIn ad strategies for driving growth in B2B companies.
These agencies help businesses leverage LinkedIn Ads to achieve targeted B2B marketing success.
.avif)
Top 9 Intent-Based Marketing Tools for B2B Companies
Compare the best intent-based marketing tools for B2B, including Factors.ai, Bombora & 6sense. Features, pricing & integrations to boost your ROI.

TL;DR
- Intent-based marketing tools empower B2B teams to identify and engage with prospects who are actively seeking solutions, thereby enhancing conversion rates and accelerating sales.
- Key considerations include data accuracy, integration, compliance, analytics, and pricing.
- Select a tool that aligns with your business goals, technical infrastructure, and target audience.
- These platforms enable a focus on high-intent accounts, personalized outreach, and improved ROI.
- Success requires aligning sales and marketing teams and integrating smoothly with your CRM. Reliable intent data is essential for B2B growth and competitiveness.
Struggling to convert website visitors into leads? You're not alone. Many B2B marketers find that traditional campaigns attract prospects who aren't ready to buy, leading to wasted resources and missed sales targets. Sales teams often chase cold leads while genuine buyers slip away. The solution? Intent-based marketing tools. These platforms track digital signals, such as content downloads, keyword searches, and website visits, to identify companies actively seeking solutions like yours. By targeting high-intent accounts, you can boost engagement, shorten sales cycles, and drive revenue.
This guide lists the top 9 intent-based marketing tools for B2B, detailing their features, strengths, and optimal uses. Whether refining your ABM strategy or enhancing lead generation, this curated list will help you select the right platform to grow your business.
Why B2B Companies Need Intent-Based Marketing Tools?
Here’s why B2B companies need intent-based marketing tools:
- Targets Active Buyers: Intent-based tools identify companies actively researching your solution, reducing wasted outreach to disinterested prospects.
- Leverages Behavioral Data: Tracks signals like website visits, content downloads, and keyword searches to detect buying intent.
- Enables Personalized Outreach: Equips teams to tailor messaging and campaigns based on real-time intent signals for greater relevance.
- Improves Lead Prioritization: Helps prioritize high-intent accounts, ensuring sales teams focus on prospects most likely to convert.
- Shortens Sales Cycles: Timely follow-ups with in-market buyers accelerate deal progression and reduce time to close.
- Boosts ROI: Resources are spent more efficiently, leading to higher conversion rates and better return on marketing investment.
- Aligns Sales and Marketing: Fosters collaboration between sales and marketing through shared, intent-based goals and data-driven lead strategies.
Top 10 Intent-Based Marketing Tools
Choosing the right intent-based marketing tool can significantly enhance your B2B pipeline. Here's a snapshot of the top 10 platforms:
1. Factors

Factors is built for B2B teams focused on marketing intelligence and attribution. It unifies behavioral signals to identify high-intent accounts. Lead scoring, multi-touch attribution, and journey visualization are all part of its offering. The platform integrates with major CRMs and requires no coding to set up. It’s designed to speed up sales readiness with real-time alerts and workflow automations. A strong choice for data-driven, product‑led teams.
Key Features:
- Unified Scoring Engine: Merges CRM, ad, web, and intent data into a single scoring model.
- Sales‑Ready Detection: Flags accounts showing strong buying signals for rapid sales action.
- PQL Identification: Tracks product-qualified leads via app usage and workflow triggers.
- Intent Alerts: Sends real-time alerts to sales reps based on intent and behavior.
- No‑Code Deployment: Quick setup with configurable rules, no developer needed.
- CRM Integration: Bi‑directional syncing with Salesforce, HubSpot, and others.
- Multi‑Touch Attribution: Maps the contribution of each channel to revenue outcomes.
- Journey Visualization: Displays a timeline of account actions from initial contact to conversion.
- Slack & Email Alerts: Immediate notifications enable faster outreach.
Pricing:
Factors offers a forever-free plan. The paid plan starts at $ 5,000 per year.
2. Bombora

Bombora is a leading intent data provider offering a comprehensive view of account behavior based on the Bombora Data Co‑op, which collects privacy-compliant intent signals from thousands of business-related websites. It helps B2B teams identify accounts showing increased research on specific topics, with seamless integrations across CRMs and marketing platforms. Trusted by marketers for its "Company Surge" score, Bombora surfaces accounts actively exploring relevant solutions, enabling early, targeted outreach.
Key Features:
Also read: ZoomInfo Pricing in 2026: Plans, Costs, Alternatives & Overview
- Company Surge Intent Data: Indicates when account-level interest in a topic exceeds the baseline.
- Data Co‑op Source: Covers millions of websites in a privacy-compliant data exchange.
- Custom Topic Tracking: Monitors intent around more than 12,000 specific market topics.
- Scoring & Prioritization: Ranks accounts based on the intensity and recency of intent signals.
- Sales & Marketing Integration: Pushes data into platforms like Salesforce, Marketo, and DSPs.
- Campaign Optimization: Helps target high-intent audiences in ads and email campaigns.
- Churn & Expansion Signals: Identifies when existing customers show new buying interest.
Pricing:
Public pricing is not available.
3. Cognism
Cognism combines rich B2B contact data with intent signals to give revenue teams precise buyer insights. Its platform aggregates firmographic and technographic info, real-time hiring, funding, and intent alerts. With integrated search, data enrichment, and mobile verification, teams can uncover decision-makers and engage them proactively. Cognism is ideal for sales and marketing operations seeking rapid pipeline generation and compliance-ready outreach.
Key Features:
- Signal-Based Buy Triggers: Detect hiring trends, funding rounds, and executive changes to time outreach.
- Firmographic & Technographic Filters: Segment contacts by industry, company size, and tech stack for precise targeting.
- Bombora Intent Integration: Surface account-level buying signals across topics of interest.
- Phone-Verified Mobile Data: Includes manually verified mobiles to reach prospects instantly.
- AI-Powered Prospect Search: Enables natural-language queries to find ICP-fit accounts quickly.
- CRM & Outreach Sync: Bi-directional integrations with Salesforce, HubSpot, Salesloft, etc.
- Sales Companion Extension: Access contact data and signals directly from social platforms.
Pricing:
Pricing details are available upon request.
4. 6sense

6sense is an AI-driven platform that delivers intent insights, predictive scoring, and account orchestration. It captures vast intent data across web and third-party sources, leverages AI (6AI) to predict buying stages, and enables real-time engagement across marketing and sales channels. Designed for full-funnel orchestration, 6sense helps revenue teams uncover in-market accounts, personalize outreach, and boost ROI, all within a compliance-first framework.
Key Features:
Also read: 10 Best Visitor Queue Alternatives For B2B Teams
- AI-Powered Intent Scoring: Real-time analysis of intent trends to flag in-market accounts.
- Web Deanonymization: Maps anonymous web behavior to known accounts across sessions.
- Keyword & Topic Tracking: Monitor unlimited intent topics and auto-generate keyword suggestions.
- Predictive Account Prioritization: Uses AI to rank accounts based on likelihood to buy.
- Multi-Channel Orchestration: Enables coordinated campaigns across email, ads, and sales outreach.
- Shared Dashboards & Alerts: Surface key intent trends via Slack or custom dashboards.
- Third-Party Integrations: Includes Bombora, G2, TrustRadius, TechTarget, and CRM platforms
Pricing:
It has a free plan with basic features. Public pricing is not available.
5. Demandbase

Demandbase is an AI-powered account intelligence platform that combines firmographic data, intent signals, and web visitor identification to help B2B marketers discover and engage in-market accounts. It offers deep insights into account activities, enabling personalized outreach and optimized ABM campaigns. With comprehensive CRM and ad platform integrations, Demandbase supports coordinated orchestration across teams while ensuring data compliance.
Key Features:
- Intent-Based Account Targeting: Identifies accounts showing real-time purchase signals.
- Company Visitor Identification: Matches anonymous website traffic to active accounts.
- Custom Account Segments: Build dynamic account lists based on behavior, ICP, and intent.
- B2B Advertising Insights: Targets and optimizes ads based on account intent.
- Personalized Web Experiences: Dynamically adapt website content per account or segment.
- Engagement Analytics: Monitors account-level activities and campaign results.
- CRM & MarTech Integration: Syncs data bidirectionally with Salesforce, HubSpot, and more.
Pricing:
It has a free plan with limited features. Paid plan details are not publicly available.
6. ZoomInfo

ZoomInfo provides a comprehensive B2B intelligence suite with contact enrichment, intent signals, and data-driven workflows. It helps teams identify, prioritize, and reach the right accounts using verified contact details and in-market signals. With adaptable segmentation and CRM automation, ZoomInfo simplifies pipeline growth and ensures clean, compliant data.
Key Features:
- Verified Contact Enrichment: Delivers accurate firmographic and technographic data.
- Intent Signal Alerts: Alerts when accounts show buying behavior in your industry.
- Target Account Recommendations: Suggests ICP-fit accounts to pursue.
- Workflow Automation: Syncs directly with Salesforce, HubSpot, and outreach tools.
- Advanced Account Search: Use flexible filters to build custom prospect lists.
- Email Campaign Integration: Launch personalized outreach from the platform.
- Data Compliance Management: Ensures GDPR, CCPA, and ISO-standard adherence.
Pricing:
Also read: 10 Best Madison Logic Alternatives And Competitors In 2026
Public pricing is not available.
7. Lead Forensics
Lead Forensics tells you which companies are visiting your website and what they're looking at, which makes activity on your own site a source of first-party intent. Real-time alerts flag target accounts as they arrive, decision-maker contacts are ready for follow-up, and leads are scored and synced to your CRM.
Key Features:
- Anonymous Visitor Identification: Shows which pages a company viewed, how often it came back and how long it stayed.
- Behavioral Heatmaps: Tracks pages and timing to understand visitor interest.
- Custom Lead Alerts: Sends real-time alerts when target pages are visited.
- CRM Sync: Passes new leads into Salesforce, HubSpot, Microsoft Dynamics, Pipedrive or Zoho.
- Decision-Maker Contacts: Provides contact details for relevant people at identified companies.
- Priority Lead Lists: Filters accounts based on engagement level and firmographics.
- Lead Scoring Integration: Scores leads automatically from their activity on your site.
Pricing:
Quote based on your website traffic, with a one-week free trial.
8. Leadfeeder

Leadfeeder turns website traffic into actionable sales leads by identifying company visits and tracking engagement. It helps B2B teams spot in-market behaviors and push data to CRMs or automation tools. By delivering transparent reports and custom alerts, Leadfeeder simplifies funnel acceleration.
Key Features:
- Company Identification: Detects which businesses visit your site.
- Behavioral Tagging: Labels pages like Pricing, Blog, and Solution for intent insights.
- Lead Alerts: Notify teams when high-value accounts show interest.
- CRM & Automation Integration: Pushes leads to HubSpot, Pipedrive, or Google Sheets.
- Segmented Lists: Enable targeting of repeat or high-intent visitors.
Pricing:
It has a free plan. The paid plan starts at € 99 per month.
Also read: Top 5 6sense Alternatives and Competitors For B2B GTM Teams in 2026
9. Lusha

Lusha enriches CRM data with real-world email and phone contacts while layering in intent signals indicating active interests or hires. Designed for streamlined outreach, Lusha gives revenue teams confidence in their prospect database and the timing of interactions. It helps users stay compliant while scaling personalized engagement.
Key Features:
- Fresh Contact Enrichment: Adds accurate email and mobile details.
- Intent Data Overlay: Flags when enriched contacts show buying behavior.
- Chrome Extension Access: Pull prospect data directly from LinkedIn.
- CRM Integration: Syncs with Salesforce, HubSpot, and other CRMs.
- Export and Sharing: Bulk export for ABM and outreach campaigns.
- Compliance Filters: Ensures data meets GDPR/CCPA regulations.
Pricing:
Lusha offers a free plan.
Each platform has unique strengths, from data range to predictive analytics. Select one that aligns with your goals, technology stack, and compliance requirements for optimal B2B results.
Also read: Top 10 Warmly.AI Alternatives and Competitors In 2026-Compare Pros, Cons & Pricing
{{INLINE_MOFU}}
How to Choose the Right Intent-Based Marketing Tool for Your Business?
To select the right intent-based marketing tool for your B2B company, start by
- Define Your Goals: Clarify whether your focus is lead generation, ABM, or accelerating existing opportunities.
- Evaluate Data Quality: Look for tools that offer fresh, accurate, and real-time intent signals, such as Factors.ai or Bombora.
- Check Integration Compatibility: Ensure the tool integrates seamlessly with your CRM, MAP, and sales platforms to unify your data.
- Ensure Compliance: Select a solution that complies with GDPR, CCPA, and other relevant privacy regulations to safeguard your business.
- Review Analytics & Scoring Capabilities: Opt for platforms with robust reporting, AI-driven lead scoring, and actionable insights.
- Compare Pricing vs. Value: Balance features, support, and scalability with cost. Use free trials or demos to validate fit.
- Assess Vendor Support: Strong onboarding, documentation, and customer service can significantly impact long-term success.
Wrapping Up: Choose the Tool that Aligns with your Goals
Intent-based marketing tools are essential for B2B companies to identify, engage, and convert high-intent prospects. These tools leverage real-time buying signals to help sales and marketing teams focus their efforts, tailor messages, and accelerate sales cycles. However, each tool offers different strengths and data sources. Your choice should align with your goals, current tech setup, and compliance needs.
Carefully evaluate key features such as analytics, CRM compatibility, and privacy standards. Success also depends on team collaboration and proper training to utilize these insights effectively. With the right tool, your team can focus on what matters and drive growth. Choose wisely to harness the full potential of intent data for your B2B strategy.
Top 25 B2B Contact Database Tools for 2026
Compare the top 25 B2B contact database tools for 2026. See pricing, key features, and which database is best for your sales and marketing team.
When it comes to business-to-business (B2B) marketing and sales, having access to accurate and comprehensive contact databases is crucial. Generally, a B2B contact database empowers businesses to identify, connect with, and build relationships with potential clients and partners. These tools are indispensable for streamlining outreach efforts, personalizing marketing campaigns, and driving growth. In fact, the global business-to-business e-commerce market size was estimated at USD 18,665.95 billion in 2025 and is projected to grow at a compound annual growth rate (CAGR) of 18.2% from 2024 to 2030. With the right B2B contact database, companies can ensure their marketing and sales teams have high-quality leads and valuable insights.
A B2B contact database is a structured repository of verified business contact information — including names, email addresses, phone numbers, job titles, and company details — used by sales and marketing teams for targeted outreach and lead generation. The best B2B contact databases offer advanced filters, CRM integration, real-time verification, and compliance with GDPR and CCPA regulations.
Having a correct B2B contact database is crucial, as a lack of it can often adversely affect sales. According to Experian, on average, U.S. organizations believe 32 percent of their data is inaccurate, a 28 percent increase over last year's figure of 25 percent. This high degree of inaccurate information causes 91 percent of respondents to believe revenue is affected by inaccurate data in terms of wasted resources, lost productivity, or wasted marketing and communications spend.
Criteria for Selection
When evaluating B2B contact database providers, it is essential to consider several key criteria:
- Accuracy of Data: The database should provide up-to-date and precise information to ensure effective communication.
- Range of Features: A comprehensive suite of features, such as CRM integration, data enrichment, and analytics, can enhance the tool's usability.
- User-Friendliness: The platform should have an intuitive interface and be easy to navigate, ensuring efficiency in its usage.
- Pricing: The cost of the service should align with the budget while offering good value for money.
- Customer Reviews: Feedback from current and past users can provide insights into the tool's performance and reliability.
Did you know?
Inaccurate B2B contact data wastes 27.3% of sales reps' time. That's 546 hours a year per full-time inside sales rep. So it only makes sense to ensure the factual validity of this data.
Quick Comparison: Top 10 B2B Contact Databases
| Tool | Database Size | Key Strength | Starting Price | Best For |
|---|---|---|---|---|
| ZoomInfo | 321M+ contacts | Most comprehensive data + intent signals | ~5K/year | Enterprise sales teams |
| Apollo.io | 230M+ contacts | All-in-one prospecting + generous free tier | Free / 9/mo | Growing teams, startups |
| Cognism | 400M+ profiles | Human-verified phones, GDPR-compliant | Custom pricing | European markets |
| LinkedIn Sales Navigator | 900M+ profiles | Native LinkedIn access + InMail | 9/mo | LinkedIn-first prospecting |
| Lusha | 150M+ contacts | Chrome extension, quick enrichment | Free / 9/mo | Individual reps, small teams |
| UpLead | 160M+ contacts | 95% accuracy guarantee | 9/mo | Data accuracy priority |
| Seamless.AI | 157M+ contacts | AI-powered real-time verification | Free / Custom | High-volume prospecting |
| Lead411 | 450M+ contacts | Verified emails + intent data included | 9/mo | Intent-driven outreach |
| RocketReach | 700M+ profiles | Broad coverage across industries | 3/mo | Recruiting + sales |
| Hunter.io | 100M+ emails | Email finding + domain search | Free / 9/mo | Email-first outreach |
Top 25 B2B Contact Database Companies/Tools
1. ZoomInfo

Overview
ZoomInfo is a leading business intelligence and data software platform that provides comprehensive contact and company information to help businesses enhance their marketing and sales efforts. It offers a robust B2B contact database with detailed profiles of companies and professionals, making it easier for organizations to identify and connect with potential leads.
Key Features
- Extensive Database: Access to millions of business contacts and company profiles.
- Data Enrichment: Enhances existing customer data with additional information.
- Lead Scoring: Identifies high-potential leads based on specific criteria.
- Integrations: Seamless integration with popular CRM and marketing automation platforms.
- Sales Automation: Tools to automate and streamline sales workflows.
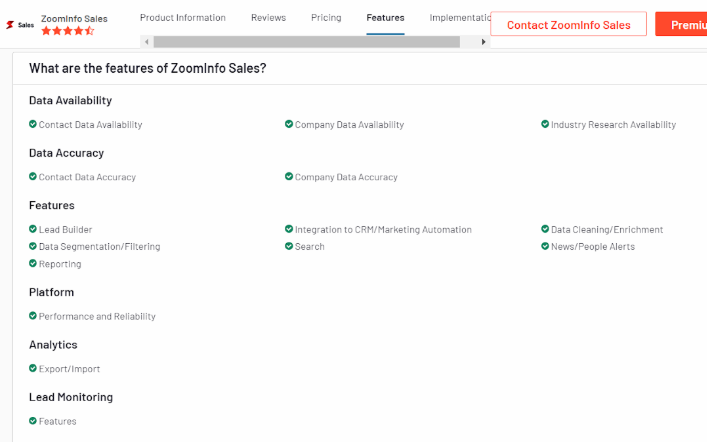
Pros:
- Comprehensive and up-to-date B2B contact database.
- Powerful search capabilities and filtering mechanisms.
- Integration with extensive CRM systems.
- Useful for both small and large businesses.
Cons:
- Higher cost compared to some competitors.
- Learning curve for newer users.
- Occasional data inaccuracies.
Pricing
- ZoomInfo offers customized pricing based on the specific needs and size of the organization.
- Interested users need to contact ZoomInfo for a personalized quote.
2. Clearbit

Overview
Clearbit is a data enrichment platform that helps businesses optimize their marketing and sales efforts by providing real-time intelligence on companies and individuals. Clearbit enhances the quality and accuracy of customer data, enabling more effective targeting and engagement.
Key Features
- Data Enrichment: Enhances customer records with detailed company and contact information.
- Lead Scoring: Identifies and prioritizes high-value leads.
- API Access: Real-time data access through powerful APIs.
- Prospecting Tools: Helps find and connect with the right contacts.
- Integration: Compatible with various CRM and marketing automation tools.
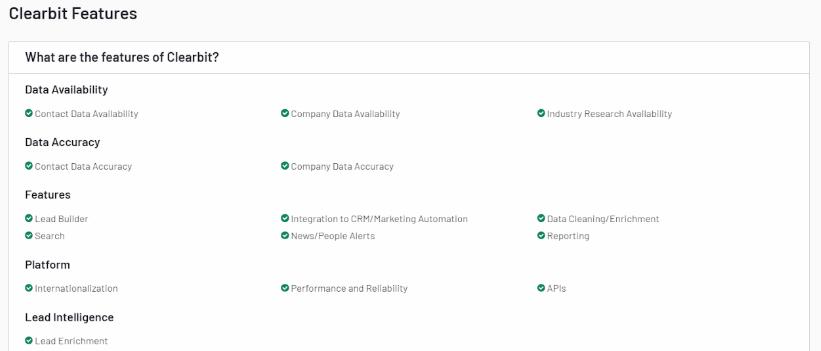
Pros:
- Real-time data enrichment.
- Easy integration with preexisting systems.
- Comprehensive and accurate data.
- User-friendly interface.
Cons:
- Pricing can be high for smaller businesses.
- Limited free features.
- Some data may still require manual verification.
Pricing
- Clearbit offers a range of pricing plans, starting with a free plan for basic usage.
- Users must explore the paid plans for more advanced features and higher usage limits.
- Specific pricing details are available on the Clearbit website.
3. LinkedIn Sales Navigator

LinkedIn Sales Navigator is a premium sales tool that helps sales professionals target the right prospects, understand key insights, and engage with personalized outreach. It leverages LinkedIn's vast professional network to provide actionable insights and advanced search capabilities.
Key Features
- Advanced Search: Find and connect with prospects using advanced filtering options.
- Lead Recommendations: Personalized lead recommendations based on user preferences.
- Real-time Updates: Receive updates on saved leads and accounts.
- InMail Messages: Send direct messages to any LinkedIn user outside your network.
- CRM Integration: Syncs with CRM systems to streamline workflows.
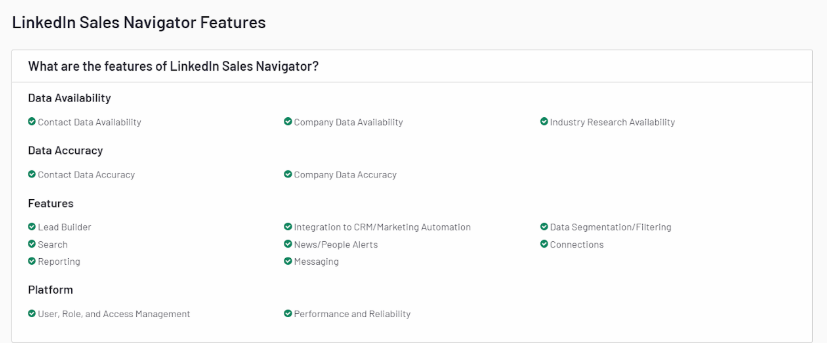
Pros:
- Access to LinkedIn's extensive professional network.
- Advanced search and filtering capabilities.
- Real-time updates and insights.
- Direct messaging with InMail.
Cons:
- Expensive for individual users.
- Only limited features are available in the basic plan.
- Requires active LinkedIn usage.
Pricing
- LinkedIn Sales Navigator offers several pricing tiers: Professional, Team, and Enterprise.
- The Professional plan starts at $79.99 every month for the year.
- Team and Enterprise plans offer more advanced features and require a custom quote.
4. UpLead

Overview
UpLead is a B2B contact database and company data platform designed to help businesses identify and connect with high-quality prospects. It provides verified data, ensuring sales and marketing teams can reach the right contacts with accurate information.
Key Features
- Data Accuracy: Verified contact and company data.
- Lead Generation: Advanced search and filtering options to find prospects.
- Data Enrichment: Enhance existing data with additional insights.
- CRM Integration: Seamless integration with popular CRM systems.
- Email Verification: Ensures email addresses are valid and active.
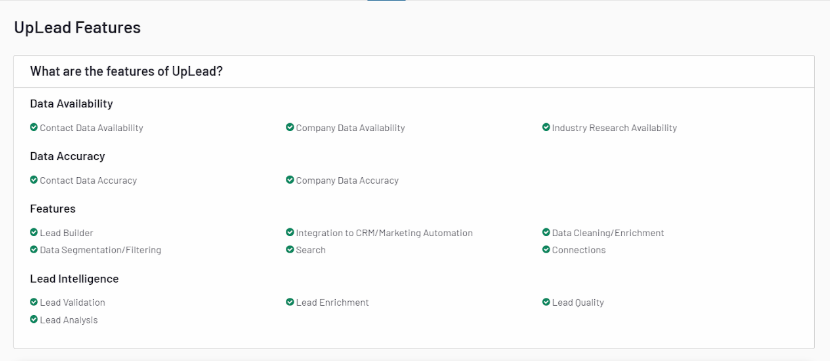
Pros:
- High accuracy of data.
- Easy-to-use interface.
- Flexible pricing plans.
- Email verification feature.
Cons:
- Limited B2B contact database size compared to some competitors.
- Occasional data gaps.
- Higher tiers are needed for full feature access.
Pricing
- Free Trial
- Essentials ($99/month)
- Plus ($199/month)
- Professional ($399/month)
- Enterprise (custom pricing)
5. Lusha

Overview
Lusha is a sales intelligence platform that provides accurate contact information for B2B sales and marketing teams. It offers a browser extension and API access to help users find and connect with potential leads quickly and efficiently.
Key Features
- Contact Information: Access to direct dials, email addresses, and company data.
- Browser Extension: Quickly find contact details while browsing LinkedIn or other sites.
- CRM Integration: Sync data with major CRM platforms.
- API Access: Integrate Lusha data into custom applications.
- Data Accuracy: Regularly updated and verified data.
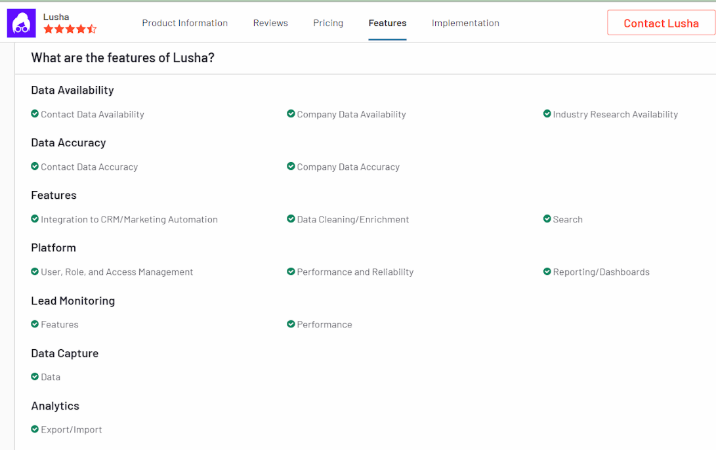
Pros:
- Easy to use and integrate.
- High accuracy of contact information.
- Useful browser extension.
- Cost-effective compared to some competitors.
Cons:
- Limited data on certain industries or regions.
- Higher usage limits require premium plans.
- Occasional discrepancies in data.
Pricing
- Free plan
- Pro plan ($29/month)
- Premium plan ($51/month)
- Custom pricing for Enterprise plans
6. Hunter.io

Overview
Also read: 10 Best Cognism Alternatives And Competitors
Hunter.io is a leading email finder tool that helps users find and verify professional email addresses. It is widely used for lead generation and email outreach.
Key Features
- Email Finder: Quickly find email addresses associated with a domain.
- Email Verifier: Verify the accuracy and deliverability of email addresses.
- Domain Search: Discover all email addresses related to a specific domain.
- Bulk Tasks: Perform bulk email searches and verifications.
- Chrome Extension: Can find email addresses easily while browsing the internet.
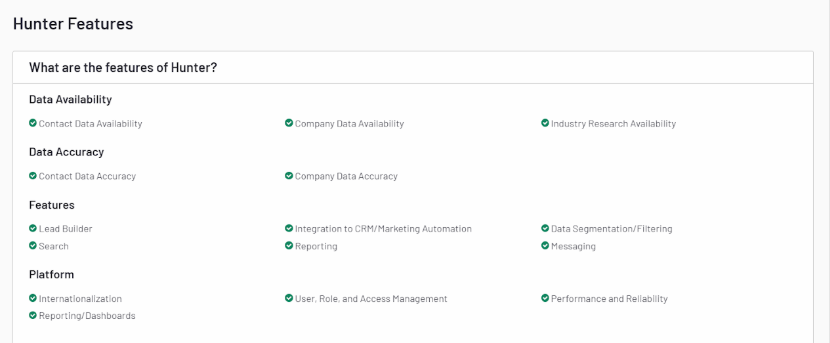
Pros:
- User-friendly interface
- High accuracy in email finding and verification
- Integration with CRM tools and other applications
- Generous free tier
Cons:
- Limited features in the free plan
- Pricing can be high for small businesses
Pricing
- Free: 25 searches per month
- Starter: $49/month for 500 searches
- Growth: $99/month for 2,500 searches
- Pro: $199/month for 10,000 searches
7. Lead411

Overview
Lead411 provides comprehensive business and contact data to enhance sales and marketing efforts. It includes verified email addresses, phone numbers, and company insights.
Key Features
- Verified Contacts: Access to accurate and up-to-date contact information.
- Sales Trigger Events: Alerts for job changes, funding announcements, and more.
- Lead Scoring: Prioritize leads based on predefined criteria.
- CRM Integration: Easy and smooth integration with famous CRM platforms.
- Mobile App: Access leads on the go with the mobile application.
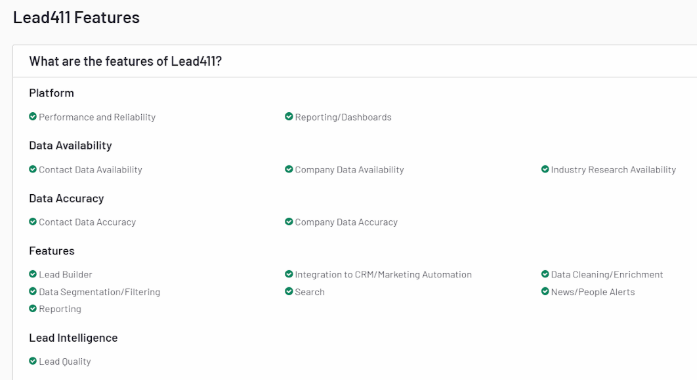
Pros:
- Extensive B2B contact database with high-quality leads
- Real-time sales triggers
- Customizable lead scoring
Cons:
- Higher price point for advanced features
- The interface can be complex for new users
Pricing
- Starter: $99/month for basic access
- Pro: Custom pricing based on features and number of users
- Enterprise: Custom pricing for large teams and advanced needs
8. AeroLeads

Overview
AeroLeads is a powerful prospect generation tool that helps users find email addresses and phone numbers from professional networking sites like LinkedIn.
Key Features
- Prospect Generation: Find email addresses, phone numbers, and other contact details.
- Data Export: Export data to CRM tools like Salesforce and HubSpot.
- Chrome Extension: Easily find prospects while browsing LinkedIn.
- Bulk Upload: Import data and enrich it with contact details.
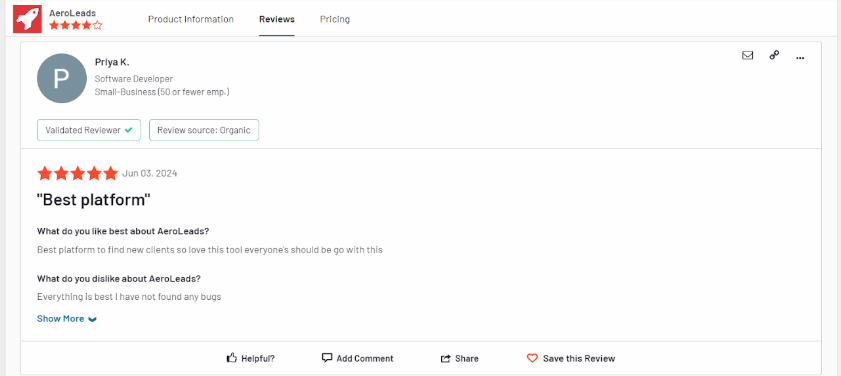
Pros:
- Easy integration with CRM tools
- Real-time data extraction
- Affordable pricing for small teams
Cons:
- Limited search filters
- The accuracy of contact details can vary
Pricing
- Take Off: $49/month for 1,000 credits
- Climb: $149/month for 4,000 credits
- Cruise: $499/month for 15,000 credits
- Enterprise: Custom pricing for large teams
9. RocketReach

Overview
RocketReach is a comprehensive tool for finding professionals' email addresses, phone numbers, and social media profiles across various industries.
Key Features
- Email Lookup: Find and verify professional email addresses.
- Phone Lookup: Access direct phone numbers.
- API Access: Integrate RocketReach with other applications.
- Bulk Lookups: Perform bulk searches for large lists.
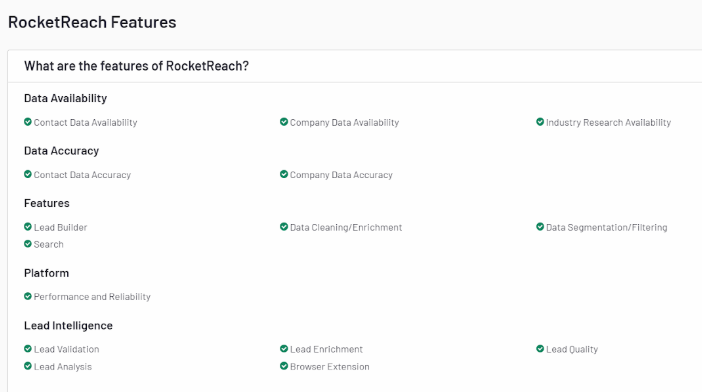
Pros:
- Extensive B2B contact database with high accuracy
- User-friendly interface
- Integration with CRM and email marketing tools
Cons:
- Limited features in the most basic plans
- Occasional discrepancies in data accuracy
Pricing
- Essentials: $39/month for 125 lookups
- Pro: $99/month for 300 lookups
- Ultimate: $249/month for 833 lookups
10. Adapt.io

Overview
Adapt.io offers a robust B2B contact database of business contacts and company information designed to support sales and marketing teams in their outreach efforts.
Key Features
- Lead Builder: Create targeted lead lists with advanced search filters.
- Email Verification: Ensure email addresses are accurate and deliverable.
- Data Export: Export data to various CRM and marketing tools.
- Sales Alerts: Get notified about company events and news.
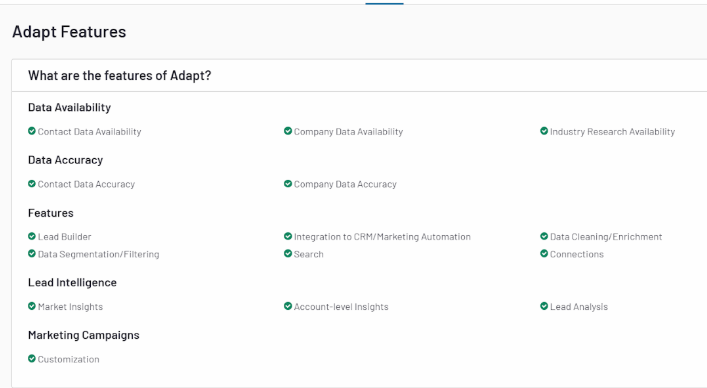
Pros:
- Comprehensive B2B contact database
- User-friendly interface
- Customizable search filters
Cons:
- Limited integration options
- It can be pricey for small businesses
Pricing
- Basic: $39/month for individual users
- Plus: $79/month for enhanced features
- Pro: Custom pricing for teams and enterprises
11. LeadIQ

Overview
LeadIQ streamlines lead generation by helping users find and capture contact information from professional networking sites.
Key Features
- Lead Capture: Easily capture leads from LinkedIn and other sites.
- CRM Integration: Sync leads with your CRM system.
- Email Finder: Discover and verify email addresses.
- Data Enrichment: Enrich your leads with additional contact details.

Pros:
- Simple and intuitive interface
- Excellent CRM integrations
- Accurate contact information
Cons:
- Premium features cost higher
- Limited features in the basic plan
Pricing
- Basic: $75/month per user
- Pro: $150/month per user
- Enterprise: Custom pricing for large teams
12. InsideView

Overview
Also read: AI marketing automation pricing comparison: what B2B teams should actually pay for
InsideView provides comprehensive market intelligence and data solutions to help sales and marketing teams identify and engage with the right prospects.
Key Features
- Market Intelligence: Access to detailed company and contact information.
- Data Enrichment: Enhance your existing data with accurate contact details.
- CRM Integration: Seamless integration with various other CRM platforms.
- Sales Insights: Receive insights and alerts about key events and changes.
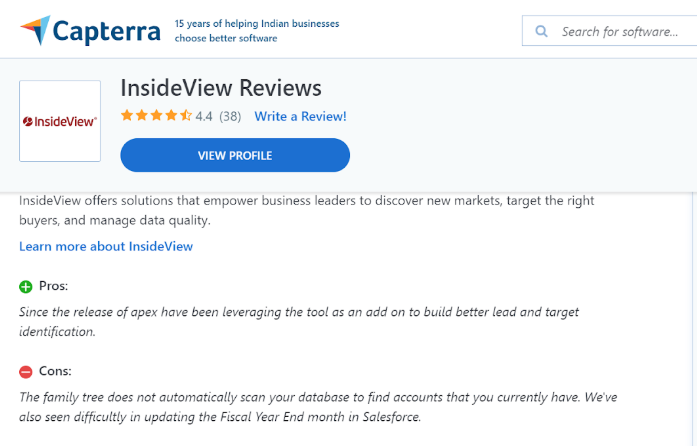
Pros:
- Extensive and accurate B2B contact database
- Powerful search and filtering options
- Real-time sales alerts
Cons:
- High cost for advanced features
- New users find the interface complicated
Pricing
- Basic: Custom pricing based on features and number of users
- Pro: Custom pricing for advanced features and large teams
- Enterprise: Custom pricing for enterprise needs
13. FullContact

Overview
FullContact is a contact management platform that helps businesses manage and enhance their contact data, providing a 360-degree view of customers.
Key Features
- Contact Management: Centralize and organize contact information.
- Data Enrichment: Enrich contact data with additional details.
- Identity Resolution: Resolve duplicate and incomplete contact records.
- API Access: Integrate FullContact with other tools and applications.
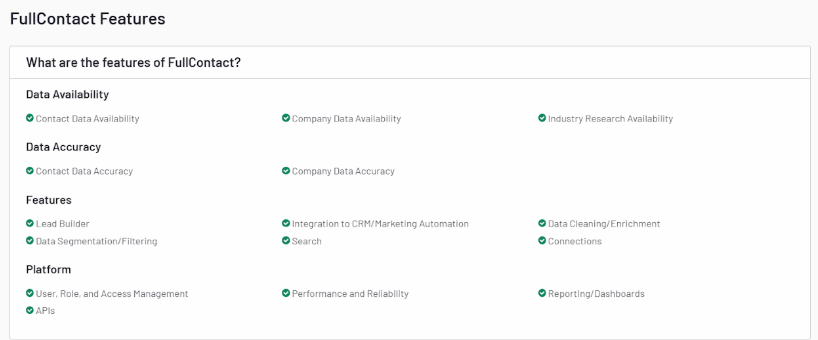
Pros:
- Comprehensive contact enrichment
- Easy integration with various tools
- Effective identity resolution
Cons:
- Pricing is a lot for small businesses
- Technical expertise necessary for some features
Pricing
- Starter: $99/month for basic access
- Premium: Custom pricing for advanced features
- Enterprise: Custom pricing for large organizations
14. SalesIntel

Overview
SalesIntel provides accurate and human-verified B2B contact data to support sales and marketing efforts, ensuring high-quality leads and insights.
Key Features
- Human-Verified Data: Access to verified contact information.
- Technographics: Information about the technology stack of companies.
- Intent Data: Identify prospects with purchase intent.
- CRM Integration: Seamlessly integrate with CRM and marketing tools.
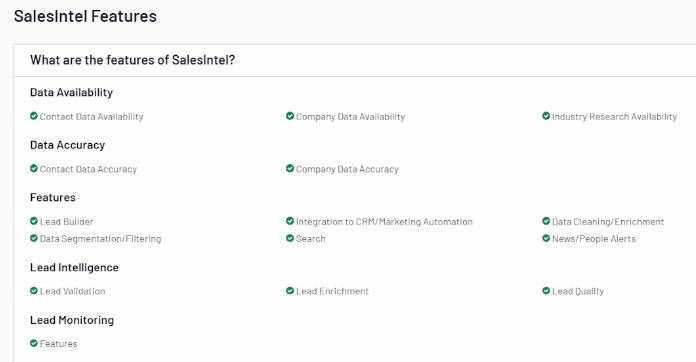
Pros:
- High accuracy of contact data
- Comprehensive technographic and intent data
- Excellent customer support
Cons:
- Higher pricing compared to some competitors
- Limited features in the basic plan
Pricing
- Basic: Custom pricing based on features and number of users
- Pro: Custom pricing for advanced features
- Enterprise: Custom pricing for large teams
15. Datanyze

Overview
Datanyze provides technographic data and sales intelligence to help businesses identify and engage with potential customers based on their technology usage.
Key Features
- Technographics: Access detailed information about the technology stack of companies.
- Contact Data: Find and verify contact information.
- Lead Generation: Identify and prioritize high-potential leads.
- Data Enrichment: Enhance your existing data with additional insights.
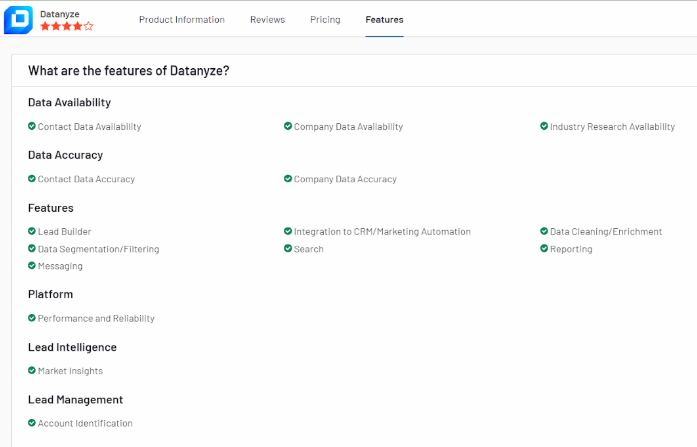
Pros:
- Detailed technographic data
- User-friendly interface
- Effective lead generation features
Cons:
- Pricing can be high for smaller businesses
- Limited CRM integration options
Pricing
- Basic: Custom pricing based on features and number of users
- Pro: Custom pricing for advanced features
- Enterprise: Custom pricing for large organizations
16. Seamless.AI

Overview
Seamless.AI is an advanced sales automation and lead generation platform designed to help sales professionals find accurate contact information quickly. It leverages artificial intelligence to search for and verify email addresses, phone numbers, and social media profiles.
Key Features
- AI-Powered Search: Uses AI to find and verify contact information.
- Real-Time Data: Provides up-to-date contact details.
- Lead Management: Organize and manage leads efficiently.
- CRM Integration: Syncs with major CRM systems for seamless data flow.
- Email Finder: Identifies email addresses with high accuracy.

Pros:
- High accuracy due to AI verification.
- Real-time updates and data accuracy.
- User-friendly interface.
Cons:
- Limited features in the free plan.
- Pricing is a little steep for the advanced features.
Pricing
- Free: Basic access with limited features.
- Pro: $147/month per user for full access.
- Enterprise: Custom pricing for large teams.
17. Cognism

Overview
Cognism is a sales intelligence platform that provides B2B contact data and lead generation tools to help businesses enhance their sales and marketing efforts. It offers GDPR-compliant data, ensuring privacy and security.
Key Features
- GDPR-Compliant Data: Ensures data privacy and security.
- Prospect Database: Extensive database of business contacts.
- Sales Triggers: Alerts on company events and updates.
- CRM Integration: Seamless integration with CRM platforms.
- Email Finder: Accurate email finding and verification.
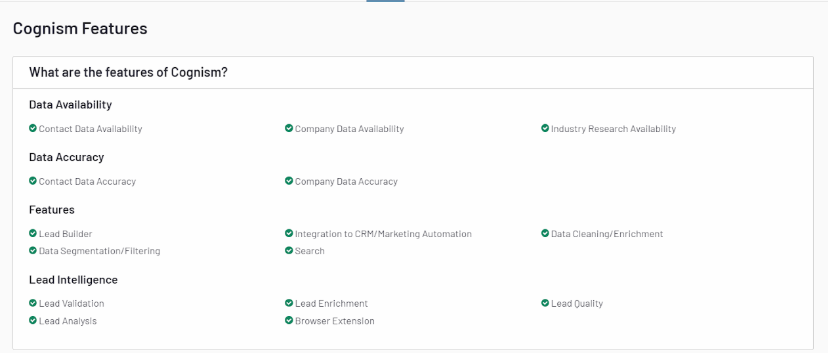
Pros:
- GDPR-compliant and secure data.
- Extensive contact database.
- Real-time triggers and alerts for sales
Cons:
- Higher cost for advanced features.
- Occasional data inaccuracies.
Pricing
Also read: Generative AI marketing use cases: what actually works for B2B teams
- Basic: $1,200/year for individual users.
- Advanced: Custom pricing for additional features and team access.
- Enterprise: Custom pricing for large organizations.
18. LeadGenius

Overview
LeadGenius is a B2B lead generation and data enrichment platform that combines human intelligence with machine learning to provide high-quality contact data. It focuses on delivering customized lead lists and detailed company insights.
Key Features
- Human and AI-Powered: Combines human intelligence with AI for data accuracy.
- Custom Lead Lists: Tailored lead lists based on specific criteria.
- Data Enrichment: Enhances existing customer data with additional information.
- Market Insights: Provides detailed insights into target markets.
- CRM Integration: Syncs with popular CRM systems.
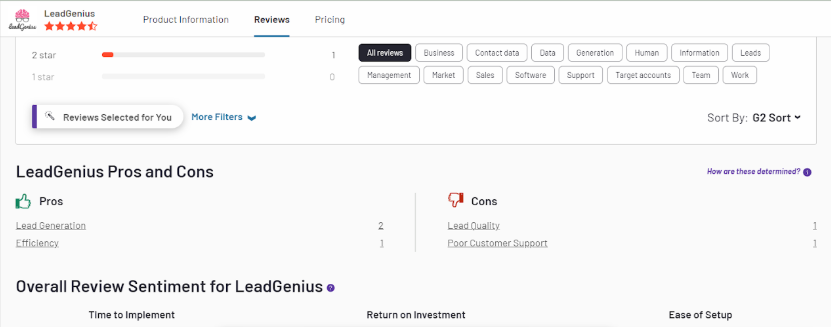
Pros:
- High accuracy and customized lead lists.
- Combines human intelligence and AI.
- Detailed market insights.
Cons:
- Higher pricing compared to some competitors.
- Lead list customization may take time.
Pricing
- Custom pricing based on specific needs and requirements.
19. LeadIQ

Overview
LeadIQ, now part of ZoomInfo, is a comprehensive sales and marketing intelligence platform that provides detailed contact and company information. It helps businesses identify, connect, and engage with potential customers effectively.
Key Features
- Comprehensive Database: Extensive contact and company information.
- Data Enrichment: Enhances customer data with additional insights.
- Sales Triggers: Alerts for job changes, funding, and other events.
- CRM Integration: Seamless integration with major CRM systems.
- Lead Scoring: Prioritizes high-potential leads
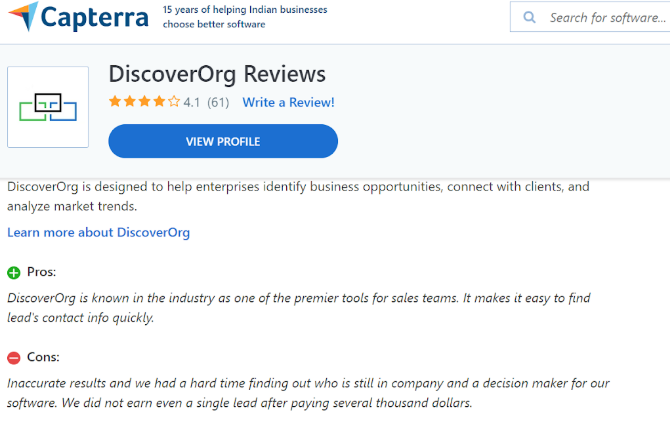
Pros:
- Extensive and detailed database.
- Ability to get real-time sales alerts and triggers.
- Integration with CRM systems.
Cons:
- Higher cost for advanced features.
- Requires some learning curve for newer users.
Pricing
- Custom pricing based on features and organizational needs.
20. Apollo.io

Overview
Apollo.io is a leading sales intelligence platform that provides comprehensive B2B contact data, lead generation tools, and CRM integration to empower sales and marketing teams. It offers detailed insights into companies and professionals, facilitating targeted outreach and improving conversion rates.
Key Features
- Comprehensive B2B contact database with detailed company profiles.
- Lead generation tools for generating, qualifying, and nurturing leads.
- Seamless CRM integration with popular platforms like Salesforce and HubSpot.
- Advanced prospecting tools for effective outreach and engagement.
- Data enrichment capabilities to enhance existing customer data.
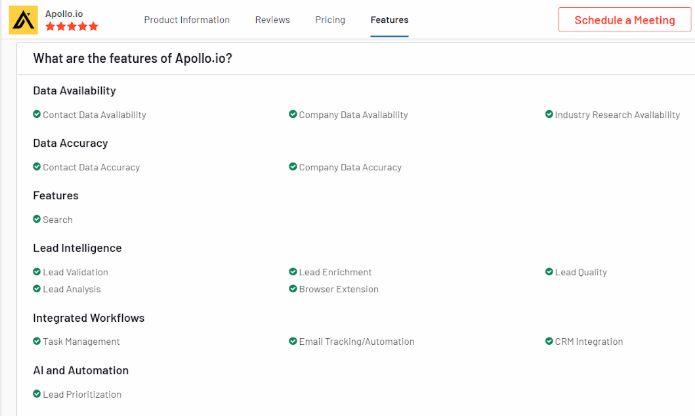
Pros:
- Vast database with detailed contact information.
- Powerful lead generation and prospecting tools.
- Seamless integration with major CRM systems.
- Customizable solutions tailored to specific needs.
- Data enrichment for improved targeting and segmentation.
Cons:
- Higher pricing compared to some competitors.
- Learning curve for new users.
- Requires active management for optimal use.
- Limited features in the basic plan.
Pricing
- Custom pricing based on features and organizational needs.
- Contact Apollo.io for personalized pricing quotes and plans.
21. Ampliz Salesbuddy

Overview
Ampliz Salesbuddy provides a B2B contact database with features to improve sales and marketing efficiency. It offers data enrichment and CRM integration.
Key Features
- Lead Generation and Enrichment: Helps acquire and enhance lead data.
- CRM Integration: Syncs with CRM systems for seamless data management.
- Advanced Search Filters: Allows users to search for leads based on specific criteria.
- Data Accuracy and Compliance: Ensures data is accurate and compliant with regulations.
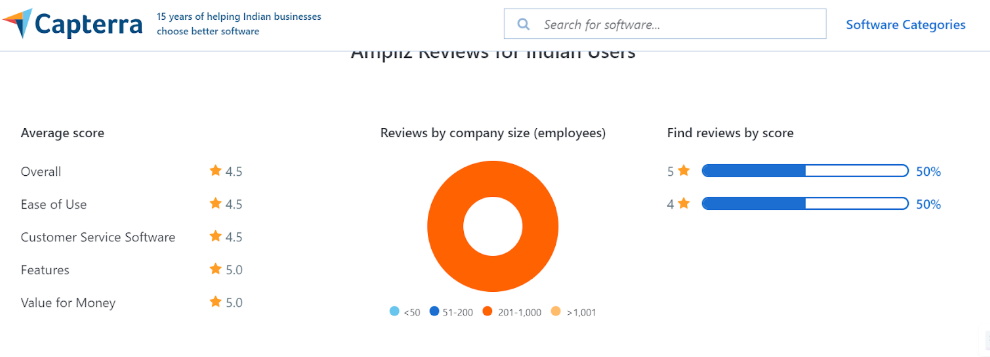
Pros:
- Effective lead generation and enrichment
- Integration with CRM systems
- Accurate and compliant data
Cons:
- Limited features in the basic plans
- Slightly costly for smaller teams
Pricing
- Ampliz Salesbuddy offers various pricing plans based on the number of users and features.
- Reach out to them for pricing details.
22. DemandScience

Overview
DemandScience provides a B2B contact database focused on data-driven sales and marketing solutions. It offers tools for lead generation and data enrichment.
Key Features
- Data-Driven Insights: Leverages data to provide actionable insights for sales and marketing.
- Lead Generation and Enrichment: Helps identify and enhance lead information.
- CRM Integration: Connects with CRM systems for efficient data management.
- Advanced Search Filters: Offers detailed search options based on various criteria.
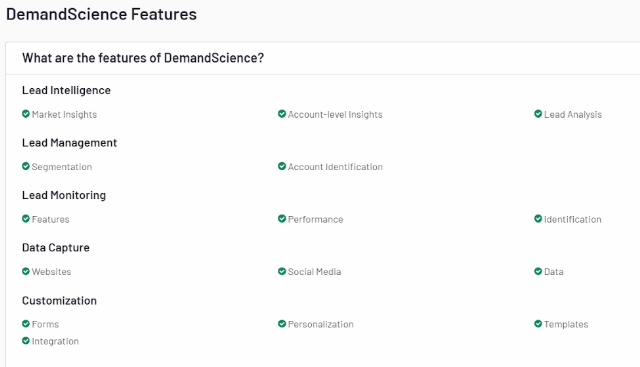
Pros:
- Data-driven approach for effective insights
- Comprehensive lead generation tools
- CRM integration
Cons:
- Advanced features are available only at higher prices
- Limited details on lower-tier plans
Pricing
- DemandScience's pricing is customized based on client needs and features.
- Specific details are available upon request.
23. Kaspr

Overview
Kaspr is a dynamic B2B contact database tool to streamline lead generation and data enrichment. It is tailored to help businesses find and connect with potential prospects effectively.
Key Features
- Real-Time Email and Phone Verification: Ensures that contact information is accurate and up-to-date.
- LinkedIn Integration: Allows users to extract contact details directly from LinkedIn profiles.
- Data Enrichment: Enhances contact data with additional company and industry information.
- Customizable Search Filters: Provides detailed search options to find specific leads based on various criteria.
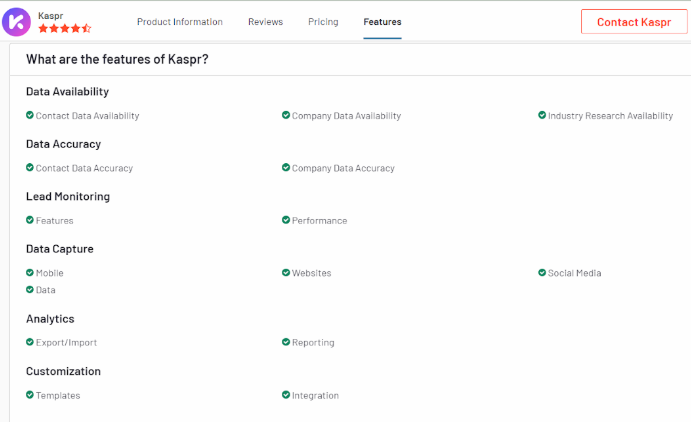
Pros:
- High accuracy in contact data
- Seamlessly integrates with LinkedIn
- User-friendly interface that aids navigation
Cons:
- Advanced plans cost more
- Limited features in lower-tier subscriptions
Pricing
Also read: AI Marketing Software: The Best Platforms for Modern B2B Marketing Teams
- Kaspr offers tiered pricing plans based on the required credits and features.
- Pricing details are available upon request.
24. Snov.io

Overview
Snov.io provides a B2B contact database focused on lead generation, email verification, and automation. It is designed to help businesses find and manage leads effectively.
Key Features
- Lead Generation allows users to find and collect leads based on various criteria, including company and job title.
- Email Verification ensures that email addresses are valid and deliverable.
- Automation Tools offers tools for automating email outreach and follow-ups.
- CRM Integration integrates with CRM systems for efficient data management and tracking.
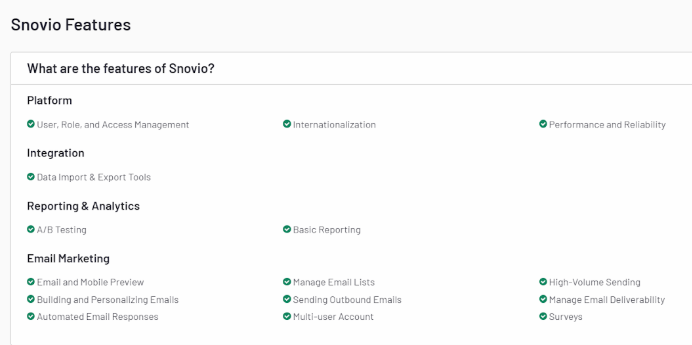
Pros:
- Effective lead generation and email verification
- Automation tools for outreach
- CRM integration
Cons:
- Limited features in basic plans
- Can be expensive for high-volume use
Pricing
- Snov.io offers tiered pricing plans based on features and number of users.
- Specific pricing details are available on their website.
25. Outreach

Overview
Outreach offers a comprehensive B2B contact database tool for sales engagement and automation. It focuses on improving sales productivity through advanced features and integrations.
Key Features
- Sales Engagement provides tools for managing and automating sales interactions, including email and call sequencing.
- Analytics and Reporting offers detailed analytics and reporting to track sales performance and optimize strategies.
- CRM Integration seamlessly integrates with popular CRM systems to streamline data management and enhance sales processes.
- Automated Workflows automates repetitive tasks to increase efficiency and reduce manual effort.
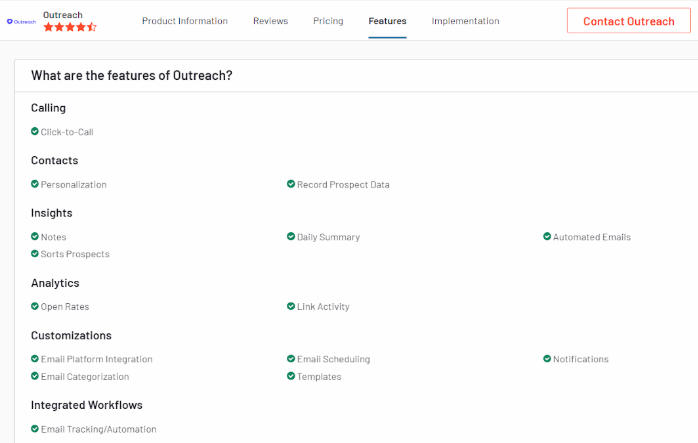
Pros:
- Advanced sales engagement and automation features
- Detailed analytics and reporting
- Effective CRM integration
Cons:
- Higher cost for extensive use
- Can be complex for new users
Pricing
- Outreach's pricing is based on the number of users and features.
- For specific pricing details, you can contact their sales team or visit their website.
{{INLINE_MOFU}}
What Real Users Say About B2B Contact Databases
Based on discussions across Reddit (r/SaaS, r/B2BSaaS, r/coldemail) and sales communities:
The consensus: No single B2B contact database has perfect data. Most experienced sales teams use 2-3 tools together through waterfall enrichment — trying one source first, then falling back to others for missing data.
Apollo vs. ZoomInfo: Apollo is praised for value (free tier + affordable plans), but users report declining data quality. ZoomInfo remains the enterprise standard but is cost-prohibitive for startups at 5K+/year.
The emerging approach: Tools like Clay and Airscale let you combine multiple data sources (Apollo + LinkedIn + Clearbit) in a single workflow, dramatically improving accuracy rates.
Key advice from practitioners: "I tested 6 B2B data providers — no single tool is perfect, combine them." Start with Apollo or LinkedIn Sales Navigator, then layer enrichment tools on top.
Also read: AI for small business marketing: a practical guide for growing without a bigger team
Here's How Factors.AI Can Help
- AI-Driven Accuracy: Factors.ai uses advanced AI algorithms to provide accurate and up-to-date contact information, ensuring that your data remains reliable.
- Data Enrichment: The platform offers real-time data enrichment to enhance the quality and completeness of your contact records.
- Seamless Integration: Factors.ai integrates smoothly with existing CRM systems, improving data management and facilitating better lead generation.
- Predictive Analytics: The tool includes features that help you make data-driven decisions and refine your marketing strategies.
How to Choose the Right B2B Contact Database
Accurate data is key to successful marketing and sales.
Top Tools:
1. ZoomInfo, Clearbit, LinkedIn Sales Navigator: Advanced lead generation and prospecting.
2. UpLead & Lusha: Reliable data enrichment and verification.
3. Factors: Captures cross-channel intent signals, automates workflows, and provides account intelligence to segment and score high-intent accounts.
Why Factors.ai?
It unifies GTM data, ensuring marketing and sales teams access high-quality leads and insights. This drives optimized performance and efficient decision-making.
How to Build a B2B Contact Database
If you prefer building your own database rather than purchasing one, follow these steps:
- Define your Ideal Customer Profile (ICP): Identify target industries, company sizes, job titles, and geographic regions.
- Use data platforms: Leverage tools like Apollo.io or LinkedIn Sales Navigator to source initial contacts matching your ICP.
- Capture inbound leads: Use lead magnets (whitepapers, webinars, free tools) to collect contact data through web forms.
- Enrich and verify: Use enrichment tools like Clearbit or Clay to fill gaps, and verification tools like NeverBounce to validate email addresses.
- Maintain data hygiene: Schedule quarterly data audits to remove bounced emails, update job titles, and refresh company information. B2B data decays at ~30% per year.
In a nutshell
Selecting the right B2B contact database can significantly enhance your business's outreach and growth efforts. You can find a tool that best meets your needs by considering data accuracy, range of features, user-friendliness, pricing, and customer reviews. Tools like ZoomInfo, Clearbit, LinkedIn Sales Navigator, UpLead, and Lusha each offer unique strengths and can serve as valuable assets for any B2B contact database marketing and sales strategy.
When choosing a B2B contact database tool, it is crucial to align your selection with your business goals and processes. If available, take advantage of free trials or demos to assess the tool's functionality and usability. Prioritize features to enhance your sales and marketing efforts and ensure the tool integrates seamlessly with your existing systems for maximum efficiency.
On average, data decays about 2% per month, which means more than 20% of your data will become unusable in a year. The only way to prevent this is to audit and append your data regularly. Following these steps will make selecting the right B2B contact database a cakewalk.
Explore how Factors.ai can help — get started today!
Frequently Asked Questions on Contact Database Tools
Q1. What is a B2B contact database?
A B2B contact database is a centralized repository of verified business contact information — including names, email addresses, phone numbers, job titles, and company details — that sales and marketing teams use for prospecting, outreach, and lead generation.
Q2. How do I choose the right B2B contact database?
Consider data accuracy rates, database size and coverage, pricing structure (per-seat vs. per-credit), CRM integrations (Salesforce, HubSpot), compliance with GDPR/CCPA, and whether you need intent data or enrichment features.
Q3. How much does a B2B contact database cost?
Prices range from free (Apollo.io free tier, Hunter.io) to 9-9/month for mid-tier tools (Lusha, UpLead, Lead411) to 5K-5K+/year for enterprise platforms like ZoomInfo. Most tools offer per-user or per-credit pricing.
Q4. What is the difference between a B2B contact database and a CRM?
A B2B contact database provides raw contact data for prospecting and lead generation. A CRM (like Salesforce or HubSpot) manages ongoing relationships with those contacts — tracking interactions, deals, and pipeline. They work together: the database feeds new leads into the CRM.
Q5. Can I get a free B2B contact database?
Yes. Several providers offer free tiers: Apollo.io (limited credits), Hunter.io (25 searches/month), LinkedIn (basic search), and Lusha (5 credits/month). These are suitable for individual reps or testing before committing to a paid plan.
Q6. How often should I update my B2B contact database?
Every 3-6 months at minimum. B2B data decays at approximately 30% per year due to job changes, company restructuring, and email address changes. Regular verification and enrichment ensures your outreach stays effective.
Q7. Are B2B contact databases GDPR compliant?
Reputable providers like Cognism, ZoomInfo, and Apollo.io comply with GDPR and CCPA. However, compliance also depends on how you use the data. Always ensure you have a legitimate basis for processing, offer opt-out mechanisms, and follow data minimization principles.
.avif)
Top 5 Apollo.io Alternatives for B2B Sales and GTM Teams
Explore the top 5 Apollo.io competitors for B2B sales and GTM teams. Compare ZoomInfo, Cognism, Lusha, Clearbit & UpLead with real pros and cons.
TL;DR
- Apollo.io is a popular all-in-one sales intelligence platform offering prospecting data, enrichment, and engagement tools.
- Despite its strengths, teams explore Apollo alternatives due to challenges with support, data accuracy, feature gaps, and pricing scalability.
- Common comparisons include Apollo vs ZoomInfo, but other strong options are Cognism, Lusha, Clearbit, and UpLead, each with unique strengths and trade-offs.
- Key factors when evaluating alternatives: data coverage and accuracy, ease of use, engagement features, pricing flexibility, and reliability.
- Beyond data tools, modern GTM teams look for AI-driven demand generation platforms like Factors.ai, which adds buyer journey insights, intent signals, and revenue-focused automation.
Apollo.io has quickly emerged as one of the most widely adopted Sales SaaS tools for outbound teams. Positioned as an end-to-end Apollo sales intelligence platform, it combines prospecting data, enrichment, and engagement into a single workspace. For many sales leaders, it feels like the all-in-one solution that simplifies workflows and boosts efficiency. Still, as with any rapidly scaling platform in the sales tools and intelligence category, experiences can vary, and some teams begin evaluating an Apollo alternative to meet their unique needs better.
Apollo.io Platform Overview and Key Offerings
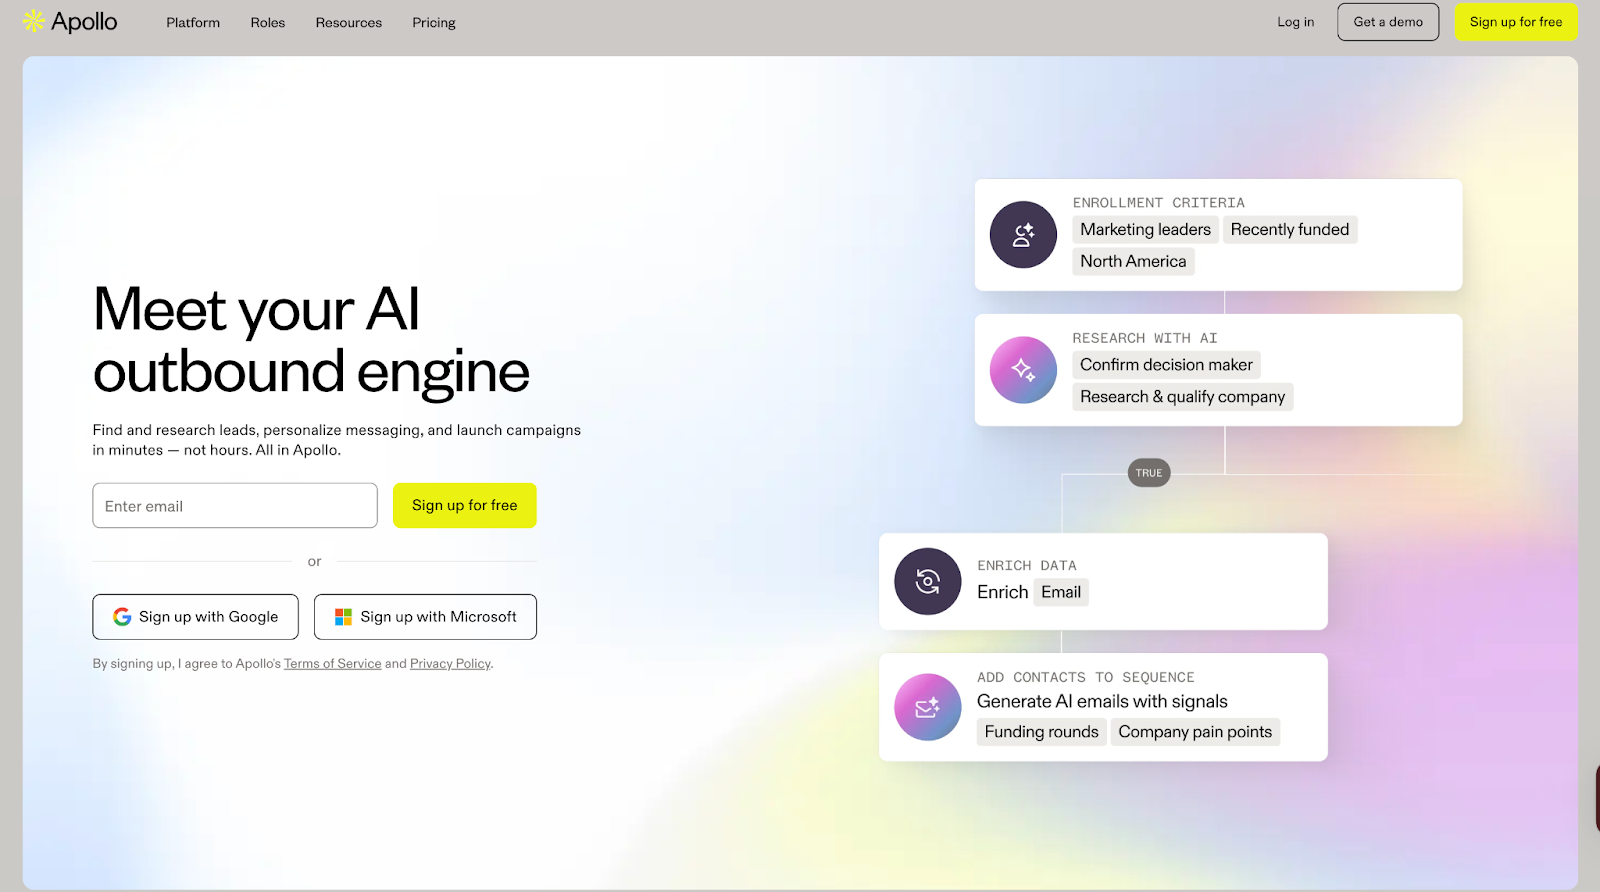
Apollo.io goes beyond being just another Apollo CRM. It offers:
- Access to a B2B database of 210M+ verified contacts
- Data enrichment to keep records accurate and up to date
- Engagement features such as email sequencing, calling, and pipeline tracking
This mix of data and outreach positions Apollo as a core player in the sales tools and intelligence landscape, providing a centralized workspace that can often replace multiple point solutions.
Why look for an Apollo.io alternative?
While Apollo offers strong value, feedback from users highlights a few recurring challenges:
1. Intent Data: Reviewers mention that intent signals don’t always deliver the precision needed for certain markets.

2. Reliability and Features: Teams have reported occasional downtime and gaps in advanced features compared to specialized competitors.
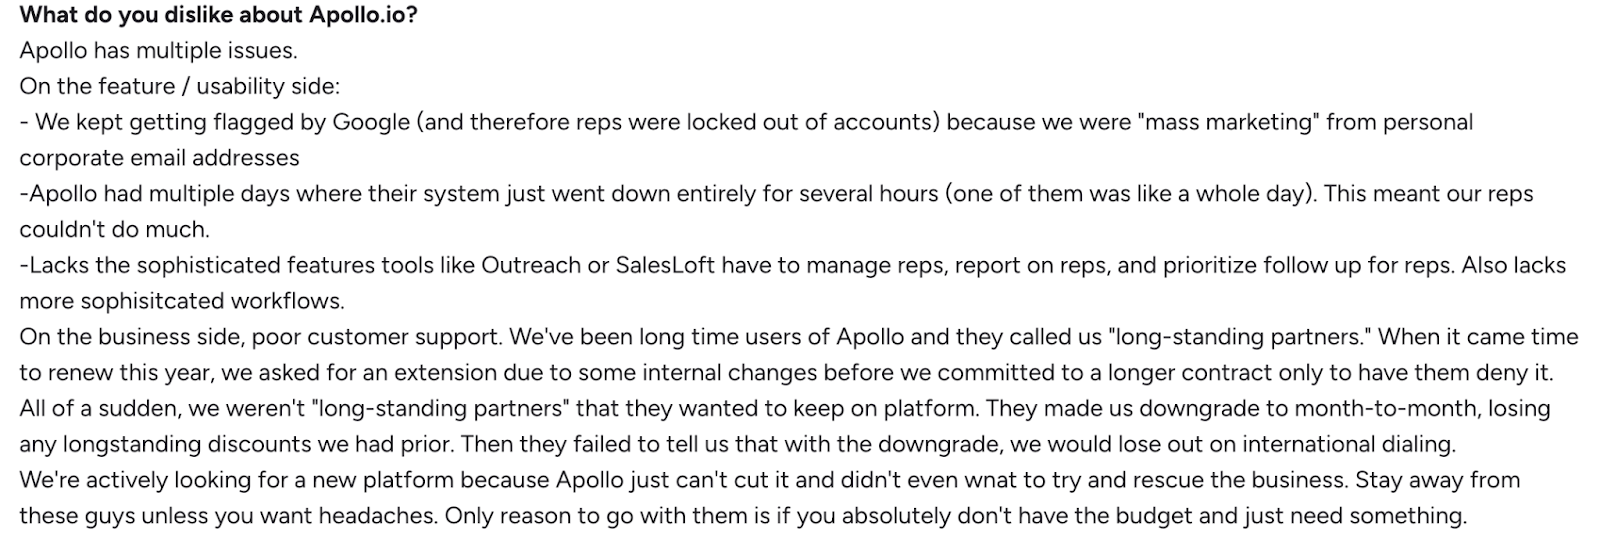
3. Data Quality and Credits: A few users point out concerns around data freshness and limitations with available credits for scaling outreach.

These points don’t diminish Apollo’s strengths but explain why some organizations evaluate other options to ensure the best fit for their workflows.
Apollo.io Pricing
Apollo.io offers a range of pricing plans designed to support different team sizes and outreach goals, from individuals just starting out to large sales organizations.
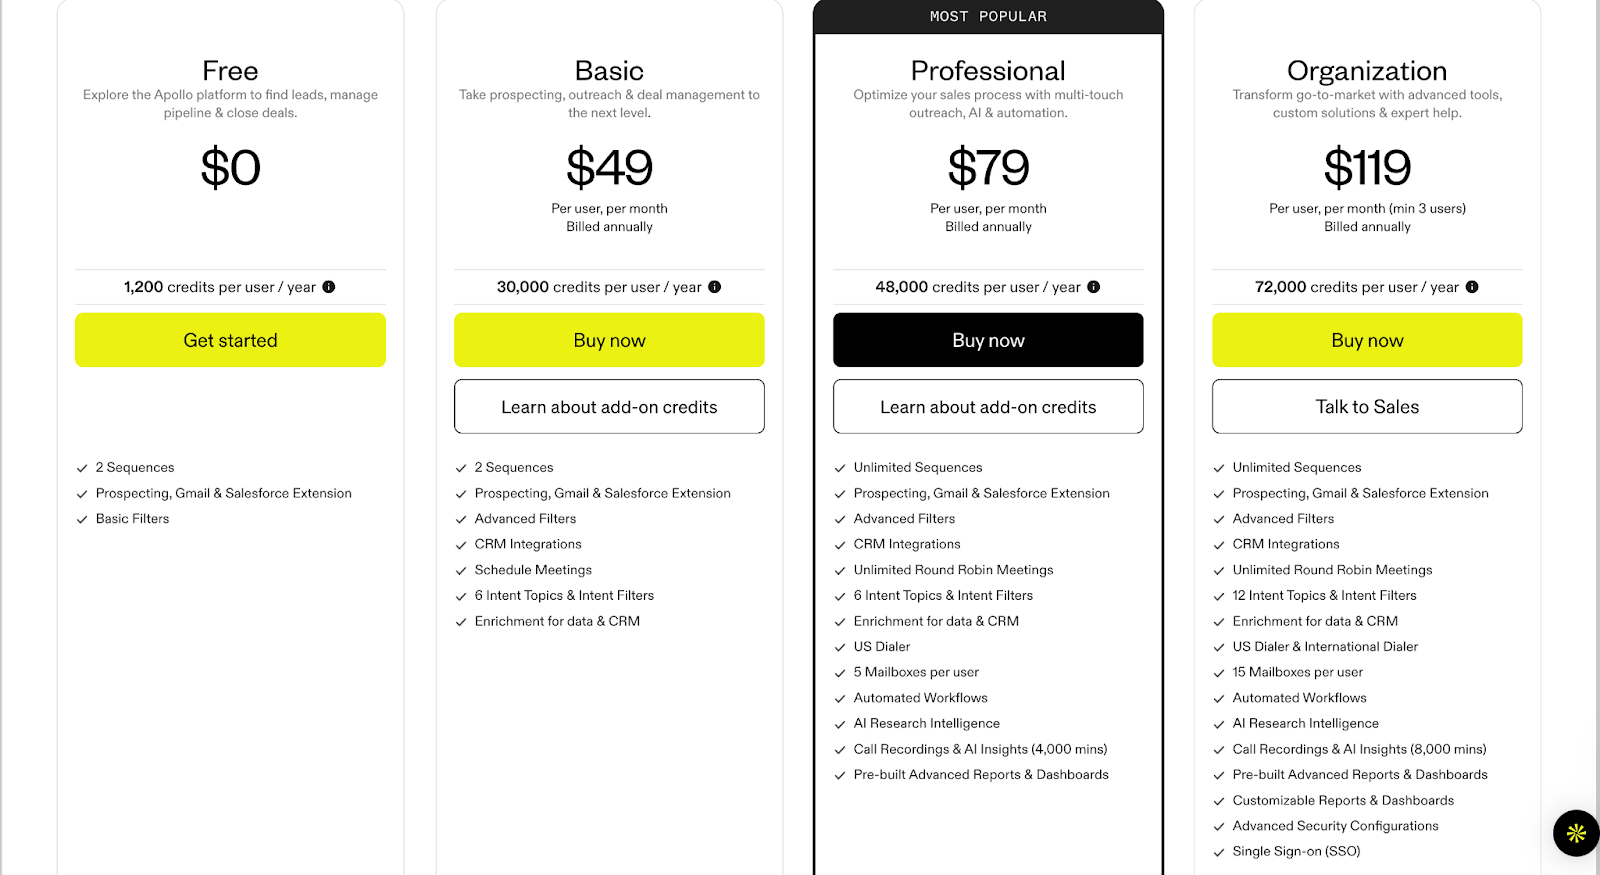
{{INLINE_BOFU}}
What to look for in an Apollo.io alternative
When exploring an Apollo alternative, it helps to step back and consider what really matters in a modern sales tools and intelligence stack. Every team’s priorities are slightly different, but based on user feedback and market comparisons, here are the factors worth evaluating:
- Data Coverage and Accuracy: A strong database is the backbone of any sales intelligence platform. Look for alternatives that not only match Apollo’s scale but also maintain freshness and reliability across regions.
- Ease of Use and Integration: Whether it’s with Salesforce, HubSpot, or your CRM, seamless integration is critical to keeping workflows smooth.
- Engagement Features: Many companies compare Apollo vs ZoomInfo and other competitors based on whether outreach tools like sequencing, calling, and automation are built in or require third-party add-ons.
- Pricing and Scalability: While Apollo pricing is competitive for smaller teams, some organizations outgrow credit limits or need more flexible renewal options. Evaluate whether alternatives provide a better fit for long-term growth.
- Support and Reliability: A responsive support team and consistent platform uptime can make a big difference, especially for fast-moving sales orgs.
The right Apollo sales intelligence alternative will depend on how well it supports your team’s workflows, scales with your outbound needs, and fits within your budget.
Now, let’s take a closer look at some of the most popular Apollo alternatives in the market today.
ZoomInfo
Among the most well-known names in the sales tools and intelligence space, ZoomInfo is often the first platform sales teams consider when evaluating an Apollo alternative. Recognized as a leader in multiple categories on G2 and Forrester, ZoomInfo provides go-to-market teams with a blend of B2B data, buyer intent signals, and AI-driven automation to help accelerate pipeline growth.
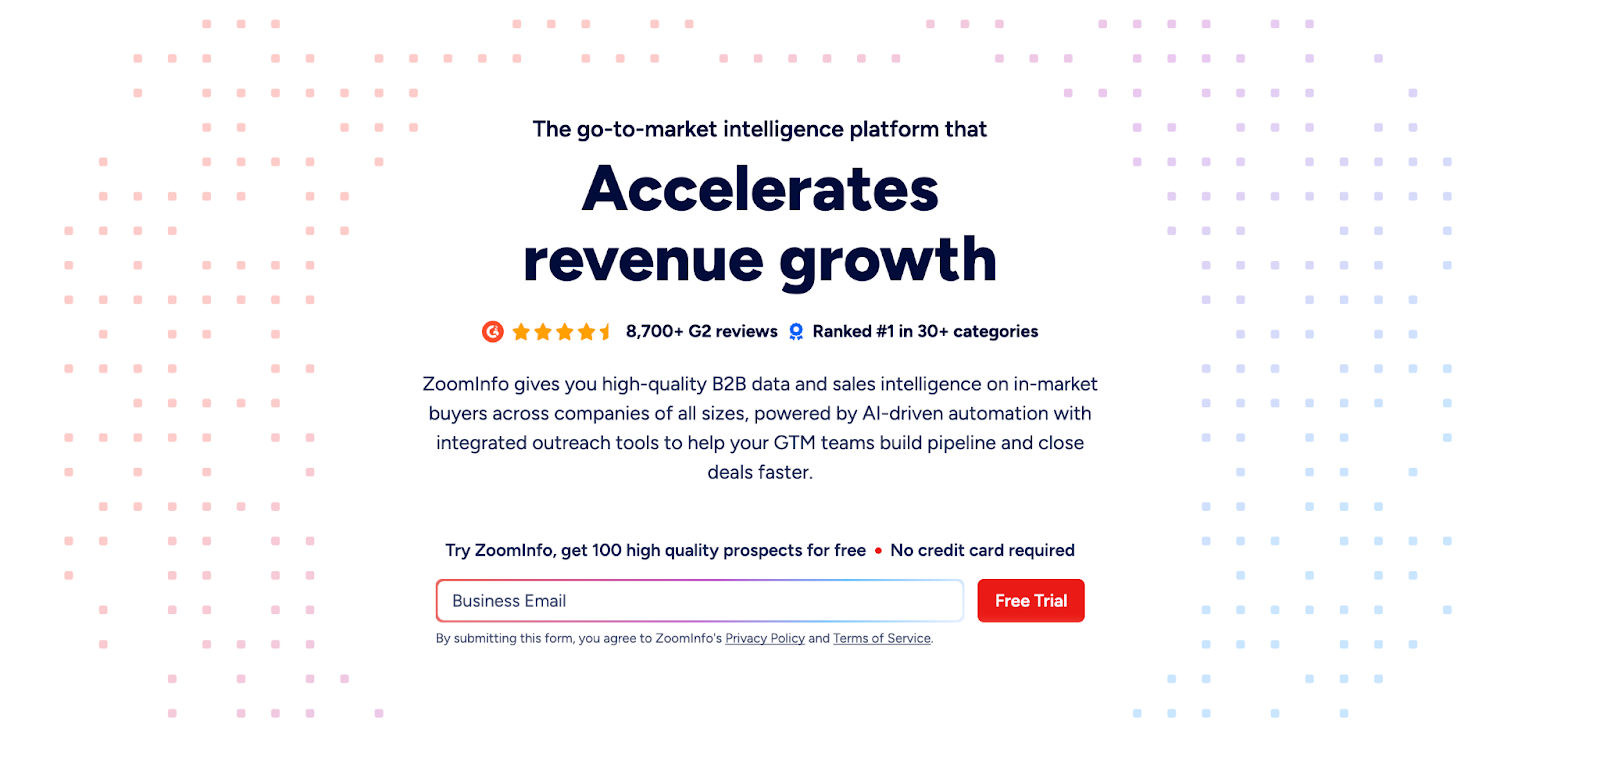
Core offerings
- Extensive B2B Database: Clean, accurate, and compliant company and contact data to expand TAM and reach decision-makers faster.
- Buyer Intent Data: Identify in-market accounts and prioritize outreach based on real-time signals.
- AI-Powered Account Intelligence: Surface insights like org changes, pain points, and usage trends to guide deal progression.
- Data Enrichment and Automation: Keep CRM and sales systems updated with fresh, enriched data while automating repetitive workflows.
- Seamless Integrations: Connects with CRMs and sales engagement tools,including Salesforce, HubSpot, Outreach, and more.
With its scale and focus on data precision, ZoomInfo is frequently compared during Apollo vs ZoomInfo evaluations, especially for teams seeking deeper market coverage and more advanced intent capabilities.
What it lacks
- Users report that contracts can feel restrictive, with tools often underperforming, frequent bugs, and accuracy levels not meeting expectations.

- Some customers faced technical issues during signup, such as forms freezing or welcome emails not being delivered.

- Many feel the platform is overpriced, particularly for smaller or early-stage companies, with alternative tools offering similar value at a lower cost.

ZoomInfo Pricing
ZoomInfo pricing is not available upfront. Plans are divided across Sales, Marketing, and Talent solutions, and businesses must request a custom quote based on their needs.
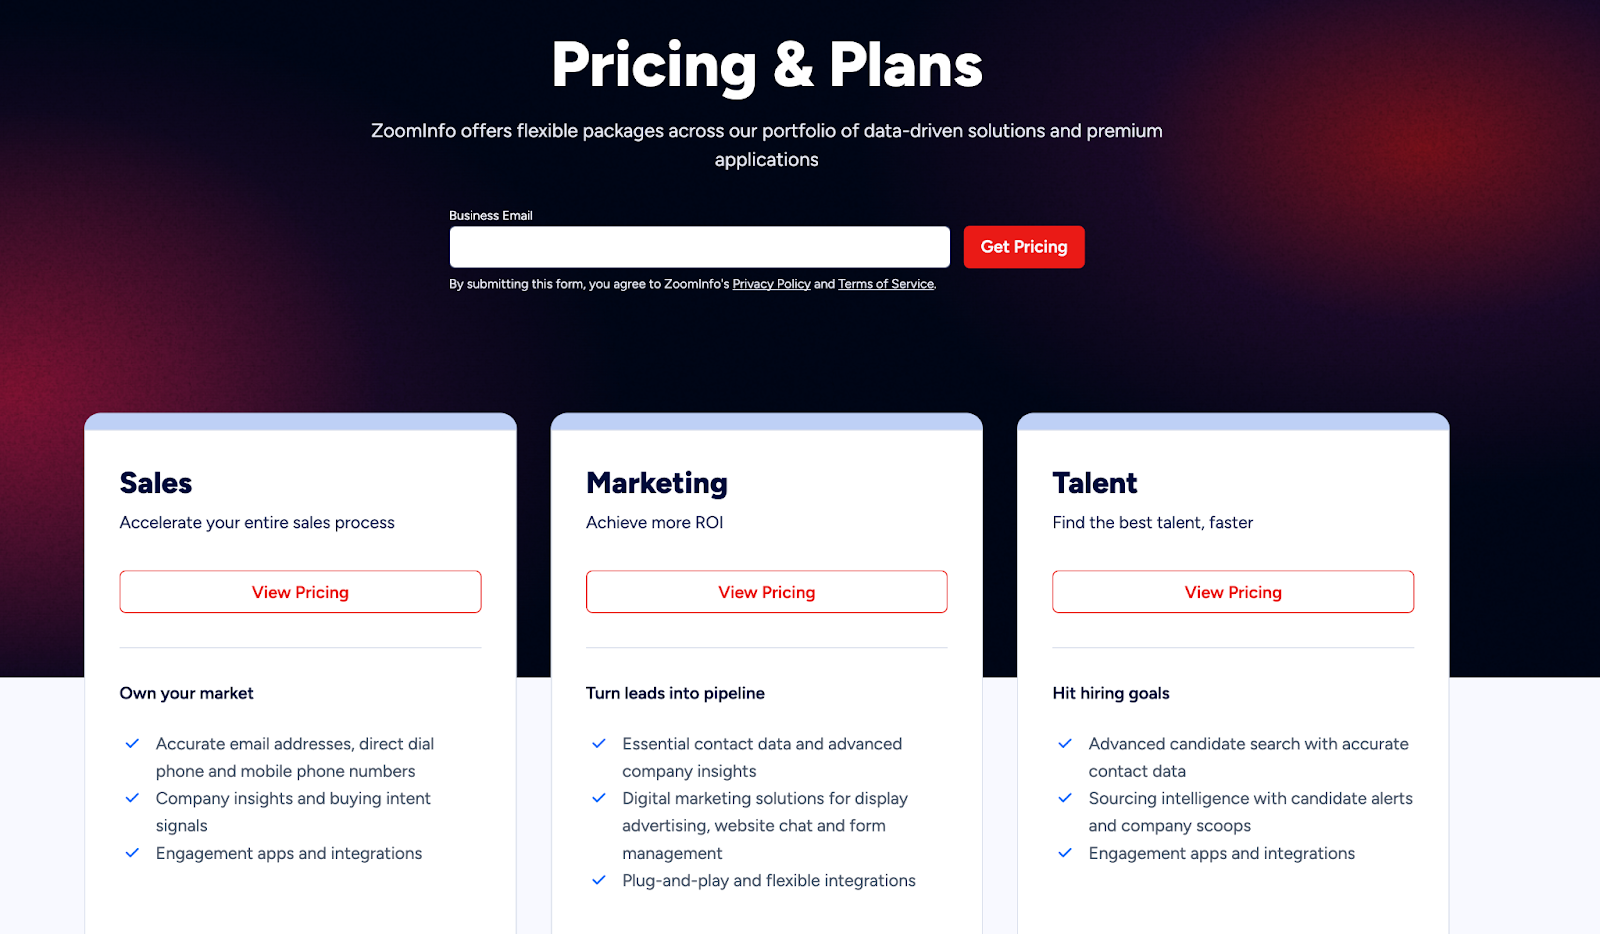
💡Also Read: ZoomInfo Alternatives - Top 5 ZoomInfo Competitors
💡Also Read: Factors vs ZoomInfo Pros and Cons: Detailed Comparison
Cognism
Another strong player in the sales intelligence category, Cognism is often considered when exploring an Apollo alternative, especially for teams focused on European markets. With its GDPR-compliant database and emphasis on accuracy, Cognism equips sales, marketing, and revenue teams with the data they need to connect confidently with decision-makers and fuel predictable pipeline growth.
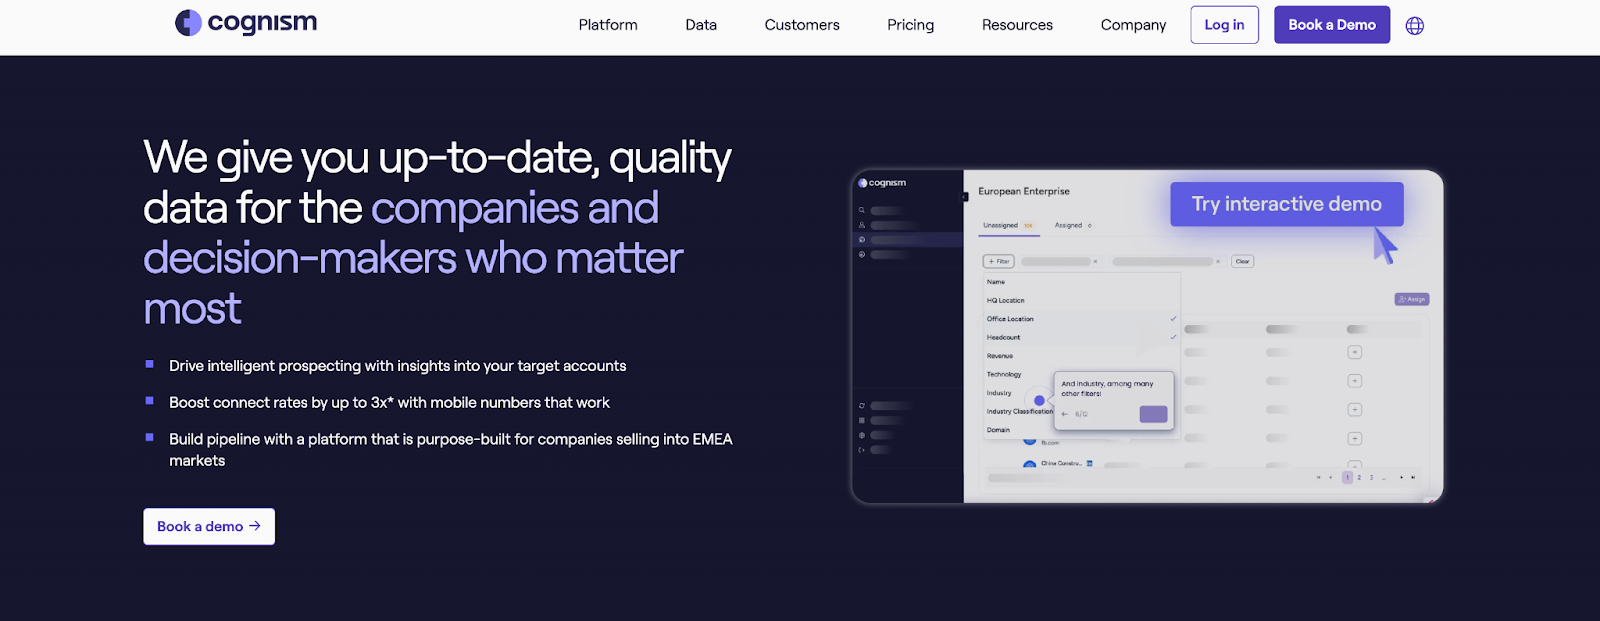
Core offerings
- European Market Coverage: Unrivalled access to millions of verified B2B contacts across the UK and EMEA, helping companies sell into complex regional markets.
- Diamond Data®: Phone-verified, human-validated mobile numbers that significantly improve connect rates for SDRs and reduce wasted time.
- Decision-Maker Intelligence: Accurate, senior-level contact data (VP and above) enriched and continuously refreshed for confident prospecting.
- Sales Companion Tool: Prospect directly from LinkedIn and corporate websites while syncing data seamlessly into CRMs like Salesforce, HubSpot, and Pipedrive.
- Data-as-a-Service and Enrichment: Keep databases clean, compliant, and actionable while aligning revenue teams with accurate information.
Trusted by over 4,000 businesses globally, Cognism positions itself as more than just a database provider, it’s a sales SaaS tool that combines compliance, data accuracy, and user-friendly integrations to help sales teams spend less time researching and more time selling.
What it lacks
- Several users highlight outdated data, with records of people who left roles years ago and very low connection rates, even with premium data.

- Customers mention concerns around business practices, such as auto-renewals without clear communication and a lack of dedicated account support.

- Some reviews express strong dissatisfaction overall, describing the platform as unreliable and not worth recommending.

Cognism Pricing
Cognism pricing is not displayed publicly. Instead, it offers two plans, Grow and Elevate, with different levels of access to demographic, firmographic, and signals data. Businesses need to book a demo to get a customized quote based on their needs.
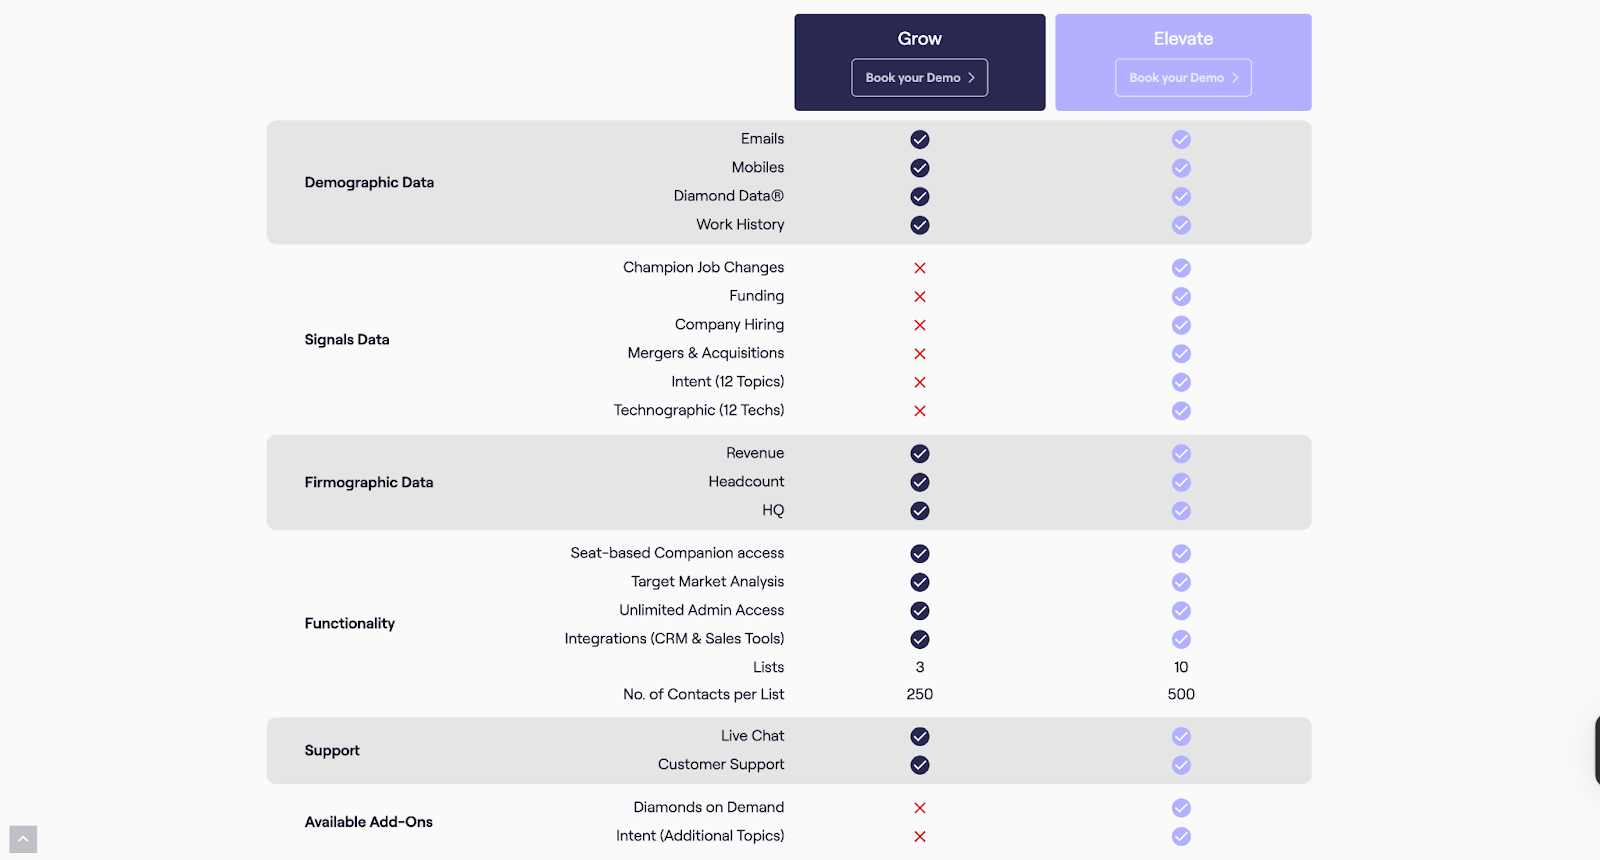
Lusha
Lusha positions itself as a lean, AI-powered sales intelligence platform built to ‘just let you sell.’ It combines prospecting, enrichment, intent data, and outreach into one streamlined ecosystem, cutting out the noise and giving sales teams verified contacts, buying signals, and instant list-building. With a focus on accuracy, compliance, and automation, Lusha helps organizations turn cold outreach into predictable pipeline growth.
Core offerings
- Verified B2B Database: Access 280M+ global contacts with high accuracy (85%+ for phone, 98% for email).
- Buyer Intelligence: Spot buying signals instantly and target prospects who are ready to engage.
- Prospecting Tools: Chrome extension, CRM sync, and automated list building to keep pipelines moving.
- Integrations and APIs: Enrich and sync directly with Salesforce, HubSpot, Outreach, Slack, and automation platforms like Zapier and n8n.
- Multi-team Utility: Sales, RevOps, Marketing, and even Recruiting teams can use Lusha for growth.
By blending automation with reliable, compliant data, Lusha ensures sales teams can focus on conversations that convert, making it a practical, lightweight alternative in the sales intelligence space.
What it lacks
- Users report outdated contact details, with phone numbers or emails linked to companies prospects haven’t worked at in years, and fewer available addresses compared to larger databases.

- The lead search feature is considered useful but lacks the depth of filters and advanced options offered by competitors.

- Some customers highlight issues with credits not being honored as promised, along with unhelpful support when raising concerns.

Lusha Pricing
Lusha offers flexible pricing plans designed to fit sales teams of every size, from individuals getting started with prospecting to large GTM organizations scaling outreach globally. Additionally, Lusha’s pricing is based on a credit system, meaning each contact reveal or data export consumes credits. Businesses with high-volume outreach requirements often explore whether competitors like Apollo or Cognism offer better scalability or bundled data credits at similar price points.
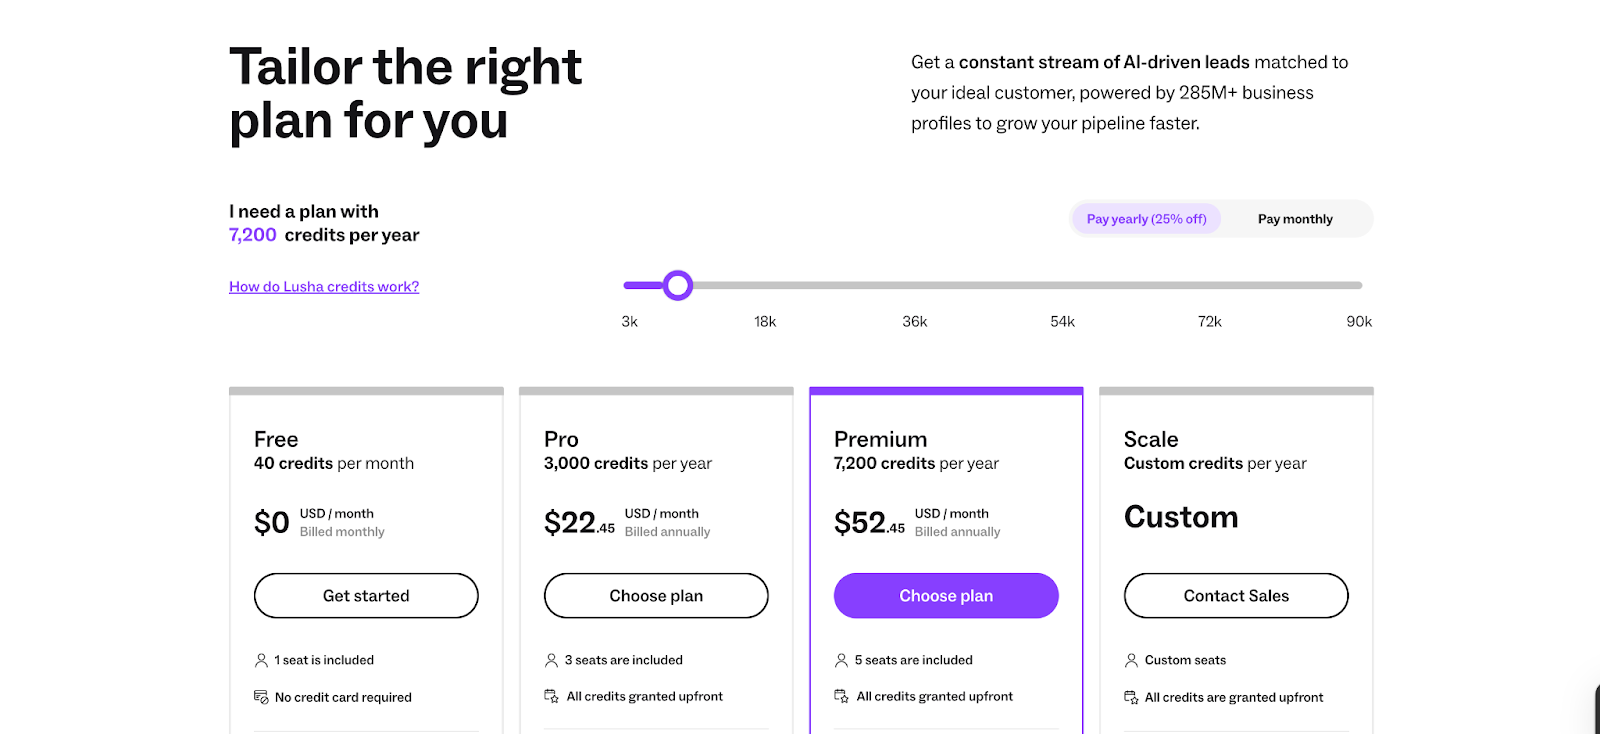
Clearbit (by HubSpot)
Clearbit, now part of HubSpot, positions itself as a data-first foundation for B2B go-to-market teams. The platform combines proprietary sources, public web data, and advanced AI/LLMs to deliver standardized, accurate, and enriched insights across leads, contacts, and accounts. By turning fragmented information into structured intelligence, Clearbit enables companies to act on data quickly and effectively.
Core offerings
- Comprehensive Data Enrichment: Provides global coverage and enriches records for leads, contacts, and accounts with precise and standardized details.
- Real-Time Lead Scoring and Routing: Instantly scores and routes inbound leads based on fit, industry, corporate hierarchy, and seniority.
- Granular Industry and Role Mapping: Leverages deep categorization (NAICS, GICS, SIC) and standardized roles/seniority to align with ideal customer profiles.
- Buyer Intent and Website Reveal: Transforms anonymous website traffic into actionable buying intent signals through advanced IP intelligence.
- Form Optimization: Uses dynamic form shortening to boost conversions by auto-enriching data from just an email address.
Clearbit strengthens sales and marketing operations with a clean, reliable data layer that reduces friction and helps GTM teams focus on the most promising opportunities.
What it lacks
- Users note recurring issues with data accuracy and duplication, which affect the overall reliability of the platform.

- Several reviews mention that the quality of enriched contact data can fall short, limiting its effectiveness for teams.

- Customers suggest that Clearbit’s contact enrichment capabilities need further refinement to deliver more consistent results.

Clearbit Pricing
Clearbit doesn’t provide standalone pricing information publicly, as it’s now integrated into HubSpot’s platform. Businesses interested in Clearbit’s data solutions might have to reach out to HubSpot sales for tailored pricing details.
UpLead
UpLead is a prospecting and sales intelligence platform built around one promise: data accuracy. With a 95%+ guarantee on verified contacts, the platform enables sales teams to generate reliable prospect lists in real-time and plug them directly into their outreach tools and CRMs. Positioned as a cost-effective alternative to larger platforms, UpLead emphasizes quality, affordability, and speed in lead generation.
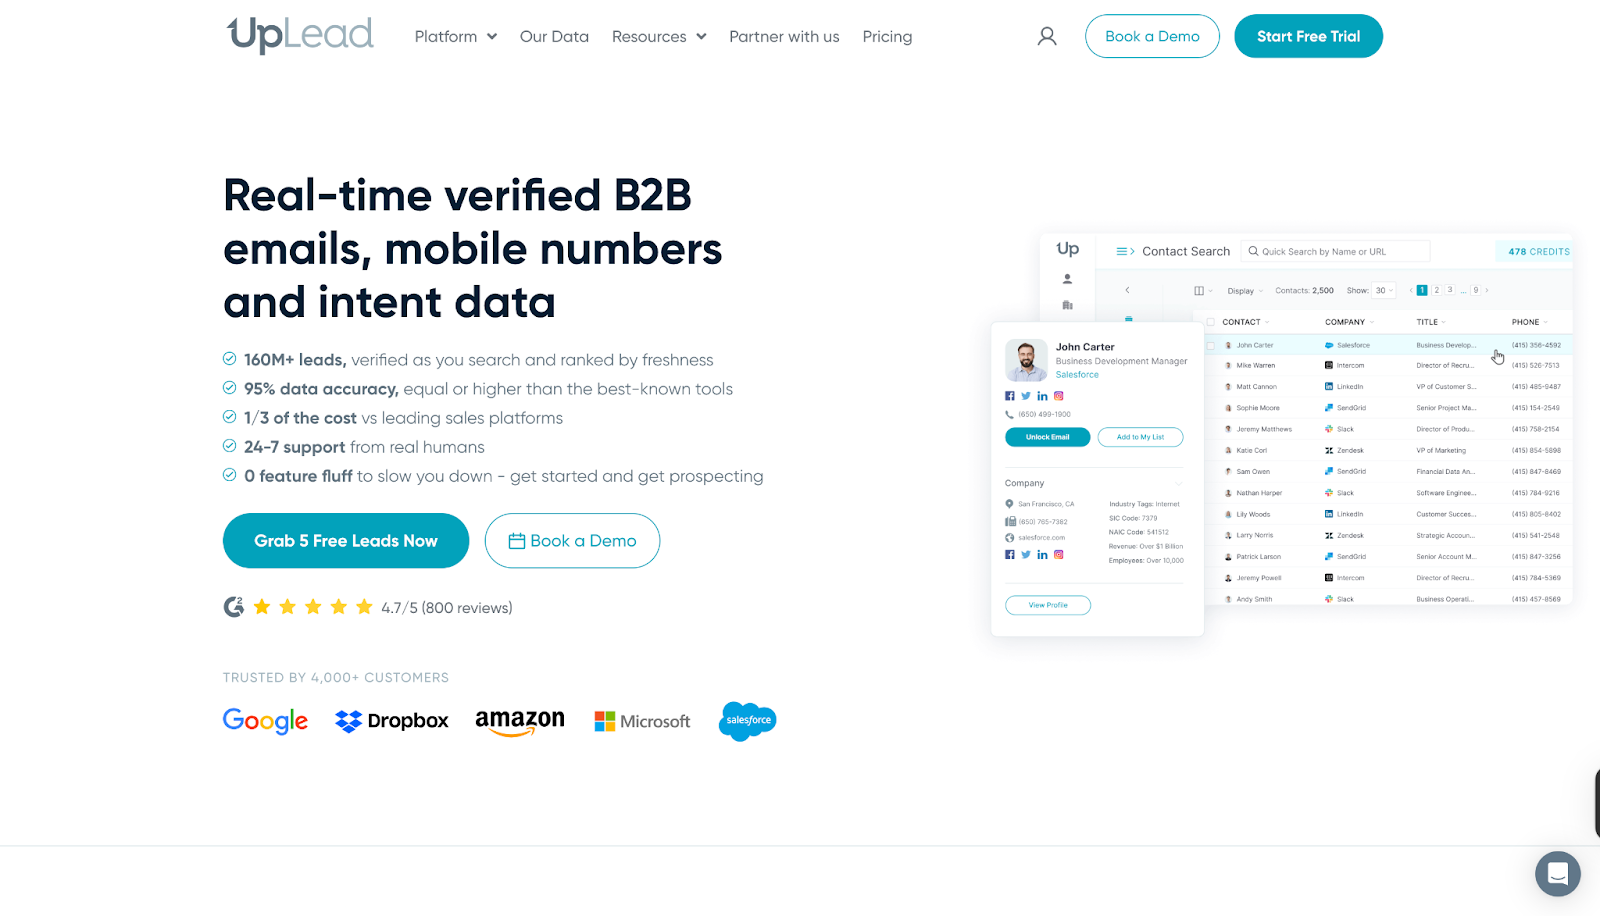
Core offerings
- Prospector Tool: Use 50+ search filters to identify leads that match your buyer profile.
- Real-Time Email Verification: Guarantees high deliverability by validating emails before export.
- Data Enrichment and Bulk Lookup: Enrich CRM records with up-to-date data or process thousands of leads at once.
- Direct Dials and Intent Data: Access mobile and direct numbers alongside buying intent signals for faster connections.
- Integrations and API: Sync data seamlessly with CRMs and scale prospecting workflows with robust API support.
By combining accuracy, affordability, and breadth of features, UpLead helps sales teams start more conversations and close deals faster without the overhead of complex sales stacks.
What it lacks
- Some users report that the database doesn’t always include the accounts or contacts they need, and customer support has not been responsive in such cases.

- Reviews mention gaps in data accuracy, with missing phone numbers and incorrect information leading to frustration for sales teams.

- Customers also highlight dissatisfaction with the credit system, stating that unused credits become inaccessible without maintaining an active paid plan.

UpLead Pricing
UpLead offers flexible pricing options built to suit everyone. Like most data-driven platforms, UpLead uses a credit-based model, meaning each contact reveal consumes a credit. Teams with large-scale prospecting needs often compare UpLead with Apollo or Lusha to evaluate which platform provides better accuracy and flexibility per credit.
Also read: 10 Best Visitor Queue Alternatives For B2B Teams
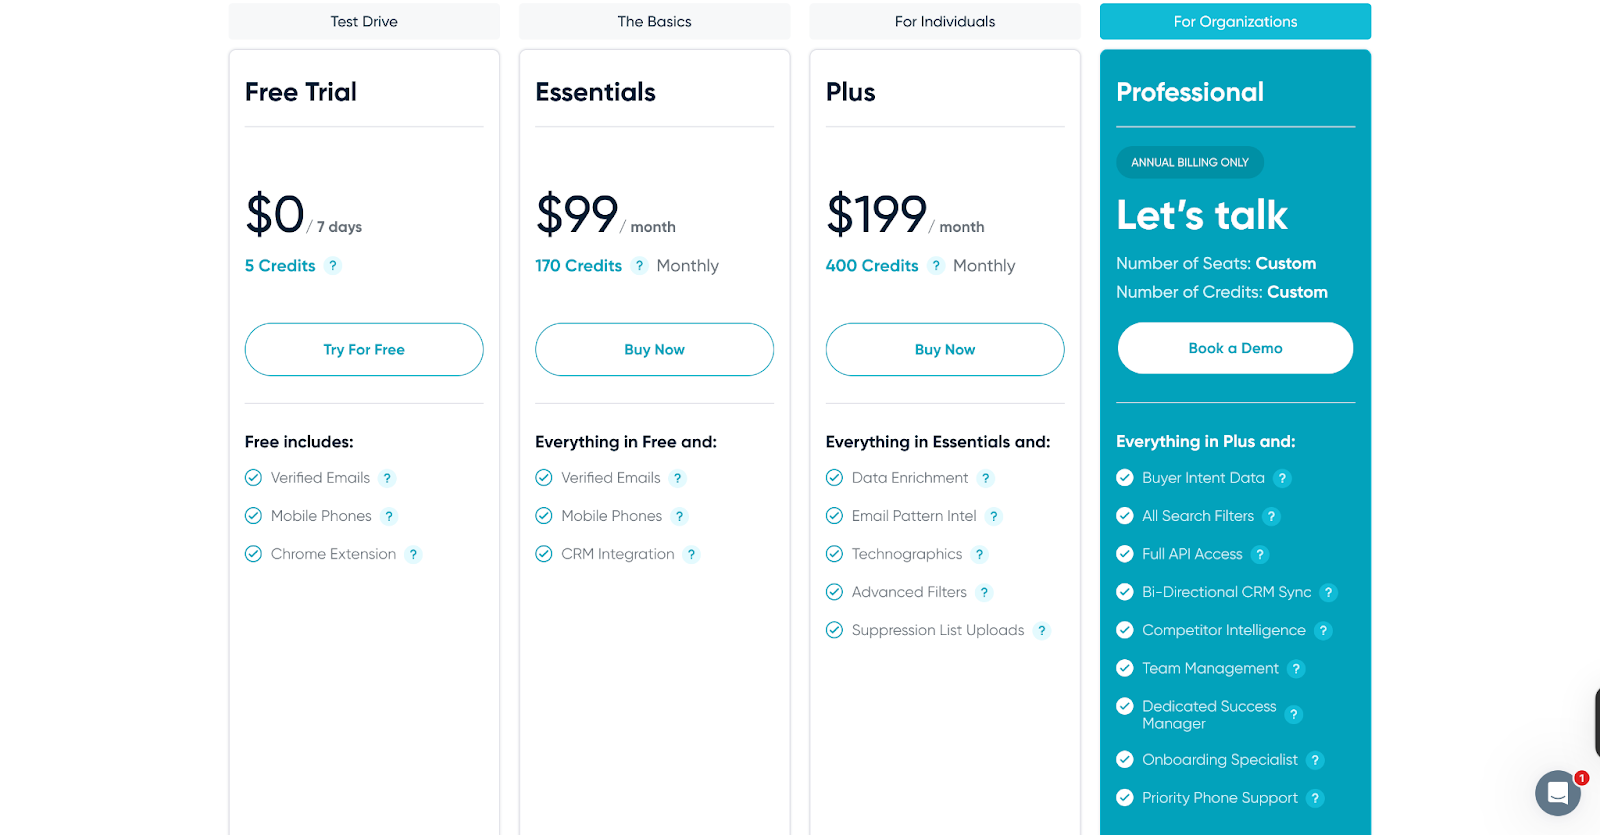
📝Important Note:
The shortcomings we’ve highlighted are drawn from a small number of user reviews and experiences. They do not represent the complete picture of any tool. In fact, many users on G2 have also praised these platforms for their strengths and value. You can explore those reviews as well. Our intent is simply to provide a balanced perspective as you evaluate your options.
Where Factors fits in
While Apollo.io and its alternatives primarily focus on data accuracy and prospecting, modern B2B teams need more than just contact lists. They need visibility into intent signals, buyer journeys, and campaign performance and that’s where Factors.ai comes in. Factors offers full-funnel ABM visibility, website identification, and account-level scoring. It connects intent signals, ad performance, and buyer journeys into one unified view, helping GTM teams prioritize the right accounts, automate follow-ups, and directly tie marketing efforts to revenue.
Factors.ai is a B2B demand generation platform that helps GTM teams identify high-intent accounts, automate campaigns, and measure what truly drives revenue.
What Factors offers:
- GTM Engineering: AI Agents that surface account research, revive closed-lost deals, and alert reps the moment buyers show intent. Factors integrates seamlessly with your existing GTM stack, Salesforce, HubSpot, Google, Meta, Bing, LinkedIn, and more, to automate sales workflows, sync audiences, and ensure your teams always act on the right signals at the right time.
- AI Alerts and Ad Syncs: Get real-time notifications on high-intent accounts, auto-sync audiences across Google and LinkedIn, and trigger personalized campaigns instantly, so no opportunity slips through the cracks.
- Milestones and Account 360: Get complete funnel visibility with analytics that map every marketing and sales touchpoint. From first click to closed deal, visualize how accounts move through the pipeline and uncover what’s truly driving conversions.
To explore the full breadth of Factors’ AI-powered GTM capabilities, Book a Demo!
In a nutshell…
Finding the right sales intelligence platform comes down to what aligns best with your GTM strategy, budget, and growth stage. Apollo remains a popular choice, but as we’ve seen, every platform, whether it’s Apollo CRM, ZoomInfo, Lusha, or others, comes with trade-offs. That’s why many modern B2B teams are turning to Sales SaaS tools like Factors.ai, which not only addresses common gaps in enrichment and intent data but also brings AI-driven automation into demand generation.
The bottom line:
Whether you’re comparing Apollo vs ZoomInfo or evaluating multiple Apollo alternatives, take the time to align the platform’s strengths with your business goals. And if you want to go beyond static data and turn intent into revenue, Factors.ai could be the smarter addition to your stack.
FAQs on Apollo Alternatives and Competitors
Q. What is Apollo pricing like?
A. Apollo offers a Free plan at $0 with 1,200 credits per user per year. It includes 2 sequences, Gmail and Salesforce extensions for prospecting, and access to basic filters. Paid tiers unlock more credits, advanced features, and higher limits.
Q. Is ZoomInfo better than Apollo?
A. It depends on your goals, Apollo vs ZoomInfo often comes down to budget, data coverage, and workflow fit. ZoomInfo is broader, while Apollo offers affordability and ease of use.
Also read: 10 Best Madison Logic Alternatives And Competitors In 2026
Q. Can small teams or startups use Apollo affordably?
A. Yes. Apollo’s Free or Basic tiers are designed with startups/smaller businesses in mind, giving access to core features. But as you scale, costs rise because usage-based limits bite
Q. Does Apollo function as a CRM?
A. Yes, Apollo CRM provides basic pipeline and contact management, though many businesses still integrate it with Salesforce, HubSpot, or other CRMs for advanced needs.
Q. Are Apollo’s sales intelligence tools enough for scaling teams?
A. Apollo’s tools work well for prospecting and outreach, but fast-growing teams often layer in other Sales SaaS tools to handle intent data, ABM, and deeper analytics.
Q. Where does Factors.ai fit in this comparison?
A. Factors.ai isn’t a direct Apollo competitor, it complements your stack by adding AI-powered demand generation, account intelligence, and GTM automation.
Also read: Top 5 6sense Alternatives and Competitors For B2B GTM Teams in 2026
Q. What are some alternatives to Apollo for prospecting?
A. Many reps suggest tools like ZoomInfo, Cognism, and UpLead depending on whether you prioritize firmographic depth or contact accuracy. Try free tiers to validate match rates before committing.
Q. Looking for an Apollo.io alternative that actually works?
A. Community feedback frequently names ZoomInfo for data quality (costly), with advice to bundle verification (e.g., NeverBounce) to control bounces.
Q. What’s the best free Apollo alternative?
A. Lusha is often cited for a generous free tier.
Q. How does Factors.ai fit with Apollo and Apollo’s competitors?
A. Factors.ai complements data tools by turning intent signals into revenue-related actions. Factors’ AI agents help you understand more about buyer journeys, run tailored ads and outreach campaigns, while guiding you on the next best action, so you generate quality pipeline, fast. Keep your data provider; add Factors to prioritize, route, retarget, and measure revenue impact.
Q. Why switch from Apollo.io? What problems are people actually facing?
A. Frequent pain points include data freshness, deliverability without warmup, and credit/pricing constraints; teams test focused tools to plug those gaps.
![Top 10 Common Room Alternatives in 2026 [Compared]](https://cdn.prod.website-files.com/6898fdb2a8e6d57199082db3/698c667808785f749c808b00_66d740b8c513e11cbc11689d_Common%2520Room%2520Alternatives.avif)
Top 10 Common Room Alternatives in 2026 [Compared]
Discover the best alternatives to Common Room for signal detection and GTM strategy, including Demandbase, Factors.ai, Enrich, and more. Compare features, pricing, and benefits.
TL;DR
Common Room is great for aggregating community signals, but it's not the only option. If you need better anonymous visitor ID, lower pricing, or tighter outbound execution, consider alternatives like Factors.ai (full-funnel GTM analytics), Apollo.io (free all-in-one), 6sense (enterprise ABM), or Koala (PLG signals). Scroll down for the full comparison table and detailed breakdowns.
Common Room is a B2B customer intelligence and signal aggregation platform that unifies data from Slack, Discord, GitHub, Twitter, and other community channels into a single dashboard. It helps GTM teams identify buying signals and engage prospects through community-driven insights.
But Common Room isn't the right fit for every team — whether it's the $625+/month price tag, limited anonymous visitor identification, or the gap between signal detection and outbound execution. In this guide, we compare 10 Common Room alternatives for 2026, with side-by-side pricing, features, and match rates to help you choose the best platform for your GTM strategy.
Quick Comparison: Common Room Alternatives at a Glance
Here's how the top Common Room alternatives stack up:
| Tool | Primary Focus | Person-Level ID | Starting Price | Best For |
|---|---|---|---|---|
| Factors.ai | GTM analytics + intent signals | Account-level | Custom pricing | Full-funnel GTM teams |
| Demandbase | ABM platform | Company-level | $50K+/yr | Enterprise ABM |
| 6sense | Revenue AI | Company-level | $50K+/yr | Enterprise intent + ABM |
| Apollo.io | B2B lead intelligence | Person-level | Free tier available | Budget all-in-one |
| Pocus | Revenue data platform | N/A | Custom pricing | Product-led growth |
| Koala | PLG signals | Person-level | Free tier / $29/mo | SaaS PLG teams |
| Warmly | Chat + visitor ID | 15-25% match | $900/mo | Real-time engagement |
| HockeyStack | Attribution analytics | Company-level | $199/mo | Marketing attribution |
| Enrich | Data enrichment | N/A | Custom pricing | CRM data quality |
| UnifyGTM | GTM alignment | N/A | Custom pricing | Cross-team alignment |
What Is Common Room?

Overview:
Common Room is a customer intelligence and community engagement platform designed to help businesses consolidate and analyze signals from various sources. Its primary goal is to provide actionable insights from community interactions, social media, and other digital touchpoints, enhancing customer understanding and engagement.
Key Features:

- Unified Dashboard:
Common Room provides a comprehensive view of customer interactions and community data through a user-friendly dashboard. This feature integrates data from multiple sources, making analyzing and acting on customer signals easier.
- Customer Segmentation:
The platform allows businesses to group customers based on various factors such as behavior, engagement levels, and sentiment. This segmentation helps tailor marketing strategies and improve customer interactions.
- Sentiment Analysis:
Utilizing AI, Common Room analyzes customer sentiment to provide insights into how customers feel about your brand or products. This feature helps understand customer perceptions and make data-driven decisions.
- Integrations:
Common Room integrates seamlessly with popular tools like Slack, GitHub, and Twitter, enabling businesses to consolidate their data and streamline operations.
Pros:
- Comprehensive Insights:
This service offers a range of insights into customer behavior and sentiment, helping businesses make informed decisions.
- Ease of Integration:
Integrates well with various tools, making it easier to incorporate into existing workflows.
- AI-Powered Analysis:
Advanced sentiment analysis provides valuable insights into customer attitudes.
Cons:
- Complexity for Small Businesses:
The platform's extensive features and capabilities may overwhelm small businesses or startups.
- Cost:
Pricing can be high, which might be a barrier for companies with limited budgets.

Pricing:
Common Room's pricing starts at $625/month (billed annually) for the Team plan. Enterprise pricing is custom and typically higher. Note that Common Room also offers a free Community tier with limited features for small communities. For comparison, alternatives like Apollo.io and Koala offer free tiers, while dedicated visitor ID tools like Leadpipe ($147/mo) and RB2B ($149/mo) come in at a fraction of the cost.

{{INLINE_CTA_A}}
Why Look for Common Room Alternatives?
Despite its strengths, Common Room may not be the perfect fit for every organization. Factors such as specific business needs, budget constraints, and the focus of your GTM strategy might necessitate exploring alternatives. Here are a few reasons why you might need an alternative:
- Specialized Needs: If your business requires more specialized functionalities or focuses on different aspects of customer engagement and signal analysis, other tools offer better alignment.
- Budget Constraints: The cost of Common Room might be prohibitive for smaller businesses or startups. Alternatives might provide similar functionalities at a lower price point.
- Feature Set: Depending on your needs, you might require features that are not available in Common Room or that are better supported by other platforms.
Exploring alternatives ensures that you find a tool that perfectly fits your business requirements and offers features that align with your GTM goals and budget.
What Real Users Say About Common Room
Based on community discussions across Reddit and G2 reviews, here's what B2B teams are saying:
What users like:
- Excellent signal aggregation from Slack, Discord, GitHub, and social channels
- Strong for developer-focused and community-led growth motions
- Useful unified dashboard for cross-channel insights
Common frustrations:
- "Signals don't close deals. SDRs close deals." — Many teams find Common Room gives them the 'who' but not the 'what to do next'
- Limited anonymous website visitor identification compared to dedicated tools
- At $625+/month, smaller teams find better value in tools like Apollo.io (free tier) or RB2B ($149/mo)
- DIY stacks with Clay + Apollo + Instantly can be more flexible for specific workflows
Most-mentioned alternatives in communities: Clay (for flexible signal workflows), UserGems (job change tracking), Apollo.io (budget all-in-one), and Pocus (PLG signals).
Things to Keep in Mind While Choosing a Common Room Alternative
When evaluating alternatives to Common Room, consider the following factors to ensure you select the best tool for your needs:
- Signal Collection Capabilities
Assess the platform's ability to capture and analyze the specific types of signals relevant to your business. This includes customer interactions, intent data, and engagement metrics.
- GTM Alignment
Ensure the tool aligns well with your GTM strategy and provides features that support your sales, marketing, and customer success efforts.
- Ease of Use
The platform should be user-friendly and integrate seamlessly with your existing tools and processes. A steep learning curve can hinder adoption and productivity.
Also read: ZoomInfo Pricing in 2026: Plans, Costs, Alternatives & Overview
- Scalability
Choose a solution that can grow with your business. The platform should be flexible enough to accommodate increasing data volumes and evolving needs.
- Pricing
Consider the pricing structure to ensure it fits within your budget. Look for tools that meet your feature requirements while offering good value for money.
{{INLINE_CTA_A}}
Common Room Alternatives for Enterprise Teams
Enterprise teams managing large user communities have specific requirements that Common Room may not fully address — including advanced role-based access, SOC 2 compliance, dedicated support, and the ability to handle millions of signals at scale.
For enterprise-grade alternatives, consider:
- 6sense — Purpose-built for enterprise ABM with predictive analytics and orchestration across channels.
- Demandbase — Full-suite ABM with advertising, personalization, and intent data for large GTM teams.
- Factors.ai — Scalable GTM analytics with account deanonymization, G2 intent data, and LinkedIn AdPilot for enterprise marketing teams.
These platforms offer the depth of integrations, data volume handling, and security certifications that enterprise organizations require.
Top 10 Common Room Alternatives in 2026
1. Demandbase

Overview:
Demandbase is an account-based marketing (ABM) platform designed to help businesses target high-value accounts and optimize their marketing efforts. It focuses on capturing intent data and signals to enhance marketing and sales strategies.
Key Feature
- ABM Platform: Specializes in account-based marketing, allowing businesses to tailor their marketing efforts to specific high-value accounts.
- Intent Data: Collects and analyzes signals to identify accounts showing buying intent, helping prioritize sales efforts.
- Personalized Marketing: Enables highly personalized marketing campaigns based on account insights and intent data.
- Sales Intelligence: Provides actionable insights to sales teams, enhancing their ability to engage with potential customers effectively.
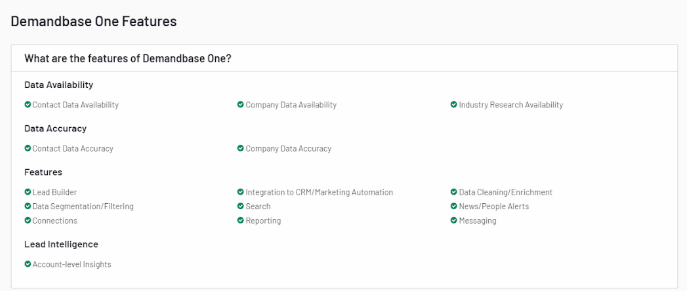
Pros:
- Focused ABM Capabilities: Ideal for businesses looking to implement account-based marketing strategies.
- Strong Intent Data Analysis: Helps identify and target high-value accounts based on intent signals.
- Integration with CRM Tools: Seamlessly integrates with CRM and marketing automation platforms, streamlining operations.
Cons:
- Primarily B2B Focus: Best suited for B2B businesses, with less relevance for B2C companies.
- High Learning Curve: The platform's advanced features may require time to master, particularly for users new to ABM.

Pricing:
Demandbase offers custom pricing based on business needs and scale. It typically caters to enterprise-level budgets.
2. 6sense
Overview:
6sense is an AI-powered revenue intelligence platform that uses intent data, predictive analytics, and account identification to help B2B teams prioritize high-value accounts. It's one of the most frequently cited Common Room alternatives for enterprise ABM.
Key Features:
- Intent Data Engine: Captures buying signals across the web to identify accounts in-market for your solution.
- Predictive Analytics: AI models predict which accounts are most likely to convert, enabling prioritized outreach.
- Account Identification: Deanonymizes website visitors at the company level using proprietary data.
- Orchestration: Coordinates multi-channel campaigns across ads, email, and sales outreach.
Pros:
- Industry-leading intent data and predictive scoring
- Deep CRM and MAP integrations
- Strong for enterprise-scale ABM strategies
Cons:
- Expensive — typically $50K+/year
- Complex implementation requiring dedicated resources
- Overkill for SMBs or early-stage companies
Pricing:
6sense offers custom enterprise pricing, typically starting at $50,000+/year depending on features and account volume.
3. Factors.ai

Overview:
Factors is a GTM analytics platform that provides deep insights into customer journeys and marketing performance. It analyzes marketing data and signals to optimize campaigns and drive growth.
Key Features:

- Customer Journey Mapping: Visualizes the entire customer journey across various touchpoints, helping understand customer interactions and behaviors.
- Advanced Analytics: Offers in-depth analysis of marketing performance, enabling data-driven decision-making.
- Signal Detection: Identifies key signals influencing customer behavior, providing actionable insights for marketing strategies.
- AdPilot: Double down on your LinkedIn Ads ROI with Factors' LinkedIn AdPilot, a platform that offers capabilities such as campaign automation, build audience lists based on intent,view-through attribution, smart reach and Factors' conversions API integration.
- G2 Intent: Factors integrates G2 intent data to help businesses identify which accounts are actively researching their product category. This feature enables users to prioritize high-intent accounts, allowing for more targeted marketing and sales efforts, ultimately increasing the likelihood of conversion.
- Account Deanonymyzation: Factors offers an account deanonymization feature, which allows companies to identify and gain insights into anonymous website visitors. This includes gathering firmographic details such as company name, industry, and size, empowering businesses to tailor their outreach and optimize their marketing strategies.
- Custom Workflows: Factors provides customizable workflow automation, enabling marketing and sales teams to streamline processes across CRM systems and campaign management platforms. These workflows can be tailored to meet specific business needs, improving operational efficiency and ensuring alignment across go-to-market teams.
Also Read: Set Up Sales Automation Workflows Using Factors
Pros:
- Comprehensive Analytics: Provides detailed insights into marketing performance and customer behavior.
- AI-Driven Optimization: Automates campaign adjustments for improved results.
- User-Friendly Interface: Designed to be intuitive, making it accessible for users with varying levels of expertise.
Cons
- Learning Curve: It may require some time to fully understand and utilize all features.
- Cost: Higher pricing may be a consideration for smaller businesses or startups.

Pricing:
Factors offers customized pricing based on your business's specific needs and scale.
{{INLINE_CTA_A}}
Also read: 10 Best Visitor Queue Alternatives For B2B Teams
4. Apollo.io
Overview:
Apollo.io is an all-in-one B2B sales intelligence and engagement platform with a database of 270M+ contacts. It's a popular Common Room alternative for teams that want lead data, outreach automation, and engagement tracking in a single tool — at a fraction of the cost.
Key Features:
- Contact Database: Access to 270M+ contacts with verified emails and phone numbers.
- Intent Signals: Tracks buyer intent data to surface accounts actively researching your category.
- Sequences: Built-in email and call sequencing for automated outreach.
- Enrichment: Enriches CRM records with firmographic and technographic data.
Pros:
- Generous free tier with core features
- Easier admin and usability than Common Room (per G2 reviews)
- All-in-one: data + outreach + analytics
Cons:
- Less focus on community signals compared to Common Room
- Data accuracy can vary by region
- Email deliverability challenges at scale
Pricing:
Apollo.io offers a free tier with limited credits. Paid plans start at $49/user/month, making it one of the most affordable options.
5. Pocus
Overview:
Pocus is a revenue data platform purpose-built for product-led growth (PLG) companies. While Common Room focuses on community signals, Pocus prioritizes product usage data and buying signals to help sales teams identify and act on the highest-intent users.
Key Features:
- Product Usage Signals: Surfaces users showing high engagement patterns that indicate buying intent.
- Playbook Builder: Create automated workflows that route signals to the right reps.
- CRM Integration: Syncs insights directly into Salesforce and HubSpot.
- AI Scoring: Prioritizes accounts and users based on propensity to convert.
Pros:
- Purpose-built for PLG — strongest product signal analysis
- Easier to set up than Common Room (per G2)
- Strong scoring and prioritization features
Cons:
- Less useful for sales-led or outbound-heavy teams
- Pricing can be higher than Common Room
- Narrower signal sources (product-focused)
Pricing:
Pocus offers custom pricing based on usage and team size. Generally positioned at mid-market to enterprise price points.
6. Enrich

Overview:
Enrich is a customer data platform that enhances CRM systems with enriched customer profiles. It provides valuable customer signals and data to improve sales and marketing strategies.
Key Features:
- Data Enrichment: Adds valuable context to existing customer data, providing a more comprehensive view of your customers.
- Signal Collection: Captures and analyzes key customer signals to inform sales and marketing efforts.
- CRM Integration: Seamlessly integrates with popular CRM platforms, enhancing your existing systems with enriched data.
- Custom Segmentation: Allows for detailed segmentation based on enriched customer profiles.
Pros:
- Enhanced CRM Data: Improves the quality and depth of customer data within your CRM system.
- Effective Signal Analysis: Provides valuable insights into customer behavior and engagement.
- Easy Integration: Integrates smoothly with existing CRM systems, minimizing disruption.
Cons:
- Limited Scope: Focuses primarily on data enrichment, with less emphasis on broader marketing or GTM features.
- Best for CRM Users: Most effective for businesses with established CRM system.
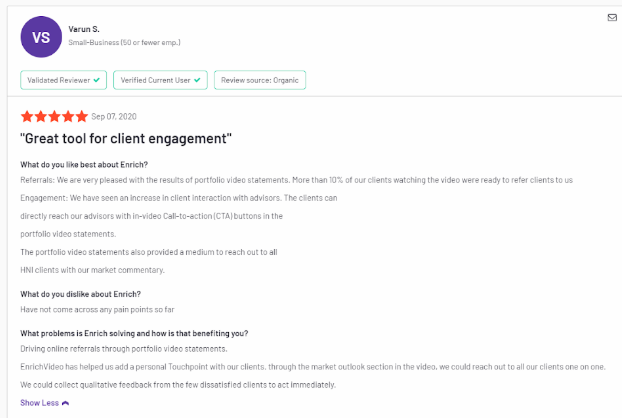
Pricing:
Enrich offers flexible pricing plans based on usage and features. Details are available upon request.
7. Koala

Overview:
Koala is a customer engagement platform that focuses on gathering customer feedback and signals to improve product and service offerings. It's particularly useful for SaaS companies looking to enhance customer experience.
Key Features
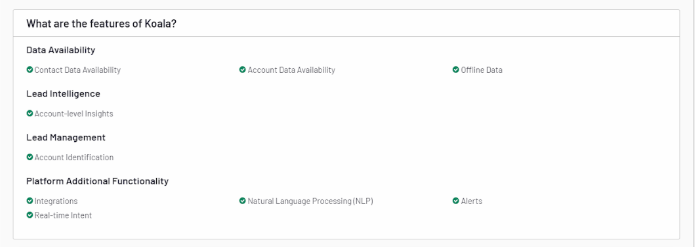
- Feedback Collection: Gathers customer feedback through various channels, including surveys and direct interactions.
- Signal Analysis: Analyzes feedback signals to identify trends, issues, and opportunities for improvement.
- Customer Segmentation: Segments customers based on feedback and behavior to tailor engagement strategies.
- Integration: Integrates with tools like Slack, Intercom, and Zendesk to streamline feedback management.
Pros:
- Focus on Feedback: Excellent for gathering and analyzing customer feedback to improve products and services.
- Integration with Customer Service Tools: Enhances feedback management and customer interactions.
- User-Friendly Interface: Easy to use, even for teams without extensive technical expertise.
Cons:
- Limited to Feedback: Primarily focused on feedback and engagement, with less emphasis on broader marketing or sales features.
- SaaS Focus: Best suited for SaaS companies, with less relevance for other industries.

Pricing:
Koala offers a free tier with basic features, with paid plans starting at $29/month for additional features and higher usage limits.
8. Warmly

Overview:
Warmly is a platform that enhances virtual meetings and customer interactions by providing valuable context and insights. It helps businesses engage more effectively during virtual interactions.
Key Features:
- Meeting Context: Provides detailed information and context about meeting participants, improving the quality of interactions.
- Signal Detection: Analyzes signals from virtual meetings to identify engagement levels and areas for improvement.
- Integration: Works with popular video conferencing tools like Zoom and Microsoft Teams.
- Personalization: Allows for personalized engagement based on participant data and insights.
Pros:
- Enhanced Virtual Interactions: Improves the quality of virtual meetings through detailed participant insights.
- Integration with Video Tools: Seamlessly integrates with major video conferencing platforms.
- User-Friendly: Easy to use and navigate, even for non-technical users.
Cons:
- Limited to Virtual Meetings: Focuses primarily on virtual meeting interactions, with less emphasis on broader marketing or sales features.
- Newer Tool: May have fewer features compared to more established platforms.
Pricing:
Warmly offers a range of pricing plans starting from $10/month per user, with additional features available in higher-tier plans.
{{INLINE_CTA_A}}
9. UnifyGTM

Overview:
UnifyGTM is a GTM platform designed to help businesses streamline their go-to-market strategies through data-driven insights and integrations. It aligns sales, marketing, and product efforts to drive growth.
Key Features:
- GTM Strategy Alignment: Provides tools to align marketing, sales, and product teams with your GTM strategy.
- Data Integration: Integrates with various data sources to provide a unified view of your GTM efforts.
- Performance Tracking: Tracks the performance of your GTM initiatives and provides actionable insights.
- Customizable Dashboards: Customizable dashboards are offered to monitor key metrics and KPIs.
Pros:
- Comprehensive GTM Tools: Provides tools for aligning and optimizing GTM strategies.
- Integration with Data Sources: Offers robust data integration capabilities.
- Customizable Reporting: Allows for detailed reporting and performance tracking.
Cons:
- Complex Setup: Initial setup and configuration may require a learning period.
- Cost: Pricing may be on the higher side for smaller businesses.

Pricing:
UnifyGTM offers custom pricing based on business needs and scale, with details available upon request.
10. HockeyStack

Overview:
HockeyStack is an analytics and attribution platform designed to help businesses understand the impact of their marketing efforts and optimize their strategies. It focuses on collecting and analyzing signals to improve marketing ROI.
Also read: Top 5 6sense Alternatives and Competitors For B2B GTM Teams in 2026
Key Features:
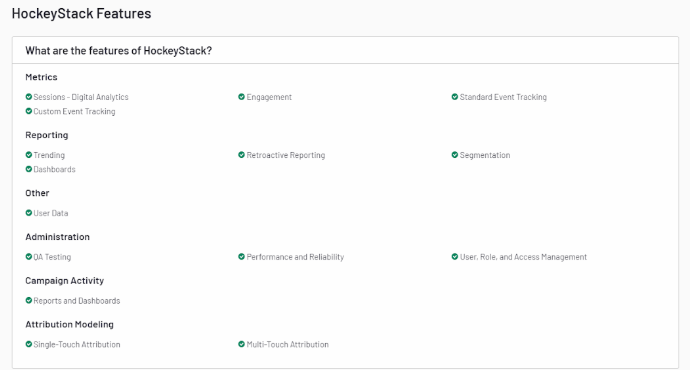
- Marketing Attribution: Provides insights into how different marketing channels contribute to conversions and sales.
- Signal Collection: Collects and analyzes signals from various marketing activities to improve strategy.
- Custom Reports: Allows to create custom reports and dashboards to track performance.
- Integration: Integrates with popular marketing and CRM tools to consolidate data.
Pros:
- Strong Attribution Capabilities: Helps understand the impact of marketing efforts across channels.
- Detailed Analytics: Provides in-depth analysis and reporting on marketing performance.
- Integration with Tools: Works well with existing marketing and CRM systems.
Cons:
- Niche Focus: Primarily focused on marketing attribution, with less emphasis on broader customer engagement features.
- Learning Curve: May require some time to understand and utilize the platform fully.

Pricing:
HockeyStack offers a tiered pricing model. Basic features start at $199/month, with higher tiers available for more advanced functionalities.
Here's Why Factors.ai is Your Best Option
Factors stands out as a top choice for businesses seeking a comprehensive GTM solution among the alternatives. Its advanced analytics and AI-driven features make it well-suited for optimizing marketing strategies and improving customer engagement.
Here's what Factors has in store for you:
- Customer Journey Mapping: Provides a clear view of customer interactions and behaviors, helping businesses tailor their marketing efforts.
- Signal Detection: Identifies key signals influencing customer decisions, enabling targeted marketing strategies.
- AdPilot: Automates campaign optimization, ensuring your marketing messages reach the right audience effectively.
Factors's blend of detailed analytics, signal detection, and AI-driven optimization makes it a powerful tool for businesses to enhance their GTM strategy and drive growth.
{{INLINE_CTA_A}}
Frequently Asked Questions on Common Room Alternatives
Q1. What is Common Room used for?
Common Room is a B2B customer intelligence platform that aggregates signals from community channels (Slack, Discord, GitHub, Twitter), product usage, and website visits into a unified dashboard. It helps GTM teams identify high-intent accounts and engage prospects through community-driven insights.
Also read: Factors.ai vs Clearbit (Breeze Intelligence): which is the better GTM platform?
Q2. Is Common Room worth the price?
At $625+/month (billed annually), Common Room delivers strong value for teams with active developer communities and community-led growth motions. However, if your primary need is anonymous visitor identification or outbound execution, alternatives like Leadpipe ($147/mo), Apollo.io (free tier), or Factors.ai may offer better ROI.
Q3. What is the best free alternative to Common Room?
Apollo.io offers the most feature-rich free tier among Common Room alternatives, including contact data, email sequencing, and basic intent signals. Koala also offers a free plan with product-led growth signal tracking.
Q4. How does Common Room compare to 6sense?
Common Room focuses on community signals and social engagement, while 6sense is an enterprise ABM platform built around predictive intent data. 6sense is better for large-scale account targeting ($50K+/yr), whereas Common Room is more suited for community-driven GTM ($625+/mo).
Q5. Can Common Room identify anonymous website visitors?
Common Room provides some level of account-level website visitor identification, but its match rates are generally lower than dedicated visitor identification tools like Leadpipe (30-40% match rate) or RB2B (5-20% match rate). If visitor ID is your primary use case, consider a specialized tool.
Q6. What are the best Common Room alternatives for enterprise teams?
For enterprise-grade alternatives, 6sense, Demandbase, and Factors.ai are the top choices. They offer advanced intent data, predictive analytics, account deanonymization, and the security certifications (SOC 2, GDPR) that enterprise teams require.
The Bottom Line
Selecting the right tool for signal collection and GTM strategy is crucial for achieving business success. While Common Room offers robust features, exploring alternatives like Demandbase, Factors, Enrich, Koala, Warmly, UnifyGTM, and HockeyStack can provide more tailored solutions. Each tool offers unique capabilities that align with your business needs and goals.
Factors.ai, in particular, offers a compelling combination of advanced analytics, signal detection, and AI-driven insights, making it a standout choice for optimizing your GTM strategy. Evaluate your specific requirements and budget to choose the tool that best supports your business objectives and drives growth.

Best Marketing Attribution Tools in 2026 and Who They’re For
Compare the best marketing attribution tools for B2B, paid media, ecommerce, and revenue attribution. See what each does well and where it falls short.

Quick Summary
- Factors.ai makes the most sense for B2B teams that want marketing attribution connected to account intelligence, LinkedIn measurement, intent, and activation.
- HockeyStack and Dreamdata are stronger candidates when attribution itself is the main requirement. Both give teams more room to analyze long B2B journeys and customize how performance is reported.
- Adobe Marketo Measure fits larger Salesforce and Marketo environments where online and offline touches need to be tied back to opportunities.
- HubSpot is a good place to start when most of your marketing and CRM data already lives there. A specialist platform becomes more useful once the native reports stop answering the questions you care about.
- Ruler Analytics and Cometly solve narrower attribution problems well, while Rockerbox, Triple Whale, and Northbeam are better suited to consumer and ecommerce measurement.
Marketing attribution tools can look similar on paper, but the differences become obvious once you ask what you actually need to measure. A team comparing first-touch and time-decay models needs something different from one trying to connect LinkedIn activity to pipeline or decide where media spend should move.
I’ve compared 12 tools around those real buying questions, using product research and the patterns we saw across prospect evaluations.
How I evaluated these marketing attribution tools
I looked at current product capabilities, pricing, documentation, and customer feedback. I also used Factors customer and prospect calls to understand what buyers actually care about once they start evaluating marketing attribution software.
The research covered 267 attribution-related calls, along with separate searches for HockeyStack and Dreamdata. We reviewed the strongest matches and pulled full transcripts when more context was needed.
Quick comparison of the top Marketing Attribution Tools
Detailed breakdown of the top Marketing Attribution Tools
1. Factors.ai
Factors.ai combines B2B attribution with account intelligence, website visitor identification, intent signals, account scoring, and advertising activation.
The attribution model is account-centric. Website visits, ad engagement, CRM activity, intent, and opportunity data can be connected to the same company instead of being analyzed as separate leads or sessions.
This is particularly useful for B2B programs where marketing wants to understand influence before and after an opportunity enters the CRM.
What Factors.ai does well
- Account and opportunity-level attribution: Marketing can connect campaigns and touchpoints to pipeline while keeping the underlying account journey visible.
- LinkedIn measurement: Factors.ai can connect LinkedIn activity to accounts and opportunities, including view-through engagement missed by click-only reporting. LinkedIn attribution was the most common specific measurement requirement in the calls we reviewed.
- Attribution does not stop at reporting: Influenced accounts can be turned into audiences, used for sales alerts, or investigated further through Scout.
- More context around the account: Intent data, website activity, advertising, and CRM signals can be viewed alongside attribution instead of living in separate systems.
Where Factors.ai falls short
- Deep attribution modeling is not its strongest use case: Teams that want extensive control over models such as linear attribution, time-decay attribution, or highly customized attribution logic should also evaluate HockeyStack and Dreamdata.
- The broader product can be unnecessary for narrower use cases: A company mainly looking for call attribution or paid-media tracking may get better economics from Ruler or Cometly.
Factors.ai pricing
Lite starts at $199 per month, Basic at $6,000 per year, Growth at $20,000 per year, and Enterprise from $30,000 per year.
2. HockeyStack
HockeyStack is a B2B attribution and GTM analytics platform with considerably more flexibility around reporting and journey analysis.
CRM, website, advertising, and sales data can be combined into custom funnels, account views, cohorts, and revenue reports. Teams with their own definitions of pipeline stages or GTM segments have more room to shape the reporting around the business.
What HockeyStack does well
- Flexible reporting: Teams can create their own funnels, segments, and account views instead of working from a fixed set of attribution dashboards.
- Deep B2B journey analysis: Marketing activity can be analyzed alongside account engagement, opportunity progression, pipeline, and revenue.
- Strong account-level visibility: HockeyStack was not consistently perceived as difficult in the evaluations we reviewed. Some buyers actually preferred its account-level reporting and visual setup.
- A good fit when attribution itself is the product requirement: Teams that regularly need to investigate different cuts of the funnel will get more flexibility than they would from a lighter reporting layer. Our Dreamdata vs. HockeyStack comparison goes deeper into where the two differ.
Where HockeyStack falls short
- More capability creates more to implement and maintain: Reporting depth is useful only if the team can operate it. Implementation effort and self-service came up repeatedly alongside HockeyStack's strengths in the calls we reviewed.
- Utilization matters as much as functionality: Sophisticated reporting has little value when only a small part of the product gets used. The risk is higher for smaller teams without dedicated marketing operations or RevOps support.
I would not evaluate HockeyStack by asking how many reports it can build. I would test whether the people who will use it every week can answer questions on their own without depending heavily on the vendor.
HockeyStack pricing
HockeyStack uses custom pricing.
3. Dreamdata
Dreamdata is built specifically for B2B revenue attribution. It combines website, CRM, advertising, product, and other GTM data into account-level customer journeys. Multiple people and touchpoints can be connected to the same opportunity before attribution is applied.
This makes it particularly useful for longer buying cycles where the last recorded source tells very little about how the deal developed.
What Dreamdata does well
- B2B attribution is the core product: Teams get more control over how marketing activity is connected to pipeline and revenue.
- Multi-person journeys: Activity from several contacts can be tied back to the same account and opportunity.
- More flexibility around attribution: Teams can look at the same journey through different attribution models rather than committing to one view of credit.
- A credible choice for mature B2B attribution teams: Dreamdata appeared repeatedly in the attribution evaluations we reviewed, particularly when the buyer wanted more depth than a broader ABM platform offered.
Teams implementing this kind of measurement from scratch should also account for the data work involved. Our guide to implementing multi-touch attribution covers the underlying setup.
Where Dreamdata falls short
- The economics become harder to justify when attribution is not a major priority: Pricing came up repeatedly in the evaluations we reviewed, especially when buyers were comparing Dreamdata with broader or lighter products.
- Mature implementations create switching costs: Reporting definitions, dashboards, and internal trust become embedded over time. Moving away from an incumbent attribution platform often requires internal buy-in even when another product is preferred.
- Not every B2B team needs the extra depth: If the main goal is to understand which accounts are active and use attribution to guide campaigns or sales action, a broader account-intelligence platform may be enough.
Dreamdata pricing
Dreamdata offers a free plan. More advanced attribution capabilities use custom pricing.
4. Adobe Marketo Measure
Adobe Marketo Measure, previously Bizible, is designed for enterprise B2B attribution inside the Salesforce and Marketo ecosystem.
It can connect paid media and website activity with webinars, events, direct mail, sales interactions, and other offline touches before tying the journey back to a Salesforce opportunity.
Several attribution models are available, including single-touch, U-shaped, W-shaped, full-path, and custom approaches.
What Adobe Marketo Measure does well
- Online and offline attribution: Digital activity can be measured alongside webinars, field events, direct mail, and sales interactions.
- Several established attribution models: Mature marketing teams can compare how credit changes across different parts of the funnel. Our attribution tracking guide covers the main models in more detail.
- Deep Salesforce integration: Campaign, contact, opportunity, and revenue data can remain closely connected to the CRM.
- Suitable for complex enterprise funnels: Teams with mature marketing operations can create more detailed rules around how marketing receives credit across the buying journey.
Where Adobe Marketo Measure falls short
- The quality of the attribution depends heavily on the CRM setup: Campaign structures, lifecycle stages, UTMs, field mappings, and opportunity data all need to be reliable. Many B2B attribution problems are data problems before they are modeling problems.
- It requires meaningful operational ownership: Sophisticated attribution becomes difficult to maintain when Salesforce usage or campaign governance is inconsistent.
- The value drops outside the Salesforce and Marketo ecosystem: Teams using a simpler stack may find another attribution product easier to implement and maintain.
Adobe Marketo Measure pricing
Adobe uses custom pricing.
5. HubSpot
HubSpot is usually the attribution tool a company already has. Campaigns, forms, emails, contacts, lifecycle stages, deals, and CRM activity are already stored in the platform.
Native attribution reports can use the same data to connect marketing interactions to contact creation, deals, and revenue. For companies with relatively straightforward reporting requirements, this can remove the need for another platform entirely.
What HubSpot does well
- Little additional setup for existing customers: Attribution uses data the marketing and sales teams already maintain.
- Covers common reporting requirements: Teams can analyze which sources and marketing interactions contribute to contacts, deals, and revenue without introducing a separate analytics platform.
- Easy for existing HubSpot users to adopt: Marketing, sales, and RevOps already understand the data model and reporting environment.
- A sensible starting point: Specialist software should solve a problem HubSpot cannot answer, not simply add another attribution dashboard.
Where HubSpot falls short
- The limitations become clearer as attribution gets more sophisticated: Model comparison, account-level journey analysis, and source classification were recurring reasons buyers looked beyond HubSpot in the calls we reviewed.
- Complex B2B accounts need more context: Several contacts, anonymous website activity, LinkedIn engagement, and opportunity progression can be difficult to analyze as one account journey.
- Most companies add an attribution layer rather than replace HubSpot: HubSpot usually remains the CRM while specialist tools handle the deeper measurement. The pattern came up consistently in the research.
Our HubSpot Analytics vs. Factors comparison covers the distinction in more detail.
HubSpot pricing
Attribution reporting is available on eligible Professional and Enterprise plans.
6. Ruler Analytics
Ruler Analytics is strongest when attribution needs to follow a lead beyond the website.
It connects the original marketing source to calls, forms, and live chat, then follows those leads through the CRM to revenue.
For businesses where a meaningful share of conversions happens over the phone or after a sales conversation, this is often more useful than adding another layer of digital attribution.
What Ruler Analytics does well
- Call attribution: Dynamic number tracking connects phone enquiries back to channels, campaigns, and keywords.
- Closed-loop revenue tracking: Leads can remain tied to their original marketing source after they enter the CRM and eventually become customers.
- Offline conversion data: Revenue and sales outcomes can be sent back to advertising platforms. Our Google Ads attribution guide covers why CRM and offline conversion data become important once form fills are no longer the final outcome.
- Focused scope: Teams looking primarily to connect inbound marketing with offline sales do not need to buy a broader ABM or account-intelligence platform.
Where Ruler Analytics falls short
- It is narrower than the B2B attribution platforms above: Account scoring, third-party intent, buying-group analysis, and account activation sit outside the main product.
- It is less suited to complex account journeys: Several people from the same company interacting across marketing and sales require a more account-centric view.
Ruler Analytics pricing
Ruler starts at roughly $400 per month.
7. Cometly
Cometly is more focused on paid-media attribution.
It uses first-party and server-side tracking to connect advertising activity with later funnel outcomes such as qualified leads, opportunities, customers, and revenue. The same downstream conversion data can be passed back to ad platforms for campaign optimization.
For performance teams, the appeal is straightforward. A campaign can be judged on what happened after the lead arrived rather than stopping at cost per lead.
What Cometly does well
- Paid-media measurement: Teams can compare campaigns using pipeline and revenue instead of relying entirely on platform-reported conversions.
- First-party and server-side tracking: Cometly reduces some of the dependence on browser-based tracking as those signals become less reliable.
- Better feedback to ad platforms: Downstream outcomes can improve the conversion signals used for campaign optimization.
- A focused alternative to broader attribution platforms: Cometly can make more economic sense when paid-media attribution is the main requirement.
Where Cometly falls short
- Paid-media attribution is not the same as full B2B journey attribution: Long sales cycles involving several stakeholders, events, sales activity, and account-level engagement need more context.
Cometly pricing
Starts at roughly $750 per month.
8. Funnel
Funnel solves a different part of the attribution problem.
It collects marketing data from different sources, cleans and standardizes it, and sends the resulting dataset to a warehouse, BI tool, spreadsheet, or another reporting destination. The attribution logic can then be built on top.
For teams with strong analytics resources, owning the data layer can be more valuable than buying another pre-built attribution dashboard.
What Funnel does well
- Marketing data collection: Funnel connects a large number of advertising and marketing sources without requiring teams to maintain every integration themselves.
- Data transformation: Campaign names, currencies, channel definitions, and other fields can be normalized before they reach the reporting layer.
- Fits an existing analytics stack: Teams already working in BigQuery, Looker, Power BI, or another BI environment can keep those workflows rather than moving reporting into a separate platform.
- Useful beyond attribution: The same cleaned dataset can support budgeting, campaign reporting, forecasting, and other analysis.
The trade-off is ownership. Our build vs. buy guide for B2B marketing analytics covers the broader decision between maintaining more of the measurement stack yourself and buying a product with the analysis already built in.
Where Funnel falls short
- Funnel provides the data foundation, not the final attribution answer: Your team still needs to decide how journeys, campaigns, and revenue should be modeled.
- It requires analytics resources: A demand generation team looking for an immediate answer to “which campaigns generated pipeline?” may find an attribution-first product easier to operate.
Funnel pricing
Funnel starts at roughly $300 per month on annual billing.
9. SegmentStream
SegmentStream becomes more interesting when a complete customer journey cannot be observed.
Cookies disappear, visitors change devices, consent limits tracking, and some conversions cannot be cleanly connected to the marketing activity that preceded them.
SegmentStream uses modeled attribution to estimate contribution across those gaps. It also brings incrementality into the measurement mix. Attribution asks which interactions should receive credit. Incrementality asks whether the marketing activity caused additional conversions in the first place.
What SegmentStream does well
- Works around tracking gaps: Measurement does not depend on observing every individual touchpoint.
- Incrementality testing: Teams can test whether marketing generated additional outcomes instead of relying only on attribution credit.
- Multiple ways to measure performance: Modeled attribution and incrementality can be used for different decisions rather than forcing one model to answer everything.
Our guide to attribution reporting covers why relying on a single attribution view can create problems, particularly as buyer journeys become harder to observe.
Where SegmentStream falls short
- The output is less tangible than a reconstructed journey: A B2B marketer may prefer opening an account or opportunity and seeing the actual interactions behind it.
- The measurement approach requires more expertise: Teams need to understand where modeled attribution ends and incrementality begins. The numbers are only useful when the organization understands what each method is answering.
SegmentStream pricing
Online plans start at roughly $800 per month, while Full Funnel starts around $1,200 per month.
10. Rockerbox
Rockerbox is designed primarily for consumer brands spending across several paid and owned channels.
It combines multi-touch attribution, marketing mix modeling, and incrementality in one measurement environment. The aim is less about reconstructing an enterprise opportunity and more about getting a reliable view of channel performance before moving media budget.
This matters because Meta, Google, TikTok, affiliates, and other channels can all claim credit for the same conversion.
What Rockerbox does well
- Cross-channel measurement: Marketing teams can compare performance without accepting every advertising platform's attribution as the source of truth.
- Several measurement methods: MTA, MMM, and incrementality provide different ways to test how channels are contributing.
- Media allocation: The analysis feeds directly into decisions about where budget should increase or decrease.
If cross-channel measurement is the main challenge, our guide to cross-channel marketing attribution explains why stitching activity across platforms becomes difficult in the first place.
Where Rockerbox falls short
- B2B opportunities are not the main data model: Account journeys involving several contacts, opportunity stages, sales activity, and long buying cycles require a different type of attribution.
- Some B2B teams would be paying for measurement methods they rarely use: A company mainly interested in account-to-pipeline attribution may get more value from one of the B2B-focused products earlier in the list.
Rockerbox pricing
Rockerbox uses custom pricing.
11. Triple Whale
Triple Whale is built around ecommerce measurement. Advertising spend, orders, revenue, customer acquisition, creative performance, and profitability can be analyzed in the same product.
This makes attribution easier to connect to the metrics an ecommerce marketing team already uses to run the business. The useful question is not only which campaign received credit. It is whether the campaign acquired profitable customers.
What Triple Whale does well
- Attribution sits close to commercial metrics: ROAS, CAC, orders, revenue, and profitability can be evaluated together.
- Performance can be broken down further: Teams can move from channel-level reporting into campaigns, creatives, products, and customers.
- Advanced measurement is available for larger teams: More sophisticated packages include MMM and incrementality alongside attribution.
Where Triple Whale falls short
- It is not designed around CRM opportunities or buying committees: Thousands of ecommerce transactions require a different measurement model from a smaller number of long B2B sales cycles.
Triple Whale pricing
Triple Whale offers a free plan. Paid pricing varies based on the package and GMV.
12. Northbeam
Northbeam is another measurement platform aimed mainly at ecommerce and consumer brands with meaningful paid-media spend.
It combines first-party attribution with view-through measurement and broader methods such as MMM and incrementality. The emphasis is on understanding channel performance well enough to make better media-allocation decisions.
What Northbeam does well
- Independent media measurement: Teams get another view of channel performance instead of relying solely on what each advertising platform reports.
- Several measurement methods: First-party attribution, MMM, and incrementality can be used together when one methodology is not enough.
Where Northbeam falls short
- It is not built around complex B2B opportunities: The product is much more naturally aligned with media spend and transactions than accounts and opportunity stages.
- The economics improve with scale: A company needs enough advertising spend for better budget allocation to justify the cost of the measurement layer.
Northbeam pricing
Starter begins at roughly $1,500 per month, with Professional starting around $3,500 per month.
How to choose the right marketing attribution software
A longer feature list does not automatically produce better attribution.
Before evaluating vendors, decide which part of your current measurement setup actually needs to improve.
1. Start with the questions you cannot answer today
Some teams need deeper multi-touch attribution. Others already have enough attribution but cannot connect marketing activity to accounts, understand view-through influence, or use the resulting data anywhere else.
Write down the questions the new platform needs to answer before opening a vendor comparison.
For example:
- Which channels are contributing to pipeline?
- Which interactions matter before an opportunity is created?
- Can we understand marketing influence across multiple people from the same account?
- Do we need to compare several attribution models?
- Do we need the output only for reporting, or should it also change campaigns and sales activity?
The shortlist gets much smaller once those questions are clear.
2. Make sure the team can operate the product
Reporting depth only matters when the people using the platform can get to the answer themselves.
Ease of self-service came up repeatedly in the evaluations we reviewed, including for sophisticated attribution products. Buyers were not necessarily looking for fewer capabilities. They wanted enough control to answer new questions without turning every report into a services project.
During a trial, have the people who will own the tool build a report themselves. A polished vendor demo tells you what the product can do. It tells you much less about what your team will still be doing six months later.
3. Fix the data before adding a better model
Attribution is only as reliable as the information underneath it.
Contacts need to be associated with the right accounts. Campaign data needs to survive into the CRM. Lifecycle stages need to mean something. Duplicate records and inconsistent field values eventually show up as attribution problems.
One of the clearest patterns in the calls we reviewed was how often a supposed attribution problem was partly a CRM problem.
4. Decide what happens after you know the answer
Attribution can end with a report, or it can feed the next decision.
If the main goal is proving marketing influence to leadership, a dedicated attribution platform may be enough.
If the team wants to change account prioritization, advertising, audiences, sales alerts, or campaign execution, the requirements expand. This is where attribution begins to overlap with lead scoring, intent, and account intelligence.
5. Compare the operating cost, not just the subscription
The license is one part of the cost.
Implementation, CRM cleanup, data engineering, RevOps time, training, report maintenance, and vendor support can materially change the economics.
This is also why a cheaper product is not automatically the less expensive choice. A tool nobody uses has poor economics at almost any price.
Which marketing attribution tool should you choose?
Choose Factors.ai when attribution needs to work alongside account intelligence, LinkedIn measurement, intent, and activation. Look harder at HockeyStack when flexible GTM reporting and deeper analysis matter most. Dreamdata is a strong option when dedicated B2B revenue attribution is the priority.
Adobe Marketo Measure makes more sense inside a mature Salesforce and Marketo environment. HubSpot may already be enough if your reporting requirements are relatively straightforward.
The narrower products have clearer jobs. Ruler Analytics is strongest when calls and offline sales create the attribution gap. Cometly is better aligned with paid-media attribution.
For ecommerce and consumer businesses, I would move Rockerbox, Triple Whale, and Northbeam much higher on the list.
The goal is not to buy the platform capable of producing the most sophisticated attribution report. Buy enough attribution to make better decisions, from data your team can maintain, in a product people will actually use.
Frequently asked questions
What is the best marketing attribution tool?
There is no single best option for every business. Factors.ai is a strong fit for B2B teams that want attribution connected to account intelligence and activation. HockeyStack and Dreamdata go deeper when attribution itself is the main requirement. Consumer and ecommerce teams should also consider Rockerbox, Triple Whale, and Northbeam.
What is the best B2B marketing attribution software?
Factors.ai, HockeyStack, Dreamdata, and Adobe Marketo Measure are the strongest starting shortlist for more advanced B2B marketing attribution.
The choice depends on whether you need broader account intelligence, deeper attribution reporting, flexible model comparison, or close integration with Salesforce and Marketo.
Do I need a dedicated attribution platform if I use HubSpot?
Not necessarily. HubSpot can cover common contact, campaign, deal, and revenue attribution questions. A specialist tool becomes more useful when you need account-level journeys, more flexible models, deeper LinkedIn measurement, or another action based on the attribution data.
What is the difference between multi-touch attribution and marketing mix modeling?
Multi-touch attribution assigns credit across observable touchpoints in the customer journey.
Marketing mix modeling uses aggregated data to estimate how different marketing investments contribute to results over time. Neither replaces the other. The right method depends on the decision you are trying to make.
How much does marketing attribution software cost?
Entry-level products can start at a few hundred dollars per month, while enterprise attribution platforms can run into tens of thousands of dollars per year.
The more useful comparison is total operating cost. Implementation, data cleanup, RevOps time, integrations, training, and ongoing maintenance can matter as much as the license itself.
Top 5 CANDDi Alternatives & Competitors in 2026
Explore the best CANDDi alternatives to enhance your business's lead tracking and customer insights. Compare top tools and find the perfect fit.
TL;DR
- Factors.ai is an AI-powered ABM and analytics tool. The features include visitor identification, AI-powered analytics, custom dashboards, lead scoring, and predictive account scoring. Factors offers advanced analytics, AI-driven insights, and customizable dashboards. However, it might be slightly more complex and priced higher.
- Leadfeeder focuses on company-level data. Offers features such as company identification, behavior tracking, CRM integration, and email alerts. The tool is user-friendly, CRM integration. However, it has limited individual tracking and relies on Google Analytics data.
- Albacross helps with B2B lead generation and website tracking. Features include company identification, lead generation, CRM integration, and custom reporting. Albacorss offers detailed company insights, a lead generation focus, and custom reporting but has limited individual tracking and pricing transparency issues.
- Clearbit is a data enrichment and lead generation tool. The features include data enrichment, company identification, CRM integration, API access, and lead scoring. It offers comprehensive data and scalable, robust integration but may be expensive and has a steep learning curve.
- Lead Forensics offers real-time visitor identification and lead generation. Features include visitor identification, real-time alerts, CRM integration, lead scoring, and custom reporting. While the tool provides detailed lead data, real-time engagement, and comprehensive CRM integration, Pricing is quote-based and depends on website traffic.
Understanding customer behavior online is key to business success, so companies are turning to sophisticated tools to monitor website traffic, identify leads, and customize interactions. CANDDi (Customer Analytics and Digital Data Insights) has become popular for its effective visitor tracking and lead identification features. It enables businesses to gain insights into who visits their website, what interests them, and how to convert them into customers.
Although CANDDi is a powerful tool, there may be better fits for some businesses. Factors like cost, feature preferences, or unique business needs prompt companies to consider other options. This blog explores various alternatives to CANDDi, offering a detailed comparison of tools that could better suit your specific requirements.
Understanding A Little More About CANDDi
CANDDi, short for Campaign and Digital Data Insights, is a visitor tracking and lead identification tool designed to help businesses understand who is visiting their website, what they are doing there, and how to engage them effectively. The tool provides in-depth insights into visitor behavior, allowing businesses to tailor their marketing and sales strategies accordingly.
Features of CANDDi
- Visitor Identification
- Data Segmentation
- Lead Scoring
- CRM Integration
- Email Tracking
- Real-Time Alerts
Pros of CANDDi:
- Detailed Visitor Insights
- Lead Scoring
- Real-Time Alerts
Cons of CANDDi:
- Complexity
- Pricing
- Limited Customization
Pricing
CANDDi offers a tiered pricing model. The basic package generally starts at around £150 per month, with pricing increasing based on the number of identified visitors and additional features. Customized plans are available for larger enterprises with more extensive needs.
Ideal User Base
CANDDi is ideal for B2B companies, particularly those in sales-driven industries such as technology, finance, and professional services. It is most beneficial for businesses that need detailed insights into who is visiting their website and how to convert those visitors into customers.
Why Consider CANDDi Alternatives?
While CANDDi offers robust visitor tracking and lead identification capabilities, some businesses may have better solutions. Here are some reasons why you might consider exploring alternatives:
1. Pricing Constraints:
While CANDDi’s pricing may be justified by its feature set, it may be prohibitive for small businesses or startups. Exploring alternatives is wise if you're looking for a more budget-friendly option.
2. Feature Overload:
CANDDi’s extensive features may be more than necessary for businesses that require only basic visitor tracking, leading to unnecessary complexity and cost.
3. Customization Needs:
If your business requires specific customization options or a different way of viewing and segmenting data, other tools offer more flexibility than CANDDi.
4. Integration Requirements:
While CANDDi integrates with popular CRM systems, your business might use less standard tools that require more seamless integration capabilities than other platforms offer.
5. Scalability:
As your business grows, you may need a tool that scales more effectively or offers more advanced features for enterprise-level operations. Some CANDDi alternatives better meet these needs.
Top CANDDi Alternatives
1. Factors.ai

Overview
Factors is a relatively new entrant into the visitor tracking and analytics space but has quickly gained traction due to its focus on advanced data analytics and AI-driven insights. Unlike traditional visitor tracking tools, Factors offers a more comprehensive approach by combining visitor tracking with powerful analytics and predictive modeling capabilities, making it a solid alternative to CANDDi.
Features

- Visitor Identification: Factors identifies website visitors and provides detailed information about their behavior, including the pages they visit and the time they spend on each page.
- AI-Powered Analytics: The platform leverages AI to analyze visitor data and generate insights that can help you optimize your marketing strategies.
- Custom Dashboards: Create customizable dashboards to track key metrics and KPIs, providing a clear view of your marketing performance.
- Lead Scoring and Segmentation: Automatically score and segment leads based on their behavior, ensuring that your sales team focuses on the most promising prospects.
- CRM and Marketing Automation Integration: Seamless integration with popular CRM systems and marketing automation platforms allows smooth data flow and enhanced lead management.
- Predictive Modeling: Use predictive modeling to forecast future behavior and trends, enabling more informed decision-making.
Pros

- Advanced Analytics: Factors stands out for its advanced analytics capabilities, which go beyond simple visitor tracking and offer deeper insights into visitor behavior.
- AI-Driven Insights: Using AI-driven data analysis to generate insights helps businesses optimize their marketing efforts and improve conversion rates.
- Customizable Dashboards: The ability to create custom dashboards allows businesses to focus on the metrics that matter most to them.
Cons

- Complexity: Factors’ advanced features may require a learning curve, particularly for users unfamiliar with AI-driven tools.
- Pricing: Factors’ advanced features come at a cost, which may be higher than some simpler alternatives.
Pricing
Factors offers customized pricing based on your business's specific needs. The cost typically varies depending on the number of visitors tracked, the features required, and the level of service. Businesses interested in Factors are encouraged to request a quote for accurate pricing information.
Ideal User Base
Factors is best suited for data-driven businesses that want to optimize their marketing efforts beyond basic visitor tracking and leverage advanced analytics. It is beneficial for companies in industries like SaaS, e-commerce, and digital marketing that need detailed insights and predictive modeling to drive growth.
{{INLINE_CTA_A}}
2. Leadfeeder

Overview
Leadfeeder is a popular web analytics tool that identifies companies visiting your website, showing you how they found you and what they’re interested in. It integrates seamlessly with Google Analytics and CRM systems, making it a go-to choice for B2B companies seeking to generate more website traffic leads.
Features

- Company Identification: Leadfeeder identifies companies visiting your website and provides details like company name, industry, and contact information.
- Behavior Tracking: Tracks visitor behavior, showing which pages were viewed and how long the visitor stayed on your site.
- CRM Integration: Direct integration with CRM systems such as Salesforce, HubSpot, and Pipedrive for easy lead management.
- Email Alerts: Get notified when a high-value lead visits your website, similar to CANDDi’s real-time alerts.
- Custom Feeds: Set up custom feeds to filter visitors by criteria such as location, industry, or pages viewed.
Pros

- Easy to Use: Leadfeeder is known for its user-friendly interface, which makes it accessible even to users with minimal technical knowledge.
- CRM Integration: Seamless CRM integration ensures your sales team has the latest lead information.
- Scalable: Suitable for both small businesses and large enterprises due to its flexible pricing and feature set.
Cons

- Limited Data on Individuals: Unlike CANDDi, which can sometimes identify individual visitors, Leadfeeder focuses primarily on company-level data.
- Dependency on Google Analytics: Leadfeeder’s insights rely heavily on Google Analytics data, which might limit its accuracy if your Analytics setup is not optimal.
Pricing
Leadfeeder offers a free version with limited features and a paid version starting at €79 per month, depending on the number of leads identified and additional features required.
Ideal User Base
Leadfeeder is ideal for B2B companies, particularly those in SaaS, consulting, and digital marketing industries. It’s a great option for businesses that want to enhance their lead-generation efforts without investing heavily in a complex tool.
Also Read: Leadfeeder [Dealfront] vs. Factors
3. Albacross

Overview

Albacross is a lead generation and website tracking tool designed to help B2B companies identify website visitors and turn them into leads. It provides detailed insights into the companies visiting your site and enables you to engage them with targeted marketing campaigns.
Features
- Company Identification: Albacross identifies the companies visiting your website and provides key details such as industry, size, and contact information.
- Lead Generation: The tool helps you generate leads by tracking visitor behavior and identifying those who are most likely to convert.
- CRM Integration: Seamless integration with popular CRM systems to streamline lead management.
- Custom Reporting: Create custom reports to analyze visitor data based on criteria such as location, industry, or behavior.
- Targeted Campaigns: Use Albacross's insights to run targeted marketing campaigns for specific companies or industries.
Pros

- Detailed Company Insights: Albacross provides extensive information on visiting companies, helping you tailor your marketing efforts effectively.
- Lead Generation Focus: The tool is designed specifically for lead generation, making it a strong alternative for businesses focused on converting website traffic into leads.
- Custom Reporting: The ability to create custom reports allows for deeper analysis and more targeted marketing strategies.
Cons

- Limited Individual Tracking: Like Leadfeeder, Albacross focuses on company-level data, which may need to be improved for businesses looking to track individual visitor behavior.
- Pricing Transparency: Albacross’s pricing structure is not as transparent as some competitors, requiring potential customers to request a quote.
Pricing
Albacross offers customized pricing based on your business's needs. The cost typically depends on the number of visitors tracked and the required features.
Ideal User Base
Albacross best suits B2B companies looking to enhance their lead generation efforts. It’s useful for businesses in industries like technology, finance, and professional services that need detailed insights into who is visiting their website.
Also Read: Leadfeeder vs. Albacross
{{INLINE_CTA_A}}
4. Clearbit

Overview
Clearbit is a robust data enrichment and lead generation tool that provides detailed insights into your website visitors. It gathers extensive information about visitors, including company details, job roles, and contact information, which can be leveraged for more personalized marketing and sales outreach. Clearbit is known for its data accuracy and is often used by companies to enrich their CRM databases.
Features

- Data Enrichment: Clearbit enriches your existing data by adding valuable information about leads, such as company size, industry, job title, and contact details.
- Company Identification: Identify which companies visit your website and gain insights into their interests based on browsing behavior.
- CRM Integration: Seamlessly integrates with CRMs like Salesforce, enabling you to update your lead records with enriched data automatically.
- API Access: Clearbit provides robust API access, allowing businesses to integrate its data into their existing tools and workflows.
- Lead Scoring: Helps prioritize leads by scoring them based on their engagement and fit with your target customer profile.
Pros

- Comprehensive Data: Clearbit’s extensive database ensures that you have access to detailed information about your website visitors, enhancing your ability to tailor marketing efforts.
- Scalable: Suitable for small and large businesses, with the ability to handle large volumes of data.
- Integration Capabilities: Clearbit’s API and CRM integrations make it easy to incorporate into your existing sales and marketing stack.
Cons

- Cost: Clearbit can be expensive, particularly for smaller businesses or startups with limited budgets.
- Complexity: While powerful, Clearbit’s extensive feature set and customization options may require a steeper learning curve and dedicated resources to utilize fully.
Pricing
Clearbit offers various pricing tiers based on usage, with the starting price for basic access typically around $99 per month. Pricing can increase significantly depending on the volume of data and additional features required, and enterprise solutions are often custom-priced.
Ideal User Base
Clearbit is ideal for data-driven businesses that need detailed, enriched information about their leads. It is popular among SaaS companies, digital marketing agencies, and large enterprises that require accurate and comprehensive data to drive their sales and marketing strategies.
5. Lead Forensics

Overview
Lead Forensics is a B2B platform centered on company-level website visitor identification. It shows which companies are visiting your website and what they looked at, so your sales team can follow up while interest is fresh. It identifies the visiting company, not the individual person browsing your site.
Features

- Company-Level Visitor Identification: Lead Forensics identifies the companies visiting your website and shows firmographic details, pages viewed and return visits. It can also provide contact details for relevant decision-makers at those companies. These contacts are not necessarily the people who visited your site.
- Real-Time Alerts: Receive notifications when a high-value lead visits your website, enabling immediate follow-up.
- CRM Integration: Integrates with CRMs including Salesforce, HubSpot, Microsoft Dynamics, Pipedrive and Zoho, so identified companies can flow into your existing workflow.
- Lead Scoring and Lead Manager: Automatically scores leads based on website activity, and includes a built-in lead manager to assign and track them.
CustomReporting: Create and export custom reports to analyze visitor data and measure the effectiveness of your marketing campaigns.
Pros

- Detailed Lead Data: Lead Forensics provides in-depth information about visiting companies, making it easier to target key decision-makers.
- Real-Time Engagement: The tool’s real-time alerts allow immediate follow-up, increasing the chances of converting leads into customers.
- Comprehensive CRM Integration: Seamless integration with CRM systems helps streamline the lead management process.
Cons
- Company-Level Identification: Lead Forensics identifies the visiting company, not the individual visitor.
- Quote-Based Pricing: Cost depends on your website traffic, so you need a demo and free trial to get a figure.
- Built for B2B: The platform is designed for B2B websites, so it is not aimed at B2C traffic.
Ideal User Base
Lead Forensics suits B2B sales and marketing teams that want to see which companies visit their website and follow up with decision-maker contacts.
Also Read: Top 10 Lead Forensics Alternatives
Why Factors.ai is the Perfect CANDDi Alternative
Factors emerges as a compelling alternative to CANDDi for several reasons. Here’s why it could be the ideal choice for your business:
1. Advanced Analytics and AI Integration:
- Predictive Modeling: Factors uses AI to analyze visitor data and predict future trends. This allows businesses to make data-driven decisions and anticipate customer needs more accurately than CANDDi.
- In-depth Insights: The advanced analytics capabilities provide deeper insights into visitor behavior, enabling more precise targeting and personalized marketing strategies.
2. Customizable Dashboards
- Tailored Reporting: With customizable dashboards, Factors lets you focus on the metrics that matter most to your business. This flexibility is crucial for effectively adapting to specific business goals and tracking performance.
3. Comprehensive Lead Management
- Lead Scoring and Segmentation: Factors’s lead scoring and segmentation features help prioritize high-value leads and tailor follow-up strategies. This ensures that your sales team can focus on the most promising prospects, similar to CANDDi’s lead scoring capabilities but with added flexibility.
4. Seamless Integration
- CRM and Marketing Automation: Factors integrates well with popular CRM systems and marketing automation tools, facilitating smooth data flow and enhancing lead management. This is essential for businesses that rely on an integrated tech stack for their sales and marketing efforts.
5. Affordable and Scalable
- Custom Pricing: Factors offers customized pricing, meaning you only pay for the needed features. This can be more cost-effective compared to CANDDi, especially for businesses looking to scale their use of visitor tracking tools without overspending.
6. LinkedIn AdPilot
- Maximize LinkedIn Ads ROI: Factors has launched a LinkedIn AdPilot platform designed to optimize your LinkedIn advertising spend. With capabilities such as Campaign Automation, Smart Reach, View-through Attribution, Audience Sync, and Factors’ CAPI integration, AdPilot ensures that every dollar spent on LinkedIn Ads contributes to meaningful business outcomes. This platform also sets Factors apart from CANDDi by providing dedicated tools for LinkedIn ad management, enhancing the overall value proposition for businesses investing in LinkedIn ads.
Looking for a Canddi alternative? There are several strong options.
1. Top Platforms: Factors, Leadfeeder, and Albacross.
2. Key Features: Visitor tracking, lead generation, and analytics tailored to your needs.
3. Strategic Benefits: Choose based on your business goals, budget, and feature requirements.
These alternatives provide flexible solutions to enhance lead tracking and marketing efforts.
In a nutshell
Choosing the right visitor tracking and lead generation tool is crucial for optimizing your sales and marketing efforts. While CANDDi offers robust features for visitor identification and lead scoring, some businesses may be better suited to it due to pricing and complexity.
Exploring alternatives like Leadfeeder, Albacross, Clearbit, Lead Forensics, Visitor Queue, and Factors can help you find a tool that better meets your specific needs. Each alternative has its strengths and considerations, and the best choice will depend on your budget, feature requirements, and integration needs.
Factors, in particular, stands out as a solid alternative to CANDDi due to its advanced analytics, AI-driven insights, and customizable reporting. Its flexible pricing and innovative approach make it an appealing option for businesses leveraging cutting-edge technology for improved lead generation and marketing effectiveness.
As you consider your options, weigh each tool's features, pricing, and benefits to make an informed decision that aligns with your business goals. Try demo versions, request quotes, and gather feedback from other users to ensure you select the best solution. Reach out to us at Factors.AI for any further details.
Top 6 Lead Magic Alternatives for Enhanced Marketing Analytics
Explore the best Lead Magic alternatives, including Factors.AI, Dealfront, Lead Forensics, Snitcher, Visitor Queue, and Lift AI. Compare features, pricing, and benefits to find the perfect tool for your marketing needs.
TL;DR
- Why consider Lead Magic alternatives? Feature Requirements, Cost Considerations, Customization Needs, User Experience, Data Privacy
- Factors.AI: Specializes in behavioral analytics and lead generation using anonymized data and focuses on data privacy.
- Dealfront (formerly Echobot): Provides lead scoring, visitor insights, and CRM integration for comprehensive lead generation.
- Lead Forensics: Company-level website visitor identification, with decision-maker contact data, real-time alerts, lead scoring and CRM integrations.
- Snitcher: Offers visitor tracking and lead generation at a cost-effective price, suitable for small to medium businesses.
- Visitor Queue: Identifies website visitors and provides detailed insights for affordable lead generation and marketing automation.
- Lift AI: Combines advanced behavioral analytics with anonymized data to ensure privacy compliance.
It’s a known fact that the lead generation and marketing analytics tools you choose can make or break your business. Lead Magic has made its mark, offering robust features for identifying and analyzing leads, but is it the perfect fit for your needs? Let’s take a look.
This blog will introduce Lead Magic and its alternatives: Leadfeeder, Factors.AI, Dealfront, Lead Forensics, Snitcher, Visitor Queue, and Lift. We’ll discuss why you might want to consider these alternatives and break down what makes each tool shine, from features and benefits to pricing and limitations.
About Lead Magic

Lead Magic is a lead generation and marketing analytics tool that uses automated processes to identify and track potential leads. It offers a range of features designed to provide insights into visitor behavior and enhance lead management.
Key Features:
- Lead Identification: Automates identifying potential leads visiting your website, providing detailed information about them.
- Behavioral Analytics: Analyzes how visitors interact with your site, offering insights into their interests and behaviors.
- CRM Integration: Seamlessly integrates with major CRM systems, facilitating efficient lead management and follow-ups.
Why Lead Magic is a Good Option:
- Comprehensive Lead Identification: It provides accurate and reliable lead information, crucial for effective lead generation and nurturing.
- Actionable Insights: The behavioral analytics feature offers valuable insights into visitor interactions, helping tailor marketing strategies.
Limitations:
- Cost: Lead Magic’s pricing may be higher than some competitors, potentially making it less accessible for smaller businesses.
- Customization Options: The dashboard and reporting features offer limited customization, which might only meet some user preferences.
Pricing:
Lead Magic’s pricing information is not publicly available. Prospective users are encouraged to contact their sales team for a customized quote.
Why You Need Lead Magic Alternatives
Lead Magic has been a reliable tool for many businesses, but there are several reasons you might seek alternatives:
- Feature Requirements:
Depending on your business's specific needs, you might require features that Lead Magic does not offer. Alternatives provide more advanced analytics, better integration options, or additional functionalities that better align with your objectives.
- Cost Considerations:
Lead Magic might be more expensive compared to other solutions. If budget constraints are a concern, exploring alternatives with more flexible pricing could provide similar benefits at a lower cost.
- Customization Needs:
Different businesses have varying needs for customization. Alternatives might offer more tailored solutions or better integration with existing systems, providing a more personalized experience.
- User Experience:
Some users might find Lead Magic’s interface less intuitive or harder to navigate than other tools. Exploring alternatives can improve user experience and streamline workflows.
- Data Privacy and Compliance:
If compliance is a requirement, check each vendor's certifications and data processing terms. Factors.ai is SOC 2 Type II certified and GDPR, CCPA and PECR compliant.
{{INLINE_BOFU}}
Let’s Look At Some Alternatives
1. Factors

Factors specializes in marketing automation and analytics, using anonymized data to offer precise insights into visitor behavior and lead potential.
Key Features:
- Behavioral Analytics: Uses anonymized data to analyze visitor behavior and predict lead potential accurately.
- Lead Generation: Automates lead generation and nurturing processes based on detailed visitor insights.
- Data Privacy: Ensures compliance with data protection regulations by utilizing anonymized data and addressing privacy concerns.

Why Factors is a Good Lead Magic Alternative:
- Advanced Analytics with Privacy Focus: Provides advanced behavioral analytics while emphasizing data privacy, making it suitable for businesses with strict compliance needs.
- Scalable Solutions: Offers solutions that scale with your business, accommodating various sizes and industries.
Limitations:
- Cost: May be relatively expensive, especially for smaller businesses or startups.
- Learning Curve: The platform may have a learning curve for users unfamiliar with advanced analytics features.
Pricing:
Factors offers customized pricing based on business size and needs. It is recommended that you contact their sales team for specific details.
2. Dealfront

Dealfront, formerly known as Echobot, provides comprehensive lead generation and marketing automation with detailed visitor tracking and analytics.
Key Features:
- Lead Scoring: Uses advanced algorithms to score and prioritize leads based on their interactions and behaviors.
- Visitor Insights: Provides in-depth information about website visitors, including their company details and engagement levels.
- CRM Integration: Integrates with various CRM systems to streamline lead management and follow-ups.

Why Dealfront is a Good Lead Magic Alternative:
- Comprehensive Lead Scoring: Offers advanced lead scoring capabilities, helping businesses prioritize leads more effectively.
- Detailed Visitor Information: Delivers insights into visitor behavior and company details, enhancing lead targeting.
Limitations:
- Higher Pricing: It can be relatively expensive, which might be a point of consideration for smaller businesses.
- Complex Setup: Initial setup and customization may be complex and time-consuming.
Pricing:
Dealfront’s pricing varies based on features and business size. It is recommended that you contact their sales team for specific pricing details.
3. Lead Forensics

Lead Forensics is a B2B platform centered on company-level website visitor identification. It shows which companies visit your site and what they look at, and adds decision-maker contact data, alerts and CRM integrations.
Key Features:
- Company-Level Visitor Identification: Identifies the companies visiting your website and shows firmographic details, pages viewed and return visits.
- Decision-Maker Contact Data: Provides contact details for relevant decision-makers at identified companies. These contacts are not necessarily the people who visited.
- Alerts and Lead Scoring: Sends real-time alerts when target companies visit and scores leads automatically.
- CRM Integration: Integrates with CRMs including Salesforce, HubSpot, Microsoft Dynamics, Pipedrive and Zoho.
Why Lead Forensics is a Good Lead Magic Alternative:
- Owned IP Database: Lead Forensics says it owns and maintains its B2B IP database rather than relying only on third-party sources.
- Sales Workflow Tools: Includes a built-in lead manager, lead scoring and alerts. Its pricing page also lists workflow automation, CRM lead creation and automated lead routing.

Limitations:
- Company-Level Only: Identifies the visiting company, not the individual visitor.
- Quote-Based Pricing: Cost depends on your website traffic, so you need a demo and free trial to get a figure.
Pricing:
Lead Forensics pricing is quote-based and calculated from your website traffic. It offers a one-week free trial, and both plans (Essentials and Automate) include unlimited users. Contact Lead Forensics for current pricing.
4. Snitcher

Snitcher provides visitor tracking and lead generation capabilities, focusing on detailed insights and automation.
Key Features:
- Visitor Tracking: Identifies companies visiting your website and provides detailed information about their behavior and engagement.
- Lead Generation: Automates lead generation using visitor data and insights.
- CRM Integration: Integrates with CRM systems for efficient lead management and follow-ups.
Why Snitcher is a Good Lead Magic Alternative:
- Cost-Effective Solution: Offers an affordable pricing model suitable for small to medium-sized businesses.
- Detailed Visitor Insights: Provides accurate visitor tracking and company information, which helps in targeting leads effectively.

Limitations:
- Complex Setup: Initial setup and customization may be complex and time-consuming.
- Limited Advanced Analytics: Basic analytics might not meet the needs of larger enterprises or those requiring in-depth insights.
Pricing:
Snitcher offers a range of pricing plans, starting at approximately $39 monthly. Detailed pricing information is available on their website.
5. Visitor Queue

Visitor Queue identifies website visitors and provides detailed information to facilitate lead generation and marketing automation.
Key Features:
- Visitor Identification: Tracks and identifies companies visiting your website, offering detailed insights into their behavior and engagement.
- Lead Generation: Automates lead generation processes by analyzing visitor data and interactions.
- CRM Integration: Integrates with major CRM systems to streamline lead management and follow-ups.

Why Visitor Queue is a Good Lead Magic Alternative:
- Affordable Pricing: Provides a cost-effective solution for lead generation with pricing plans suited for small to medium-sized businesses.
- Detailed Visitor Insights: Offers comprehensive information about visiting companies, helping businesses better understand their audience and tailor their marketing strategies.
Limitations:
- Basic Analytics: May need more advanced analytics features found in more expensive tools.
- Limited Customization: The platform may offer fewer customization options than other alternatives.
Pricing:
Visitor Queue offers pricing plans starting at approximately $29 per month. For detailed pricing and feature information, it is recommended that you visit their website or contact their sales team.
6. Lift

Lift provides advanced marketing analytics and automation using anonymized data to ensure data privacy and compliance.
Key Features:
- Behavioral Analytics: Uses anonymized data to analyze visitor behavior and predict lead potential accurately.
- Lead Generation: Automates lead generation processes based on detailed visitor insights and behavioral data.
- Data Privacy: Ensures compliance with data protection regulations by using anonymized data, addressing privacy concerns effectively.
Why Lift is a Good Lead Magic Alternative:
- Advanced Analytics with Privacy Focus: This product offers sophisticated behavioral analytics while prioritizing data privacy, making it an excellent choice for businesses with stringent compliance requirements.
- Scalable Solutions: Provides solutions that scale with your business, accommodating various sizes and industries.

Limitations:
- Higher Cost: The platform can be relatively expensive for smaller businesses or startups.
- Learning Curve: The advanced features may require a learning curve for users unfamiliar with complex analytics tools.
Pricing:
Lift offers customized pricing based on business needs and size. It is recommended that you contact their sales team for specific pricing details.
Here's Why Factors is the Best Lead Magic Alternative
When it comes to choosing the best alternative to Lead Magic, Factors stands out for several key reasons:
- Advanced Behavioral Analytics: Factors excels at providing detailed insights into visitor behavior using anonymized data. This feature ensures precise analytics while maintaining compliance with privacy regulations like GDPR.
- Compliance: Factors.ai is SOC 2 Type II certified and GDPR, CCPA and PECR compliant.
- Customizable and Scalable Solutions: Whether your business is small or rapidly growing, Factors offers scalable solutions that adapt to your needs. Its customizable features cater to various industries, ensuring you receive relevant and actionable data.
- Positive User Feedback: Users consistently praise Factors.ai for its reliable performance and robust data privacy measures. This positive feedback underscores its effectiveness as a lead generation and marketing analytics tool.
Factors provides a comprehensive and reliable solution for lead generation and marketing analytics, making it a top choice for businesses seeking advanced features, privacy compliance, and scalability.
Businesses looking beyond Lead Magic can choose from a range of tools tailored to different marketing needs.
1. Top Alternatives: Factors, Dealfront, Lead Forensics, Snitcher, Visitor Queue, and Lift AI.
2. Platform Highlights: Factors emphasizes behavioral analytics and privacy; others offer CRM sync, visitor tracking, or budget-friendly plans.
3. Strategic Fit: Tool selection should align with analytics depth, compliance needs, and integration goals.
Choosing the right platform ensures better lead insights, targeted engagement, and improved marketing performance.
In a nutshell
While Lead Magic has been a prominent player, exploring alternatives like Leadfeeder, Factors, Dealfront, Lead Forensics, Snitcher, Visitor Queue, and Lift can provide valuable options tailored to different needs and budgets.
Each tool offers unique features and benefits, from advanced analytics and privacy focus to cost-effective solutions and scalable options. By evaluating these alternatives, you can make an informed decision that aligns with your business goals and enhances your lead generation and marketing efforts.
Top 5 B2B Data Enrichment Tools to Boost Data Accuracy
Discover the best B2B data enrichment tools to enhance business intelligence, improve targeting, and drive better decision-making. Explore top solutions now.
TL;DR
- Data enrichment tools enhance B2B marketing and sales by transforming raw data into actionable insights, leading to more effective strategies.
- These tools clean, validate, and update data, ensuring it is accurate, comprehensive, and relevant, which leads to more informed decision-making.
- Popular Tools for B2B Data Enrichment:
- Factors.AI – Offers real-time updates, firmographic and technographic insights, and CRM integration.
- Clearbit – Provides access to over 85 data points and integrates with Salesforce, Marketo, and HubSpot.
- ZoomInfo – Uses AI and machine learning for accurate data, with tailored solutions for sales and marketing.
- InsideView – Provides detailed market intelligence and CRM integration.
- Lusha – Focuses on accurate contact information with an easy-to-use interface.
When it comes to B2B marketing and sales, data accuracy is your secret weapon. Think of it as the magic ingredient that makes your strategies sizzle, your sales soar, and your business decisions spot-on. In a market where staying ahead means everything, having the right data at your fingertips is key—and that’s where B2B data enrichment tools come in.
These tools are like superheroes for your data, taking basic, raw information and transforming it into powerful, actionable insights. They gather, validate, and update your data, ensuring you’re always familiar with the freshest and most relevant details about your prospects and clients. By pulling in data from various sources, these tools give you a 360-degree view of your potential customers, helping you understand what makes them tick.
Why does data enrichment matter so much?
Raw data is often messy—it can be inaccurate, duplicated, or missing crucial details. That’s where data enrichment steps in, cleaning up the mess and filling in the gaps. The result? A pristine dataset that drives smarter strategies and uncovers golden opportunities.

With enriched data, you can slice and dice your audience like a pro, crafting marketing messages that hit the bullseye and sales pitches that speak directly to each prospect. You’ll be able to create campaigns that truly resonate, boosting engagement and conversions. Plus, your sales team can zero in on the hottest leads, making the most of every opportunity.
The bottom line is that B2B data enrichment tools are game-changers. They ensure your data is top-notch, giving you the insights you need to supercharge your marketing and sales efforts. By using these tools, you’ll make smarter decisions, fine-tune your strategies, and watch your business thrive.
Benefits of B2B Data Enrichment Tools
- Improved Customer Segmentation:
- Accurate Data: Enriched data allows for precise customer segmentation, enabling businesses to classify their audience based on specific attributes.
- Tailored Marketing Efforts: With better segmentation, marketing campaigns can be more personalized, addressing each segment's unique needs and preferences.
- Increased Relevance: Targeted messages resonate more with recipients, leading to higher engagement and conversion rates.
- Enhanced Sales Productivity:
- Salesforce Study Insights: According to a Salesforce study, businesses that utilize data enrichment tools experience a 28% increase in sales productivity.
- Streamlined Processes: Thanks to enriched data, sales teams spend less time searching for information and more time engaging with prospects.
- Better Lead Scoring: Accurate data helps identify high-quality leads, allowing sales teams to focus on prospects with the highest potential.
- Higher Marketing ROI:
- Marketing Efficiency: The same Salesforce study highlights a 25% rise in marketing ROI for businesses using data enrichment tools.
- Optimized Campaigns: Enriched data helps design marketing strategies that are more likely to succeed, reducing wasteful spending.
- Improved Targeting: Accurate customer data ensures marketing efforts reach the right audience, enhancing the return on investment.
- Reduced Bounce Rates:
- Accurate Contact Information: Data enrichment tools ensure up-to-date contact information, significantly lowering the chances of emails bouncing.
- Enhanced Deliverability: Clean and accurate data improve email deliverability rates, ensuring marketing messages reach their intended recipients.
- Higher Engagement: Email campaigns with valid contact details are more effective, leading to better engagement metrics.
- Effective Email Campaigns:
- Up-to-date Information: Enriched data keeps contact details current, enhancing the relevance and timeliness of email content.
- Personalized Content: Accurate data enables personalized email marketing, increasing the likelihood of positive responses.
- Better Metrics: Enhanced data quality leads to improved open and click-through rates, making email campaigns more successful.
- Comprehensive Customer Profiles:
- 360-Degree View: Data enrichment provides a complete view of customers, integrating various data points to build comprehensive profiles.
- Informed Decision-Making: Businesses can make better-informed decisions regarding product development and marketing strategies with detailed customer insights.
- Customer Relationship Management: Enriched data helps maintain strong customer relationships by better understanding their needs and preferences.
- Competitive Advantage:
- Market Insights: Enriched data offers valuable insights into market trends and competitor activities.
- Strategic Planning: Businesses can leverage these insights to devise strategic plans that outperform competitors.
- Proactive Approach: Accurate and timely data allows businesses to anticipate market changes and respond proactively.
Using B2B data enrichment tools, businesses can significantly enhance their operational efficiency, marketing effectiveness, and overall market competitiveness.
{{INLINE_MOFU}}
Also read: ZoomInfo Pricing in 2026: Plans, Costs, Alternatives & Overview
Key Features of Effective B2B Data Enrichment Tools
Effective B2B data enrichment tools offer several key features that enhance their utility and efficiency:
- Real-time Data Updating:
- Ensures Data is Always Current: Real-time updates guarantee the information is always up-to-date, reducing the risk of using outdated or incorrect data. This is critical for maintaining accurate customer profiles and making informed business decisions.
- Enhanced Decision Making: Access to the latest data enables businesses to make timely and more accurate decisions, improving overall strategy and operations.
- Integration with CRM Systems:
- Seamless Integration: These tools integrate effortlessly with popular CRM systems like Salesforce and HubSpot, ensuring that enriched data is readily accessible within existing workflows.
- Improved Data Consistency: Integration ensures that all team members have access to the same updated information, which promotes consistency and accuracy across the organization.
- Efficiency and Automation: This feature streamlines processes by automating data entry and updates, freeing up time for sales and marketing teams to focus on strategic activities.
- Customizable Data Fields:
- Tailored to Specific Needs: Customizable fields allow businesses to define and prioritize the data points most relevant to their needs and industry requirements.
- Enhanced Data Relevance: Ensures that the data collected and enriched aligns perfectly with the business objectives, enhancing its relevance and usability.
- Scalability: As business needs evolve, the ability to customize data fields ensures that the tool can scale and adapt to changing requirements without major overhauls.
- Comprehensive Data Sources:
- Diverse Data Inputs: Effective tools pull data from various sources, including social media, financial records, and public databases, ensuring a holistic view of each customer or prospect.
- Increased Data Accuracy: Combining multiple data sources reduces the likelihood of errors and enhances the overall accuracy of the information.
- Data Compliance and Security:
- User-Friendly Interface:
- Ease of Use: The tool's user-friendly interface ensures that all team members can use it efficiently, regardless of their technical expertise.
- Reduced Training Time: An intuitive design reduces the time and resources required for training, enabling quicker adoption and usage.
Popular B2B Data Enrichment Tools
When it comes to enhancing B2B data, several B2B Data Enrichment tools stand out due to their robust features and reliability. Here are some of the most popular options:
- Factors AI

Factors.AI uses AI-driven analytics to improve B2B data quality by offering actionable insights and predictive analytics, helping businesses make informed decisions and refine their data strategies.
Also read: Cognism Pricing 2026: Plans, Costs & Alternatives
- Extensive Data Coverage: Factors.AI provides comprehensive data enrichment by offering detailed firmographic, technographic, and behavioral insights to enhance your B2B data.
- Real-Time Updates: The platform ensures your data is continuously updated with real-time information, keeping your insights accurate and relevant.
- Integration Capabilities: Factors.ai integrates smoothly with popular CRM and marketing automation tools like Salesforce and HubSpot, allowing seamless data synchronization.
- Customizable Insights: Factors.ai offers customizable analytics and reporting features, enabling businesses to tailor data views and insights to their specific needs.
- Pricing: Pricing information for Factors.ai is available upon request, with options designed to cater to various business requirements.
- Clearbit

Clearbit provides B2B data enrichment solutions that integrate seamlessly with CRM and marketing systems. These solutions deliver enriched customer profiles and real-time insights to enhance targeted outreach and lead quality.
- Extensive Data Coverage: Clearbit offers access to over 85 data points, including firmographics, technographics, and social profiles.
- Real-Time Updates: The tool provides real-time data enrichment, ensuring your information is always current.
- Integration Capabilities: Clearbit integrates seamlessly with platforms like Salesforce, Marketo, and HubSpot.
- Pricing: Plans start at $99/month for basic features.
- ZoomInfo

ZoomInfo offers B2B data enrichment through its extensive database and advanced AI capabilities, helping businesses identify key prospects, improve lead quality, and streamline sales and marketing efforts.
- Detailed Company Profiles: ZoomInfo offers in-depth company and contact information, including revenue, employee count, and key decision-makers.
- AI and Machine Learning: Utilizes advanced AI and machine learning algorithms to provide accurate and up-to-date data.
- Sales and Marketing Intelligence: Tailored solutions for sales and marketing teams to identify and connect with potential leads.
- Pricing: Pricing is customized based on the size and needs of the business.
- InsideView

InsideView, now part of Demandbase, InsideView delivers powerful B2B data enrichment tools that gather and analyze market intelligence, aiding businesses in understanding their target audience and refining their sales and marketing strategies.
- Comprehensive Market Intelligence: InsideView provides a deep market understanding with detailed industry data, news, and trends.
- CRM Integration: Seamlessly integrates with major CRM systems like Salesforce, Microsoft Dynamics, and SugarCRM.
- Targeted Prospecting: Helps businesses identify and target the right prospects with precise market segmentation.
- Pricing: Offers a free version with limited features; premium plans start at $99/month.
- Lusha

Lusha focuses on B2B data enrichment by providing accurate contact information and company insights, enhancing lead generation and sales prospecting with its user-friendly platform and extensive database.
Also read: Factors.ai vs Cognism: The GTM Platform Breakdown
- Contact Information Accuracy: Lusha specializes in providing highly accurate contact information, including email addresses and phone numbers.
- User-Friendly Interface: Easy-to-use interface that simplifies the data enrichment process.
- Browser Extension: Offers a browser extension for quick access to data while browsing LinkedIn or company websites.
- Pricing: Free plan available; premium plans start at $75/month.
How to Choose the Right B2B Data Enrichment Tool

According to a study by Dun & Bradstreet, businesses that leverage data enrichment experience a 28% increase in lead conversion. That is why, when selecting a data enrichment tool, consider the following factors:
- Business Needs: Align the tool's capabilities with your specific requirements. Identify the data type to enrich and ensure the tool meets these needs. For example, if you focus on improving sales and marketing data, look for tools specializing in those areas. Understanding your goals will help narrow down your choices and ensure the tool adds value to your operations.
- Data Sources and Accuracy: Ensure the tool sources data from reliable and accurate databases. High-quality data sources are crucial for effective data enrichment. Verify the credibility of the data providers and check for consistency and accuracy in the data they supply. According to a report by Experian, 75% of companies believe that inaccurate data impacts their ability to deliver an excellent customer experience.
- Integration Capabilities: Check if the tool integrates seamlessly with your existing CRM and other systems. Smooth integration is essential for maintaining workflow efficiency and ensuring data consistency across platforms. Tools that offer robust API support or native integrations with popular CRMs like Salesforce, HubSpot, or Microsoft Dynamics can significantly streamline your processes.
- Pricing: Evaluate the cost in relation to the features offered. It's important to balance your budget with the tool's capabilities. Consider the ROI by assessing how the tool's features can drive your business objectives. Some tools offer tiered pricing models or custom quotes based on your specific needs, which can be advantageous for growing businesses.
- User Experience and Support: Assess the tool’s user interface and the quality of customer support. A user-friendly interface can significantly reduce the learning curve, while responsive customer support can help resolve issues promptly, ensuring minimal disruption to your business.
Implementation and Best Practices
An article by Forbes mentions that data-driven businesses are 23 times more likely to acquire customers and 19 times more likely to be profitable. That is why, implementing a B2B data enrichment tool involves several crucial steps to ensure optimal performance and accuracy. Here’s a detailed guide:
- Integration:
- Connect the Tool with Your CRM: Ensure seamless integration between the data enrichment tool and your CRM system. This connection allows for automatic data updates and minimizes manual data entry.
- Integration with Other Data Management Systems: In addition to the CRM, integrate the tool with other relevant data management systems, such as marketing automation platforms and sales tools, to streamline data flow and maintain consistency.
- Utilize API Integrations: Use API integrations to facilitate real-time data updates. This ensures that your system always has the most current and accurate information.
- Data Mapping:
- Customize Data Fields: Tailor the data fields within the tool to match your specific business requirements. This customization helps capture relevant data points crucial for your operations.
- Standardize Data Formats: Ensure that all data is standardized to avoid inconsistencies. This includes formats for phone numbers, addresses, and other critical data fields.
- Create Data Mapping Templates: Develop templates for data mapping to simplify the process and ensure consistency across different datasets.
- Ongoing Maintenance:
- Regular Data Updates: Schedule regular updates to your data to keep it accurate and relevant. This can be automated to ensure consistency and reduce manual efforts.
- Data Cleaning: Periodically clean your data to remove duplicates, correct errors, and update outdated information. This helps in maintaining the overall health of your database.
- Monitor Data Quality: Implement monitoring tools to track data quality. This includes checking the data's accuracy, completeness, and relevance.
Also read: 10 Best Visitor Queue Alternatives For B2B Teams
- Best Practices:
- Define Clear Objectives: Before implementation, clearly define your goal with the data enrichment tool. This will help you select the right tool and set measurable goals.
- Involve Key Stakeholders: Engage stakeholders from different departments to ensure the tool meets cross-functional needs.
- Continuous Training: Provide ongoing training to your team on how to use the tool effectively. This includes regular updates on new features and best practices.
- Measure ROI: Continuously measure the tool's return on investment (ROI) to ensure it delivers value. Use metrics such as data accuracy improvements and time saved in data management.
Implementing a B2B data enrichment tool effectively can significantly enhance data quality and overall business efficiency.
Top B2B Data Enrichment Tools
Data enrichment tools help businesses transform basic information into comprehensive insights, leading to more effective targeting and decision-making in B2B marketing and sales.
1. Top Platforms: Factors.AI, Clearbit, ZoomInfo, InsideView, and Lusha.
2. Key Features:
- Factors.AI: AI-driven analytics, firmographic and technographic insights, real-time updates, and seamless CRM integration.
- Clearbit: 85+ data points for customer profiles, smooth integrations with platforms like Salesforce, Marketo, and HubSpot.
- ZoomInfo: AI and machine learning-powered, accurate and up-to-date data, tailored for sales and marketing teams.
- InsideView: Detailed market intelligence, industry trends, and CRM integration.
- Lusha: Accurate contact information, user-friendly interface, and lead generation focus.
3. Strategic Benefits:
- Improve targeting and segmentation with enhanced data accuracy.
- Optimize marketing and sales efforts with real-time data updates.
- Leverage AI-driven insights to drive better decision-making and campaign performance.
Implementing these data enrichment tools helps refine marketing strategies, boost lead generation, and support data-driven sales efforts for enhanced ROI.
In a nutshell
B2B data enrichment tools are essential for maintaining data accuracy and driving effective marketing and sales strategies. By enriching data, businesses can gain deeper insights into their target audience, enabling more personalized and effective marketing campaigns. Accurate data helps identify potential leads, understand customer needs, and enhance customer relationships.
Also read: 10 Best Madison Logic Alternatives And Competitors In 2026
Data enrichment tools continue to play a crucial role in helping businesses stay competitive. These tools are continually updated to incorporate new data sources and advanced analytics, ensuring businesses have the most relevant and up-to-date information. Staying ahead in the competitive market requires choosing the right tool that fits your business needs and goals.
Select a tool that offers comprehensive data coverage, ease of integration, and scalability. Implement best practices such as regular data audits, data cleansing, and adherence to data privacy regulations to ensure data quality. Utilize insights from data enrichment to refine marketing strategies, improve customer targeting, and increase sales efficiency.
By following these steps and best practices, businesses can leverage data enrichment tools to their fullest potential, ensuring accurate and actionable data that drives informed decision-making.
Top 11 Servicebell Alternatives
Explore the best Servicebell alternatives, including Apollo.io, Factors.ai, ZoomInfo Sales, and more. Compare features such as automation, integration, and analytics to find the right solution for your business.
TL;DR
- Servicebell is a real-time customer engagement tool, but businesses may need alternatives with broader capabilities, such as automation, analytics, and sales optimization.
- Among the top alternatives:some text
- Factors.ai is ideal for businesses focused on data-driven marketing. It offers AI-driven analytics, multi-channel attribution, and workflow automation. Its CRM and marketing platform integrations, especially for LinkedIn campaigns, make it a top choice for B2B companies aiming to optimize outreach and sales strategies.
- Apollo.io offers powerful sales automation and lead generation with a large contact database and CRM integration.
- ZoomInfo Sales is a premium option with high-quality B2B data and sales intelligence for optimizing pipelines.
- HubSpot Sales Hub combines CRM, sales automation, and lead nurturing, making it a versatile tool for small businesses.
- Salesforce Marketing Cloud Account Engagement (formerly Pardot) is a robust, high-end marketing automation platform for larger enterprises.
Servicebell is a real-time customer engagement tool that allows businesses to interact with website visitors. Whether answering questions or offering assistance, Servicebell helps companies provide exceptional customer service at critical touchpoints. However, as businesses evolve, they might require more tailored tools or a platform that integrates additional features. Luckily, many viable alternatives offer different capabilities to suit varied business needs.
Each platform offers unique strengths, so the best alternative depends on your specific business goals, from live chat engagement to comprehensive analytics and sales optimization. Factors.ai stands out for businesses needing deeper marketing insights and automation.
About Servicebell

Servicebell allows businesses to engage visitors directly through live chat and video calls on their website. It's ideal for companies looking to provide immediate, personalized support and increase conversions through real-time communication.
Key Features:
- Live Chat & Video Calls:
Connect with website visitors instantly, offering assistance or product support as they browse.
- Targeted Engagement:
Customize how and when to engage visitors based on behavior or specific triggers.
- Visitor Insights:
Track visitor behavior, such as time spent on pages, to understand customer needs and improve engagement strategies.
{{INLINE_CTA_A}}
Pros:
- Easy to use for live communication.
- Enables personalized visitor interactions.
- Simple setup for instant website integration.

Cons:
- Limited in terms of automation compared to some competitors.
- Primarily focused on engagement rather than broader marketing and sales tools.
Pricing:
Servicebell has a free plan with limited features, while its paid plans start at around $49 per month, offering more customization and engagement capabilities.
Top Servicebell Alternatives
Let’s explore some alternatives to Servicebell that provide enhanced capabilities for customer engagement, lead generation, and marketing automation.
1. Factors.ai
Factors.ai is a cutting-edge AI-driven marketing analytics platform that helps businesses analyze and optimize their marketing efforts. It uses AI to provide actionable insights into customer behavior, making it a great alternative to Servicebell for companies focused on marketing analytics and customer journey optimization.
Key Features:
- AI-Driven Analytics: Leverage AI to analyze customer interactions and optimize marketing strategies.
- Journey Mapping: Visualize and understand the customer journey in real-time.
- Campaign Performance Tracking: Measure the effectiveness of marketing campaigns across different channels.
- Detect Churn Signals: With Factors, you can detect churn signals such as your existing customers visiting competitors’ G2 pages. With such insights you can also prevent customer ch

Pros:
- Excellent for businesses focused on data-driven decision-making.
- Provides deep insights into customer behavior, which can enhance engagement strategies.
- Intuitive interface with easy-to-understand visualizations.
Cons:
- Not as focused on real-time customer interaction as Servicebell.
- Some features may be complex for businesses with limited technical expertise.
Pricing:
Factors.ai offers custom pricing based on business needs, and it provides a free trial for new users.
{{INLINE_CTA_A}}
2. ZoomInfo Sales

ZoomInfo Sales is a market intelligence platform designed to improve your sales team's prospecting efforts by providing detailed data on potential customers and their buying behaviors.
Key Features:
- B2B Database: Access to rich company and contact data.
- Sales Intelligence: Provides insights into buying signals and intent data.
- Pipeline Management: Helps track and optimize the sales pipeline.

Pros:
- Extensive database with high-quality B2B data.
- Advanced search filters for precise targeting.
- Integrates with popular CRM platforms.
Cons:
- Can be expensive, especially for small businesses.
- Complex data interface, which can be overwhelming for beginners.
Pricing:
ZoomInfo Sales starts at $10,000 annually for its most basic plan.
{{INLINE_CTA_A}}
3. FlashRev

FlashRev is a customer engagement tool that specializes in enabling real-time interaction with website visitors, making it a great alternative to Servicebell for businesses focused on immediate customer support and lead generation.
Key Features:
- Live Interaction: Offers chat, voice, and video communication with website visitors.
- Behavioral Targeting: Engage users based on real-time activity and behavior.
- Analytics: Provides insights into visitor behavior and engagement success.

Pros:
- Easy to use, with quick setup.
- Real-time visitor engagement to boost conversions.
- Affordable for small businesses.
Cons:
- Lacks the depth of automation seen in larger platforms.
- Limited integrations with CRMs.
Pricing:
FlashRev offers competitive pricing starting from $29 per month.
4. HubSpot Sales Hub

HubSpot Sales Hub is a robust platform that combines CRM, sales automation, and lead nurturing tools, making it a versatile solution for businesses looking to streamline both their marketing and sales efforts.
Key Features:
- Free CRM: HubSpot offers a free CRM with basic features for managing customer data.
- Sales Automation: Automate repetitive sales tasks, such as follow-up emails.
- Pipeline Management: Keep track of all stages of the sales process.

Pros:
- User-friendly interface, even for beginners.
- Free CRM and affordable paid plans for small businesses.
- Wide range of integrations, including marketing tools.
Cons:
- Some features, like reporting, are limited in the free version.
- Scaling may require upgrading to more expensive tiers.
Pricing:
HubSpot Sales Hub offers a free plan, with paid plans starting at $50 per month.
{{INLINE_CTA_A}}
5. Adapt

Adapt offers B2B contact data, lead generation, and sales intelligence tools for businesses looking to scale their outreach and prospecting efforts.
Key Features:
- Lead Generation: Access to over 300 million contacts across various industries.
- Data Quality: Adapt’s database is regularly updated to ensure accuracy.
- Email Sequencing: Automate outreach campaigns with tailored email sequences.

Pros:
- Affordable compared to other lead generation tools.
- Good for small businesses and startups.
- Decent contact data for scaling prospecting efforts.
Cons:
- Data quality can sometimes vary.
- Limited CRM integrations compared to competitors.
Pricing:
Adapt has a free version, with paid plans starting at $99 per month.
6. Salesforce Marketing Cloud Account Engagement

Salesforce Marketing Cloud Account Engagement (formerly Pardot) is a marketing automation platform that enables businesses to create personalized customer journeys and drive sales through highly targeted campaigns.
Key Features:
- Marketing Automation: Create personalized email campaigns, nurture leads, and manage prospects.
- CRM Integration: Seamless integration with Salesforce CRM for lead tracking and sales management.
- Lead Scoring: Identify high-quality leads through advanced lead scoring.

Pros:
- Perfect for larger businesses needing comprehensive marketing automation.
- Highly customizable for different marketing and sales needs.
- Seamless Salesforce integration.
Cons:
- Expensive compared to smaller tools.
- Requires more technical expertise to use advanced features.
Pricing:
Salesforce Marketing Cloud Account Engagement plans start at $1,250 per month.
{{INLINE_CTA_A}}
7. Talkdesk

Talkdesk is a cloud-based contact center platform that enables businesses to improve their customer service through AI-driven solutions and multichannel communication.
Key Features:
- Omnichannel Communication: Handle customer queries via phone, email, chat, and more.
- AI-Powered Analytics: Leverage AI for customer insights and service improvements.
- Integrations: Supports integration with various CRMs and sales tools.

Pros:
- Great for scaling customer support operations.
- Offers AI-driven insights for better service.
- Strong multi-channel support.
Cons:
- Can be expensive for smaller companies.
- Requires some technical know-how to set up advanced features.
Pricing:
Talkdesk offers pricing upon request based on company needs.
8. Nice CXone

Nice CXone is an omnichannel cloud contact center solution that enables businesses to offer exceptional customer experiences through AI-driven interactions.
Key Features:
- Omnichannel Contact Center: Manage interactions across phone, chat, email, and social channels.
- AI-Powered Automation: Automate repetitive customer interactions to improve efficiency.
- Workforce Optimization: Tools for managing and optimizing customer service teams.

Pros:
- Comprehensive contact center features for large enterprises.
- AI-driven capabilities for better customer experiences.
- Scales easily with business growth.
Cons:
- Expensive and complex for small businesses.
- Requires in-depth technical knowledge for optimal use.
Pricing:
Nice CXone offers custom pricing based on business needs.
{{INLINE_CTA_A}}
9. Popl - Digital Business Card Platform

Popl is a digital business card platform that allows users to share contact details and information instantly with a simple tap, reducing the need for traditional business cards.
Key Features:
- Digital Business Cards: Share contact info via NFC or QR code.
- Mobile App: Manage and customize your business card through a user-friendly app.
- CRM Integration: Sync contacts with popular CRMs.

Pros:
- Eco-friendly and reduces the need for physical cards.
- Easy to use and customizable.
- Ideal for networking at events and conferences.
Cons:
- Limited features for deeper lead management.
- Primarily useful for individual professionals rather than larger sales teams.
Pricing:
Popl offers a free basic plan, with paid plans starting at $4.99 per month for additional customization and CRM integration features.
10. Keap

Keap (formerly Infusionsoft) is an all-in-one CRM and marketing automation tool for small businesses. It helps teams manage contacts, automate follow-ups, and streamline sales processes.
Key Features:
- Marketing Automation: Automate emails, workflows, and tasks to nurture leads and customers.
- CRM: Manage contacts, segment your audience, and track interactions.
- Appointment Scheduling: Easily schedule appointments with clients and prospects.

Pros:
- Affordable solution for small businesses looking to streamline sales and marketing.
- Excellent customer support and onboarding.
- Simple drag-and-drop email automation builder.
Cons:
- Limited features for larger companies or more complex workflows.
- Some users find the interface slightly dated compared to competitors.
Pricing:
Keap’s pricing starts at $129 per month for its basic plan, and it also offers a free trial.
{{INLINE_CTA_A}}
11. Apollo.io

Apollo.io is an all-in-one sales platform that provides access to a vast database of leads and customers, combined with powerful automation features. It's designed for teams looking to automate prospecting and streamline outreach.
Key Features:
- Lead Generation: Access millions of verified contacts and companies.
- Sales Automation: Automated email sequencing and follow-ups to ensure no leads fall through the cracks.
- CRM Integration: Seamlessly integrates with major CRMs, such as Salesforce and HubSpot.

Pros:
- Comprehensive contact database for effective prospecting.
- Robust sales automation tools.
- Offers analytics to measure campaign performance.
Cons:
- Can be overwhelming for beginners due to its vast features.
- The higher learning curve for new users.
Pricing:
Apollo.io offers a free plan with basic features, while paid plans start at $39 per user per month for more advanced capabilities.
Here’s a quick overview of the top alternatives to Servicebell:
Alternative
Key Features
Starting Price
Apollo.io
Sales automation, lead generation, CRM integration
$39/user/month
ZoomInfo Sales
B2B database, sales intelligence, pipeline management
$10,000/year
FlashRev
Real-time communication, behavioral targeting, analytics
$29/month
HubSpot Sales Hub
CRM, sales automation, pipeline management
Free; $50/month for paid plans
Adapt
Lead generation, email sequencing, data quality
$99/month
Salesforce Marketing Cloud Account Engagement
Marketing automation, lead scoring, Salesforce CRM integration
$1,250/month
Talkdesk
AI-powered customer support, omnichannel communication
Custom pricing
Nice CXone
Omnichannel contact center, AI-driven automation, workforce optimization
Custom pricing
Popl
Digital business cards, mobile app, CRM integration
Free; $4.99/month for paid plans
Keap
CRM, marketing automation, appointment scheduling
$129/month
Factors.ai
AI-driven marketing analytics, customer journey mapping, campaign tracking
Custom pricing
Why Factors.ai is the Best Servicebell Alternative
Factors.ai stands out as an advanced platform designed specifically for revenue-driven teams. It offers a robust suite of features for marketing attribution, analytics, and account intelligence. It is a top contender for those seeking an alternative to Servicebell, especially for businesses that optimize their go-to-market (GTM) strategies.
Key Features and Benefits:
- Marketing Attribution & Analytics:
Factors.ai excels at providing attribution models that help track the performance of multi-channel campaigns. The platform integrates various data points, offering in-depth insights into customer journeys, making it easier to assign ROI accurately to different marketing efforts.
- Automation of Workflows:
One of Factors.ai's standout features is its ability to automate key processes. It allows you to create repeatable playbooks that streamline outreach and engagement, making it a powerful tool for sales and marketing teams.
- Integration Capabilities:
The platform supports seamless integration with CRMs, marketing automation tools (MAPs), and other intent data sources like LinkedIn and G2. This integration allows businesses to have all the necessary insights in one place, simplifying reporting and reducing manual work.
- LinkedIn AdPilot:
Factors.ai provides advanced LinkedIn ad campaign management with features like frequency capping and view-through attribution. This ensures that ad spend is optimized and ROI is maximized, which is crucial for businesses heavily reliant on LinkedIn ads for lead generation.
- Customer Support & User Experience:
Factors.ai has received high ratings for its ease of use and customer support. Its intuitive interface allows teams to set up and begin tracking campaigns quickly, while their support team swiftly addresses any challenges.
While Servicebell focuses more on customer engagement through live interactions, Factors.ai takes a comprehensive approach to help B2B companies engage and convert leads by providing full-funnel analytics. Its automation features make it ideal for teams looking to scale without increasing manual labor, making it a superior choice for businesses looking to streamline marketing and sales processes.
{{INLINE_CTA_A}}
In a Nutshell
Businesses have a wide range of options when looking for alternatives to Servicebell, depending on their specific needs. Whether real-time visitor engagement, AI-powered marketing analytics, or robust sales automation, tools like Apollo.io, Factors.ai, and ZoomInfo Sales offer tailored solutions, even though Servicebell remains an excellent tool for immediate customer interaction, these alternatives can provide more comprehensive features, deeper integrations, and improved scalability for businesses looking to enhance customer engagement and lead-generation efforts.
Top 22 Account-Based Marketing (ABM) Tools for 2026
This guide compares 22 ABM tools on pricing, features, and real customer feedback. Some run your entire motion, while others are more specialist tools.
Quick Summary:
- We have included both full ABM suites and specialist tools. Many teams do not need to replace their entire stack. They need a better way to handle one part of ABM.
- Factors.ai is a strong fit if you want account intelligence, paid activation, sales workflows, and attribution in the same ABM platform without moving into a large enterprise suite.
- Demandbase and 6sense cover some of the broadest enterprise ABM requirements, including intent, account prioritization, advertising, and sales intelligence.
- Bombora is relevant when third-party intent data is the main gap in your existing stack.
- Vector and Influ2 go deeper on contact-level advertising when targeting specific people matters more than reaching the account as a whole.
- Userled and Recotap are worth looking at for LinkedIn-heavy ABM and personalized campaign activation.
- Common Room and Warmly are more useful when the business needis turning buyer signals into sales action.
An account-based marketing platform helps B2B teams identify the accounts they want to reach, understand which ones are showing interest, coordinate marketing and sales activity around those accounts, and measure whether that activity turns into pipeline.
The category now covers a much broader range of products.
Some ABM platforms cover most of the motion, including identification, intent, scoring, advertising, sales workflows, and attribution. Others go much deeper on one job, such as third-party intent or contact-level advertising.
This guide looks at 22 ABM platforms and specialist tools based on what they actually do, how they fit into an existing GTM stack, current pricing where it is published, and what customers say after using them.
What buyers actually care about when evaluating ABM platforms
To understand how teams evaluate ABM platforms in practice, we reviewed more than 200 Factors.ai prospect calls from the past 18 months where competing and adjacent tools came up. Four questions surfaced repeatedly:
- Does the cost make sense for how much of the platform the team will actually use?
- Can the team understand why an account has been prioritized?
- Is the product identifying companies, individual buyers, or both, and how reliable is that data?
- Will it replace parts of the existing stack or sit alongside them?
Why trust us
This article is published by Factors.ai, one of the platforms covered below. We know our own product more closely than the others and want to be upfront about that.
More than 1,000 GTM teams use Factors.ai, including Sprinklr, Descope, and Everstage. Working with these teams gives us a close view of what B2B companies need from an ABM platform.
We checked every product against current vendor documentation and recent customer feedback. We also say when a specialist tool is better suited to a particular job.
Quick Comparison of the Top 5 ABM Platforms
A Detailed Look at the Top 22 ABM Platforms for 2026
1. Factors.ai
Factors.ai is an AI ABM and attribution platform for B2B GTM teams. It helps teams find accounts showing intent, understand why they are active, and turn that information into advertising or sales action. Multi-touch attribution shows how marketing and sales touchpoints contribute to pipeline across the buyer journey.
.avif)
It is one of the few ABM platforms to bring first-party intent, third-party intent, business signals, and technographic data into a single account timeline. You get the context behind an account’s interest, not just the name of a company visiting your website.
Teams can control how these signals affect account scores and choose the outcome their predictive model should forecast.
Scout is Factors.ai's AI layer that lets you investigate account activity and automate workflows. And through the Factors.ai MCP, the same intelligence and actions can be accessed from ChatGPT or Claude, allowing teams to work from the AI tools they already use.
Here's what a few of our customershave to say:
“We saw 23% more MQLs from our ABM campaigns and moved from guesswork to making informed decisions.” Steve Colberg, Head of Growth at Rocketlane.
“Factors gave us the clarity we needed with LinkedIn Ads, which influenced 15% of our enterprise pipeline.” Arun Pattabhiraman, CMO at Sprinklr.
Key features of Factors.ai
- Website visitor identification: Waterfall enrichment identifies more than 75% of visiting companies and adds firmographic and behavioral context.
- Cross-channel activation and attribution: Activate high-intent audiences across LinkedIn, Google, Microsoft Ads, Reddit, StackAdapt, and other paid channels. Multi-touch attribution shows how each channel contributes to pipeline.
- Account intelligence: Website visits, CRM events, campaign activity, and intent can be viewed across the same account journey.
- Scout AI agents: Teams can ask questions about account data in plain English or trigger actions when selected signals appear.
Factors.ai Pricing
Factors publishes four plans and offers startup discounts.
- Lite: $199/month after the trial. Website visitor identification, traffic analysis, and account alerts.
- Basic: $6,000/year. Includes 75%+ company identification, account segmentation, LinkedIn Ads influence reporting, CRM sync, and up to 50 reports.
- Growth: $20,000/year. Adds custom scoring, G2 intent, and more advanced ABM analytics.
- Enterprise: Starts at $30,000/year. Adds predictive account scoring, LinkedIn impression control, dynamic audience syncing, and more advanced intent analysis.
Pros of Factors.ai
- The account journey is easier to follow across channels: Early intent, website activity, advertising, and pipeline can be viewed together rather than reconstructed from separate dashboards. Read the user review.
- Day-to-day campaign analysis is relatively approachable: HubSpot and Salesforce integrations also keep much of the workflow close to systems teams already use.
Cons of Factors.ai
- Reporting can take some setup: Teams wanting highly specific dashboards may need to configure reports before they get the exact view they want. Read the user review.
- Person-level identification is more limited than company identification: If identifying the exact visitor behind anonymous traffic is central to the use case, evaluate coverage closely.
- Full attribution and ad activation require a larger budget: These capabilities are available on the Enterprise plan, which starts at $30,000 a year. This is still below the cost of many enterprise ABM platforms, but may be difficult for an SMB to justify.
2. Demandbase
Demandbase is the company behind Demandbase One, its main ABM platform for sales and marketing. Teams can buy the full platform or start with its Advertising or Data products separately.
Within Demandbase One, account intelligence helps feed advertising, sales workflows, and measurement. Its native B2B DSP is an important distinction for teams that want to run account-based advertising within the platform rather than send audiences to another tool.
One long-time Demandbase user (from our Sales calls) described gaps in a specific form-enrichment workflow, where the company and contact information required by the team was not always returned. The same buyer was not convinced competing platforms used materially different technology.
So, the useful evaluation question is therefore not simply which vendor claims the highest match rate, but whether the platform can reliably return the information required by your most important workflows.
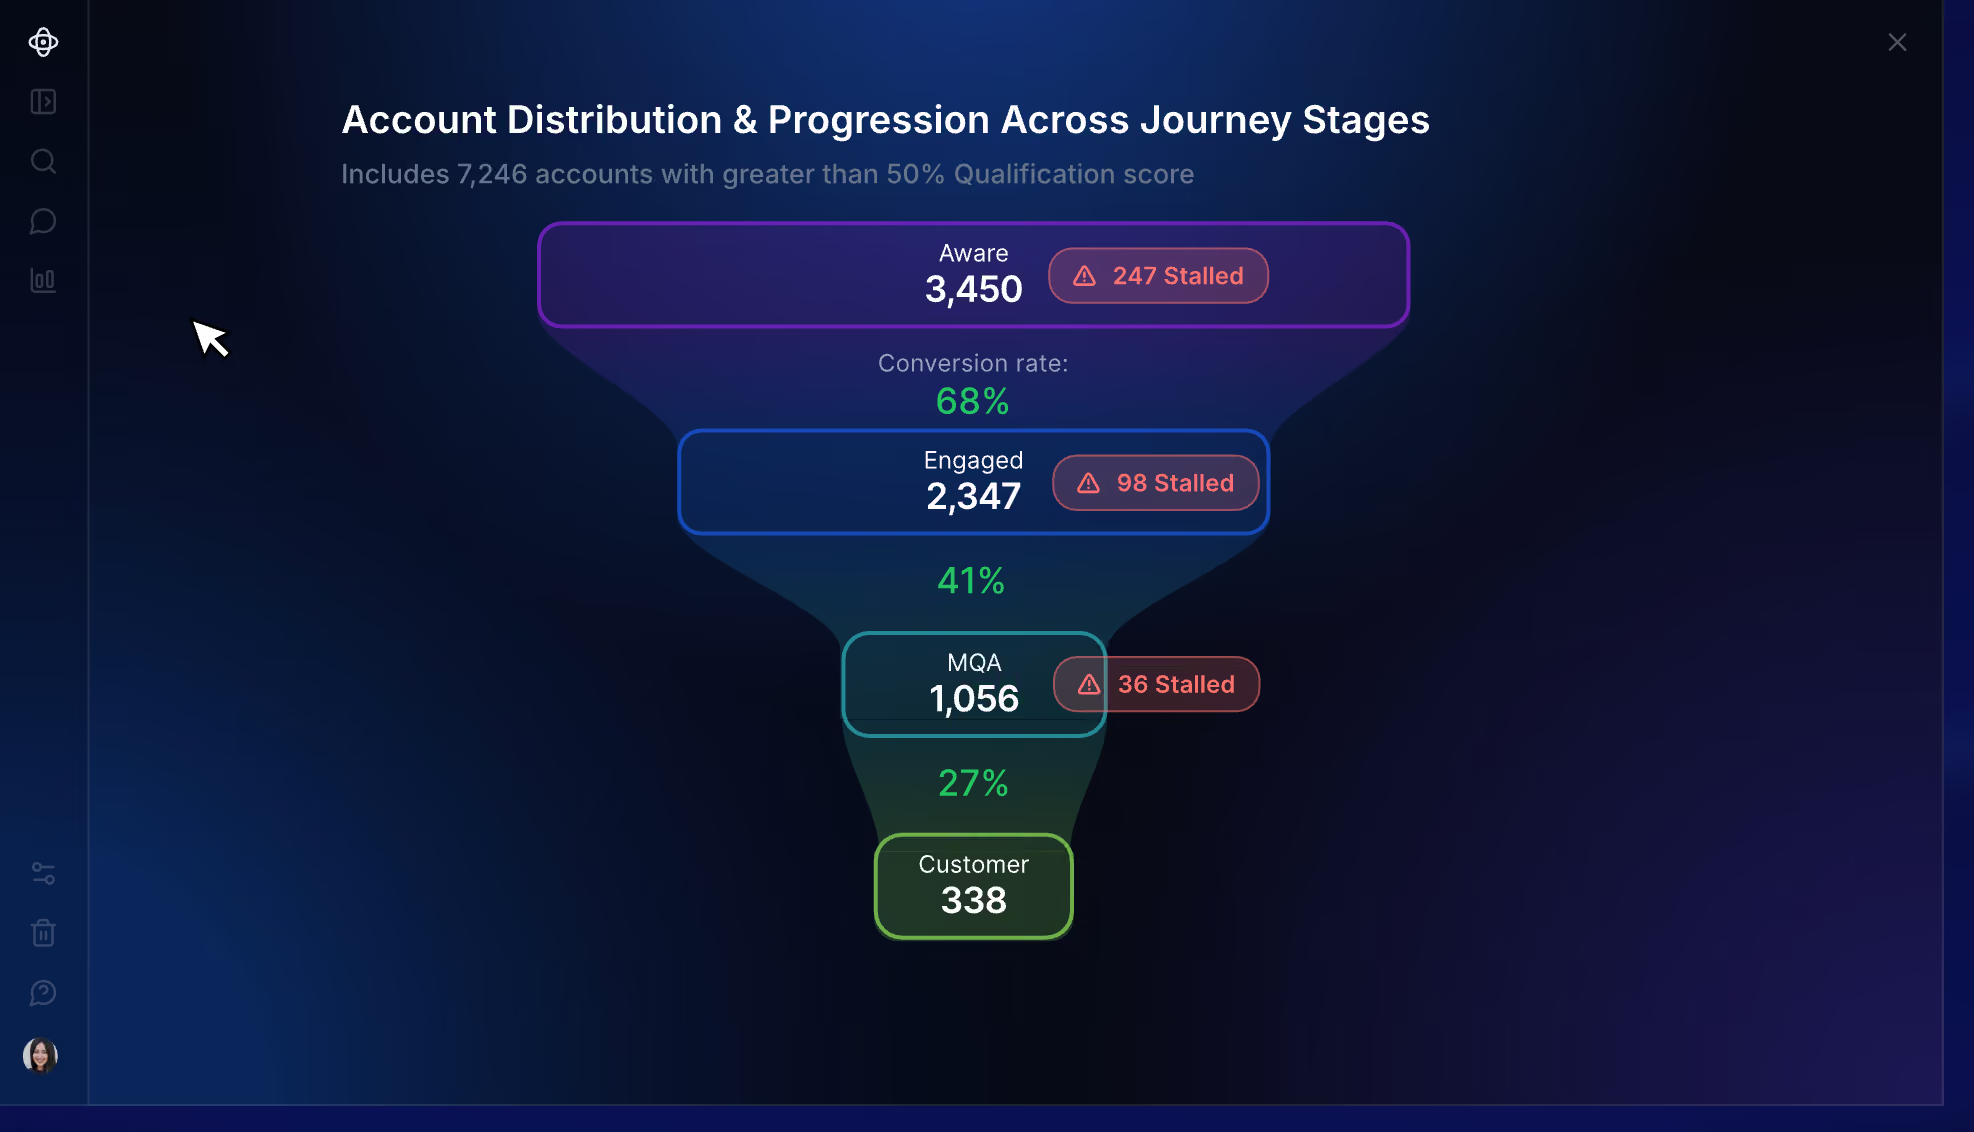
Demandbase Pricing
- Account intelligence: First-party GTM data and third-party signals are used to identify in-market accounts, engagement, and buying groups.
- B2B advertising: Demandbase operates its own DSP for account-based advertising.
- Demandbase AI: Pipeline goals and buying signals feed recommendations about which accounts and GTM plays deserve attention.
- Orchestration and measurement: Account activity can trigger marketing or sales actions and be measured against pipeline.
Pricing of Demandbase
Demandbase does not publish dollar pricing. Contracts use a customized platform fee with additional user fees.
Pros of Demandbase
- Account intelligence goes deep enough for complex prioritization: Marketing and sales have more context before deciding which accounts deserve time or budget.
- Advertising is a substantial part of the product: Teams that want account intelligence to feed directly into media execution do not need a separate DSP. Read the user review.
Cons of Demandbase
- Implementation takes time: Demandbase needs to be configured around your data and GTM process before teams can use it properly.
- Highly customized configurations can take work: Building specific views and setups is not always straightforward. Read the user review.
3. 6sense
6sense is an enterprise ABM platform best known for predicting where accounts sit in the buying journey. Signalverse is the data foundation behind those predictions. It tracks research happening outside your website and pairs it with activity from your own channels. Predictive models use this information to place accounts into buying stages.
Marketing can use prioritized accounts in ad campaigns, while sales reps get account context and contact data for outreach.
Across the calls we reviewed, current and former 6sense users were not usually questioning its feature breadth. However, cost relative to the value the team was getting came up repeatedly.
Key features of 6sense
- Intent data and account identification: Signalverse uses off-site research activity, first-party data, and identity resolution.
- Predictive account scoring: Accounts move through buying stages based on purchase likelihood.
- Advertising: 6sense has its own B2B DSP and can also activate audiences on LinkedIn, Google Ads, and Meta.
- Sales Intelligence and RevvyAI: Sales teams get account prioritization, contact data, alerts, and AI-generated account context.
6sense Pricing
6sense does not publish pricing for Revenue Marketing or its paid Sales Intelligence configurations. All require a custom quote.
Based on Vendr’s procurement data, smaller contracts can start at around $50,000 a year, while larger enterprise agreements can exceed $300,000. The final price depends on the products purchased, data credits, and the size of the deployment. Advertising spend is charged separately.
Pros of 6sense
- Intent and predictive stages help narrow a large market: This is useful when the main problem is deciding which part of a large TAM deserves attention now.
- Sales gets useful context before outreach: Reps can see account activity and buying signals alongside contact information. Read the user review.
Cons of 6sense
- Getting comfortable with the platform can take time: There is a meaningful learning curve once teams move beyond the basic workflows.
- Scoring transparency is worth testing during evaluation: Buyers evaluating 6sense raised this concern repeatedly. The platform shows the signals contributing to its predictions and allows teams to configure inputs, but it does not expose the internal mathematical weightings used by the model. This matters if you want direct control over how each signal affects an account score. Read the G2 review
- More involved services may add to the implementation footprint: Custom integrations, training, and deeper technical support can sit within the Professional Services add-on. Read the user review.
Recommended Read: 6sense alternatives
4. Fibbler
LinkedIn’s native analytics become limited when you want to connect campaign activity with pipeline. You can see how an ad performed, but it is harder to tell which companies were exposed and whether those accounts later became opportunities.
Fibbler handles this through LinkedIn’s Company Intelligence API. It matches paid and organic engagement with company records in your CRM, including impressions that never led to a click or form fill. Google Ads attribution is available as a separate add-on.
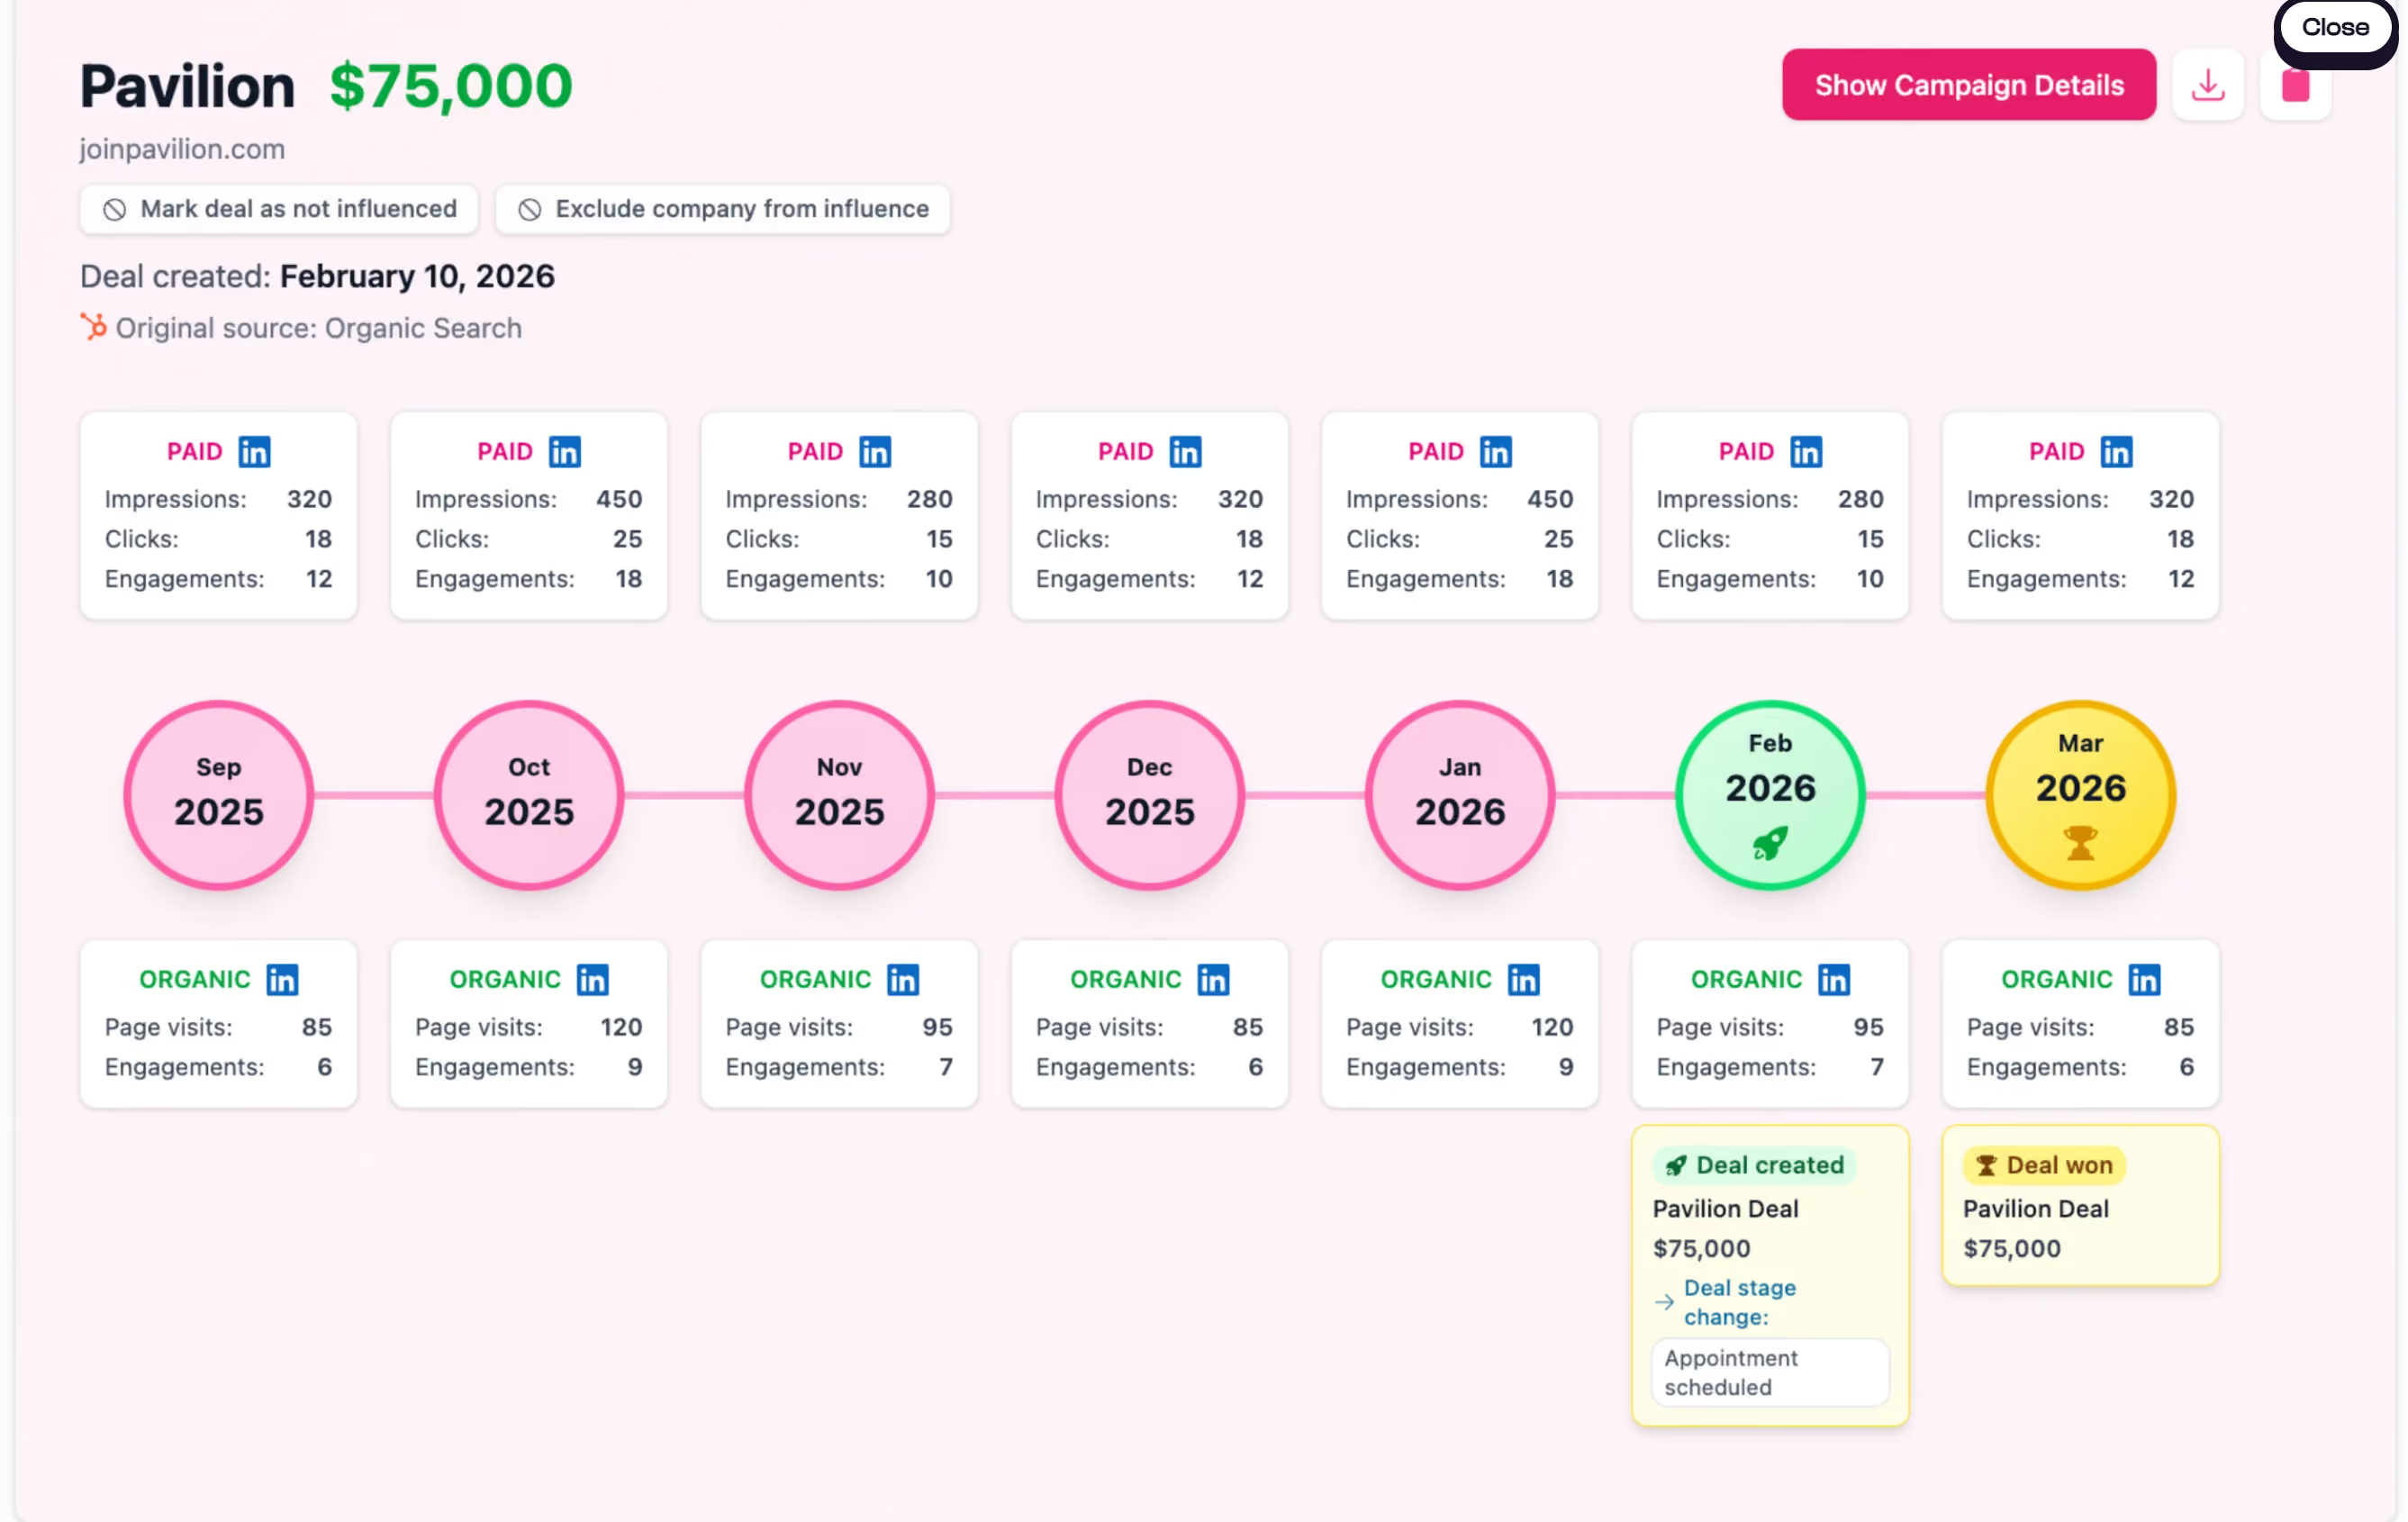
Key features of Fibbler
- LinkedIn revenue attribution: Company-level impressions and engagement can be connected with CRM pipeline.
- Account journeys: Each company gets a timeline showing advertising activity before an opportunity is created or closed.
- LinkedIn campaign controls: Marketers can cap impressions, schedule campaigns, exclude irrelevant job titles, and pass engagement signals into other systems.
Fibbler Pricing
- Growth: $89/month
- Unlimited: $129/month
- Agency: $159/month
- Google Ads: $59 per account/month
A 30-day free trial is available.
Pros of Fibbler
- The reporting goes beyond campaign metrics: It places ad spend alongside influenced pipeline and closed-won revenue, making LinkedIn’s commercial impact easier to explain.
- Setup is quick: Users report getting Fibbler running without the lengthy configuration associated with broader ABM and attribution platforms. Read the user review.
Cons of Fibbler
- Channel coverage is limited: LinkedIn is the core product, while Google Ads requires a separate add-on. Teams running campaigns elsewhere will need another attribution platform.
- Identification stops at the company level: You can see which company engaged, but not the individual behind the activity. Sales may need another data provider before acting on the signal.
5. Bombora
Bombora provides third-party intent data for teams that already have the rest of their ABM stack in place. Company Surge, its core product, identifies when a company is researching a topic more heavily than it normally does. This helps teams distinguish growing interest from routine research activity.
You can try this yourself. Factors and Bombora built a free tool that surfaces companies actively researching your category.
MiQ used Company Surge to expand a target list of roughly 1,000 companies with additional in-market accounts. According to Bombora, the expanded audience was 115% larger and generated 89% more incremental leads.
Key features of Bombora
- Company Surge: Compares research across selected topics with each company’s historical activity. A score of 60 or higher indicates a statistically significant increase.
- Intent-based audiences: Company Surge audiences can be activated through platforms such as LinkedIn, Reddit, and StackAdapt, as well as major DSPs.
- B2beacon: Measures advertising reach and engagement at the account and buying-group level using direct integrations with advertising platforms.
Bombora Pricing
Bombora does not publish pricing for Company Surge. Buyers need a custom quote.
Pros of Bombora
- Signals are relative to each account: Company Surge looks for increases against a company’s usual research activity instead of treating every content interaction as intent.
- It fits into an existing stack: Bombora feeds intent data into the platforms you already use for targeting and sales follow-up.
Cons of Bombora
- Results depend on topic selection: Broad or poorly chosen topics can produce noisy account lists. Teams still need to decide which signals are strong enough to act on. Read the user review.
- It does not run the wider ABM program: Bombora provides intent data, advertising audiences, and campaign measurement. Campaign execution and sales orchestration happen in other tools.
6. Vector
Vector is a niche tool in the ABM space. It is designed for demand gen teams that want to build ad audiences around named buyers instead of targeting whole accounts.
For the contacts it can identify, Vector uses website activity, ad engagement, and off-site research to keep paid audiences current. After a late-2025 repositioning away from sales-led outbound, this became the product’s main focus. Audiences can be synced across LinkedIn, Google, Meta, Reddit, and other supported channels.
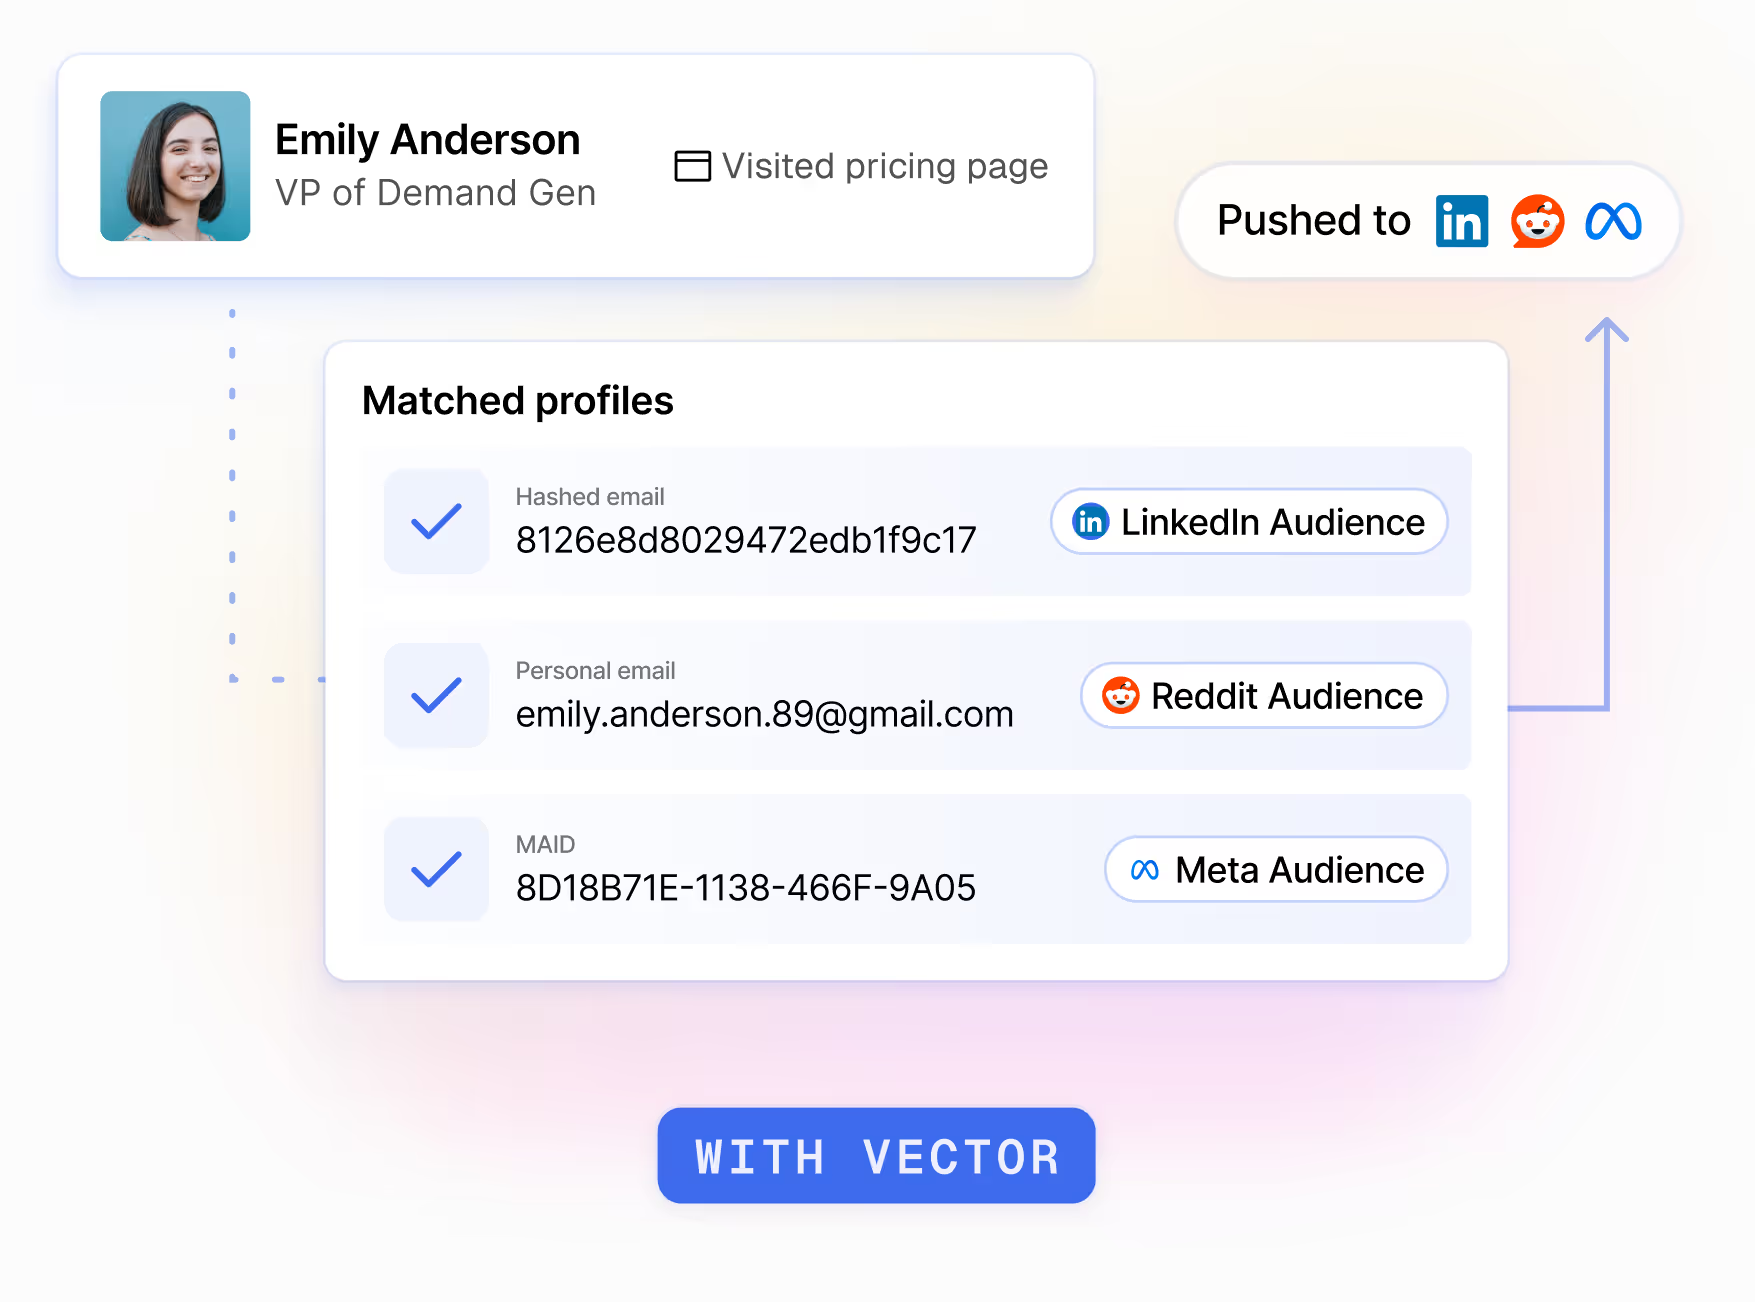
Key features of Vector
- Reveal and Ad Reveal: Identifies some website visitors and ad clickers by name, title, and company.
- Off-site research: Surfaces contacts researching relevant topics or competitors before they visit your website.
- Signal-driven audiences: Adds or removes contacts as buyer activity changes, then syncs the updated audiences with connected ad platforms.
Vector Pricing
- Reveal: From $399 to $999/month, depending on identified visitor volume. A 14-day free trial is available.
- Target: Starts at $3,000/month with an annual commitment. Pricing scales with the number of active audiences.
Pros of Vector
- Advertising can target known buyers: Marketers have more control over who enters an audience and can preview the contacts before launching a campaign. Read the user review.
- Audiences update automatically: Buyer activity can move directly into paid campaigns without repeated CSV uploads.
Cons of Vector
- It is not a full ABM suite: Broader account scoring, journey analytics, and sales orchestration still require other tools.
- Website identification is partial: Vector says it surfaces 15% to 30% of website traffic at the contact level. Actual match rates vary by traffic source.
- Contact-level activation requires a sizeable commitment: The Target plan starts at $36,000 per year, which may put it beyond the budget of smaller teams.
7. AdRoll ABM
AdRoll ABM is the current name for RollWorks, which was rebranded in August 2025. The platform includes buyer insights and orchestration, but advertising and retargeting remain the clearest reasons to consider it. It fits ABM programs where paid media does much of the work of reaching target accounts.
The call research from Factors.ai points to the same strength. Two teams kept RollWorks for programmatic advertising while adding a separate platform for account intelligence or attribution. One buyer preferred it to Google paid search because of its ICP filtering, cost, and traffic quality. At another company, an internal analysis found RollWorks website data more influential on pipeline than 6sense.
Key features of AdRoll ABM
- Buyer insights: Keyword intent, ICP scoring, and predictive signals help teams identify accounts worth pursuing.
- Account-based advertising: Campaigns can target named accounts across web, CTV, LinkedIn, and Meta. Website visitors can also be retargeted at the account level.
- Journey stages and orchestration: Account activity can update journey stages and feed alerts or account data into connected CRM workflows.
AdRoll ABM Pricing
AdRoll does not publish dollar pricing for its three main ABM packages: Account-Based Advertising, Account-Based Marketing + Advertising, and Account-Based Marketing.
Account-Based Retargeting has no separate platform fee. Customers pay for the media they use.
Pros of AdRoll ABM
- Campaign setup is approachable: Creating audiences, launching campaigns, and monitoring performance is relatively easy.
- Support is consistently strong: Account managers and customer success teams receive positive feedback, particularly for onboarding and Salesforce reporting.
Cons of AdRoll ABM
- Detailed reporting can be limited: High-level campaign metrics are readily available, but reviewers want more granular attribution and greater reporting flexibility. Read the user review.
- Keyword intent can produce irrelevant results: Some users report seeing accounts that do not match their selected topics or needing more control over keyword grouping.
8. HubSpot
HubSpot takes a different approach to ABM. Instead of selling a standalone product, it has built account-level tools into its existing products such as Marketing Hub and Sales Hub. This works best for teams already using HubSpot, since marketing and sales can manage target accounts from the same records they use for campaigns and deals.
Buyer Intent adds website activity and off-site research to those account records.
There are several customers who have benefitted from HubSpot's ABM model. For instance, Propeller Aero reported 23% higher average contract value and a 12% higher close rate for ABM deals.
Key features of HubSpot
- Target accounts and buying roles: Teams can flag priority companies, assign roles such as Decision Maker or Budget Holder to contacts, and review account activity and deals.
- Buyer Intent: HubSpot surfaces companies visiting selected pages or researching relevant topics. Accounts can be added to the CRM or enrolled in workflows.
- LinkedIn activation and reporting: Target-account lists can sync to LinkedIn audiences, while ABM reports track engagement and pipeline.
HubSpot Pricing
HubSpot does not sell ABM separately. Its core ABM tools are available with either Marketing Hub Professional or Enterprise, or Sales Hub Professional or Enterprise. Some features have additional requirements.
Marketing Hub pricing starts at:
- Professional: $800/month, plus a mandatory $3,000 onboarding fee
- Enterprise: $3,600/month, plus a mandatory $7,000 onboarding fee
Extra contacts and seats increase the total cost. Certain Buyer Intent actions also use HubSpot Credits.
Pros of HubSpot
- Buying roles sit inside the CRM: Teams can see who is involved in an account without maintaining a separate buying-group database.
- Workflow automation is flexible: Account status, intent criteria, and deal activity can trigger routing or record updates.
Cons of HubSpot
- There is no simple ABM package: The features available depend on the HubSpot products, editions, and seats you buy.
- Advanced setup takes time: More complex workflows and reporting have a steeper learning curve than the basic CRM.
9. Userled
Userled is an ABM activation platform for teams that already have account and intent data but need a faster way to act on it. The platform creates personalized LinkedIn campaigns, microsites, and sales content without requiring every asset to be built manually.
Userled 2.0 brings in AI agents that help build campaigns and content. These agents can also adjust LinkedIn bids and surface engagement insights for sales.
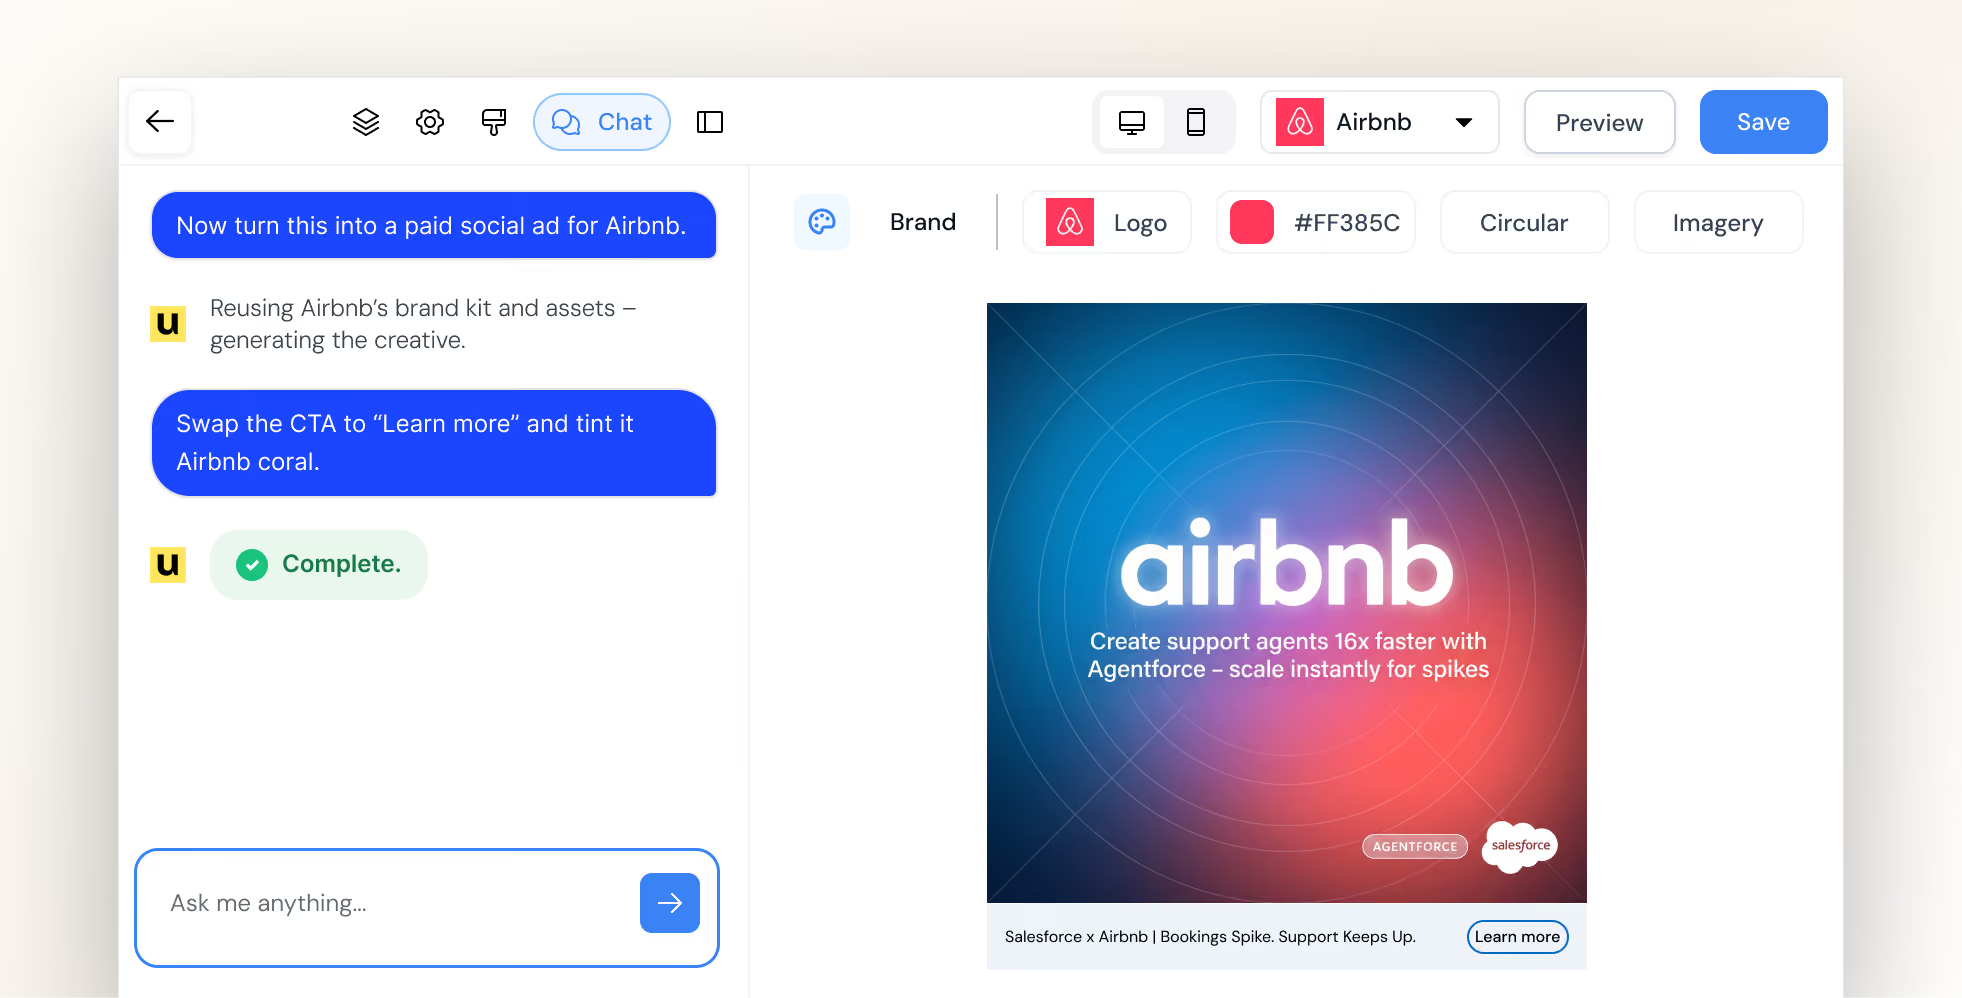
Key features of Userled
- Personalized LinkedIn campaigns: Teams can create up to five ad variations per account, sync campaigns to LinkedIn, and track engagement at account and contact level.
- Microsites: Account-specific pages can be created from templates without relying on design or development for every campaign.
- Sales Plugin: Reps can create and share personalized content from a browser extension, then see how individual contacts engage.
- AI campaign agents: Separate agents handle campaign creation, content, bidding, and engagement insights.
Userled Pricing
- LinkedIn Ads: Starts at $2,000/month, billed annually
- Microsites: Starts at $2,000/month, billed annually
- Sales Plugin: Starts at $599/month for 10 seats
- Enterprise: Custom
LinkedIn Ads and Microsites are separate modules. Based on the published starting prices, using both begins at $4,000/month before the Sales Plugin or enterprise services.
Pros of Userled
- Personalization can be produced much faster: One customer describes working “at a pace that would be impossible to maintain manually.” Read the user review.
- Support is hands-on: Implementation help and responsive customer support are consistently praised in Userled’s G2 feedback.
Cons of Userled
- Native paid activation is concentrated on LinkedIn: Teams running account-based campaigns across other ad networks will still need their existing advertising tools or integrations.
10. Recotap
LinkedIn Campaign Manager can target a company list, but marketers have limited control over how delivery is distributed across those accounts. A small group of responsive companies can absorb much of the budget while other priority accounts receive little exposure.
Recotap is built to solve this problem. It uses website activity and external intent to map accounts to journey stages, then updates audiences as those signals change. Marketers can cap impressions at the account level, exclude specific companies, and control how spend is distributed across the target list.
Prodapt’s results show why those controls matter. Before using Recotap, 60% of its target accounts were not being reached and CPL ranged from $800 to $1,000. After introducing impression caps and stage-based campaigns, the company reported an 80% increase in account reach and a 66% reduction in CPL.
Key features of Recotap
- Signal-based audiences: Website intent and Bombora data are included. Recotap uses these signals alongside CRM activity to map accounts to journey stages and update segments as behavior changes.
- LinkedIn campaign controls: Marketers can set account-level impression caps, control pacing, exclude unwanted accounts, and move companies between campaigns automatically.
- 1:1, 1, and 1 personalization: Ads and landing pages can change based on the account or segment. Existing landing pages can also be personalized through rules rather than rebuilt from scratch.
- Revenue attribution and CRM sync: Account stages and engagement data sync to the CRM, while LinkedIn activity can be connected with pipeline and closed-won revenue.
Recotap Pricing
The Standard plan costs $1,499/month, billed annually. Enterprise pricing is custom.
Bombora and website intent data are included. Connecting G2 intent requires a separate G2 subscription.
Pros of Recotap
- Sales gets account context rather than another campaign dashboard: Journey stages and engagement scores can help reps see which accounts are warming up and where follow-up should be prioritized. Read the user review.
- Existing landing pages can be personalized: Teams can apply account-specific content rules to pages they already use instead of building a new microsite for every campaign.
Cons of Recotap
- Useful orchestration depends on the initial setup: Teams must define their journey stages, segment rules, and campaign transitions before Recotap can automate them effectively.
- You cannot run multi-channel ad campaigns from Recotap: Paid activation is limited to LinkedIn. Campaigns on other ad networks have to be managed separately.
11. Clay
Clay is not a conventional ABM suite. It is a GTM data and workflow platform used to build account lists when the targeting criteria cannot be pulled from a single database.
A team might want to find companies that recently raised funding, are hiring for a particular role, and use a competing technology. Clay can research those conditions across several data providers and the web, enrich the matching accounts, then send them into the CRM or other campaign tools.
Even in our sales calls, teams discussed using it alongside an ABM platform rather than replacing one.
Key features of Clay
- Waterfall enrichment: Clay can query several providers in sequence for the same field. If the first provider does not return a result, the workflow moves to the next instead of relying on one database.
- Claygent and signals: Claygent researches information from websites and other public sources. Signals can monitor events such as job changes, hiring activity, or company updates.
- Workflow activation: Records that meet selected criteria can update the CRM, trigger outreach, or sync to LinkedIn, Meta, and Google audiences. CRM auto-sync and audience pushes require the Growth plan or higher.
Clay Pricing
Clay’s current plans include:
- Free: 100 Data Credits and 500 Actions per month
- Launch: Starts at $185/month
- Growth: Starts at $495/month
- Enterprise: Custom pricing with an annual commitment
Clay separates Data Credits from Actions. Data Credits pay for information purchased through Clay’s marketplace. Actions cover the work Clay performs, such as running enrichments, calling an AI model, or exporting records. Using your own provider API keys avoids Data Credit charges, but the workflow still consumes Actions.
Pros of Clay
- It handles unusually specific targeting criteria well: Teams are not limited to the fields available in a standard prospecting database. One reviewer describes Clay as a “full research and enrichment engine for outbound.” Read the user review.
- The output does not have to stop at a list: Once an account meets the required conditions, Clay can update records or send the audience into the next campaign and outreach systems.
Cons of Clay
- There is a meaningful learning curve: Waterfalls and conditional logic take time to understand, particularly for teams that have not built enrichment workflows before. Multiple reviews raise the same issue. Read the user review.
- Usage needs active management: Large tables can consume Data Credits and Actions quickly when several providers or AI research steps are involved. Testing workflows on a smaller sample first helps prevent unnecessary usage.
12. Uberflip
Uberflip is a content experience platform rather than an account-identification or intent product. It helps marketing teams turn an existing content library into destinations created for individual accounts or audience segments.
This is useful when a company has plenty of content but keeps sending every buyer to the same resource centre. Marketing can create targeted campaign pages from approved assets, while sales can reuse those assets in Digital Sales Rooms for specific buyers.
Matillion used Uberflip to support an ABM program covering 6,000 priority accounts. Within three months, the program added 777 MQAs and influenced $1.66 million in pipeline.
Key features
- Centralized content hub: Marketing teams can organize and tag existing content in one library, making relevant assets easier to find and reuse across campaigns.
- Personalized campaign destinations: Uberflip Pages lets marketers create account-specific or segment-specific destinations without building a new page in the main website CMS each time.
- Digital Sales Rooms: Sales reps can copy approved templates, select relevant content, personalize the room for a buyer, and track how the recipient engages with it.
Pricing
Uberflip does not currently publish dollar pricing. Buyers need to request commercial details.
Pages is included as part of the platform, although the number of published pages is one of the usage metrics that can affect subscription cost. Sales reps also need purchased Sales seats to create Digital Sales Rooms.
Pros
- Existing content becomes easier to reuse across ABM campaigns: Teams can create different account experiences from the same content library instead of producing another ebook or landing page whenever the target segment changes. Read the user review.
Cons
- Speed for sellers depends on the groundwork done by marketing: Digital Sales Rooms can be assembled quickly once the content library and templates are ready. Organizing assets, configuring the design, and completing the initial implementation can take considerably more work. Read the user review.
13. DemandScience
Rather than licensing software for your team to configure and operate, DemandScience uses its buyer intelligence and campaign team to plan, execute, and optimize programs on your behalf. This makes it most relevant to companies that want ABM execution handled alongside the technology.
The company changed considerably after Terminus merged into DemandScience in November 2024. Its current model is organized around three parts: Ionic provides the intelligence and orchestration, DemandScience Labs runs the campaigns, and Central gives customers visibility into audiences and performance.
Key features of DemandScience
- Identify accounts worth pursuing: Verified account and contact data is combined with behavioral, intent, firmographic, and technographic signals to prioritize likely buyers.
- Run campaigns across multiple channels: DemandScience manages execution across paid media, email, web, content syndication, and events using the same audience intelligence.
- Generate qualified contacts from target accounts: Content syndication and HQL or BANT programs can turn account interest into opted-in leads with additional qualification.
DemandScience Pricing
DemandScience does not publish standard pricing. There is no separate ABM platform subscription fee under its current model.
Pricing is tied to the programs and services you purchase, with data, campaign execution, and optimization included.
Pros of DemandScience
- The campaign team stays closely involved: Responsiveness is one of the clearest themes in recent user feedback. One customer says the team “responds quickly and is easy to reach,” including when campaign changes arise. Read the user review.
- Less ABM operations work has to sit internally: DemandScience Labs handles planning, execution, and ongoing optimization rather than leaving your team to operate another platform.
Cons of DemandScience
- Lead quality can vary by program: Current feedback includes customers reporting strong results as well as campaigns where a substantial share of the delivered leads fell outside the original brief. Clear targeting criteria and close campaign oversight remain important.
- You give up some self-service control: Teams cannot independently configure every campaign setting or automate all reporting in the way they might with a conventional ABM platform. One customer cites integration and reporting limitations and describes the product as “not really built for self-service.” Read the user review.
14. Salesforce Marketing Cloud Account Engagement+
Salesforce Marketing Cloud Account Engagement+ is Salesforce’s B2B marketing automation product. It works with the account, contact, and opportunity data in Salesforce CRM to help teams nurture and score buyers, track engagement, and connect marketing activity to pipeline.
Salesforce offers four Account Engagement+ editions. Plus+ is the first one that includes account-based marketing and analytics, making it the most relevant edition for this guide. Its approach to ABM is built around CRM data, nurture, and account-level reporting rather than anonymous account identification or paid media activation.
Key features of Salesforce Marketing Cloud Account Engagement+
- Score and nurture B2B buyers: Scoring measures how actively a prospect engages with marketing, while grading evaluates how closely they match the ideal buyer profile. These signals can trigger nurture programs or determine when a prospect is passed to sales.
- Analyse engagement at the account level: Plus+ includes five B2B Marketing Analytics licenses. Its ABM dashboards bring together marketing engagement, contacts, opportunities, and expected revenue for each account.
- Create and run cross-channel campaigns: Agentforce can generate campaign briefs, audience segments, and email content from a prompt. Salesforce Flow for Marketers can coordinate journeys across email, SMS, and WhatsApp, although messaging requires additional credits.
Salesforce Marketing Cloud Account Engagement+ Pricing
Account Engagement+ pricing starts at:
- Growth+: $1,250 per organization/month
- Plus+: $2,750 per organization/month
- Advanced+: $4,400 per organization/month
- Premium+: $15,000 per organization/month
All editions are billed annually. Plus+ is the relevant starting point for teams that need Salesforce’s ABM dashboards and B2B Marketing Analytics.
The subscription does not cover every potential cost. Additional contacts start at $100 per 10,000 contacts each month, while SMS, WhatsApp, and some Marketing Cloud Next features use separately purchased credits. Sales Emails and Alerts and more advanced analytics are also sold as add-ons.
Pros of Salesforce Marketing Cloud Account Engagement+
- Salesforce CRM integration is the strongest reason to choose it: Marketing engagement can be viewed alongside the accounts, contacts, and opportunities that sales already works with. Current feedback describes the “seamless integration with Salesforce CRM” as its biggest strength.
- Existing automation can be extended to target accounts: Teams already using Account Engagement for scoring, nurture, and sales handoffs can apply those workflows to ABM rather than building the process again in a separate platform.
Cons of Salesforce Marketing Cloud Account Engagement+
- Core workflows can feel rigid and clunky: The email builder may require HTML knowledge, while limited customization in funnel tracking and Einstein campaign features can make it difficult to reflect the way a team actually works. Read the user review.
- The total cost can extend well beyond the Plus+ subscription: Contact volume, messaging credits, sales features, and advanced analytics can all increase the price.
15. Adobe Marketo Engage
Marketo is rarely bought just to run ABM. Most companies use it as their marketing automation foundation, then add Target Account Management to organize existing nurture and campaign workflows around named accounts.
This sentiment echoed in our conversations with prospective buyers. Teams discussed it as marketing infrastructure supporting their ABM programs. rather than as a standalone account-intelligence or intent-data platform.
It makes the most sense for mature marketing teams that need deep automation and have the operations resources to manage it.
Key features of Adobe Marketo Engage
- Run complex nurture programs: Smart Campaigns use triggers or schedules to decide when someone enters a workflow. A CRM stage change could route a buyer to sales, while a content interaction could update their score or move them into a different nurture program.
- Coordinate campaigns around named accounts: Target Account Management matches individual records to named accounts and brings their activity into an account-level view. Teams can use the resulting engagement score to prioritize accounts and measure their contribution to pipeline.
- Activate the same audiences in paid campaigns: Marketo can sync a Smart List to platforms such as LinkedIn Matched Audiences. Audience membership stays connected to Marketo data, while media buying remains inside the advertising platform.
Adobe Marketo Engage Pricing
Adobe does not publish dollar pricing for Marketo Engage. Its current packages are Growth, Select, Prime, and Ultimate.
Target Account Management is included with Prime and Ultimate. It is available as a paid addition to Growth and Select, making the package configuration particularly important for ABM buyers.
Pros of Adobe Marketo Engage
- Automation can reflect complex B2B processes: Experienced teams have considerable control over segmentation, scoring, personalization, and multi-step campaigns. Programs can range from basic email nurture to detailed workflows spanning multiple products, regions, or lifecycle stages.
- Lead management and sales handoffs are mature: Scoring, CRM integration, campaign tracking, and automated routing have been central to Marketo for years. Read the user review.
Cons of Adobe Marketo Engage
- The flexibility comes with a steep learning curve: Campaign logic, scoring, segmentation, CRM synchronization, and reporting take time to understand. Even positive feedback notes that routine tasks can involve more steps than expected, making dedicated Marketo operations support important for larger implementations. Read the user review.
16. Albacross
Albacross helps demand generation teams act on anonymous website traffic. Once it identifies a visiting company, it assesses whether the activity is strong enough to merit follow-up.
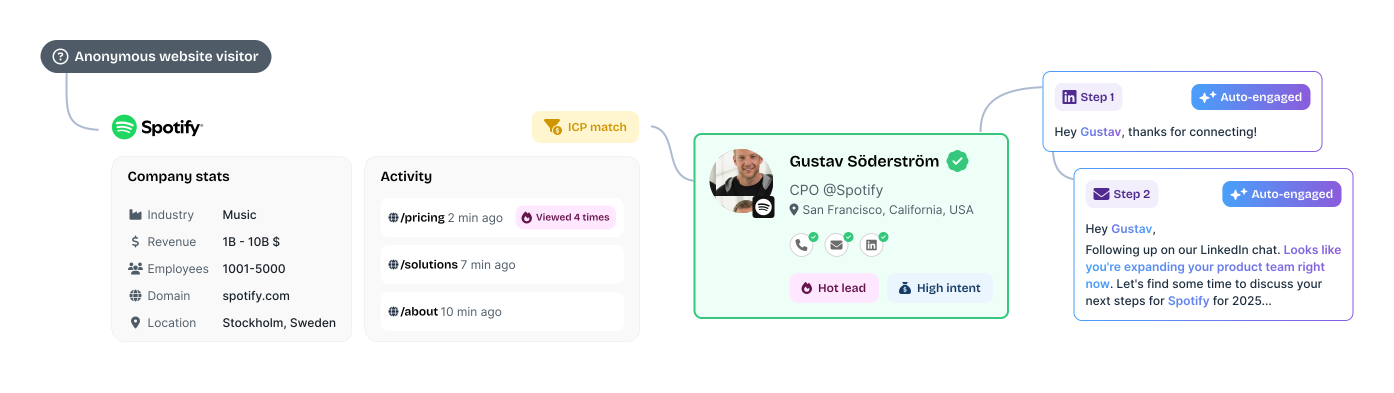
Its main strength is the short distance between insight and action. Sales can receive a list of prioritized accounts and launch email or LinkedIn outreach without a large ABM operations setup. This makes Albacross useful for teams that want more than a visitor-identification dashboard but less complexity than an enterprise ABM platform.
Key features of Albacross
- Company Identification: Albacross connects an anonymous website visit to a company and shows the firmographic profile behind it. Contact details are unlocked separately through verified email and phone credits.
- AI-Powered Segmentation: Website activity is evaluated as it happens and used to determine which visitors deserve attention. Teams can adjust the qualification rules to match the way they define a valuable account.
- Auto-Engage™: When a lead enters a selected intent segment, Albacross can start an AI-personalized email or LinkedIn sequence without waiting for someone to act on the signal manually.
- LinkedIn Ads integration: Selected leads can be kept in sync with a LinkedIn advertising audience for retargeting. The campaigns themselves continue to run inside LinkedIn.
Albacross Pricing
Albacross's pricing is as listed below:
- Starter: €59/month with annual billing or €84 with monthly billing
- Professional: €149/month with annual billing or €213 with monthly billing
- Organisation: Custom pricing with annual billing
Starter includes 10 verified email credits and five phone credits each month. Professional raises this to 25 email credits and 10 phone credits, which may not be enough for teams planning higher-volume outreach.
Professional is the first plan with LinkedIn Ads and HubSpot integrations. Salesforce synchronization and dedicated ABM access require the Organisation plan. ABM is listed as available on request rather than automatically included.
Pros of Albacross
- Intent data becomes useful without much maintenance: Martin from Epidemic Sound describes Albacross as “not just another layer of data.” Account activity can be prioritized and passed to sales without creating a large operational workload. Read the user review.
- Account-based advertising is easy to explain internally: Senior stakeholders can quickly see which accounts are being reached and how the budget is being used. This makes long-term brand and awareness spending easier to discuss with leadership.
Cons of Albacross
- Reporting depth can lag as adoption grows: Reviews point to limited usage reporting, fewer permission options, dashboard navigation issues, and a need for deeper analysis. The core account view is clear, but system owners may want more flexibility as adoption grows. Read the user review.
17. Influ2
Once a team has identified the buying committee inside a target account, Influ2 lets it advertise to those people directly. Contacts are pulled from the CRM, while Influ2 handles delivery across supported networks and reports which individuals saw or clicked each ad, even without a form fill.
The platform's value goes beyond knowing who engaged. It can use contact-level intent to change the next ad or trigger a sales action as that buyer’s interest develops. Through Signals Center, reps receive more context about what appears to interest the person and why the activity matters.
Bonterra used this model to reach 80% of the buying committees in its target accounts. Buyers who engaged with ads set up through Influ2 converted at twice the rate of contacts reached through cold outreach.
Key features of Influ2
- Cohort Designer: CRM data determines which contacts Influ2 should monitor or advertise to. For example, a team could build a cohort of active opportunities where an economic buyer has not yet engaged.
- Buyer Journey Orchestration: The ads shown to a contact can change as their behavior or lifecycle stagechanges. Influ2 can also coordinate those journeys with active Salesloft or Outreach sequences.
- Signals Center: Contact-level intent is presented in a live feed for sales. Reps can see which buyer is active, what topic appears to interest them, and which engagement created the signal.
- Revenue Reporting: Ad impressions and clicks can be followed into opportunity creation and deal progression. This allows teams to compare how contacts who engaged with advertising converted against a cold pipeline baseline.
Influ2 Pricing
Influ2 does not publish standard pricing. Plans are quote-based.
Buyers should confirm how seats and campaign capacity are allocated.
Pros of Influ2
- Ad spend stays focused on known members of the buying committee: Marketers choose the exact contacts they want to influence, while sales receives a named engagement signal for follow-up. This reduces the risk of spending heavily on an account without knowing whether the relevant decision-makers were reached.
- The setup is easier than the targeting model might suggest: Ease of use is one of the stronger themes in Influ2’s G2 user feedback. One reviewer described the setup as “almost shockingly easy.” Read the user review.
Cons of Influ2
- Advanced reporting and attribution have room to improve: Reviewers want a clearer view of where individual ad engagement happened and more freedom to adapt reporting to their attribution model. Workflow automation is another area where they see room for improvement. Read the user review.
- Pricing and capacity can become restrictive: Some customers find the pricing high for the capacity included. Ad-group limits can constrain larger programs, while the way seats are allocated may not work well for agencies managing several clients.
18. Madison Logic
Madison Logic is designed for enterprise teams that want to run content syndication and paid media through the same partner. Display and LinkedIn cover the more familiar B2B channels, while Connected TV and audio extend campaigns beyond standard digital placements.
ML Insights helps guide where your media budget goes. Account activity is scored continuously, and research topics help marketers decide what content or message will be most relevant. Madison Logic also provides enterprise ABM strategists to support campaign planning and optimization, making this closer to a technology-and-media partnership than a conventional self-service ABM platform.
For teams that do not need Madison Logic’s publisher network or premium-media reach, Factors.ai offers a more niche alternative.
Key features
- ML Insights: Madison Logic’s own engagement data shows which accounts and buying-group members are becoming active. Bombora research adds off-site intent, while technology-installation data provides more context for targeting.
- ABM Content Syndication: Content is distributed through Madison Logic’s publisher network to selected accounts and relevant buyer roles. The resulting leads can flow into CRM and marketing automation systems for nurture or sales follow-up.
- ML ABM Web Analytics®: Anonymous website activity can beresolved at the account level. The High Value Engagements capability highlights meaningful actions such as demo requests or visits to important pages.
Pricing
Madison Logic does not publish standard campaign pricing. The ML Platform is included with any media buy at no additional platform cost.
The quote therefore depends on the campaigns purchased rather than a separate software licence. Media selection and campaign scope will have the greatest effect on total spend.
Pros
- Content syndication and advertising can work as one media plan: Teams can use the same account strategy across lead generation and paid reach instead of coordinating several specialist vendors. Endava reported 30x ROI on influenced pipeline after running content syndication and display campaigns through Madison Logic.
- Intent informs the message as well as the target list: The MLI Score helps prioritize accounts, while Trending Topics shows what those companies are researching. This gives marketers something concrete to use when selecting content and shaping campaign messaging.
Cons
- Lead delivery can be uneven: Account-level caps may slow delivery once the permitted number of leads has been reached at particular companies. This can make campaign volume harder to predict and complicate the timing of SDR follow-up. Read the user review.
- Custom analysis may still happen outside the platform: Standard dashboards provide a clear campaign view, but users want more control over date ranges and exports. Teams with specific reporting requirements may need to finish the analysis in another tool.
19. ZoomInfo Marketing
Detailed company and contact data is what ZoomInfo Marketing is known for. Demand generation teams can build ABM audiences from the same records sales uses for prospecting, which is particularly useful when adding another account database would create more matching and governance work.
ZoomInfo currently cites coverage of more than 100 million companies and 500 million contacts. The newer GTM Studio gives marketing and RevOps a workspace for turning all this data into audiences and signal-triggered plays.
Key features of ZoomInfo Marketing
- GTM Studio: Teams can create audience workbooks from CRM records and ZoomInfo datasets, then enrich or score the resulting accounts before activating a play. It is now the clearest entry point for cross-team campaign orchestration.
- Buyer Intent and WebSights: Buyer Intent surfaces accounts researching selected subjects. WebSights identifies organizations visiting the website and can move those visitors into an audience for follow-up.
- ZoomInfo Audiences: Audience membership updates as companies begin or stop matching the chosen criteria, avoiding repeated list exports.
- ZoomInfo Advertising: A proprietary B2B DSP uses ZoomInfo account data for programmatic campaigns. The current format support includes display alongside video and Connected TV.
ZoomInfo Marketing Pricing
ZoomInfo does not publish a standard rate card. Contracts can change with seats, data credits, and premium modules.
For a useful reference point, AWS Marketplace lists ZoomInfo Marketing ABM Pro+ at $69,995 for 12 months. That is a specific marketplace package, not a universal starting price. Ask ZoomInfo to separate platform access, usage allowances, and each add-on in the quote.
Recommended Read: ZoomInfo Pricing
Pros of ZoomInfo Marketing
- The database supports unusually precise audience definitions: Firmographic filters can be combined with role and contact data to narrow a campaign to the people who matter inside each account. One user values being able to isolate “key targets and not just a mass of junk we won't use.” Read the user review.
- Marketing does not have to reconcile its account universe with sales: Audience criteria, account records, and buying-group contacts come from the same underlying data. This is particularly valuable when ZoomInfo is already established in the sales workflow.
Cons of ZoomInfo Marketing
- Contact records still need a freshness check before outreach: Job changes are a recurring weak point in the data that ZoomInfo provides. Users have found outdated employment details despite high confidence scores and sometimes, have to check LinkedIn to confirm where somebody works. Read the user review.
- The final contract is difficult to estimate from the base product: Data credits and premium capabilities can sit outside the core package. The public AWS offer is useful context, but it does not replace a line-item quote for your configuration.
20. Common Room
When buyer activity is spread across your product, website, and external communities, no single source shows the full story. Common Room associates those signals with the relevant person and company, making it particularly useful for GTM teams that prioritize accounts using several forms of first-party engagement.
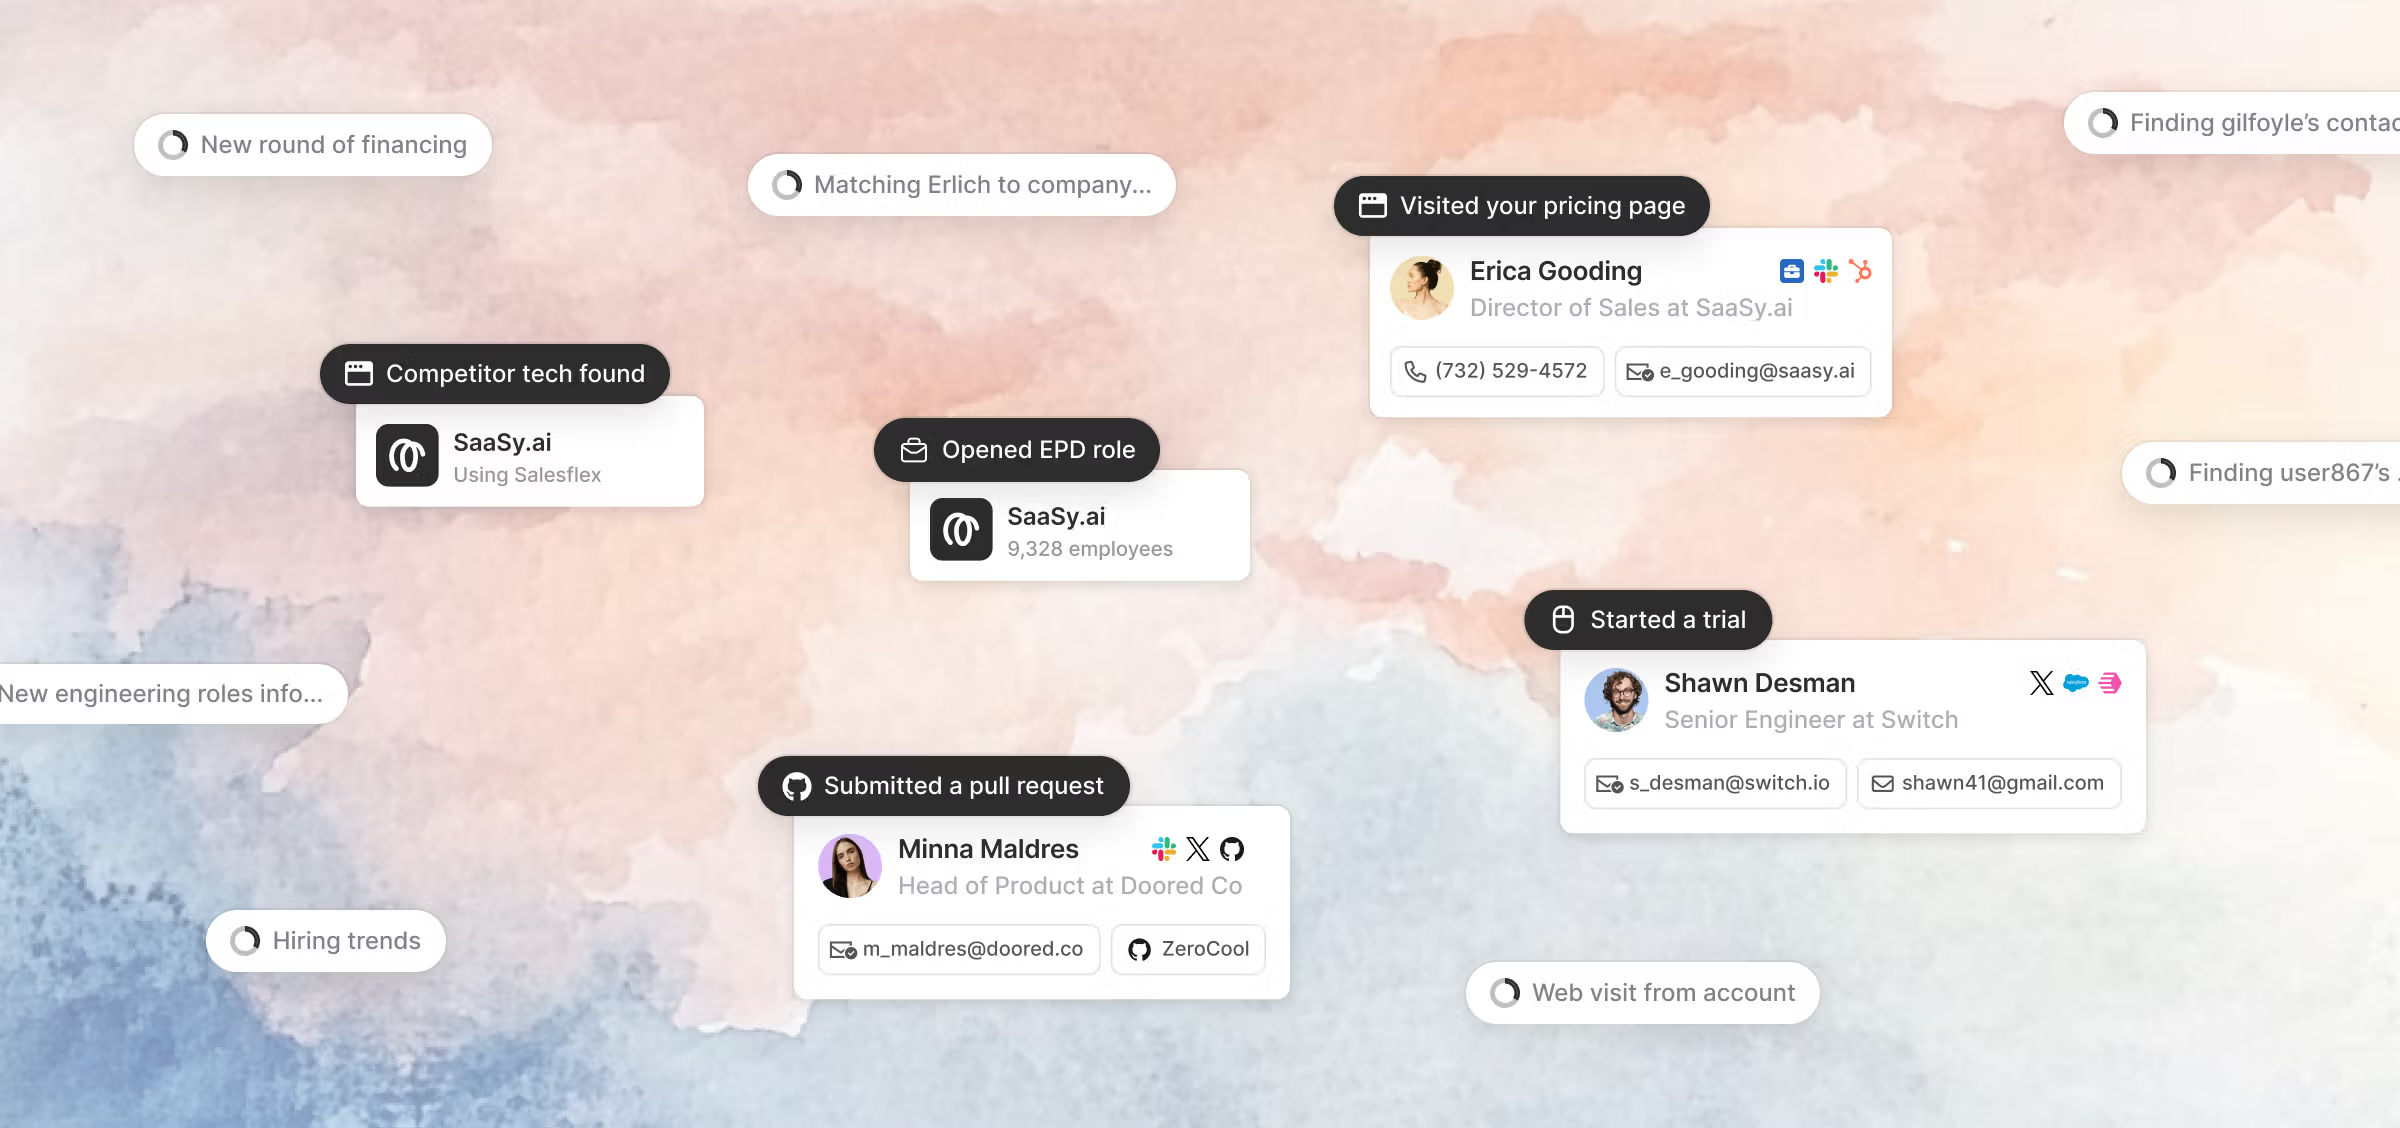
More than 50 native integrations cover established signal sources, while RoomieAI Capture can research activity that falls outside the standard set. Person360 handles identity resolution and enrichment.
Teams can also decide which fit and behavioral inputs influence account or contact scoring instead of relying entirely on a fixed model.
Key features of Common Room
- Signals and RoomieAI Capture: Native integrations ingest known sources such as product activity and community participation. Capture can research more specific account facts when a standard connector does not exist.
- Person360: Identity resolution links activity to an existing person and account record. Waterfall enrichment fills gaps in the profile rather than leaving each event attached to a separate identity.
- Account and Contact Scoring: Teams can define separate fit and behavior models. Visible score inputs and weight sliders make the prioritization logic editable rather than opaque.
- RoomieAI Spark and Activate: Spark surfaces people worth investigating with supporting context. Activate uses that context to prepare or automate outbound action.
Common Room Pricing
The Essential plan costs $2,500 per month, billed annually. It includes five seats, up to 100,000 contacts, 5,000 RoomieAI research credits, and 2,500 Prospector credits. Alerts, workflows, and segments are unlimited.
Advanced and Enterprise use custom pricing. Product signals are an add-on on Essential, and some export or data-management capabilities are also packaged separately.
Pros of Common Room
- It replaces a real piece of manual research: A sales leader says list building became faster because the team was “no longer manually stitching together signals from separate tools to figure out who's worth prioritizing.” Read the user review.
- Reps can get useful context without learning a complex analytics product: Segmentation and daily prospecting are described as straightforward on G2.
Cons of Common Room
- The account workspace is less flexible than the signal layer: Users point to overlapping accounts, rigid columns, and reporting views that are difficult to adapt. The HubSpot integration can also require work before the resulting workflow feels clean. Read the user review.
- Person360 does not remove the need to validate contact coverage: Some users have mentioned that accuracy of email and phone data is lower than that of ZoomInfo.
21. Warmly
Warmly helps you identify target accounts and the people involved in the buying decision. These contacts can be added to email outreach or LinkedIn ad audiences. When someone visits your website, its Inbound Agent uses past account activity to personalize the conversation and route qualified buyers to sales.
All of Warmly's AI agents are grounded in its Context Graph, a shared record of signals and past interactions for each account. This prevents website chat and outbound campaigns from treating the same person as separate leads. Warmly offers more ABM coverage than a visitor-identification or chat tool, although paid-media activation is mainly limited to LinkedIn.
Warmly announced an agreement to be acquired by HubSpot on June 30, 2026. The current product and commercial terms remain unchanged for now.
Key features of Warmly
- AI Web-Deanonymization: Warmly identifies companies and some named buyers from those companies. ICP filters determine which matches are worth routing into alerts or connected systems.
- Inbound Agent: AI chat can qualify interest and book a meeting during a website visit. If the AI has already opened the conversation, a rep can take over with the full chat history and continue from the same point.
- TAM Agent: Dynamic audiences update as account fit or intent changes. The agent can then find buying-group contacts and coordinate off-site outreach.
Warmly Pricing
- AI Web-Deanonymization: $10,000 per year
- Inbound Chat: $20,000 per year
- AI Inbound Autopilot: $30,000 per year
Each pricing tier starts with 10,000 credits per month. The GTM Signals Package costs another $10,000 per year, as does Warm Experiences. Quarterly billing is available at a higher effective price.
Warmly describes TAM Agent separately as included in plans starting at $15,000 per year, but it does not appear in the main pricing grid.
Pros of Warmly
- Account activity can trigger an immediate response: Closed-lost and in-cycle Slack orchestrations are the standout workflows. They bring relevant accounts back to the team’s attention when new activity appears. Read the user review.
- Vendor support is hands-on: User feedback describes simple initial installation as well as regular working sessions with Warmly’s team. This level of involvement is useful when routing and follow-up rules cross several systems.
Cons of Warmly
- Person-level identification is neither complete nor consistently accurate: Identification accuracy is a common concern with Warmly. Match rates are often reported around 30-40%, and some users note incorrect person matches. Read the user review.
- The price rises sharply once the job extends beyond identification: Moving from website deanonymization to inbound chat doubles the annual starting price. Autopilot and optional signal or personalization packages increase it further.
22. Metadata
Metadata is ideal for marketing teams that need to run the same B2B campaign across several ad platforms without rebuilding it in each one.
Which explains why the platform is closer to a media-operations layer than a conventional ABM intelligence platform. A marketer can describe the campaign outcome, review the audiences and budget proposed by Metadata's AI agents, and approve the native campaign structure before anything launches.
The current product uses seven specialized agents that divide the work. Some build audiences and creative; others operate campaigns or analyze results. Metadata then adjusts bids or budgets as performance changes. It is most useful when paid-media execution, rather than account discovery, is the bottleneck.
Key features of Metadata
- MetaMatch: The audience engine uses B2B firmographic, technographic, and intent criteria against more than 800 million profiles. Its identity matching makes those audiences usable on consumer-oriented channels where business titles alone are weak targeting data.
- MetadataONE: The newer agent interface turns a campaign brief into reviewable campaign objects. Every object remains subject to human approval before launch.
- Cross-channel campaign automation: Metadata builds the native structure required by each ad platform and shows campaign status in one workspace. It supports LinkedIn, Google, Meta, Reddit, and Microsoft Advertising. X and ChatGPT Ads are also part of the current channel set.
- Experiments and pipeline reporting: Teams can test how an audience responds to different offers or creative, then connect campaign spend with CRM outcomes rather than optimizing only for clicks.
Metadata Pricing
Metadata does not publish a price grid. The quote depends on the channels under management, the ad spend its agents will operate, and which parts of campaign execution remain with your team.
Pros of Metadata
- MetaMatch extends B2B targeting beyond LinkedIn: Extend B2B targeting past LinkedIn by mapping professional audience data to identifiers that platforms like Meta can use. Reviewers consistently point to audience depth and MetaMatch as some of the product's strongest features. Metadata's G2 feedback.
- One campaign can be built for several native ad platforms: Teams avoid recreating the same audience and structure inside every channel manager. A user says that being able to build in Metadata and push to multiple sources “saves so much time for our team.” Read the user review.
Cons of Metadata
- In-flight campaign changes are clunky: Changing the creative, audience, or bidding logic of an active campaign can be time consuming. Experienced media buyers may find the native ad manager more flexible for those adjustments. Read the user review.
- The AI agents do not completely eliminate the need for human judgment: Someone still has to approve the audience, budget, and experiment design. Users also describe an initial learning curve, particularly around reporting and setup.
How to choose the right ABM platform
Start with the part of your ABM program that's the actual bottleneck.
Factors.ai, Demandbase, and 6sense run intent detection, ad execution, and attribution from the same platform. Bombora, ZoomInfo, and Common Room are strong on identification but are typically paired with a separate tool for execution.
If you already know your accounts and the gap is personalizing outreach, Userled, Recotap and Influ2 solve for this.
Also keep in mind your existing tech stack. If most of your GTM workflow, lead routing, scoring, reporting, already runs inside HubSpot or Salesforce, a native add-on that works inside that CRM usually beats a separate ABM suite.
The right platform is the one that fixes your specific bottleneck, not the one with the longest feature list. Anything beyond that is capability you're paying to maintain without using.
FAQs on Account-Based Marketing Tools
What are the best ABM platforms?
It depends on which part of the motion needs fixing. Factors.ai, Demandbase, and 6sense cover the widest range of ABM work, including intent data, advertising, and attribution, in one platform. Bombora, Vector, and Influ2 are the stronger picks when the gap is narrower, like third-party intent or contact-level advertising specifically.
Which ABM tools track buyer intent?
6sense and Bombora are built specifically around third-party intent, tracking research activity happening outside your own site. Common Room and ZoomInfo add first-party signals from product usage, community activity, or website behavior into the same account view. Albacross and Factors.ai also flag intent through website visitor activity rather than third-party research alone.
Which ABM tools personalize outreach or content?
Userled and Recotap build personalized LinkedIn campaigns and landing pages tied to specific accounts or segments. Influ2 goes further, targeting named individuals inside a buying committee with ads that change as their engagement shifts. Uberflip personalizes at the content level, turning an existing library into account-specific pages without a rebuild.
Which ABM tools identify website visitors?
Factors.ai, Warmly, Vector, and Albacross all deanonymize website traffic, though coverage and depth differ. Factors.ai and Albacross identify companies, while Warmly and Vector go further by naming individual visitors, at lower match rates. Match rate and whether identification happens at the company or contact level are worth confirming directly with each vendor.
How much does ABM software cost?
Pricing spans a wide range depending on how much of the motion the platform covers. Point tools like Fibbler start at under $100 a month, while mid-market platforms like Recotap or Userled start in the low thousands monthly. Full enterprise suites like 6sense or Demandbase run into five and six figures annually, and several vendors don't publish pricing at all.
Are there free or cost-effective ABM tools?
Most full ABM suites don't have a free tier, but some specialist tools do. Clay offers a free plan with limited credits for account research and enrichment. For paid options, Fibbler and Albacross both start at under $100 a month.

Top 10 Dealfront (Now Leadfeeder) Competitors & Alternatives In 2026
Looking for Dealfront (Now Leadfeeder) competitors? Discover the top 10 alternatives, such as to improve your lead generation efforts.
TL;DR
- Dealfront, now rebranded back to Leadfeeder as of March 2026, is a solid tool, but its pricing climbs aggressively with lead volume, its data coverage can skew heavily toward Europe, and it stops short of providing deep marketing attribution.
- Visitor tracking alternatives step in to fill the gaps, offering everything from hyper-affordable entry tiers to multi-channel data enrichment and advanced customer journey mapping.
- Align your tech stack with your growth goals; choose specialized platforms for targeted LinkedIn prospecting, enterprise sales compliance, or deep AI-driven web behavior tracking.
- Factors.ai outpaces the competition by bundling enterprise-grade account de-anonymization with multi-touch marketing attribution, giving you a full-funnel view of exactly which campaigns drive real revenue.
We've all heard 'data is the new gold', and at such a time, it's critical for businesses to dig deep and unearth insights that up their lead generation and sales processes.
Tools like Dealfront (now Leadfeeder again) are invaluable, allowing organizations to track website visitors, gain actionable insights, and convert potential leads into loyal customers.
While Dealfront is a prominent leader in this space, several compelling alternatives and competitors are worth exploring. By utilizing de-anonymized data, these tools can provide a clearer picture of visitor behavior, enabling businesses to tailor their strategies to meet specific needs. Whether it's more favorable pricing, unique features, or a better alignment with your business objectives, investigating these alternatives can help you find the ideal solution for your unique challenges.
Let’s explore some Dealfront Alternatives and see how they can enhance your lead-generation efforts.
Let's Learn A Little About Dealfront (Now Rebranded to Leadfeeder)
Overview:
Dealfront, originally known as Leadfeeder, then rebranded to Dealfront in 2023, and rebranded back to Leadfeeder in March 2026, is a robust tool that helps businesses identify anonymous website visitors and turn them into actionable leads. By integrating with Google Analytics and CRM systems like Salesforce, Dealfront allows businesses to monitor site visitors, understand visitor behavior, and identify potential leads based on the companies that visit their websites.
Key Features:
- Visitor Identification: Matches website visitors to company profiles.
- CRM Integration: Easily integrates with major CRM systems, like HubSpot, Salesforce, and Pipedrive, to streamline lead management.
- Lead Scoring: Automatically prioritizes leads based on predefined criteria.
- Detailed Analytics: Offers insights into how visitors interact with your site.
Pros:
- Easy integration with major CRMs.
- Real-time notifications of new leads.
- Insightful analytics and lead scoring.
Cons:
- Can become expensive as the number of leads increases.
- Limited customization options for smaller businesses.
- Some users report that the lead quality can be inconsistent.
Pricing:
Dealfront’s pricing starts at around $55/month for small teams, but larger teams or businesses with more visitors may face higher fees based on their lead volume.
{{INLINE_CTA_A}}
Why Are Dealfront Alternatives Necessary?
While Dealfront is a powerful tool, it may not suit every business. Some of the reasons businesses may seek alternatives include:
- Pricing Constraints:
Some businesses find Dealfront's pricing to be a bit steep, especially when scaling.
- Specific Features:
Certain companies may need specialized features like deeper AI-powered insights or better regional targeting.
- Custom Integrations:
A business might require more niche integrations not available with Dealfront.
- User Experience:
While Dealfront has a relatively simple interface, some users may prefer alternatives with different navigation or customization options.
With these considerations in mind, let’s explore the top competitors and alternatives to Dealfront that can provide businesses with valuable visitor tracking and lead generation solutions.
Top 10 Dealfront Alternatives
1. Factors.ai
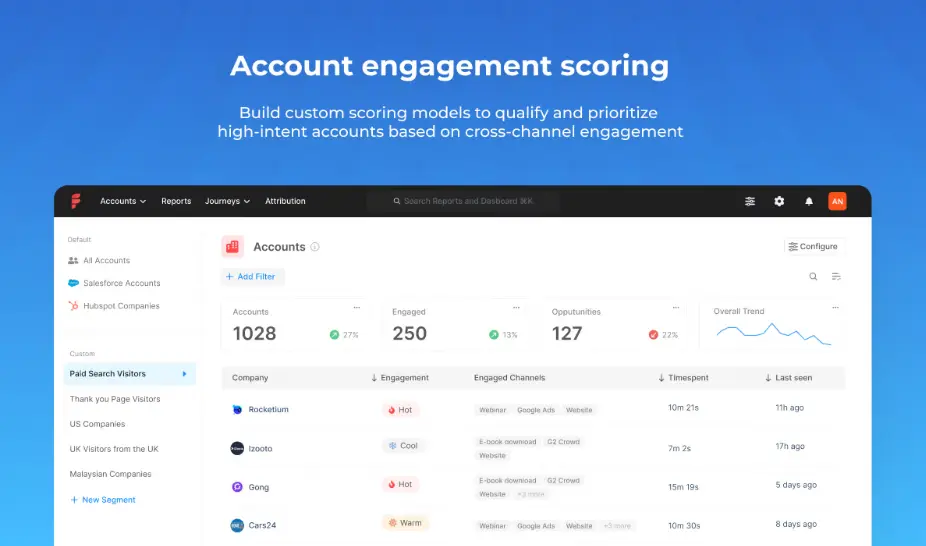
Factors.ai is an AI-driven marketing attribution and analytics platform designed to help businesses understand and optimize their customer journeys. The platform is focused on providing deeper insights into marketing activities, enabling companies to measure campaign performance more effectively.
Key Features:
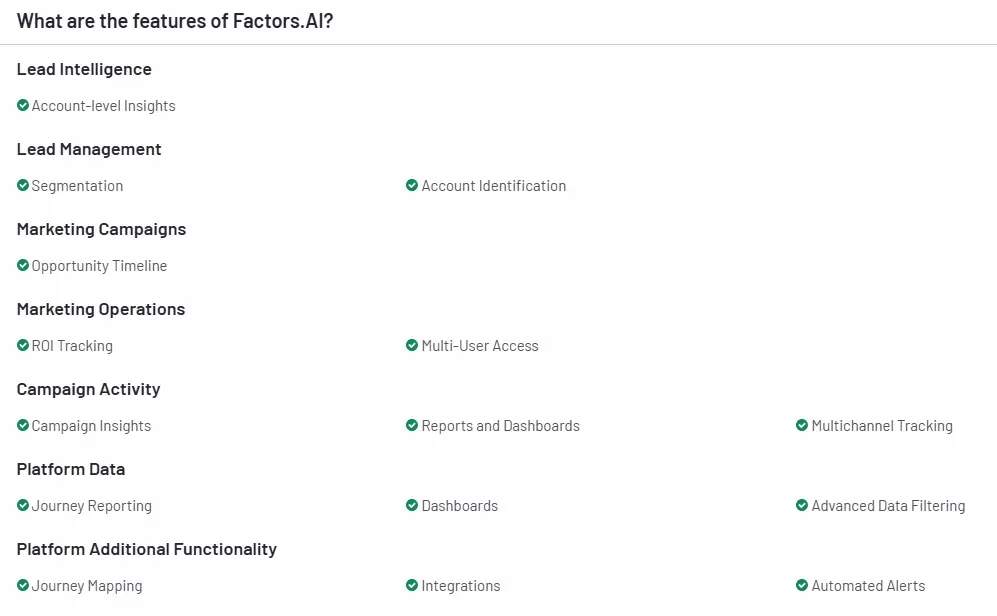
- AI-Powered Insights: Uses machine learning to deliver actionable insights into customer journeys.
- Marketing Attribution: Tracks how different touchpoints contribute to conversions.
- Customizable Dashboards: Offers flexible dashboard customization to suit various business needs.
- AdPilot: Their innovative AdPilot feature helps businesses automate and optimize their ad campaigns based on AI insights.
- Segments: Allows businesses to create and analyze specific customer segments based on various behavioral and demographic criteria, enabling more targeted marketing strategies.
- Workflow Automation: Streamlines marketing processes by enabling automated workflows, helping teams manage and execute campaigns efficiently while reducing manual effort.
Pros:
- Advanced AI-driven analytics.
- In-depth insights into marketing attribution and ROI.
- Excellent customization options for dashboard and reporting.
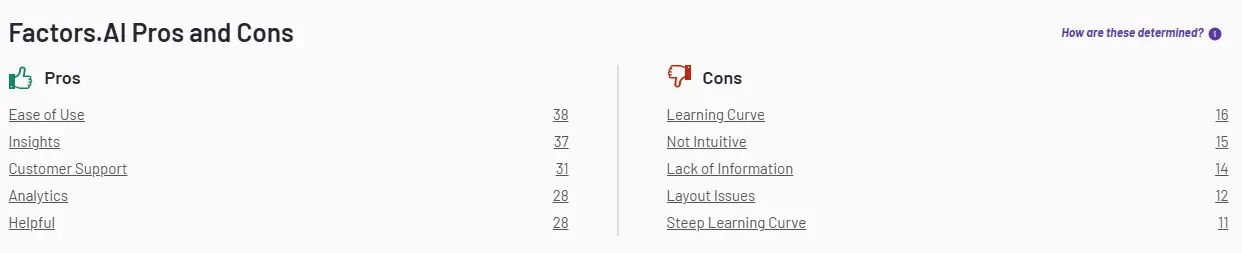
Cons:
- Steep learning curve for beginners.
- Higher pricing compared to some alternatives.
- Limited integration options compared to broader tools like Dealfront.
Pricing:
Factors.ai has four plans, starting from a free plan to a tailored plan for enterprises. Take a look at the detailed pricing.

{{INLINE_CTA_A}}
2. Lead Forensics
Lead Forensics is a sales and marketing platform built around your website traffic. It shows you which companies are on your site and what they're looking at, pings your team when a target account turns up, and gives you decision-maker contacts so you can reach out straight away. Leads get scored and routed to the right rep, and everything syncs to your CRM. Marketing teams use it to see which campaigns bring in real accounts, and account managers use it to catch existing customers browsing the site and spot upsells or win back lapsed ones.
Also Read: Lead Forensics Pricing
Key Features:
- Recognizes the companies visiting your site as it happens and shows firmographic detail for each.
- Sends alerts when target accounts arrive or come back.
- Shows which pages a company viewed and how it found you.
- Adds decision-maker contact data and lead scoring for identified companies.
Pros:
- Contact data for decision-makers at identified companies.
- Real-time alerts when accounts visit.
- Lists a dedicated customer success manager on its pricing page.
Cons:
- Recognizes the business behind a visit, not the individual who made it.
- Pricing is quote-based, so you need a demo and trial to see a figure.
Pricing:
Lead Forensics doesn't publish a price. What you pay depends on your website traffic, and a one-week trial shows you that volume before you commit. There are two plans, Essentials and Automate, and you can add as many users as you like.
3. Warmly
Warmly is a LinkedIn prospecting tool designed to help businesses connect with high-quality leads. By providing real-time insights about LinkedIn profiles, Warmly enables better-targeted engagement with prospective clients.
Also read: ZoomInfo Pricing in 2026: Plans, Costs, Alternatives & Overview
Key Features:
- LinkedIn Integration: Direct integration with LinkedIn for seamless profile analysis.
- Contact Information Discovery: Helps users uncover contact information for leads quickly.
- Customizable Profiles: Users can customize lead profiles to capture specific data points relevant to their campaigns.
- Sales Automation: Allows users to set automated outreach sequences to streamline prospecting efforts.
Pros:
- User-friendly interface that simplifies LinkedIn prospecting.
- Provides detailed contact insights, enhancing the effectiveness of outreach.
- Helpful for quickly building a targeted list of quality leads.
Cons:
- Limited to LinkedIn, which may be restrictive for broader campaigns.
- Lacks advanced analytics and CRM integrations found in some competitor tools.
Pricing:
Warmly offers a basic free plan, while paid plans with more extensive features start at $49/month.
4. VisitorQueue

VisitorQueue is a lead generation tool focused on helping businesses identify previously anonymous website visitors. With its user-friendly interface, VisitorQueue is a good alternative for companies looking for a simpler solution for lead tracking.
Key Features:

- Visitor Identification: Identifies website visitors and offers company details.
- CRM Integration: Seamlessly integrates with CRMs like Salesforce, HubSpot, and Pipedrive.
- Lead Management: Allows users to manage and organize leads in an intuitive dashboard.
- Real-Time Notifications: Sends instant alerts when high-priority leads visit the site.
Pros:
- Easy-to-use and intuitive interface.
- Strong customer support and setup assistance.
- Integrates with popular CRMs for streamlined lead management.

Cons:
- Some users report that smaller companies are not always identifiable.
- Limited custom reporting features.
Pricing:
VisitorQueue’s pricing starts at $39/month, making it a cost-effective option for small to medium-sized businesses.
{{INLINE_CTA_A}}
5. Lift AI
Lift is a unique AI-powered platform that tracks website visitors in real-time and converts them into potential leads. Lift goes beyond simple visitor tracking by turning de-anonymized website visitors into paying customers with AI-powered solutions.
Key Features:
- AI-Powered Lead Conversion: Uses AI to predict which visitors will most likely convert.
- Real-Time Visitor Tracking: Monitors visitors in real-time and provides detailed insights.
- Lead Scoring: Automatically scores leads based on their likelihood to convert.
- CRM Integration: Integrates with popular CRMs for lead management.
Pros:
- Advanced AI-based lead scoring and visitor tracking.
- Focuses on increasing conversions, not just tracking.
- Real-time insights and lead alerts.

Cons:
- Pricing can be higher for smaller businesses.
- Setup can be complex for non-technical users.
Pricing:
Lift’s pricing varies depending on the business’s size and specific requirements. It offers a free trial to test its features, but premium plans are customized based on the number of website visitors and needs.
6. Leadmagic

Leadmagic is a simple yet powerful tool designed to help B2B companies track their website visitors and utilize de-anonymized data to gain valuable insights, converting leads into customers.
Also read: 10 Best Visitor Queue Alternatives For B2B Teams
Key Features:
- Visitor Tracking: Identifies which companies are visiting your website.
- CRM Integration: Connects seamlessly with leading CRM platforms.
- Lead Prioritization: Offers tools to prioritize high-quality leads.
- Detailed Analytics: It provides insights into visitor behavior and how it interacts with your site.

Pros:
- Simple and easy-to-use interface.
- Strong integrations with major CRMs.
- Offers real-time lead alerts.

Cons:
- Fewer advanced features compared to larger tools like Dealfront.
- Limited customization options for reporting.
Pricing:
Leadmagic offers transparent pricing plans starting at $49/month, making it a cost-effective option for small and mid-sized businesses.
7. Cognism

Cognism is a sales intelligence platform that helps businesses identify high-quality leads through advanced data and artificial intelligence. It’s designed to give businesses real-time insights into previously anonymous leads, making the sales process more efficient and effective.
Key Features:

- Sales Intelligence: Offers real-time data about potential leads, including verified emails and phone numbers.
- Lead Enrichment: Automatically updates lead profiles with the latest information.
- Compliance: Ensures that all data collected complies with GDPR and other relevant regulations.
- Intent Data: Uses intent signals to identify prospects who are ready to buy.
Pros:
- Offers high-quality, compliant lead data.
- Real-time insights into customer behavior and needs.
- Powerful intent data feature that helps identify hot leads.

Cons:
- Pricing may be high for smaller companies.
- Complex setup for teams not familiar with data enrichment tools.
Pricing:
Cognism offers custom pricing based on the number of leads and the specific needs of your business. Plans typically start at $1,000/month, making it more suitable for larger enterprises.
{{INLINE_CTA_A}}
8. Kickfire
Kickfire is a B2B website visitor identification tool that helps businesses uncover which companies are visiting their website, even if the visitor doesn’t fill out any forms. Kickfire's advanced IP-to-company tracking technology is ideal for companies that want detailed visitor analytics and insights based on de-anonymized data.
Key Features:

- IP-to-Company Identification: Accurately identifies which businesses are visiting your website based on their IP addresses.
- Real-Time Alerts: Sends notifications when high-value companies visit your site.
- CRM and Marketing Automation Integration: Integrates with major CRMs like Salesforce, and marketing automation tools like Marketo and HubSpot.
- Data Enrichment: Provides enriched company data to help sales teams understand more about their prospects.
Pros:
- Accurate and reliable company identification.
- Strong integration with CRMs and marketing platforms.
- Provides real-time visitor tracking and data enrichment.

Cons:
- IP-based tracking can sometimes miss smaller companies or individuals.
- Limited features outside of visitor identification and enrichment.
Pricing:
Kickfire offers customized pricing based on the size of your business and the number of visitors you track. The company offers a demo to help potential customers explore the platform.
9. Leadinfo

Leadinfo is a straightforward and user-friendly visitor tracking tool that helps businesses identify the companies visiting their website. Like Dealfront, Leadinfo delivers de-anonymized visitor behavior insights to help businesses convert website traffic into leads.
Key Features:
- Visitor Identification: Recognizes companies visiting your website in real-time.
- Lead Management: Allows businesses to manage leads directly within the platform.
- CRM Integration: Integrates with CRM tools like Salesforce, HubSpot, and Pipedrive.
- Behavioral Insights: Offers detailed insights into how visitors interact with your site.
Pros:
- Simple and easy to use, even for smaller teams.
- Offers seamless CRM integrations.
- Provides detailed insights into visitor behavior.

Cons:
- Lacks some of the advanced features available in more robust tools.
- Pricing might not be as competitive for smaller businesses.
Pricing:
Leadinfo offers a starting plan at €49/month, ideal for smaller businesses looking for basic visitor tracking and lead identification.
Also read: 10 Best Madison Logic Alternatives And Competitors In 2026
{{INLINE_CTA_A}}
10. Clearbit

Clearbit is a leading data enrichment platform that allows businesses to enrich their leads, improve marketing campaigns, and identify website visitors. Clearbit focuses on providing businesses with accurate, de-anonymized lead data, enabling more personalized and effective outreach.
Key Features:

- Data Enrichment: Enriches lead information in real-time with data such as company details, industry, employee count, and more.
- Website Visitor Tracking: Identifies which companies are visiting your website.
- Real-Time Insights: Provides real-time insights and alerts when key leads visit your site.
- Lead Enrichment API: Allows businesses to enrich their CRM data automatically.
Pros:
- Offers robust data enrichment features.
- Integrates seamlessly with popular marketing tools like HubSpot and Marketo.
- Provides real-time insights into visitor behavior.

Cons:
- Pricing can be prohibitive for small businesses.
- Limited visitor tracking features compared to more specialized tools.
Pricing:
Clearbit offers custom pricing based on company needs. Plans typically start at around $499/month, depending on the volume of data and features required.
Why Is Factors the Best Dealfront Alternative?
Factors.ai distinguishes itself among Dealfront alternatives through its AI-powered insights and advanced marketing attribution capabilities. While many tools primarily focus on lead tracking, Factors.ai provides a comprehensive view of customer journeys, showcasing how different marketing touchpoints influence conversions. Its AdPilot feature, which leverages AI to optimize ad campaigns, offers significant value for businesses aiming to enhance their digital marketing ROI.
The platform's focus on marketing attribution and in-depth analytics enables businesses to understand where their leads are coming from and how to refine their marketing strategies for greater effectiveness. This combination of advanced attribution and actionable insights makes Factors.ai a powerful tool for businesses looking to optimize their marketing efforts beyond simple lead tracking.
Also read: Top 5 6sense Alternatives and Competitors For B2B GTM Teams in 2026
{{INLINE_CTA_A}}
Here are the top 10 alternatives to Dealfront (now rebranded back to Leadfeeder) for B2B lead generation and sales intelligence
In a Nutshell
While Dealfront (now known as Leadfeeder again) is a powerful tool, many alternatives offer unique features, pricing models, and specialized services to cater to different business needs. Whether you’re looking for more affordable options like Snitcher or advanced AI-driven tools like Factors.ai, it's essential to assess your specific business requirements before making a decision. By exploring the top Dealfront competitors, businesses can find the perfect tool to enhance their lead generation and customer conversion efforts.
Here's a breakdown of the top 10 alternatives to Dealfront (now rebranded back to Leadfeeder) for B2B lead generation and sales intelligence in 2026:
1. Factors.ai
An AI-driven marketing attribution and analytics platform that helps businesses understand and optimize customer journeys. It offers features like AI-powered insights, marketing attribution, customizable dashboards, and the innovative AdPilot feature for automating and optimizing ad campaigns.
2. Lead Forensics
Identifies the companies visiting your website and adds decision-maker contact data, alerts and lead scoring. Pricing is quote-based and tied to website traffic.
3. Warmly
A LinkedIn prospecting tool designed to help businesses connect with high-quality leads by providing real-time insights about LinkedIn profiles, enabling better-targeted engagement with prospective clients.
4. VisitorQueue
Offers simple tracking of website visitors but lacks advanced reporting and customization features compared to other tools.
5. Lift AI
An AI-powered lead conversion tool that helps in identifying and converting leads, though it may have a complex setup and higher cost.
6. Leadmagic
Provides easy visitor tracking but offers fewer advanced features, making it suitable for businesses looking for basic functionalities.
7. Cognism
Offers rich lead data and is best suited for larger enterprises seeking comprehensive sales intelligence solutions.
8. Kickfire
Known for accurate IP tracking, it focuses on visitor identification but has limited features beyond that.
9. Leadinfo
Provides real-time tracking with a simple interface, though it offers fewer features compared to more comprehensive platforms.
10. Clearbit
Offers strong data enrichment capabilities but comes with high pricing and limited visitor tracking features.
Each of these platforms offers unique features catering to different business needs, however Factors stands out due to its AI-powered insights and account identification capabilities.
Top 10 RollWorks Alternatives and Competitors for Effective Account-Based Marketing
Explore the best RollWorks alternatives to enhance your Account-Based Marketing strategy. Compare features, pricing, and pros & cons to find the perfect ABM tool for your business. Discover top options like Terminus, Demandbase, and more.
Businesses increasingly turn to Account-Based Marketing (ABM) to tailor their outreach and boost engagement with key accounts. RollWorks, with its powerful ABM platform that integrates smoothly with Salesforce, is a standout option for companies seeking comprehensive tools to streamline targeted campaigns and unify sales and marketing efforts.
However, as businesses grow and their ABM needs change, they may find it beneficial to explore other platforms that offer specialized features or better align with their unique goals. This introduction highlights 10 noteworthy alternatives to RollWorks, each bringing its own strengths to enhance ABM strategies and drive customer acquisition and retention.
Overview of RollWorks
RollWorks is a robust Account-Based Marketing (ABM) platform within the NextRoll family. It focuses on helping B2B companies identify, target, and engage with key accounts through data-driven insights. The platform integrates smoothly with Salesforce, ensuring data synchronization and offering a unified view of customer interactions. It’s designed to enhance the efficiency of marketing and sales teams through AI-powered tools and comprehensive analytics.
Key Features
- AI-Powered Lead Scoring: Automates the identification of high-value leads based on predictive models.
- Personalized Outreach: Facilitates targeted engagement through email, social media, and other channels.
- Salesforce Integration: Ensures seamless data flow between RollWorks and Salesforce CRM.
- Comprehensive Analytics: Provides detailed insights into campaign performance, helping to measure ROI effectively.
- Account Targeting: Allows businesses to focus on the most promising accounts.
Pros
- Ease of Use: The platform is user-friendly, making it accessible even for teams with limited ABM experience.
- Effective Targeting: RollWorks identifies and reaches the right audience segments, enhancing campaign efficiency.
- Integration Capabilities: Its strong integration with Salesforce and other tools ensures smooth data management and workflow.
- Scalability: Suitable for businesses of various sizes, from small enterprises to large corporations.
Cons
- Learning Curve: Some users may find the platform complex initially, requiring time to leverage its capabilities fully.
- Cost: RollWorks can be expensive, especially for smaller companies with limited budgets.
- Limited Reporting Customization: While the analytics are comprehensive, some users might have limited reporting customization options.
{{INLINE_CTA_A}}
Pricing
RollWorks offers various pricing tiers based on a business's needs, but detailed pricing is typically provided upon request. The platform is a significant investment, particularly for smaller companies.
Here are 10 Rollworks Alternatives
Demandbase One

Overview
Demandbase One is a Smarter GTM™ (Go-To-Market) platform designed to help sales and marketing teams achieve their revenue goals with fewer resources. By leveraging Account Intelligence — rich, reliable account-level insights — the platform orchestrates sales and marketing strategies, injecting relevance into every stage of the B2B buying journey. It provides a unified view, connecting all sources of intelligence and insights with sales and marketing activities. This integration enables teams to identify opportunities earlier, engage more intelligently, and close deals faster.
The platform allows the creation of precise audiences using Account Intelligence, CRM and MAP data, intent signals, technographics, and more. It includes capabilities to enhance precision and control: a B2B advertising platform optimized to reach whole buying teams, personalized website conversions, coordinated customer interactions across ecosystems and channels, and comprehensive measurement of how marketing and sales activities drive pipeline and revenue. Additionally, sellers can use their CRM apps to access intelligent insights on contacts and companies, including Demandbase engagement and intent activity. Demandbase One's ABM/ABX/Sales Intelligence coordinates all GTM touches for a seamless buying experience.
Key Features
- Data Availability:
- Contact Data Availability: Access to extensive contact data to support targeted marketing and sales efforts.
- Company Data Availability: Comprehensive company data to enhance account-based strategies.
- Industry Research Availability: Industry-specific insights to refine targeting and engagement strategies.
- Data Accuracy:
- Contact Data Accuracy: High accuracy in contact data to ensure effective communication and engagement.
- Company Data Accuracy: Reliable company data accuracy to support informed decision-making.
- Features:
- Lead Builder: Tools to create and manage leads efficiently.
- Integration to CRM/Marketing Automation: Seamless integration with CRM and marketing automation platforms.
- Data Cleaning/Enrichment: Capabilities to clean and enrich data for better accuracy and usability.
- Data Segmentation/Filtering: Advanced segmentation and filtering options to target specific audiences.
- Search: Powerful search functionalities to find relevant data quickly.
- News/People Alerts: Alerts for news and updates related to key contacts and companies.
- Connections: Tools to identify and leverage connections within target accounts.
- Reporting: Comprehensive reporting features to track performance and outcomes.
- Messaging: Messaging capabilities to communicate effectively with prospects and customers.
- Lead Intelligence: Insights into lead behavior and preferences.
- Account-level Insights: Detailed insights at the account level to drive strategic decisions.
Pros
- Ease of Use: Highly user-friendly interface, making it accessible for users of all skill levels.
- Intent Data: Effective use of intent data to target potential buyers.
- Insights: Provides valuable insights to inform sales and marketing strategies.
- Intent Analysis: Advanced analysis of intent signals to identify high-potential leads.
- Easy Integrations: Smooth integration with existing CRM and marketing automation tools.
Cons
- Learning Curve: Some users may experience a steep learning curve initially.
- Inaccuracy Issues: Occasional inaccuracies in data may affect outcomes.
- Difficult Learning: Learning the full range of features and capabilities can be challenging for new users.
- Inaccuracy: Reports of data inaccuracy that may need addressing.
- Not User-Friendly: Some users find the interface less intuitive and user-friendly.
Pricing
For detailed pricing information, please visit the Demandbase website.
Terminus ABM Platform

Overview
Businesses now need much more than just traditional customer engagement and account management methods. Businesses are under increased pressure to maximize the efficiency of their marketing spend and deliver more targeted, effective campaigns. The Terminus ABM Platform is designed to meet these demands, providing a comprehensive solution that leverages first-party data to create engaging digital experiences across the entire account lifecycle—from acquisition to expansion and renewal.
Terminus is engineered to drive return on investment (ROI), minimize fraud, ensure brand safety, and transform intent data into actionable insights for go-to-market (GTM) teams. By integrating sophisticated lead intelligence and management capabilities with robust marketing campaign tools, Terminus enables businesses to stay ahead of the competition and achieve their strategic objectives.
Key Features
- Lead Intelligence
- Market Insights: Provides a broad view of market trends and dynamics, helping businesses to stay informed and agile.
- Account-level Insights: Delivers detailed information on key accounts, facilitating targeted engagement strategies.
- Lead Analysis: Enables deep dives into lead behavior and characteristics to refine targeting and improve conversion rates.
- Lead Management
- Segmentation: Allows for precise audience segmentation to tailor messages and campaigns for different market segments.
- Account Identification: Helps in pinpointing high-value accounts and prioritizing them for focused marketing efforts.
- Marketing Campaigns
- Omni-Channel Tracking: Monitors and tracks campaigns across multiple channels to provide a holistic view of marketing performance.
- Revenue Planning: Supports the planning and forecasting of revenue outcomes from marketing activities.
- Media Attribution: Links marketing activities to business outcomes, attributing value to different media and channels.
- Opportunity Timeline: Visualizes the timeline of opportunities to optimize follow-ups and sales processes.
- Customization: Offers tools to tailor campaigns and marketing strategies to specific business needs.
- Platform Additional Functionality
- Multivariate Testing: Facilitates A/B testing and other experimental approaches to optimize campaigns.
- Integrations: Seamlessly integrates with other business tools and platforms to enhance functionality and data flow.
- Platform Basics
- Retargeting: Enables retargeting campaigns to re-engage potential leads who have shown interest but have not yet converted.
- Platform Data
- Campaign Measurement: Provides comprehensive metrics to assess the effectiveness of marketing campaigns.
- Attribution: Offers robust attribution models to understand the impact of different marketing activities on business outcomes.
Pros
- Ease of Use: Rated highly for user-friendly interfaces and intuitive design.
- Features: Extensive feature set that covers all aspects of ABM.
- Audience Targeting: Effective targeting capabilities for precise audience segmentation.
- Customer Support: Generally positive feedback on the responsiveness and helpfulness of customer support.
- ABM Management: Strong capabilities in managing and optimizing account-based marketing activities.
Cons
- Missing Features: Some users report the absence of certain desired features.
- Reporting Issues: Occasional challenges with generating and interpreting reports.
- Integration Issues: Difficulties in integrating with certain third-party tools.
- Limited Analytics: The analytics capabilities may not be as advanced as some users require.
- Not User-Friendly: A few users find certain aspects of the platform less intuitive or harder to navigate.
Pricing
Visit the Terminus website for detailed pricing information. Pricing typically varies based on the specific needs and scale of the business, including the number of users and the level of features and support required.
Factors

Overview
Factors is a leading AI-powered platform that excels in helping marketing and sales teams identify and target high-value accounts. It offers comprehensive tools for automating and optimizing account-based marketing (ABM) strategies. Factors integrates smoothly with existing CRM systems, making it a viable alternative to RollWorks, especially for businesses looking for advanced AI capabilities and deeper insights into account behavior.
Key Features
- AI-Powered Insights
- Advanced AI tools provide predictive analytics and lead scoring.
- Behavioral Analytics
- In-depth analysis of account behaviors to refine targeting.
- Customizable Dashboard
- Allows users to create tailored dashboards for different teams.
- Seamless CRM Integration
- Works well with major CRMs like Salesforce and HubSpot.
- Multi-Channel Campaigns
- Supports campaigns across various channels, including email, social media, and the web.
6. AdPilot:
- Maximize your LinkedIn Ads ROI with Factors' LinkedIn AdPilot. This platform enhances your ad strategy with features like campaign automation, intent-based audience building, view-through attribution, smart reach optimization, and seamless integration with Factors' conversions API.
7. G2 Intent:
- Integrates G2 intent data, empowering businesses to pinpoint which accounts are actively exploring their product category.
- This allows for prioritizing high-intent accounts, resulting in more precise marketing and sales efforts and a higher probability of conversion.
8. Account Deanonymization:
- Businesses can uncover and analyze anonymous website visitors.
- By collecting firmographic data such as company name, industry, and size, companies can personalize their outreach and fine-tune their marketing strategies.
9. Custom Workflows:
- Offers customizable workflow automation that enables marketing and sales teams to streamline operations across CRM systems and campaign management tools.
- These tailored workflows enhance operational efficiency and ensure cohesive alignment across go-to-market teams.
Also Read: Set Up Sales Automation Workflows Using Factors
Pros
- Advanced AI Capabilities: Offers highly sophisticated AI-driven insights, improving targeting accuracy.
- User-Friendly Interface: Intuitive and easy to navigate, even for users new to ABM platforms.
- Customizability: Allows a high degree of customization, particularly in reporting and dashboards.
- Comprehensive Support: Strong customer support with detailed documentation and onboarding assistance.
Cons
- Pricing: Can be on the higher end, which might be a barrier for smaller businesses.
- Complexity: The extensive features might overwhelm users who require only basic functionalities.
- Limited Integrations: While it integrates well with major CRMs, there might be fewer integration options compared to RollWorks.
Pricing
Factors typically offers tiered pricing based on business size and specific needs. Like RollWorks, it is generally tailored for larger enterprises, and detailed pricing information is usually available upon request.
{{INLINE_CTA_A}}
Metadata.io

Overview
Metadata.io offers a Marketing Operating System (OS) tailored for B2B marketers, designed to streamline and automate the complex processes involved in driving revenue. By leveraging advanced automation, Metadata.io allows marketers to focus on high-value tasks such as strategy and creativity, rather than getting bogged down in manual, repetitive work. The platform covers everything from audience building to running paid campaigns and optimizing them for revenue, thus enhancing efficiency and effectiveness.
Key Features
- Lead Intelligence
- Account-level Insights: Provides deep insights at the account level to understand potential leads better.
- Lead Analysis: Offers detailed analysis of leads to help prioritize and target the most promising prospects.
- Lead Management
- Segmentation: Allows for precise segmentation of leads to tailor marketing efforts more effectively.
- Account Identification: Identifies key accounts to focus marketing and sales efforts on high-value targets.
- Marketing Campaigns
- Media Attribution: Tracks the effectiveness of different media channels in driving conversions.
- Omni-Channel Tracking: Provides comprehensive tracking across multiple marketing channels.
- Opportunity Timeline: Maps out the timeline of opportunities to better understand the customer journey.
- Customization: Offers extensive customization options to tailor campaigns to specific needs.
- Platform Basics
- Retargeting: Enables retargeting to engage potential customers who have interacted with your brand previously.
- Platform Data
- Campaign Measurement: Measures the performance of campaigns to assess their effectiveness.
- Attribution: Provides detailed attribution to understand which efforts are driving results.
- Platform Additional Functionality
- Multivariate Testing: Allows for testing multiple variables to optimize campaigns.
- Integrations: Integrates with various other tools and platforms to streamline workflow.
Pros
- Campaign Management (23 votes): Efficient and effective campaign management features.
- Customer Support (23 votes): High-quality customer support.
- Ease of Use (19 votes): User-friendly interface.
- Audience Targeting (15 votes): Precise audience targeting capabilities.
- Tracking Performance (12 votes): Robust performance tracking features.
Cons
- Editing Limitations (9 votes): Some limitations in editing capabilities.
- Difficult Learning (5 votes): Steep learning curve for new users.
- Integration Issues (5 votes): Occasional issues with integrations.
- Campaign Management (4 votes): Some users reported difficulties with campaign management.
- Complexity (4 votes): The platform can be complex and overwhelming for some users.
Pricing
For detailed pricing information, it is recommended to visit the Metadata.io website to get the most up-to-date and comprehensive pricing details.
HubSpot Marketing Hub

Overview
HubSpot Marketing Hub is designed to streamline and enhance the marketing efforts of modern businesses. It addresses common challenges faced by marketers who often deal with fragmented data and complex tools. With Marketing Hub, all marketing tools and customer data are integrated into a single platform, making it easier to manage and utilize effectively. This integration not only saves time but also enables marketers to deliver personalized experiences that attract and convert leads efficiently. Being part of the HubSpot CRM platform ensures that marketing efforts are aligned with sales goals, facilitating better ROI measurement and investment validation.
Key Features
- Email Marketing:
- Building and Personalizing Emails: Create and customize emails tailored to specific audiences.
- Sending Outbound Emails: Manage outbound email campaigns directly from the platform.
- Manage Email Deliverability: Monitor and optimize email deliverability rates.
- Automated Email Responses: Set up automated responses based on user actions or triggers.
- Online Marketing:
- Landing Pages and Forms: Design and deploy landing pages and forms to capture leads.
- Dynamic Content: Deliver personalized content based on user behavior or preferences.
- Mobile Optimized: Ensure all marketing assets are optimized for mobile devices.
- Lead Management:
- Marketing Lead Database: Store and manage leads effectively within the platform.
- Data Quality Management: Ensure data accuracy and cleanliness.
- Segmentation: Segment leads based on various criteria for targeted marketing.
- Lead Nurturing: Automate lead nurturing workflows to move leads through the sales funnel.
- Online Behavior Tracking: Track and analyze user behavior across digital channels.
- Automated Alerts and Tasks: Set up alerts and tasks based on lead interactions and behaviors.
- Reporting & Analytics:
- Basic Reporting: Access standard reports to track campaign performance and KPIs.
- Web Analytics: Monitor website performance and visitor behavior through integrated analytics tools.
Pros
- Ease of Use: HubSpot Marketing Hub is praised for its user-friendly interface and intuitive design.
- Marketing Management: Users appreciate the platform's capabilities for comprehensive marketing management.
- Email Marketing: Effective tools for building, sending, and managing email campaigns.
- Content Creation: Tools to create compelling and personalized content.
- Automation Benefits: Significant automation features that streamline marketing workflows.
Cons
- Limited Features: Some users find that certain advanced features they require may be lacking.
- Complex Usage: Despite its user-friendly design, some aspects of the platform can be complex to master.
- Limited Customization: The degree of customization may not meet the needs of all users.
- Learning Curve: New users may face a learning curve when first using the platform.
- Missing Features: Specific features desired by users may not be available in the current version.
Pricing
While not detailed here, pricing can sometimes be a concern for businesses, depending on their budget and needs.
Foundry ABM Platform

Overview
Foundry's Account-Based Marketing (ABM) platform is designed to streamline and optimize marketing and sales efforts across the entire buyer's journey. It integrates multiple functionalities into a unified platform powered by AI to enhance campaign effectiveness and drive engagement within target accounts.
Key Features
- Lead Intelligence
- Market Insights: Provides deep market insights to understand trends and opportunities.
- Account-level Insights: Delivers specific insights into individual target accounts.
- Lead Analysis: Analyzes lead behavior and engagement patterns.
- Account-level Insights: Offers detailed analytics at the account level.
- Lead Management
- Segmentation: Segments leads based on various criteria for personalized targeting.
- Account Identification: Identifies and prioritizes key target accounts for focused efforts.
- Marketing Campaigns
- Customization: Allows customization of campaigns based on segmented insights and identified accounts.
- Campaign Execution
- Website Personalization: Personalizes web experiences based on visitor data and account insights.
- Prioritized Accounts: Focuses campaign efforts on high-priority accounts for maximum impact.
- Platform Additional Functionality
- Integrations: Integrates with other marketing and CRM tools for seamless data flow and campaign management.
- Platform Data
- Campaign Measurement: Measures the effectiveness of campaigns with detailed analytics.
- Attribution: Provides insights into campaign attribution to understand ROI and effectiveness.
Pros
- Audience Targeting: Precision targeting of specific audiences and accounts.
- ABM Management: Comprehensive tools for managing ABM strategies effectively.
- Ease of Use: Generally rated as user-friendly for marketers and sales teams.
- Reporting: Robust reporting capabilities to track campaign performance.
- Campaign Management: Efficient tools for orchestrating and managing campaigns.
Cons
- Complexity: Some users find the platform complex, requiring a learning curve.
- Not User-Friendly: Mixed feedback on user-friendliness, particularly for new users.
- Poor Integration: Issues reported with integrating with other systems.
- Campaign Management: Challenges in managing complex campaigns efficiently.
- Integration Issues: Users have encountered difficulties with third-party integrations.
Pricing
Pricing details need to be reviewed on their official website for transparency. This will provide specific details on features, pricing, and additional functionalities Foundry ABM offers.
{{INLINE_CTA_A}}
ZoomInfo Sales

Overview
ZoomInfo Sales is a leading platform designed for B2B companies. It offers a comprehensive suite of tools to optimize sales and marketing efforts. At its core, ZoomInfo Sales boasts the largest and most accurate database of insights, intelligence, and purchasing intent data for companies and individual contacts. This data is continuously updated to ensure relevance and reliability.
In addition to its extensive data offerings, ZoomInfo Sales integrates various tools such as conversation intelligence (Chorus), sales engagement (Engage), and data orchestration (RingLead). These integrations enhance engagement with prospects and customers, ultimately empowering sales teams to achieve higher conversion rates and meet their targets more effectively.
Key Features
- Data Availability:
- Contact Data Availability
- Company Data Availability
- Industry Research Availability
- Data Accuracy:
- Contact Data Accuracy
- Company Data Accuracy
- Features:
- Lead Builder
- Integration with CRM/Marketing Automation platforms
- Data Cleaning/Enrichment
- Data Segmentation/Filtering
- Search Capabilities
- News and People Alerts
- Reporting Tools
- Platform Performance and Reliability
- Analytics
- Export/Import Functionality
- Lead Monitoring Features
Pros
- Comprehensive Data and Tools: Users appreciate ZoomInfo's extensive database and the array of tools available, such as lead building and integration with CRM systems.
- Ease of Use: The platform is noted for its user-friendly interface, making it easy to find and qualify leads.
- Effective for Tradeshows: Many users find ZoomInfo invaluable for preparing for tradeshows and strategic initiatives.
- Data Accuracy: High praise for the accuracy and reliability of the data provided.
Cons
- Potential for Over-Research: Some users easily get lost in the abundance of information available, which can distract from immediate action on leads.
- Learning Curve: Although generally user-friendly, new users may face a learning curve when navigating the platform's full capabilities.
Pricing
For detailed pricing information, it is recommended to visit ZoomInfo's official website or contact their sales team directly. You can also read our blog on ZoomInfo Pricing here.
Adobe Marketo Engage

Overview
Adobe Marketo Engage is a comprehensive marketing automation platform designed to empower marketing teams to drive demand and growth by delivering personalized customer experiences. In today's competitive landscape, where generic marketing tactics are less effective, Marketo Engage helps businesses integrate marketing and sales efforts seamlessly throughout the customer journey.
Challenges Addressed: Modern customers expect personalized interactions and are averse to generic marketing approaches and cold sales calls. To meet these expectations and stay competitive, marketing teams must deeply understand their customers. Marketo Engage assists in achieving this by leveraging customer data, content, automation, and analytics to personalize engagements at scale.
Key Features
- Email Marketing:
- Building and Personalizing Emails: Create customized emails tailored to specific customer segments.
- Sending Outbound Emails: Manage and automate outbound email campaigns.
- Manage Email Deliverability: Ensure emails reach recipients' inboxes effectively.
- Automated Email Responses: Set up automated responses based on customer interactions.
- Online Marketing:
- Landing Pages and Forms: Design and optimize landing pages and forms for lead capture.
- A/B Testing: Experiment with different versions of content to optimize performance.
- Mobile Optimized: Ensure marketing assets are optimized for mobile devices.
- Lead Management:
- Segmentation: Categorize leads into segments based on demographics, behavior, etc.
- Lead Scoring and Grading: Prioritize leads based on their likelihood to convert.
- Lead Nurturing: Engage leads with targeted content to move them through the sales funnel.
- Online Behavior Tracking: Monitor and analyze how leads interact with online content.
- Automated Alerts and Tasks: Set up notifications and tasks based on lead behavior.
- CRM Lead Integration: Sync lead data with CRM systems for unified customer insights.
- Campaign Management:
- Program Management: Plan, execute, and manage marketing campaigns across channels.
- Reporting & Analytics:
- Basic Reporting: Generate reports to track campaign performance and measure ROI.
Pros
- Ease of Use: Marketo Engage is known for its user-friendly interface.
- Marketing Automation: Comprehensive tools for automating marketing processes.
- Email Marketing: Robust capabilities for personalized email campaigns.
- Customer Engagement: Facilitates personalized customer interactions.
- Automation Efficiency: Improves efficiency in marketing operations.
Cons
- Learning Curve: Some users find the platform initially challenging to master.
- Expensive: Higher pricing compared to some other marketing automation solutions.
- Not Intuitive: Interface may not be as intuitive for all users.
- High Complexity: Can be complex, especially for smaller teams without dedicated resources.
- Poor Customer Support: Some users report issues with customer support responsiveness.
Pricing
For detailed pricing information, it's best to visit Adobe Marketo Engage's official website as pricing can vary based on features, deployment options, and organizational needs.
{{INLINE_CTA_A}}
Salesforce Marketing Cloud Account Engagement

Overview
Salesforce Marketing Cloud Account Engagement is a comprehensive marketing automation platform designed to enhance collaboration between sales and marketing teams, ultimately driving efficient growth. Integrated with Salesforce's CRM and service solutions, it provides a unified view of customer interactions and campaign performance, ensuring consistent and personalized customer experiences.
Key Features
- Email Marketing:
- Build and personalize emails
- Manage email deliverability and automated responses
- Online Marketing:
- Create mobile-optimized landing pages and forms
- Lead Management:
- Maintain a marketing lead database
- Ensure data quality management and segmentation
- Implement lead scoring, nurturing, and CRM integration
- Track online behavior and automate alerts/tasks
- Reporting & Analytics:
- Basic reporting capabilities to measure campaign performance and ROI
Pros
- Ease of Use: User-friendly interface makes it accessible for marketers.
- Marketing Automation: Streamlines marketing processes and improves efficiency.
- Customer Engagement: Facilitates personalized customer interactions.
- Email Marketing: Robust tools for effective email campaign management.
- Automation Efficiency: Saves time and enhances productivity.
Cons
- Learning Curve: Complex functionalities may require time to master.
- Expensive: High cost of ownership, especially for smaller businesses.
- High Complexity: Comprehensive features may be overwhelming.
- Missing Features: Some advanced features may not be included in basic packages.
- Not Intuitive: The interface may not be intuitive for all users.
Pricing
For detailed pricing information, visit Salesforce's official website or contact their sales team directly. Pricing typically varies based on the scale of deployment, features selected, and specific business needs.
StackAdapt

Overview
StackAdapt is a prominent multi-channel advertising platform specializing in various advertising solutions, including native, display, video, connected TV (CTV), audio, in-game, and digital-out-of-home (DOOH) ads. The platform integrates advanced machine learning capabilities with a user-friendly interface, focusing on the core aspects of programmatic advertising: planning, executing, and analyzing campaigns.
Key Features
- Video Functionality:
- Enables comprehensive management and optimization of video ad campaigns across various channels.
- Campaign Management:
- Campaign Dashboard: Provides a centralized view of campaign performance and key metrics.
- Campaign Optimization: Tools for optimizing ad campaigns to improve performance.
- Reach and Brand Safety: Ensures ads reach the right audience while maintaining brand safety standards.
- Frequency Capping: Controls how often users see ads to prevent overexposure.
- Budget Pacing: Manages spending to ensure campaigns stay within budget.
- Creative Optimization: Tools for improving ad creative to enhance engagement.
- Targeting:
- Targeting: Allows precise targeting based on demographics, behavior, and interests.
- Retargeting: Engages users who have previously interacted with ads or websites.
- Geo-Targeting: Targets users based on geographic location.
- Contextual Targeting: Places ads in relevant content contexts to enhance relevance.
- Platform:
- Custom Reports: Generates tailored reports to track campaign performance.
- User, Role, and Access Management: Manages user permissions and access levels.
- Performance and Reliability: Ensures reliable performance to support high-demand advertising campaigns.
Pros
- Helpful Customer Support: High ratings for customer support responsiveness.
- Ease of Use: User-friendly interface that simplifies campaign management.
- Comprehensive Campaign Management: Tools for optimizing and managing ad campaigns effectively.
- High Customer Satisfaction: Recognized as a top DSP in customer satisfaction.
Cons
- Reporting Limitations: Some users report limitations in the platform's reporting capabilities.
- Functionality Limitations: Occasional feedback about limited features compared to other platforms.
- Pricing Concerns: Details about pricing structure and affordability may vary based on user needs.
Pricing
For specific pricing details, it's recommended to visit StackAdapt's official website or contact their sales team directly, as pricing structures can vary based on campaign specifics and user requirements.
Here’s Why Factors is the Best RollWorks Alternative
Factors stands out as a superior alternative to RollWorks for several compelling reasons. First and foremost, Factors excels in leveraging advanced AI and machine learning algorithms to provide highly accurate and actionable insights. Unlike RollWorks, which offers a more traditional approach to account-based marketing (ABM), Factors integrates cutting-edge technology to enhance data-driven decision-making and optimize marketing strategies.
Factors’ intuitive platform allows seamless integration with existing CRM and marketing tools, providing a unified view of customer interactions and engagement. This integration facilitates better targeting and personalization, improving campaign performance and ROI. Factors offers robust analytics and reporting features that deliver in-depth insights into campaign effectiveness, enabling marketers to refine their strategies based on real-time data.
Moreover, Factors's user-friendly interface and customizable features cater to businesses of all sizes, making it an accessible and versatile solution. The platform’s scalability ensures it can adapt to evolving business needs, unlike RollWorks, which may require more extensive adjustments as companies grow.
{{INLINE_CTA_A}}
LinkedIn AdPilot by Factors
LinkedIn AdPilot, a feature offered by Factors, provides a powerful tool for optimizing LinkedIn advertising campaigns. This advanced solution enhances ad performance by utilizing AI-driven insights to target the right audience precisely. LinkedIn AdPilot offers real-time analytics and automated recommendations, helping marketers refine their ad strategies and achieve better engagement and conversion rates. By integrating seamlessly with LinkedIn's advertising platform, AdPilot simplifies campaign management and boosts the effectiveness of ad spend, making it an invaluable asset for businesses looking to maximize their LinkedIn advertising efforts.
Exploring alternatives to RollWorks helps businesses find ABM platforms that better align with their specific needs and goals.
1. Factors.ai: AI-driven account intelligence, cross-channel intent capture, and seamless integrations to enhance ABM strategies.
2. Demandbase: Comprehensive ABM solutions with robust targeting and personalization features.
3. Terminus: Multichannel engagement and advanced analytics to drive account-based campaigns.
4. 6sense: Predictive analytics to identify and engage high-intent accounts effectively.
These platforms optimize ABM efforts, improve targeting, and increase ROI.
In a Nutshell
Selecting the optimal ABM platform depends on various factors, including organizational goals, scalability requirements, and the complexity of marketing operations. Each alternative to RollWorks offers distinct advantages, from advanced analytics and predictive capabilities to seamless CRM integration and simplified automation workflows.
Evaluating these alternatives ensures that ABM strategies remain adaptive and effective in achieving targeted growth and customer engagement objectives. Whether prioritizing personalized customer experiences, enhancing lead management capabilities, or optimizing campaign ROI, these alternatives provide diverse solutions tailored to meet the demands of modern B2B marketing environments.

The Ultimate Guide to Advanced Marketing Analytics Techniques
Unlock the power of advanced marketing analytics techniques with this guide. Learn data-driven strategies to optimize campaigns and drive business growth.

This article on advanced marketing analytics covers…
- What is advanced marketing analytics?
- Limitations with marketing analytics
- Normalization of data prior to marketing analytics
- An overview of advanced marketing analytics techniques
- How to implement the advanced marketing analytics techniques?
- How Factors can help your business?
- Frequently Asked Questions
The impact of advanced marketing analytics has consistently expanded in B2B marketing. Making sense of relevant marketing data using analytics has always been of interest to marketers, but the ability to connect large data-set across various channels and programs has taken data-driven decision making to the next level.
But how exactly can marketers go about making the most of their data? And once techniques and strategies for advanced marketing analytics have been identified, how can one ensure a smooth, frictionless implementation.
Most discussions of cutting-edge marketing and sales analytics tend to get bogged down in jargon. In this article, we will discuss the most effective methods of marketing analytics in simple terms. In order to provide a sense of how these methods operate in practice, we’ll also share a few concrete examples. Then, we'll highlight how advanced marketing analytics may be best used by data-driven marketers.
What is advanced marketing analytics?
Advanced marketing analytics is an all-encompassing term. It refers to a variety of advanced techniques and tools that teams employ to extract additional value from their data. By utilizing advanced marketing analytics, you’ll be able to predict patterns and generate accurate behavioral forecasts of your target audience and customers.
In short, advanced marketing analytics increases the value of campaigns for marketers, optimize ROI, and scale growth and pipeline.
Various types of analytics constitute advanced marketing analytics:
Regression Analytics: Regression Analytics examines the links between a dependent variable and an independent variable. This is an excellent technique for identifying trends in data, as the associations discovered in your sample will also exist in the larger population.
Predictive Analytics: Predictive analytics is a crucial component of advanced analytics, as it enables the discovery of solutions to unanswered questions. This sort of analysis employs numerous techniques from other data processes (such as data mining, AI, machine learning, and modeling) to do a comprehensive study of available data in order to make a future forecast.
Prescriptive Analytics: Business analytics culminates in prescriptive analytics. This is the method of finding the greatest potential outcome by employing technology to examine raw data and make judgments based on existing descriptive and predictive analytics.
A few limitations with basic B2B marketing analytics
In some instances, analytics may misinterpret data, leading to ill-informed decisions. This section discusses the limitations that marketing analytics can present to an organization. A few limitations are listed below:
Misidentification of marketing needs: Basic marketing analytics methods can sometimes overestimate or underestimate the market’s needs and behaviors: what do customers want, how well are competitors performing, what messaging resonates most with the audience. This, in turn, may mislead your team into making suboptimal decisions around marketing strategy.
Evaluating marketing growth in the absence of a market share: Analyzing the market should provide an idea of your potential opportunities. However, this analysis may not always be comprehensive, leading to missed opportunities that may have otherwise seemed obvious. So, in order to be sure of your data, a comprehensive market share analysis is suggested to provide sufficient context.
Improper Data Interpretation: Collecting data from multiple sources aids in data analysis, but data interpretation is an entirely separate process. If anything, interpreting data requires significantly more effort — and failing to allocate adequate resources towards this step will likely result in inaccurate conclusions.
This is where advanced marketing analytics comes into play. By utilizing advanced methods, B2B teams can help themselves achieve improved operational efficiency, increased customer satisfaction, scalable revenue, and optimized ROI.
Normalizing data prior to analysis
Before engaging in advanced analytics, the wisest investment is to thoroughly prepare the foundations of your data. Ensure that fundamental reporting requirements are met through a robust automated data and reporting pipeline, which will liberate resources, eliminate human error, and enhance data quality.
The quantity & variety of data also have an important influence. The majority of advanced analytics approaches perform substantially better with bigger volumes of granular data acquired from several sources. Remember that the results of your deployments of advanced analytics will only be as good as the data you supply.
{{INLINE_TOFU}}
An overview of advanced marketing analytics techniques
#1 Customer Lifetime Value
It can be an expensive error to direct marketing efforts towards the incorrect audience. Using the aforementioned conversion prediction methods, marketers can generate a list of people that are likely to convert into customers, but how do you identify the most valuable leads out of this set?
Despite their initial satisfaction, a huge number of customers never come back to a business again. A possible churn awaits those who do so. Only a small percentage of customers will remain loyal over the long term, and even fewer will go on to become true brand advocates. This underrepresented group is the most important. Especially in B2B SaaS, the Pareto principle (80/20 rule) almost always holds true: 20% of consumers generate 80% of value.
Customer lifetime value (CLV) estimates a client's future earnings using a sample of their past purchases. With this information in hand, marketers may cut costs on clients who aren't lucrative, strengthen their focus on channels that bring in similar, paying consumers, and work to reawaken the interest of previously inactive customers.
How can Factors help with CLV?
Using Timelines, Factors can generate user and account level timelines of the entire customer journey from first touch to deal won. This is especially useful to B2B SaaS organizations wherein sales cycles involve several stakeholders from the same account. The ability to visualize every touch-point based on account, roles, etc offers granular insight into what’s working for whom and in which account.
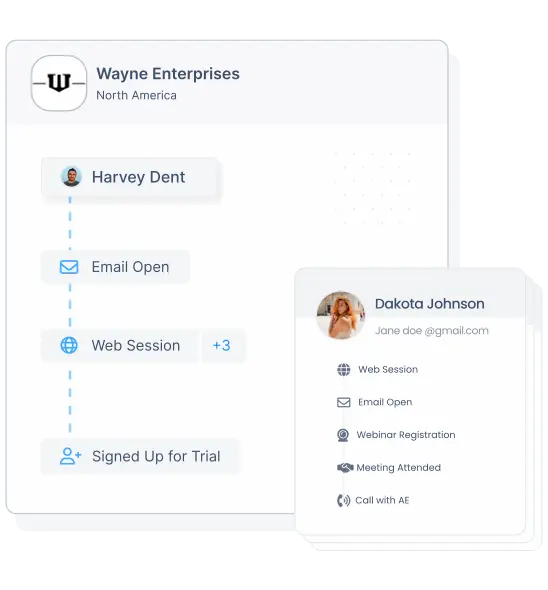
#2 Marketing Attribution
How efficient are your methods for analyzing the efficacy of marketing campaigns? How much should you be investing in each advertisement? What channels should you cut to drive ROI? These are fundamental inquiries that any successful marketing strategy must address. Due to the increasingly complex, nonlinear nature of customer journeys, marketing attribution is increasingly gaining relevance.
There are a number of ways to implement a marketing attribution strategy, and some of them entail very basic business standards, like giving all of the credit for a conversion to the very first or very last click. There are other others, though, that demand more intricate mathematical and probabilistic methods. Multi-channel attribution makes sense for firms that operate in a digital environment and analyze engagement metrics like clicks, conversions, and click pathways. Marketing Mix Modeling is a supplementary method utilized by businesses that employ conventional marketing channels (MMM). It utilizes what-if scenarios and is based on regression analysis, a well-studied statistical method. What would happen, for instance, to income if spending on television were to rise by x percent? If you already know the answers to these questions, you can use them to better allocate resources for future initiatives.
Marketing Attribution on Factors
As previously mentioned, marketing attribution is the analytical science of determining which marketing tactics are contributing to sales or conversions. Attribution models give marketers insights into how marketing dollars are best spent by showing touch points that earn the most engagements. Factors delivers a robust marketing attribution suite with a wide range of multi-touch attribution models. Want to learn more? Find a good time here.
#3 Clustering
Clustering is a valuable tool for B2B marketers. The goal is help marketers divide their target audiences into manageable subsets. This allows for better targeted content, campaigns, and offers. It is possible to generate several types or clusters of customers using heuristic rules: "Show content of type A if the customer is a millennial; show content of type B if they are gen Z."
With today’s abundence of and accessibility to large volumes of data, clustering has evolved into an effective technique to categorize a large number of clients based on any number of features or properties. These clusters emerge as a result of a statistical analysis of data using a measure of the mathematical distancing between various attributes. Customers with comparable ratings will be placed together.
Age, income, spend, duration of time since last purchase, etc. are all examples of features that can be used to segment customers. Similar success can be achieved when clustering keywords according to metrics such as organic ranking, competition level, and opportunity score. Product ads, marketing campaigns, advertisement groups, and so on can also be grouped together.
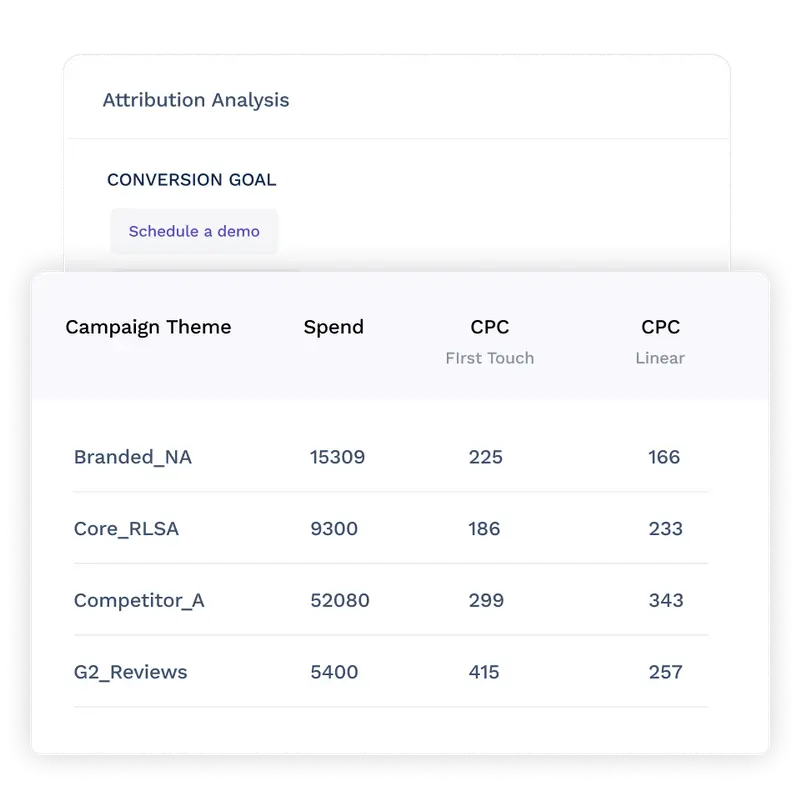
#4 Conversion prediction
Conversion prediction is not a straightforward operation because conversion rates are often in the single digits. It’s comparable to looking for a needle in a haystack. To increase your chances of success, you'll need a wealth of user behavior data from the past. Early behaviors connected to future conversion milestones can be determined based on this historical data.
Once you have identified people whose actions indicate a high possibility of conversion, you may prioritize and target them appropriately. In addition, this method is effective in identifying factors with the greatest impact on conversion. Depending on the site and its users, it may include a combination of industry, role, location, device kind, or any other combination of relevant dimensions.
How does Factors help with conversion prediction and optimization?
As the name suggests, Factors.ai is built upon an AI-powered analytics engine. Our proprietary ML algorithms empower markets to generate actionable insights from their data in a matter of seconds using AI-fueled Explain and Weekly insights. Curious to see our work in action? Find a good time here!
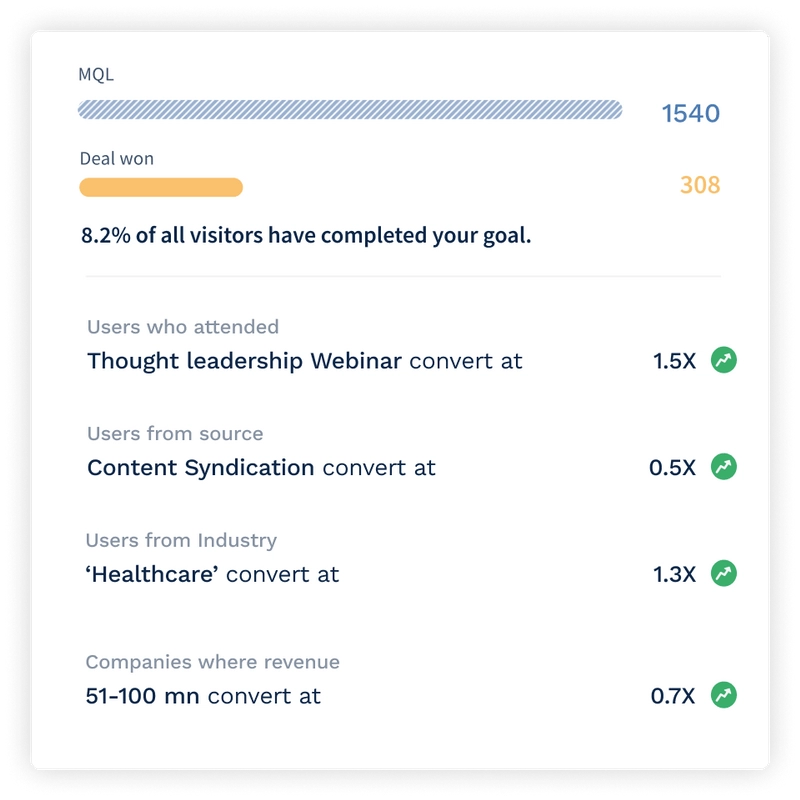
#5 Anomaly detection
The B2B SaaS marketing industry is rapidly evolving into a data-driven operation that involves near-real time iterations to campaigns and strategies. Naturally, this relies on a large, up-to-date volumes of data. Ad groups and keywords in display and search campaigns, for example, can be rather large and take part in hundreds of daily programmatic auctions; they also have their own unique conversion rates, budgets, returns on investment, and so on. That is,a vast variety of figures and metrics that constantly fluctuate.
Generally, the fluctuations stay within the range of naturally occurring variances, but exceptions may be found. As a marketer, one must stay vigilant so as to quickly respond with appropriate actions and reactions.
Anomaly detection makes use of statistical analysis and automated decision making to notify marketers when critical KPIs such as conversion rate, revenue, and traffic depart too greatly from the norm. This method treats data as a statistical time series, allowing it to automatically detect seasonal and weekly patterns while simultaneously avoiding false positives. This allows for quick identification of data outliers and under or over performing efforts.
How does Factors help with Anomaly detection?
Factors provides robust, customizable KPI reporting functionality. Set your parameters and sit back as Factors automatically alerts you through Slack and Email notifications when your KPIs extend past your preconfigured range. Furthermore, unlock insights into which marketing efforts are performing, and which ones aren't. Attribution and Explain on Factors may also be used to detect the anomalies across keywords, firmographics, channels, campaigns and more
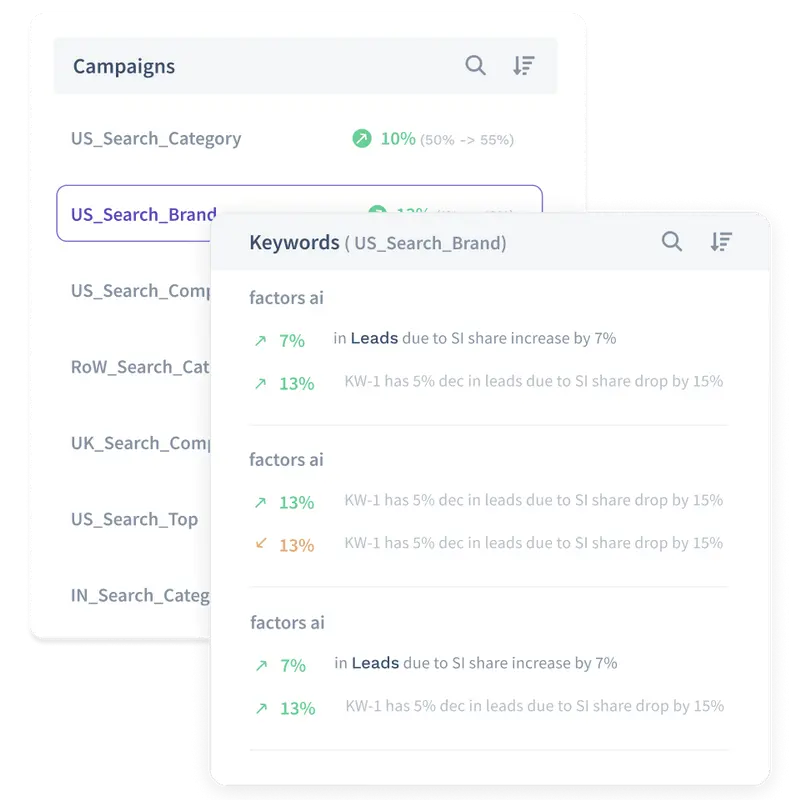
#6 Forecasting
Forecasting is everywhere: financial markets, economic indices, corporate sales, etc. So, it's no surprise that this technique can also forecast online traffic, conversion, revenue, and other metrics marketers care about. Similar to anomaly detection, forecasting uses historical data to predict trends. This, however, is not always possible and, as a result, forecasts will likely be inaccurate — at least to a certain degree.
In order to make interpretation of predicted results more flexible, forecasting techniques provide bands within which forecasted data can range with given probabilities. If uncertainty is properly accounted for, forecasting can be used as a technique to help you better adjust your future campaigns and targets.
How to implement advanced marketing analytics techniques?
Marketing teams can benefit from advanced marketing analytics throughout the entire marketing process. Advanced marketing analytics helps firms automate and optimize their marketing efforts one step past conventional marketing analytics.
Gathering data from a larger variety of sources, not simply social media outlets, is an important part of deploying this type of analytics. More diverse data sets require more precise analysis if you want to get the most out of your data and make better decisions. There isn't a single business that has access to every piece of information it would need to make well-informed choices. Instead, firms should broaden their data collection to gain a deeper understanding of their field as a whole.
Try to supplement your data with that of larger external data providers. As a result, you can more precisely grow your business and build more insightful models. You should also see data with a more prospective eye. It's conceivable that marketing and analytics models used in the past won't be useful for planning future efforts. Finding new connections between online and offline market aspects and impacts is more important than using past data. An analytics model that aids in taking more consequential choices requires a more in-depth examination of client behavior.
Top-down data analysis is also crucial. By looking at the market as a whole, we may more easily identify a broader range of decision points from which to draw more predictive data. To get the most out of advanced analytics, granularity is essential.
The usefulness of data models can be increased by including the knowledge and experience of more people. The teams responsible for creating data models should include a wide variety of specialists. Data models that are both accurate and useful in practice benefit from the input of experts from a variety of disciplines.
Large amounts of different data are ideal for advanced marketing analytics strategies. This is why before implementing a new analytics model, a company should thoroughly cleanse its historical data and set up its infrastructure.
How Factors can help your business?
Automation of ordinary data processing and integration of contemporary software solutions into your workflow are always prerequisites for advanced marketing analytics. Manual data manipulation requires far too much time on mechanical activities rather than focusing on the analysis itself. Furthermore, manual processing exposes the granularity of your findings to human error.
Factors assists businesses in automating marketing data processing and gathering advanced marketing analytics insights without the need for repetitive activities. The tool unifies data from a huge number of marketing data sources, standardizes insights, and loads them into a single warehouse. Marketers can then quickly transfer data to Factors’ dedicated dashboards to create sophisticated charts and graphs. With numerous pre-designed and customizable dashboard templates at your disposal, you will gain a fresh perspective on your marketing activities and efficiently optimize your marketing ROI.
Advanced Marketing Analytics Techniques
Advanced marketing analytics enables marketers to extract deeper insights, optimize campaigns, and drive business growth.
- Key Methodologies: Regression analysis, predictive analytics, and prescriptive analytics.
- Core Functions: Identify trends, forecast customer behavior, and provide data-driven recommendations.
- Implementation Factors: Requires data normalization for accuracy and consistency.
Leveraging advanced analytics empowers marketers to enhance ROI, make informed decisions, and scale business growth effectively.
FAQs
What is advanced marketing analytics?
Advanced marketing analytics refers to a detailed examination of various marketing data utilized to show new customer behavior patterns, market trends, campaign performance concerns, and other significant insights.
Why is advanced marketing analytics important?
A company can find new markets for their products, expand their customer base, and increase revenue with the help of advanced sales and marketing analytics. Monitoring the success of marketing campaigns is essential for their continued success. Using advanced marketing analytics methods will help you fine-tune your campaigns and spend where it counts.
How does data analytics help in marketing?
With the help of data analytics, marketers can glean actionable insights into their data's performance. This data is useful for determining the channels used by customers and prospects, as well as the most profitable campaigns.
How Does Advanced Marketing Analytics Help CMOs?
The use of advanced marketing analytics allows businesses to make more informed predictions about the future and to spot emerging trends earlier. More reliable insights can be obtained from a larger pool of high-quality data with the help of this type of analytics. A CMO will have access to more actionable data, which should lead to more effective campaigns.

We don’t just write about demand gen. We deliver it.
Our AI Agents help you uncover high-intent accounts, run campaigns that actually convert, and keep your GTM motion in sync.
1000+ GTM teams have already scaled their pipeline with Factors.
*Includes built-in peace of mind. And fewer late-night funnel audits.

.svg)



.avif)

